chapter 6 financial strategy mcgraw-hill/irwin copyright © 2009 by the mcgraw-hill companies, inc....
Post on 22-Dec-2015
222 views
TRANSCRIPT
Chapter 6
Financial Strategy
McGraw-Hill/Irwin Copyright © 2009 by The McGraw-Hill Companies, Inc. All rights reserved.

6-2
Strategic Profit Model:Financial Tradeoff Made by Retailers to Increase ROI
Asset Turnover
Net Profit Margin
Outlines Tradeoff BetweenMargin ManagementAsset (Inventory Management)

6-3
Components of the Strategic Profit Model
6-4
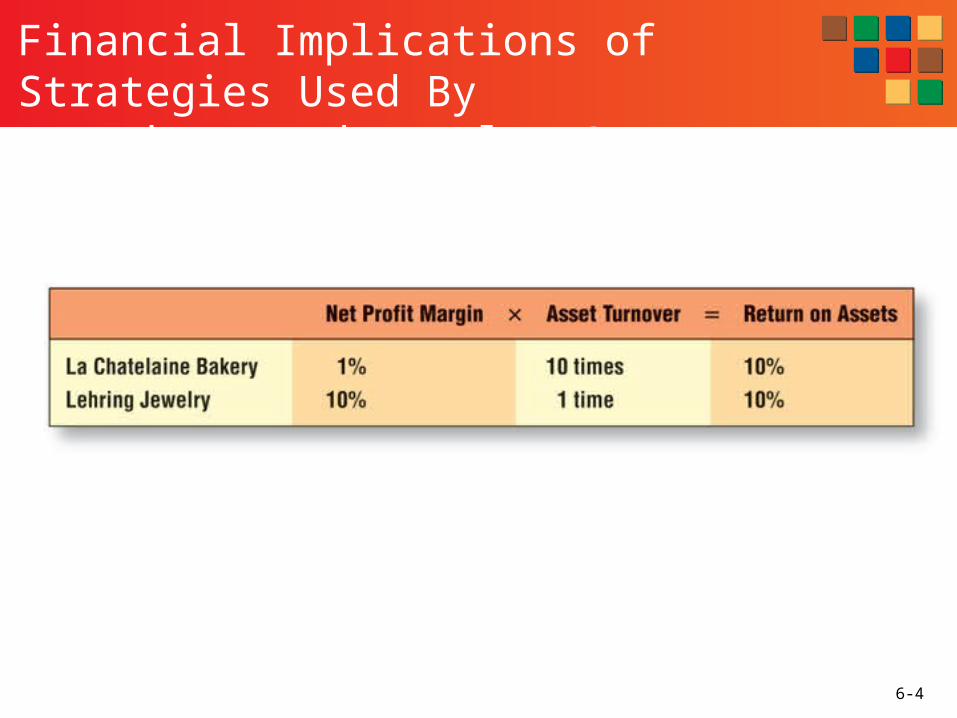
Financial Implications of Strategies Used By a Bakery and Jewelry Store
6-5
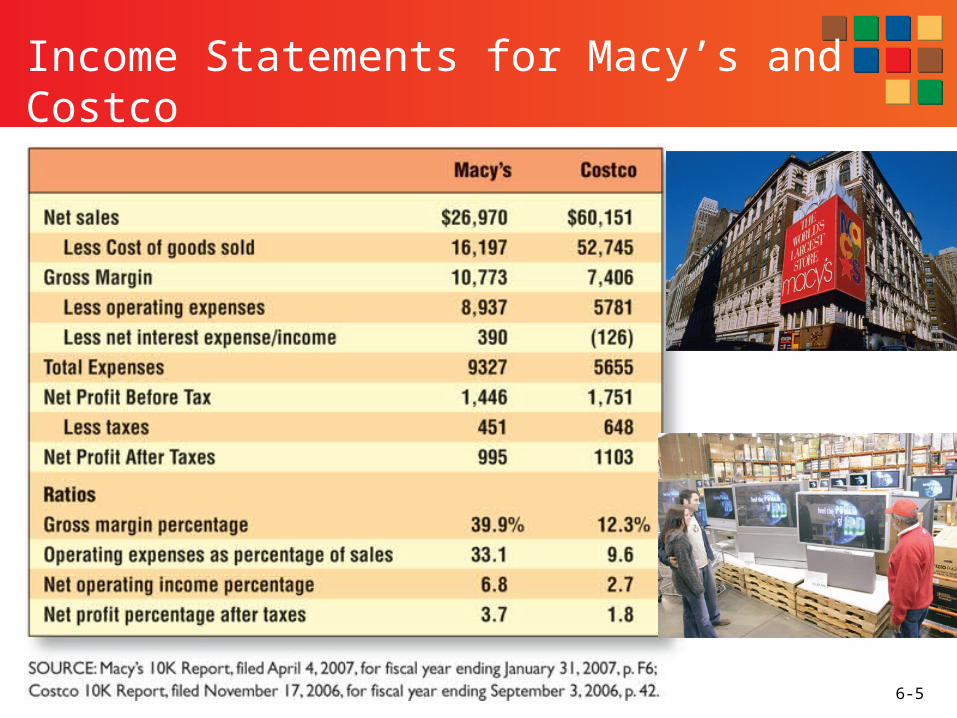
Income Statements for Macy’s and Costco
6-6
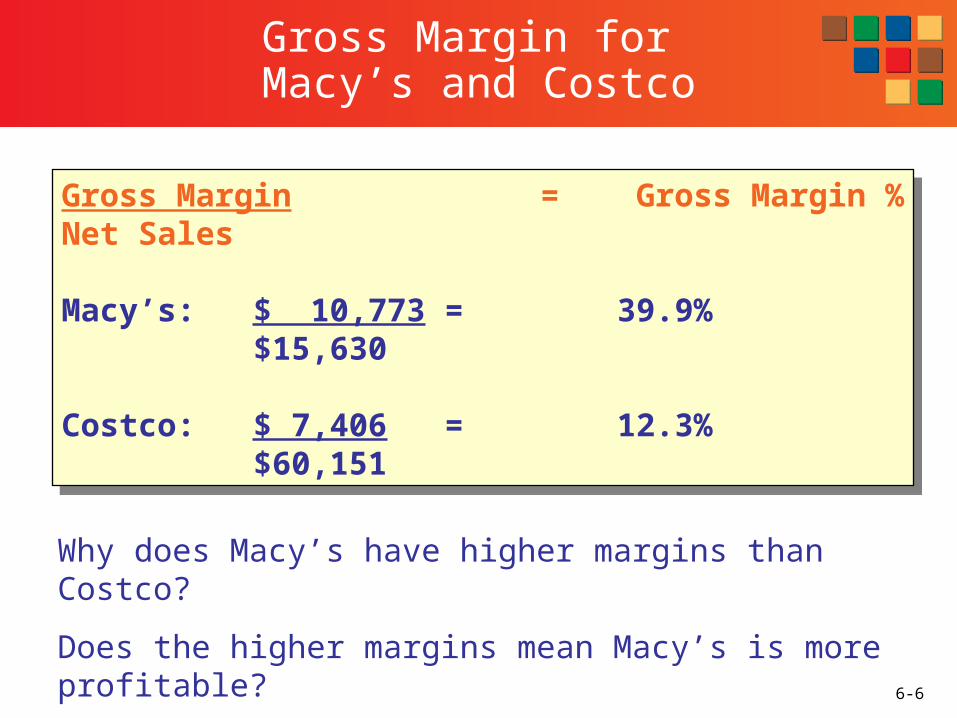
Gross Margin for Macy’s and Costco
Gross Margin = Gross Margin %Net Sales
Macy’s: $ 10,773 = 39.9%$15,630
Costco: $ 7,406 = 12.3%$60,151
Gross Margin = Gross Margin %Net Sales
Macy’s: $ 10,773 = 39.9%$15,630
Costco: $ 7,406 = 12.3%$60,151
Why does Macy’s have higher margins than Costco?
Does the higher margins mean Macy’s is more profitable?
6-7
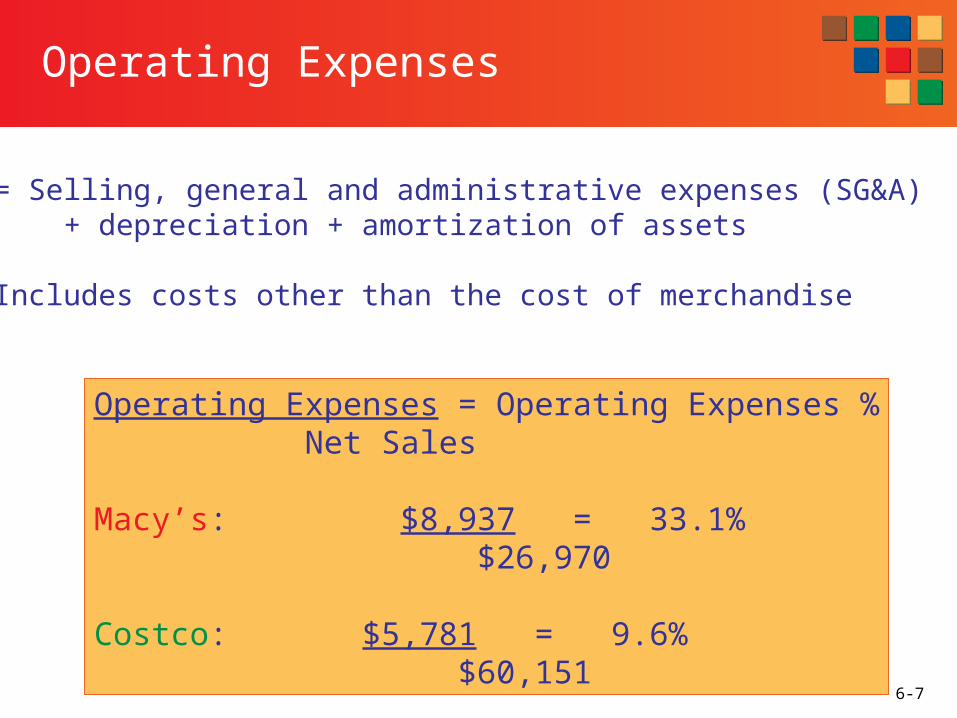
Operating Expenses
Operating Expenses = Operating Expenses % Net Sales
Macy’s: $8,937 = 33.1% $26,970
Costco: $5,781 = 9.6% $60,151
= Selling, general and administrative expenses (SG&A) + depreciation + amortization of assets
Includes costs other than the cost of merchandise

6-8
Types of Retail Operating Expenses
Selling expenses = Sales staff salaries + Commissions + Benefits
General expenses = Rent + Utilities + Miscellaneous expenses
Administrative expenses = Salaries of all employees other than salespeople + Operations of buying
offices + Other administrative expenses

6-9
Net Operating Income
■ Before interest expenses/income, taxes, and extraordinary expenses
■ A commonly used overall profit measure due to the lack of control over taxes, interest, and extraordinary expenses
■ Allows for a comparison of financial performance across companies or divisions within companies
Gross Margin – Operating Expenses = Net Operating Income % Net Sales
Macy’s: $10,773 – 8,937 = 6.81% $26,970
Costco: $7,406 - $5,781 = 2.70% $60,151

6-10
Asset Information from Macy’s and Costco’s Balance Sheet
6-11
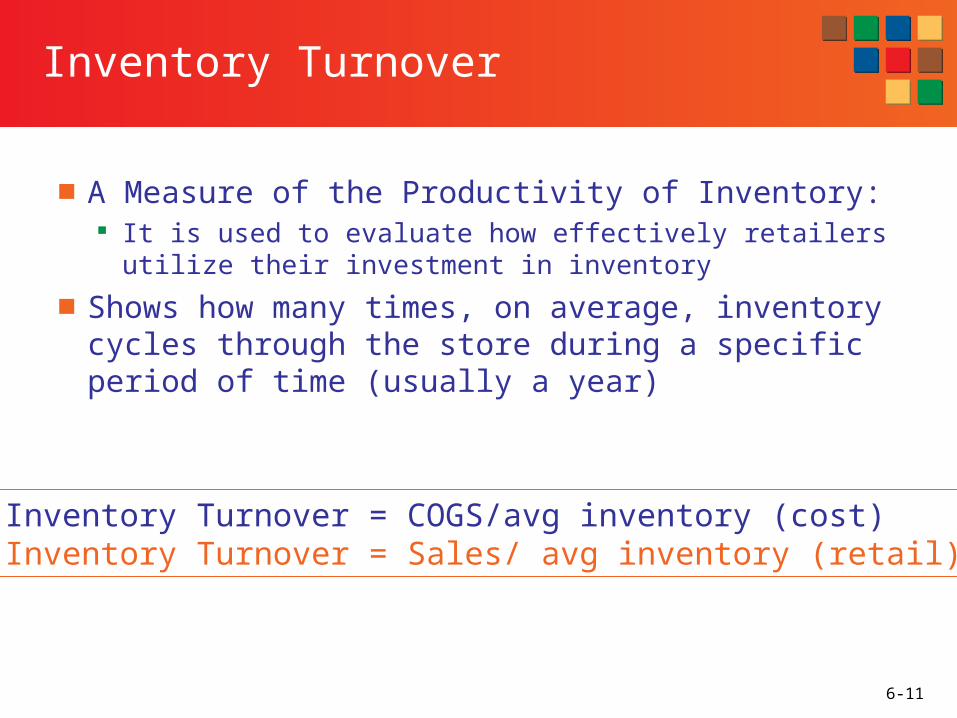
Inventory Turnover
■ A Measure of the Productivity of Inventory: It is used to evaluate how effectively retailers utilize
their investment in inventory
■ Shows how many times, on average, inventory cycles through the store during a specific period of time (usually a year)
Inventory Turnover = COGS/avg inventory (cost)Inventory Turnover = Sales/ avg inventory (retail)

6-12
Importance of stock turnover rate
■ Inventory turnover rate differs by Industry Product categories
■ Most retailers that are having problems achieving adequate profits have a poor Inventory Turnover Rate.
Example: Kmart vs. Wal-mart

6-13
Inventory Turnover
Cost of Goods = Inventory TurnoverAverage inventory
Macy’s: $16,197 = 3.04 $5,317
Costco: $52,746 = 11.54 $4,569

6-14
Importance of Inventory turnover
■ Inventory turnover rate differs by Industry Product categories
■ How do retailers increase Inventory Turnover? Increase Sales Decrease Inventory
• Decrease delivery lead-time• Drive waist out
■ It’s important to have an efficient turnover rate: not so slow that things seem stale and shopworn, yet not so fast that the floor looks half-empty.

6-15
Asset Turnover
Net Sales = Asset TurnoverTotal Assets
Macy’s: $26,970 = 0.91 $29,550
Costco: $60,151 = 3.44 $17,494

6-16
Return on Assets
Net Profit Margin x Asset Turnover = Return on Assets
Macy’s: 3.70% x 0.95 = 3.37%Costco: 1.80% x 3.44 = 6.19%
Return on Assets is a very important performance measure because it shows how
much money the retailer is making on its investment

6-17
Evaluation of Financial Path:Macy’s and Costco
Macy’s Costco
Higher net profit margin Higher asset turnover
■ Retailers (and investors) need to consider both net profit margin and asset turnover when evaluating their
financial performance the implications of strategic decisions on both components of the
strategic fit model• EX: Increasing prices => gross margin, net profit margin
sales, asset turnover

6-18
Profit Margin Management Path:Gross Margin Percent
Gross Margin = Gross Margin Percent Net Sales
Stores: $350,000 = 50% $700,000
Gifts-to-Go.com $220,000 = 50% $440,000
6-19
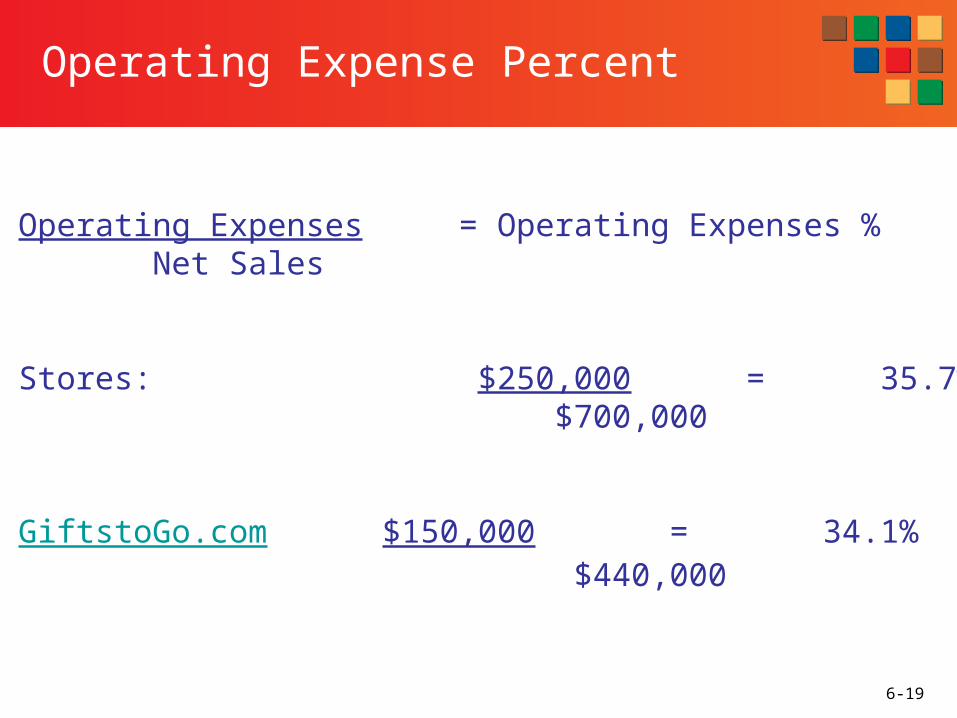
Operating Expense Percent
Operating Expenses = Operating Expenses % Net Sales
Stores: $250,000 = 35.7% $700,000
GiftstoGo.com $150,000 = 34.1% $440,000

6-20
Net Profit Percentage
Net Profit = Net Profit PercentageNet Sales
Stores: $ 59,800 = 8.5% $700,000
Gifts-to-Go.com: $ 45,500 = 10.3% $440,000

6-21
Asset Turnover Management Path:Inventory Turnover
Cost of Goods = Inventory TurnoverAverage Inventory
Stores: $350,000 = 2.0 $175,000
Gifts-to-Go.com: $220,000 = 3.1 $70,000

6-22
Asset Turnover
Net Sales = Asset TurnoverTotal Assets
Stores: $700,000 = 1.84 $380,000
Gifts-to-Go.com: $440,000 = 2.09 $211,000
6-23
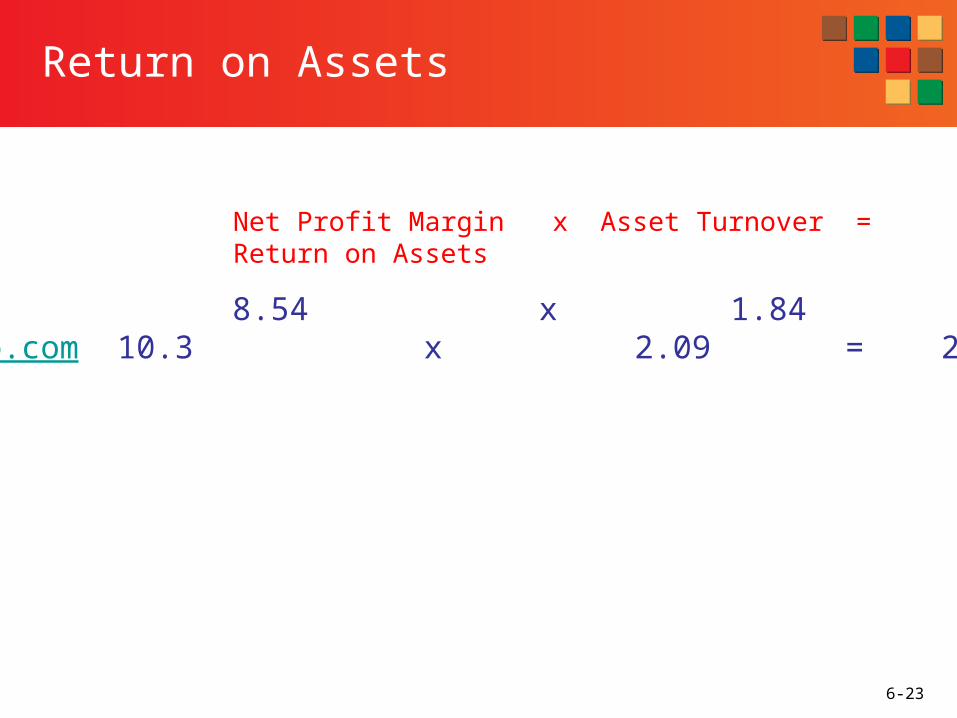
Return on Assets
Net Profit Margin x Asset Turnover = Return on Assets
Stores: 8.54 x 1.84 = 15.7%Gifts-to-Go.com 10.3 x 2.09 = 21.3%

6-24
Profit Management
Asset Management
The Strategic Profit Model
Net Sales
Cost of goods sold
Variable expenses
Fixed expenses
Gross margin
Total expenses
Net profit
Net Sales
Net profit margin
Asset turnover
Return on assets
-
-
+
Inventory
Accounts receivable
Other current assets
Total current assets
Fixed assets
Net sales
Total assets
+
+ +
x

6-25
Setting and Measuring Performance Objectives
Retailers will be better able to gauge performance if it has specific objectives in mind to compare performance.
Should include:• numerical index of performance desired• time frame for performance• necessary resources to achieve objectives
6-26
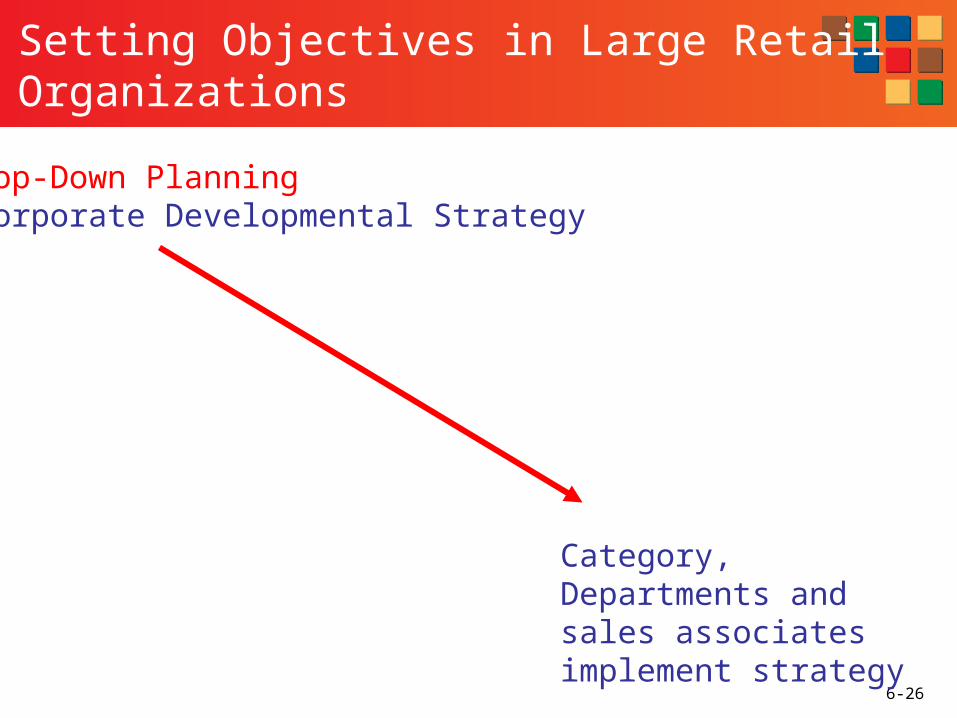
Setting Objectives in Large Retail Organizations
Top-Down PlanningCorporate Developmental Strategy
Category, Departments and sales associates implement strategy
6-27
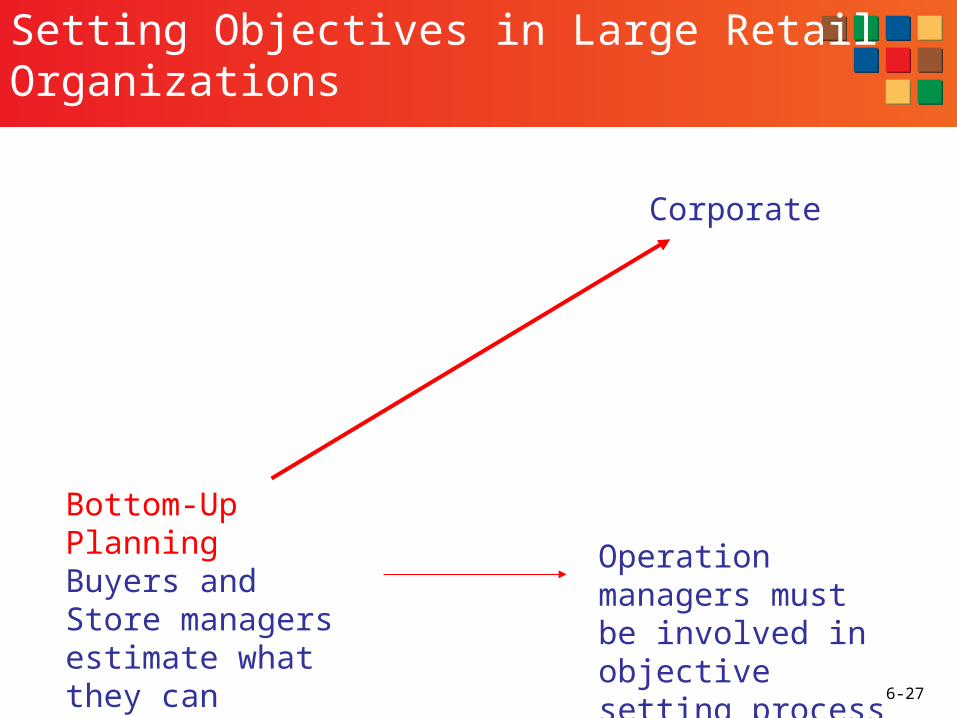
Setting Objectives in Large Retail Organizations
Bottom-Up PlanningBuyers and Store managers estimate what they can achieve
Corporate
Operation managers must be involved in objective setting process

6-28
Productivity Measures
Input Measures – assess the amount of resources or money used by the retailer to achieve outputs such as sales
Output measures – asses the results of a retailer’s investment decisions
Productivity measure – determines how effectively retailers use their resource – what return (e.g., profits) they get on their investments (e.g., expenses)

6-29
Financial Performance of Retailers
Outputs – Performance
■ Sales■ Profits■ Cash flow■ Growth in sales, profits■ Same store sales
growth
Inputs Used by Retailers
■ Inventory ($)■ Real Estate (sq. ft.)■ Employees (#)■ Overhead (Corporate
Staff and Expenses)■ Advertising■ Energy Costs■ MIS expenses
6-30
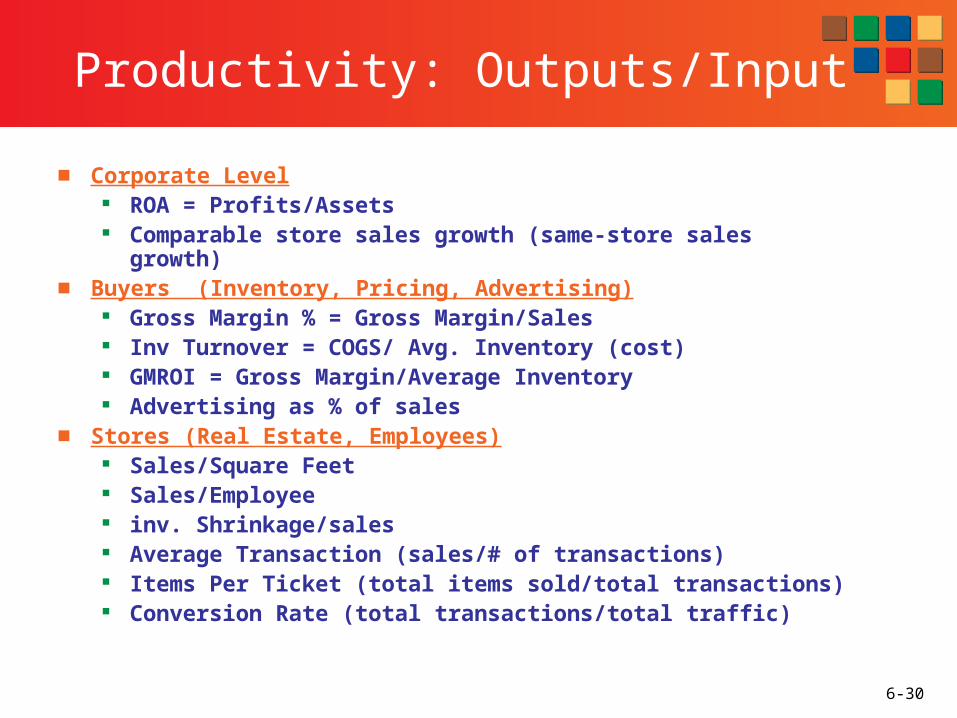
Productivity: Outputs/Input
■ Corporate Level ROA = Profits/Assets Comparable store sales growth (same-store sales growth)
■ Buyers (Inventory, Pricing, Advertising) Gross Margin % = Gross Margin/Sales Inv Turnover = COGS/ Avg. Inventory (cost) GMROI = Gross Margin/Average Inventory Advertising as % of sales
■ Stores (Real Estate, Employees) Sales/Square Feet Sales/Employee inv. Shrinkage/sales Average Transaction (sales/# of transactions) Items Per Ticket (total items sold/total transactions) Conversion Rate (total transactions/total traffic)

6-31
Examples of Performance Measures Used by Retailers
6-32
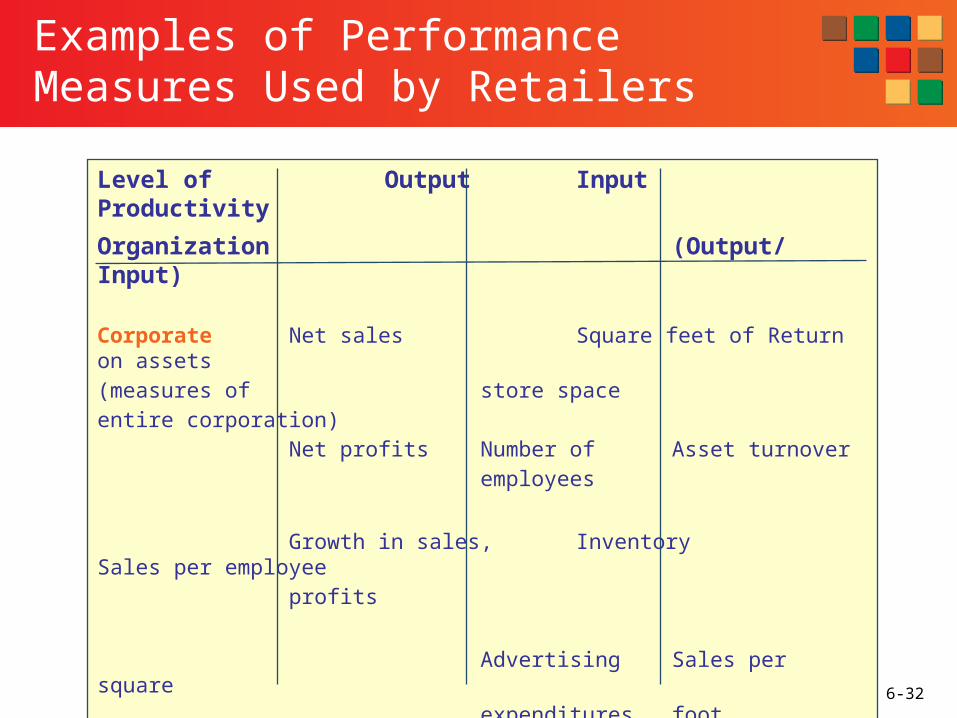
Examples of Performance Measures Used by Retailers
Level of Output Input Productivity
Organization (Output/Input)
Corporate Net sales Square feet of Return on assets(measures of store spaceentire corporation)
Net profits Number of Asset turnoveremployees
Growth in sales, Inventory Sales per employeeprofits
Advertising Sales per squareexpenditures foot
6-33
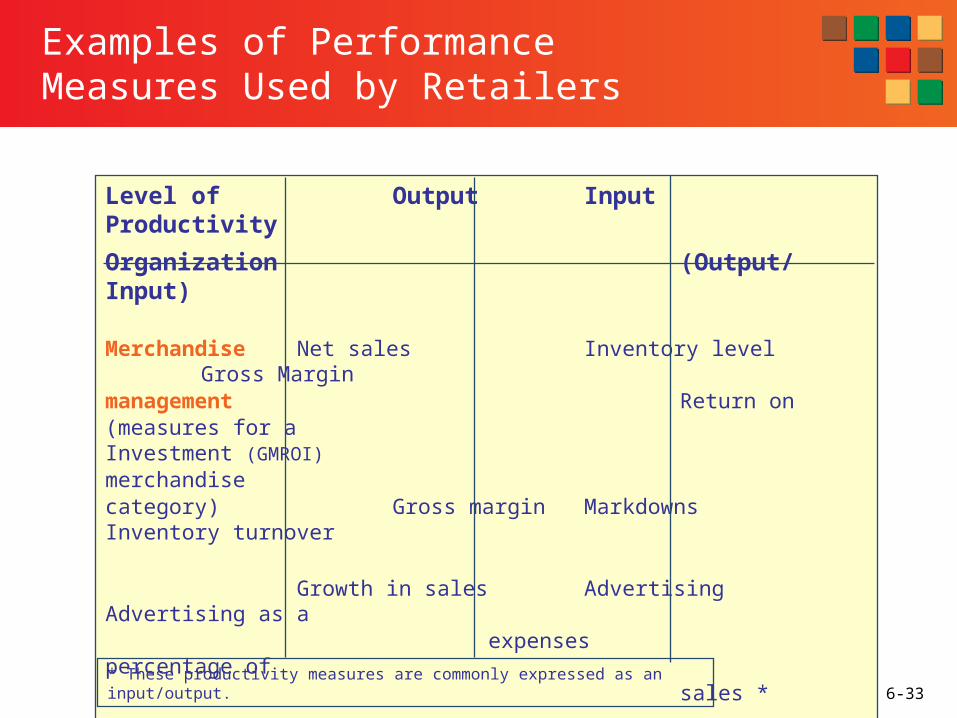
Examples of Performance Measures Used by Retailers
Level of Output Input Productivity
Organization (Output/Input)
Merchandise Net sales Inventory level Gross Margin management Return on(measures for a Investment (GMROI)
merchandisecategory) Gross margin Markdowns Inventory turnover
Growth in sales Advertising Advertising as aexpenses percentage of
sales *
Cost of Markdown as amerchandise percentage of
sales*
* These productivity measures are commonly expressed as an input/output.
6-34
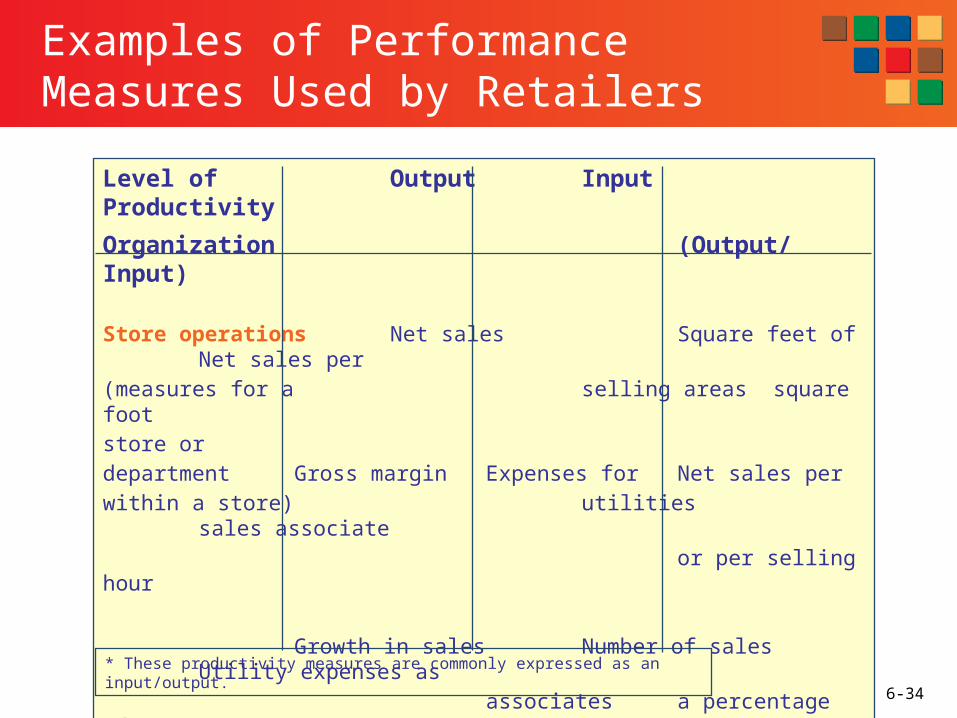
Examples of Performance Measures Used by Retailers
Level of Output Input Productivity
Organization (Output/Input)
Store operations Net sales Square feet of Net sales per(measures for a selling areas square footstore or department Gross margin Expenses for Net sales perwithin a store) utilities sales associate
or per selling hour
Growth in sales Number of sales Utility expenses asassociates a percentage of
sales *
* These productivity measures are commonly expressed as an input/output.

6-35
Illustrative Productivity Measures Used by Retailing Organizations
Level of Output Input Productivity
Organization (Output/Input)
Corporate Net profit Owners’ equity Net profit /(chief executive owners’ equity =officer) return on owners’
equity
Merchandising Gross margin Inventory * Gross margin /(merchandise inventory* = manager and GMROIbuyer)
Store operations Net sales Square foot Net sales /(director of stores, square footstore manager)
*Inventory = Average inventory at cost
6-36
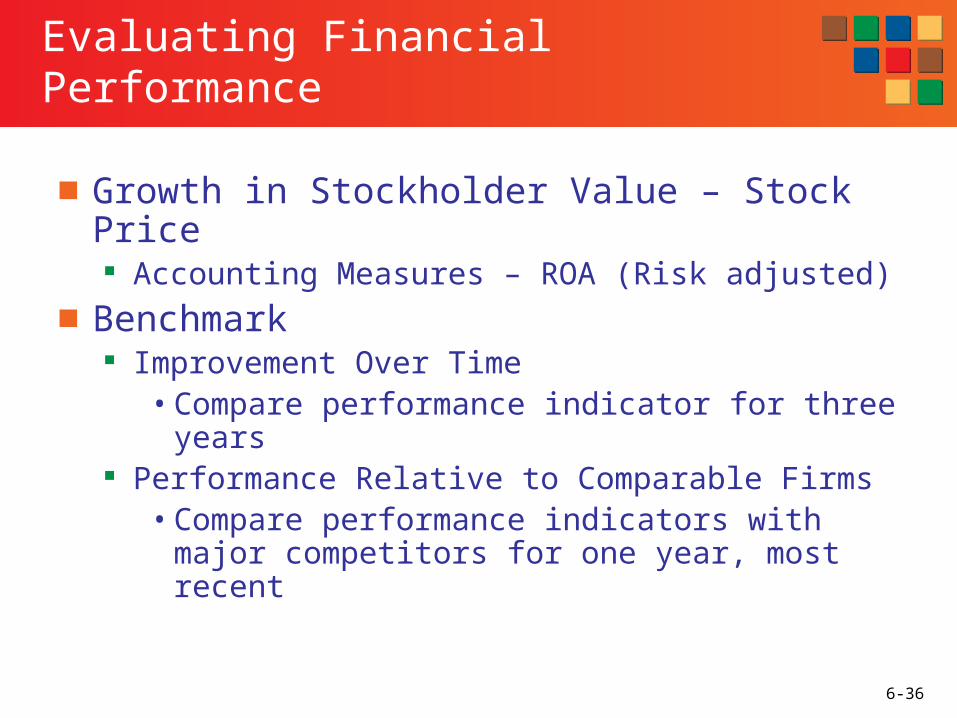
Evaluating Financial Performance
■ Growth in Stockholder Value – Stock Price Accounting Measures – ROA (Risk adjusted)
■ Benchmark Improvement Over Time
• Compare performance indicator for three years Performance Relative to Comparable Firms
• Compare performance indicators with major competitors for one year, most recent

6-37
Sources of Information
■ Balance Sheet (Snap Shot at One Time) Asset Management
■ Income Statement (Summary Over Time) Margin Management
■ Annual Reports/ SEC Filings http://www.sec.gov/edgar/searchedgar/companysearc
h.html

6-38
Macy’s and Costco’s Financial Performance Over Three Years

6-39
Financial Performance of Macy’s and Other National Department Store Chains
6-40
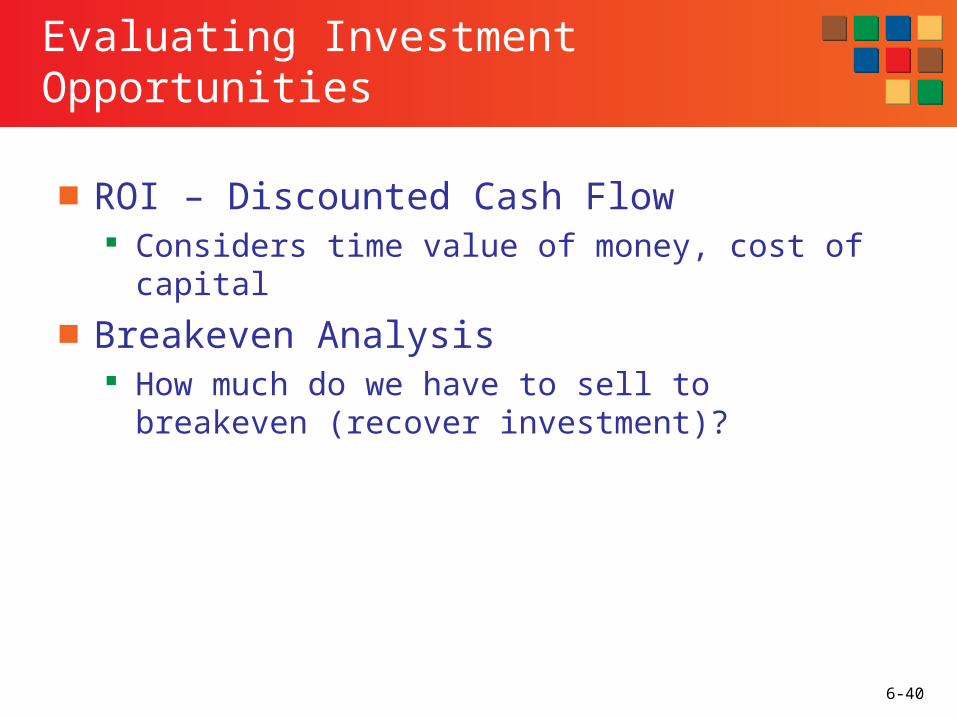
Evaluating Investment Opportunities
■ ROI – Discounted Cash Flow Considers time value of money, cost of capital
■ Breakeven Analysis How much do we have to sell to breakeven (recover
investment)?
6-41
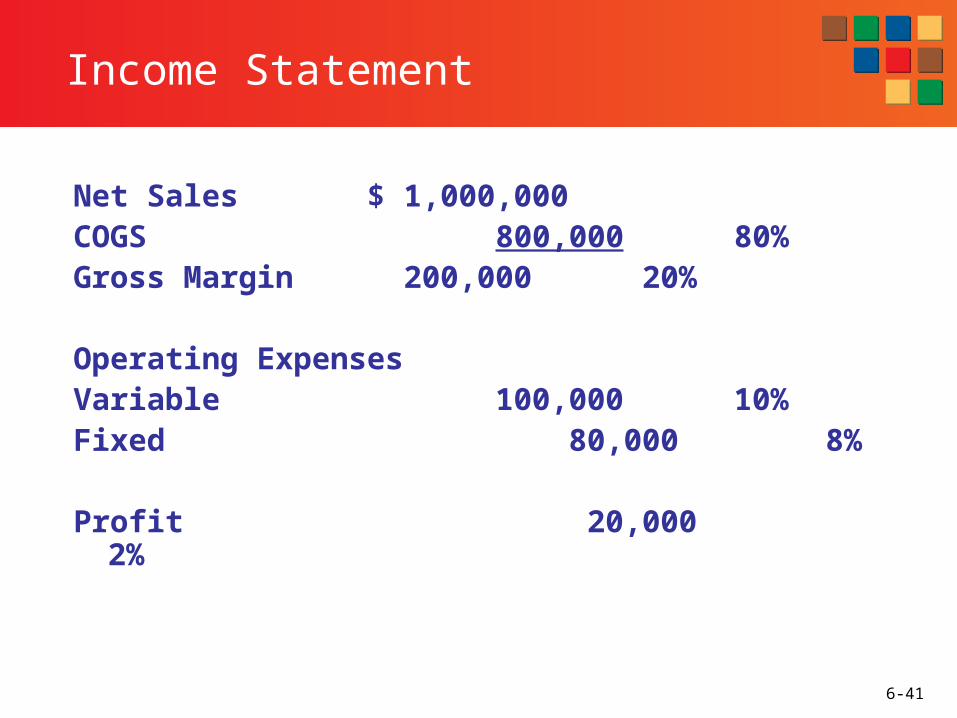
Income Statement
Net Sales $ 1,000,000COGS 800,000 80%Gross Margin 200,000 20%
Operating ExpensesVariable 100,000 10%Fixed 80,000 8%
Profit 20,000 2%

6-42
Variable and Fixed Operating Expenses
Variable FixedWages & Salaries
Manager 20,000 20,000Salespeople 60,000 20,000Clerical 20,000 10,000
Rent 20,000
Maintenance 10,000Total 100,000 80,000

6-43
Break Even Analysis
Profit = Sales - COGS-Var Cost - Fixed Cost
0 = Sales - COGs% x Sales - VC% x Sales - FC
Break-even Sales x (1-COGS% -VC%) = FC
Break-even Sales = FC/(1-COGS% -VC%)
Break-even Sales = FC/(GM%-VC%)
= $80,000/(.2-.1)
= $800,000
6-44
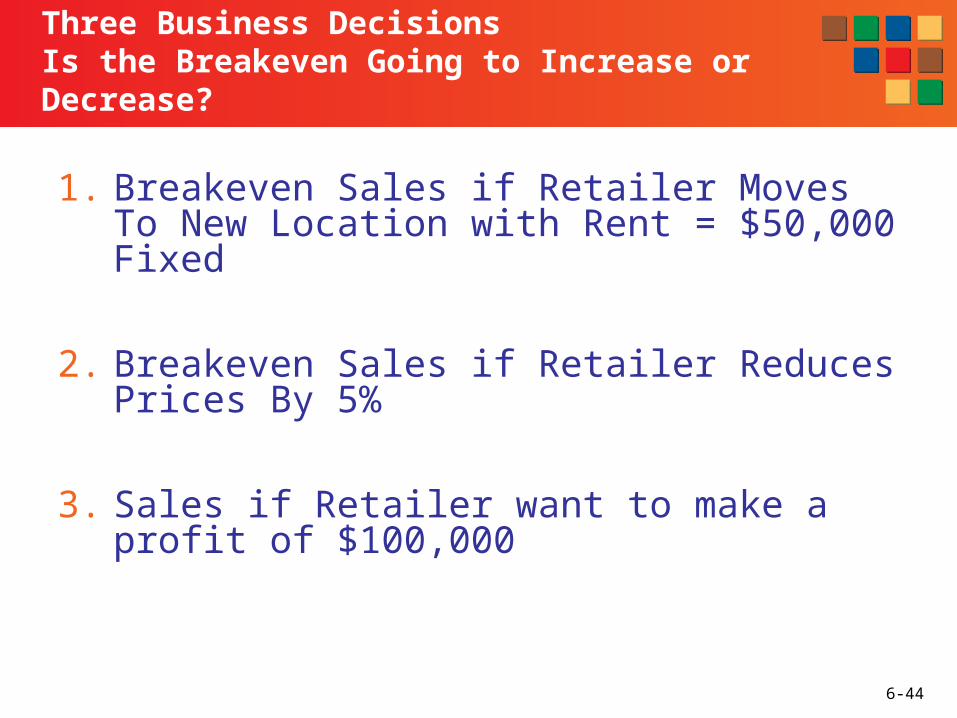
Three Business DecisionsIs the Breakeven Going to Increase or Decrease?
1. Breakeven Sales if Retailer Moves To New Location with Rent = $50,000 Fixed
2. Breakeven Sales if Retailer Reduces Prices By 5%
3. Sales if Retailer want to make a profit of $100,000

6-45
Break-even Sales = FC/(GM%-VC%)
Breakeven Sales if Retailer Moves To New Location with Rent = $50,000 Fixed
=(60,000+50,000)/(.2-.1) = $1,100,000
Breakeven Sales if Retailer Reduces Prices By 5%
Sales if Retailer want to make a profit of $100,000

6-46
Break-even Sales = FC/(GM%-VC%)
■ Breakeven Sales if Retailer Moves To New Location with Rent = $50,000 Fixed
=(80,000+30,000)/(.2-.1) = $1,100,000
■ Breakeven Sales if Retailer Reduces Prices By 5%
= 80,000/(.15-.10) = 1,600,000
■ Sales if Retailer want to make a profit of $100,000
=(80,000+100,000)/(.2-.1) = 1,800,000