chapter 6: maternal and child health - north slope · pdf filechapter 6: maternal and child...
TRANSCRIPT
Chapter 6:Maternal and Child Health
“Indicators of maternal, infant, child, and adolescent health are among the most important worldwide indicators of health status and social well-being.”1 These measures typically reflect, more than the success or failure of medical care or technology, the underlying socioeconomic and environmental conditions of a community. Coordinated public health efforts and access to healthcare for women and children can, however, have substantial impact on maternal and child health. Many of the factors that affect adult health—smoking, alcohol or drug use, diet, utilization of preventive healthcare, as well as environmental and social conditions—have amplified effects on the developing fetuses, infants, and youth. Moreover, health and experiences in these critical early life stages can have lifelong effects and influence the health of families and communities for generations.

188|Part II: Full Report|Chapter 6: Maternal and Child Health
6.1. Maternal and Child Health Statistics 6.1.1. General Health Status of Children in the NSB 6.1.1.1. General Children’s Health Status Data from the 2010
NSB CensusIn the 2010 NSB Census, the vast majority of children in the NSB were reported to be in at least “good” gen-eral health. Children in the NSB were considerably less likely than Alaskan children overall to be reported to have “very good” or “excellent” general health, however.2,3 Within the NSB, reported general health status of Iñupiat children was significantly worse than that of Caucasian children and those in other ethnic groups.2
Figure 6.1: General Health Status of Children, by Ethnic Group: Percent of children (0–17 years) reported to have very good to excellent general health
!"#$%&'M)(*'0&1&%23'4&23.5'6.2.$7'-F'U5"3/%&1H'I@'C.51"E'0%-$,*'';&%E&1.'-F'E5"3/%&1'\t'(K'@&2%7]'%&,-%.&/'.-'52X&'X&%@'#--/'.-'&DE&33&1.'#&1&%23'5&23.5'
!
MN='
KJ='
B>='
M<='
KL='
869'ST$,"2.'U5"3/%&1' 869'U2$E27"21'U5"3/%&1'
869'U5"3/%&1'-F'V.5&%'C.51"E"W&7'
:33'869'U5"3/%&1'' :33':327Q21'U5"3/%&1'
nsB data source: 2010 nsB Census.
alaska data source: national survey of Children’s Health 2007.
Reported general health status among children varied widely across the North Slope communities. The percentage of children reported to have very good to excellent health ranged from 38% in Atqasuk to 70% in Point Lay. Among Iñupiat children, those living in Barrow were significantly more likely to be reported to have very good or excellent than were their counterparts in other North Slope villages as a whole (64% vs. 56%, respectively).2
Table 6.1: Reported General Health Status of Children (0–17 Years) in NSB Villages
AKP Atqasuk Barrow Kaktovik NuiqsutPoint Hope
Point Lay Wainwright
All NSB Children
Very good or excellent
41% 38% 68% 66% 55% 66% 70% 54% 63%
nsB data source: 2010 nsB Census.
alaska data source: national survey of Children’s Health 2007.
aKp=anaktuvuk pass
6.1.1.2. General Teen Health Status Data from YRBSIn 2005, an estimated 92.7% of NSB high school students described themselves as being in good to excellent health, with 9.3% reporting fair to poor health.4
6.1.2. Child Mortality 6.1.2.1. Mortality Rates in Children Less Than 5 Years of Age
A common way to report child mortality rates is to look at the number of deaths in children less than age 5 years per 1000 live births in a year. This is called the “Under-5 Mortality Rate.” Looking at under-5

Chapter 6: Maternal
and Child health
North Slope Borough Baseline Community Health Analysis|189
mortality rates in individual Alaska census areas for 1999–2008, a similar pattern to that seen with infant mortality emerges. The northern, interior, and southwest regions suffer from the highest death rates among children less than 5 years old. Among these remote rural census areas, however, the NSB had the lowest under-5 mortality rates for this 10-year period.5
Figure 6.2: Under-5 Mortality Rates, by Region: Number of children dying before their 5th birthday per 1000 live births per year, 1999–2008!"#$%&'M)A*'[1/&%O>'`-%.23".@'+2.&7H'I@'+&#"-1*''8$RI&%'-F'E5"3/%&1'/@"1#'I&F-%&'.5&"%'>.5'I"%.5/2@',&%'(NNN'3"X&'I"%.57',&%'@&2%H''(LLLaANNK'
!
JLK!
JLJ!
JLH!
JLI!
HLG!
HLE!
HLI!
ILB!
ILG!
BBLA!
BGLF!
BFLB!
BFLB!
BKLA!
BKLE!
BJLE!
BHLB!
:1E5-%2#&'
`2.21$7Q2v6$7".12'
!2"%I21Q7'8-%.5'6.2%'
h-/"2Q'S7321/d'
h&12"';&11"17$32'
r$1&2$'
?23/&k'U-%/-X2d'
6".Q2d'
h&.E5"Q21d'
8V+Y4'6^V;Cd'
8-%.5G&7.':%EWE'
Z"33"1#52Rd'
;%"1E&'-F'_23&7vV$.&%'h&.E5"Q21d'
b$Q-1'h-@$Q$Qd'
_2/&'42R,.-1'
8-R&'
9&.5&3'
*Rates based on fewer than 20 occurrences are statistically unreliable and should be used with caution.
Regions with fewer than six occurrences are not reported.
Data source: alaska Bureau of Vital statistics 2008 annual Report.
6.1.2.2. Child Mortality, Ages 0–19 YearsOver the past decade, the death rate among all children and teens (ages 0–19 years) in the NSB has remained fairly stable and higher than the state and national average.5,6
Figure 6.3: Child Mortality Rate (Ages 0–19 Years): Number of deaths per 100,000 population, 1997–2008!"#$%&'M)<*'U5"3/'`-%.23".@'+2.&'\:#&7'Nv(L'b&2%7]*''8$RI&%'-F'/&2.57',&%'(NNHNNN',-,$32."-1H'(LLBaANNK'
!
MN'
KN'
(NN'
(AN'
(JN'
(MN'
(KN'
(LLBOLL' (LLKONN' (LLLON(' ANNNONA' ANN(ON<' ANNAONJ' ANN<ON>' ANNJONM' ANN>ONB' ANNMONK'
869'
:327Q2''
[)6)'
*nsB rates are based on fewer than 20 occurrences per time period and must be interpreted with caution.
nsB and alaska data source: alaska Bureau of Vital statistics.
u.s. statistics were available for 2002, 2003, 2005 for ages 0–19 years. Data source: national Center for Health statistics, accessed through the national mCH Center for Child Death Review. Child mortality statis-tics for the u.s. are typically calculated for age groups excluding infants less than 1 year and are, therefore, not directly comparable to alaska census area data, where population estimates for children less than 1 year of age are not readily available.
190|Part II: Full Report|Chapter 6: Maternal and Child Health
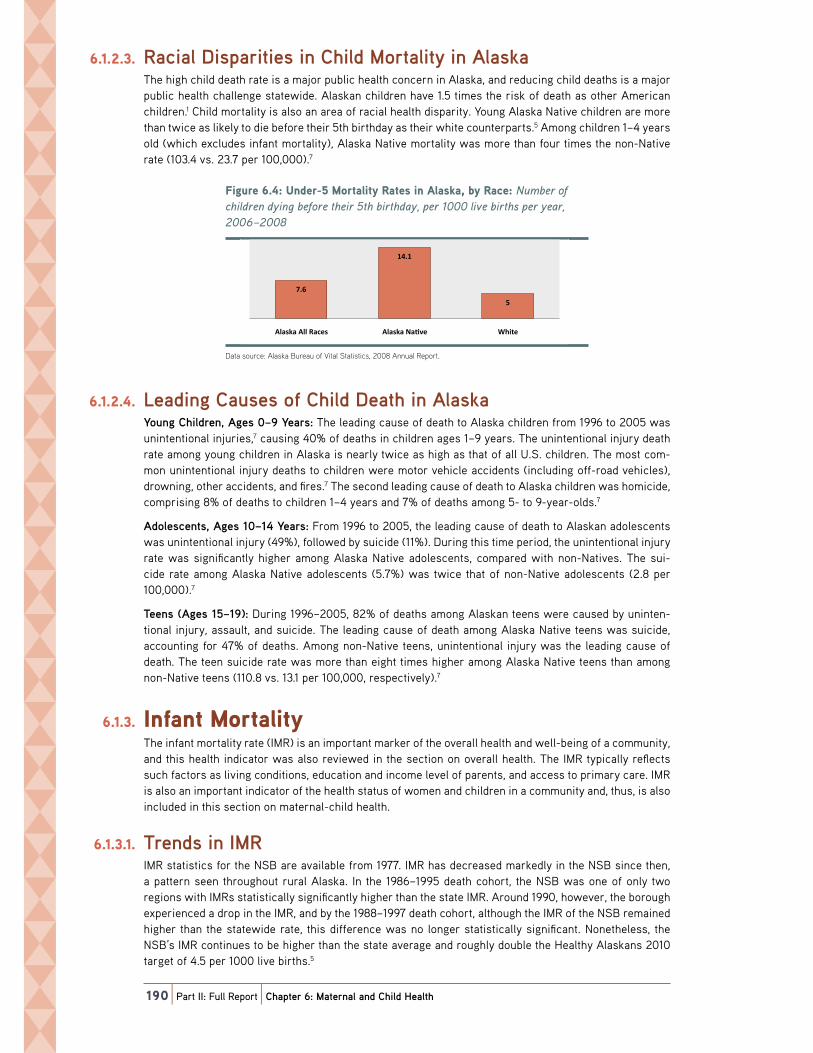
6.1.2.3. Racial Disparities in Child Mortality in AlaskaThe high child death rate is a major public health concern in Alaska, and reducing child deaths is a major public health challenge statewide. Alaskan children have 1.5 times the risk of death as other American children.1 Child mortality is also an area of racial health disparity. Young Alaska Native children are more than twice as likely to die before their 5th birthday as their white counterparts.5 Among children 1–4 years old (which excludes infant mortality), Alaska Native mortality was more than four times the non-Native rate (103.4 vs. 23.7 per 100,000).7
Figure 6.4: Under-5 Mortality Rates in Alaska, by Race: Number of children dying before their 5th birthday, per 1000 live births per year, 2006–2008!"#$%&'M)J*'[1/&%O>'`-%.23".@'+2.&7'"1':327Q2H'I@'+2E&H'ANNMaANNK'
!
B)M'
(J)('
>'
:327Q2':33'+2E&7' :327Q2'82WX&' _5".&'
Data source: alaska Bureau of Vital statistics, 2008 annual Report.
6.1.2.4. Leading Causes of Child Death in AlaskaYoung Children, Ages 0–9 Years: The leading cause of death to Alaska children from 1996 to 2005 was unintentional injuries,7 causing 40% of deaths in children ages 1–9 years. The unintentional injury death rate among young children in Alaska is nearly twice as high as that of all U.S. children. The most com-mon unintentional injury deaths to children were motor vehicle accidents (including off-road vehicles), drowning, other accidents, and fires.7 The second leading cause of death to Alaska children was homicide, comprising 8% of deaths to children 1–4 years and 7% of deaths among 5- to 9-year-olds.7
Adolescents, Ages 10–14 Years: From 1996 to 2005, the leading cause of death to Alaskan adolescents was unintentional injury (49%), followed by suicide (11%). During this time period, the unintentional injury rate was significantly higher among Alaska Native adolescents, compared with non-Natives. The sui-cide rate among Alaska Native adolescents (5.7%) was twice that of non-Native adolescents (2.8 per 100,000).7
Teens (Ages 15–19): During 1996–2005, 82% of deaths among Alaskan teens were caused by uninten-tional injury, assault, and suicide. The leading cause of death among Alaska Native teens was suicide, accounting for 47% of deaths. Among non-Native teens, unintentional injury was the leading cause of death. The teen suicide rate was more than eight times higher among Alaska Native teens than among non-Native teens (110.8 vs. 13.1 per 100,000, respectively).7
6.1.3. Infant Mortality The infant mortality rate (IMR) is an important marker of the overall health and well-being of a community, and this health indicator was also reviewed in the section on overall health. The IMR typically reflects such factors as living conditions, education and income level of parents, and access to primary care. IMR is also an important indicator of the health status of women and children in a community and, thus, is also included in this section on maternal-child health.
6.1.3.1. Trends in IMRIMR statistics for the NSB are available from 1977. IMR has decreased markedly in the NSB since then, a pattern seen throughout rural Alaska. In the 1986–1995 death cohort, the NSB was one of only two regions with IMRs statistically significantly higher than the state IMR. Around 1990, however, the borough experienced a drop in the IMR, and by the 1988–1997 death cohort, although the IMR of the NSB remained higher than the statewide rate, this difference was no longer statistically significant. Nonetheless, the NSB’s IMR continues to be higher than the state average and roughly double the Healthy Alaskans 2010 target of 4.5 per 1000 live births.5

Chapter 6: Maternal
and Child health
North Slope Borough Baseline Community Health Analysis|191
Figure 6.5: Infant Mortality Rate: Number of infant deaths (under one year) per 1000 live births, 1977–2009!"#$%&'M)>*'S1F21.'`-%.23".@'+2.&*''8$RI&%'-F'"1F21.'/&2.57'\$1/&%'-1&'@&2%]',&%'(NNN'3"X&'I"%.57H'(LBBaANNL'
!
N'
>'
(N'
(>'
AN'
A>'
<N'
<>'
869'
:327Q2'
4&23.5@':327Q217'AN(N'Y2%#&.'
[)6)'
nsB and alaska data source: alaska Bureau of Vital statistics.
u.s. data source: Health, United States, 2007 with Chartbook on Trends in the Health of Americans.Rates for nsB include rates based on fewer than 20 events and must be interpreted with caution.
missing data points represent time periods with fewer than 6 infant deaths.
6.1.3.2. Regional IMR Comparison in AlaskaLooking at the 10-year period 1998–2008, one can see that the highest IMRs occurred in the northern, interior, and southwest regions of the state. Among these remote rural regions, the NSB had the lowest IMR, albeit higher than the urban centers and southeast Alaska.5
Figure 6.6: Infant Mortality Rates, by Region: Number of infant deaths (under one year) per 1000 live births, 1999–2008!"#$%&'M)M*'S1F21.'`-%.23".@'+2.&7H'I@'+&#"-1*''8$RI&%'-F'"1F21.'/&2.57'\$1/&%'-1&'@&2%]',&%'(NNN'3"X&'I"%.57'(LLLvANNK'
!
>)A'
>)<'
>)J'
>)L'
M'
M)<'
M)M'
M)K'
B'
(N)('
(N)B'
(()<'
(()L'
(A)A'
(A)<'
(A)M'
(<)('
!2"%I21Q7'8-%.5'6.2%'
:1E5-%2#&'
`2.21$7Q2v6$7".12'
h&12"';&11"17$32'
h-/"2Q'S7321/d'
?23/&k'U-%/-X2d'
6".Q2d'
r$1&2$'
h&.E5"Q21d'
8V+Y4'6^V;Cd'
8-%.5G&7.':%EWEd'
;%"1E&'-F'_23&7vV$.&%'h&.E5"Q21d'
Z"33"1#52Rd'
9&.5&3'
8-R&'
_2/&'42R,.-1'
b$Q-1'h-@$Q$Qd'
*Rates are based on fewer than 20 occurrences and should be interpreted with caution.
Regions with fewer than six occurrences are not reported.
Data source: alaska Bureau of Vital statistics 2008 annual Report.
6.1.3.3. Neonatal vs. Post-Neonatal Infant MortalityPost-neonatal deaths are defined as deaths occurring between 28 days and 1 year after birth. Causes of post-neonatal infant deaths include such causes as SIDS, accidents, injuries, and illness. Neonatal deaths are those occurring between birth and 28 days of life. Neonatal deaths are typically associated with prematurity, birth defects, and other complications of pregnancy and birth. During the 1990s and early 2000s, the high IMRs in the NSB were largely attributable to relatively high rates of post-neonatal death.5 This pattern was, and still is, typical (although not universal) throughout most of the northern, southwest, and interior rural regions of the state.5 During the most recent decade, however, infant mortality in the NSB has been comprised predominantly of neonatal deaths.5 This change in the composition of infant mortality in the NSB is not seen consistently in other regions of the state. Statewide, roughly half of infant

192|Part II: Full Report|Chapter 6: Maternal and Child Health
deaths during the past two decades occurred during the neonatal period and the other half during the post-neonatal period.5 Because of the very small number of events from a statistical standpoint, observed patterns in the NSB must be interpreted with caution.
A review of infant deaths in Alaska from 1992 to 2002 found that the leading causes of post-neonatal deaths, allowing for multiple causes, were SIDS (asphyxia of unknown cause), unintentional suffoca-tion, congenital anomalies, infection, and physical trauma. Roughly half of post-neonatal deaths caused by trauma were found to be possible or probably victims of neglect or abuse. The primary contributing factors to neonatal deaths were preterm birth, contributing to almost half (48%) of all neonatal deaths, perinatal events, and infections.8
6.1.4. Fetal MortalityFetal death rate refers to the number fetal deaths occurring after 20 weeks’ gestation per 1000 live births plus fetal deaths. The fetal death rate in Alaska has remained fairly steady and slightly lower than the national rate. Fetal mortality has decreased among Alaska Native women over the last decade, resulting in a lower fetal death rate compared to non-Natives.9 From 1999–2008, the fetal death rate in the NSB (4.7 per 1000) was not significantly different from the Alaska rate (4.9 per 1000).5 The Healthy Alaskans 2010 target was to reduce the fetal death rate to 3.8 per 1000 live births.1
6.1.5. Preterm Birth and Low Birth Weight 6.1.5.1. Preterm Birth
Preterm birth is defined as birth at less than 37 weeks’ gestation, and low birth weight (LBW) is defined as newborns weighing less than 2500 grams. These are two other important maternal-child health indi-cators. Preterm delivery is a leading cause of infant mortality, and it can be associated with life-long ill health effects such as respiratory problems, cerebral palsy, and blindness. Infants born preterm have much higher mortality rates compared with infants born at term10 and incur healthcare costs many times more than costs of term births.
Overall, the preterm birth rate in the NSB has been trending downward since the late 1970s but recently appears to have plateaued or even begun to increase. The rate of preterm births in the NSB has been consistently higher than statewide rates and the Healthy Alaskans 2010 target rate.1,5 Preterm birth is also an area of racial disparity. In 2007–2009, Alaska Native mothers in the NSB were five times as likely as white mothers to have a preterm birth (15.2% vs. 2.8%, respectively).5
Figure 6.7: Preterm Birth Rate: Number of live births <37 weeks per 100 live births, 1977–2009!"#$%&'M)B*';%&.&%R'9"%.5'+2.&*'8$RI&%'-F'3"X&'I"%.57't<B'G&&Q7',&%'(NN'3"X&'I"%.57H'(LBBaANNL'
!
N'
>'
(N'
(>'
AN'
A>'
869'
:327Q2'
4&23.5@':327Q217'AN(N'Y2%#&.'
[)6)'
alaska and nsB data source: alaska Bureau of Vital statistics Birth profiles.
u.s. data source: national Center for Health statistics. Retrieved February 19, 2009 from www.marchofdimes.com/peristats.
u.s. rates are for the single, midpoint year of the 5-year time period.

Chapter 6: Maternal
and Child health
North Slope Borough Baseline Community Health Analysis|193
The national preterm birth rate has increased 30% since 1981.12 Although preterm birth has been on the rise in recent decades both statewide and nationally, a downward trend was seen in spontaneous pre-term birth rates among Alaska Native populations statewide during 1989–2006. Preterm births because of medical intervention have increased, however, for both Alaska Native and non-Native women.13
6.1.5.2. Low Birth Weight (LBW)The majority of LBW babies are born preterm, and a majority of neonatal and a substantial portion of post-neonatal deaths occur among infants born at LBW.1 Rates of LBW births in the NSB have decreased since the late 1970s, with a nadir in the mid-1990s, but appear to be trending upward over the past 15 years.5 Rates in both the NSB and Alaska remain lower than U.S. rates overall.5,11
Figure 6.8: Low Birth Weight: Number of infants weight less than 2500 grams per 100 live births, 1977–2009!"#$%&'M)K*'^-G'9"%.5'_&"#5.*''8$RI&%'-F'"1F21.7'G&"#5.'3&77'.521'A>NN'#%2R7',&%'(NN'3"X&'I"%.57H'(LBBaANNL'
!
N'
A'
J'
M'
K'
(N'
869'
:327Q2'
[)6)'
4&23.5@':327Q217'AN(N'Y2%#&.'
alaska and nsB data source: alaska Bureau of Vital statistics Birth profiles.
u.s. data source: national Center for Health statistics. Retrieved February 19, 2009 from www.marchofdimes.com/peristats.
u.s. rates are for the single, midpoint year of the 5-year time period.
6.1.6. Birth DefectsCongenital anomalies, or birth defects, are a leading cause of infant death and morbidity in children. In Alaska, it is estimated that birth defects contributed to 33% of neonatal and 20% of post-neonatal deaths during 1992–2002.14
6.1.6.1. Any Major Congenital AnomalyBased on an a State of Alaska analysis of data from the Alaska Birth Defects Registry (ABDR) for the 1996–2002 birth cohort, the prevalence of major congenital anomalies in the NSB15 was higher than the statewide prevalence but virtually the same as the statewide prevalence for Alaska Natives.14,16 Birth defects are an area of racial health disparity, with higher rates among Alaska Natives, and this disparity persists after excluding fetal alcohol spectrum disorders (FASD) and controlling for identifiable risk factors.16 Some of the differences among regions and populations may be attributable to differences in surveillance methodology, reporting, and diagnostic and clinical practices. In addition, the estimates for children born in Alaska during 1996–2002 include all cases reported before January 1, 2005, regardless of the age at which the child was first reported to the ABDR. Many states include only children who were diagnosed or reported before their 1st birthday.16 Thus, comparisons with U.S. rates must also be interpreted with caution.

194|Part II: Full Report|Chapter 6: Maternal and Child Health
Figure 6.9: Major Congenital Anomalies (Birth Defects): Percent of children born with any major congenital anomaly, 1996–2002!"#$%&'M)L*'`2c-%'U-1#&1".23':1-R23"&7'\9"%.5'Z&F&E.7]*'';&%E&1.'-F'E5"3/%&1'I-%1'G".5'21@'R2c-%'E-1#&1".23'21-R23@H'(LLMvANNA'
!
(N='
M='J='
(N='
<='
869' :327Q2' :327Q2'_5".&7' :327Q2'82WX&7' [)6)'
nsB data source: alaska Birth Defects Registry—nsB-specific data from the alaska Birth Defects Registry provided by the alaska Department of Health and social services maternal and Child Health epidemiology unit.
alaska and u.s. estimates taken from “High prevalence of major Congenital anomalies in alaska, 1996–2002” state epidemiology Bulletin 2008 and Alaska Maternal and Child Health Data Book 2005: Birth Defects Surveillance Edition.
In the NSB, FASD was the most common anomaly, followed by cardiovascular anomalies (birth defects of the heart and blood vessels).15 Cardiovascular anomalies were the most common birth defects statewide, followed by FASD.14,16 Other specific types of anomalies in the NSB had fewer than 10 cases each during the time period studied and, therefore, rates are not presented individually.
6.1.6.2. Cardiovascular AnomaliesCardiovascular anomalies range from mild and asymptomatic to life-threatening or fatal. The prevalence of cardiovascular anomalies in the NSB was about twice that for non-Natives statewide, but similar to rates among Alaska Native infants statewide.14–16 Of the different regions examined in the statewide analy-sis of birth defect registry data, southwest Alaska had the highest rate of cardiovascular anomalies, and the northern region, which included the NSB, as well as Northwest Arctic Borough and Bering Straits area, had the second highest prevalence.16
Figure 6.10: Cardiovascular Anomalies: Percent of children born with a cardiovascular anomaly, 1996–2002!"#$%&'M)(N*'U2%/"-X27E$32%':1-R23"&7*';&%E&1.'-F'E5"3/%&1'I-%1'G".5'2'E2%/"-X27E$32%'21-R23@H'(LLMvANNA'
!
J='
A='
J='
A='(='
869' :327Q2' :327Q2'82WX&' :327Q2'_5".&' [)6)''
nsB data source: alaska Birth Defects Registry—nsB-specific data from the alaska Birth Defects Registry provided by the alaska Department of Health and social services maternal and Child Health epidemiology unit.
alaska and u.s. estimates taken from “High prevalence of major Congenital anomalies in alaska, 1996–2002” state epidemiology Bulletin 2008 and Alaska Maternal and Child Health Data Book 2005: Birth Defects Surveillance Edition.
6.1.6.3. Fetal Alcohol Spectrum DisordersFetal alcohol spectrum disorders (FASDs) describe infants with physical, mental, behavioral, or learn-ing disabilities associated with maternal alcohol use during pregnancy. Approximately one in 10 infants diagnosed with FASD meet the case definition for the most severe form of the disorder, fetal alcohol syndrome, or FAS, which requires specific deficits including typical facial features, growth deficits, and neurodevelopmental deficits in the setting of prenatal alcohol exposure.
The prevalence of FASD in the NSB was more than three times the state average and 16 times the rate in non-Natives statewide, but similar to the statewide rate estimate for Alaska Natives.14–16 Aggressive case finding activities within the Alaska Native Health Services may explain some of the observed racial discrepancy. Of the different regions examined, the northern region had the highest prevalence of FASD, more than twice that of any of the other regions.16 Again, practice variation in screening, diagnosis, and reporting may account for some of the regional differences. Among Alaska Natives, however, the preva-lence of FAS dropped almost 50% from children born in 1996–98 to those born in 2000–02.53

Chapter 6: Maternal
and Child health
North Slope Borough Baseline Community Health Analysis|195
Figure 6.11: Fetal Alcohol Spectrum Disorder: Percent of children who are diagnosed with FASD before age 6, birth years 1996–2002
!"#$%&'M)((*'!&.23':3E-5-3'6,&E.%$R'Z"7-%/&%*';&%E&1.'-F'E5"3/%&1'G5-'2%&'/"2#1-7&/'G".5'!:6Z'I&F-%&'2#&'MH'I"%.5'@&2%7'(LLMvANNA'
!
J)>='
()J='
J)K='
N)<='
869' :327Q2' :327Q2'82WX&' :327Q2'_5".&'
nsB data source: alaska Birth Defects Registry—nsB-specific data from the alaska Birth Defects Registry provided by the alaska Department of Health and social services maternal and Child Health epidemiology unit.
alaska and u.s. estimates taken from “High prevalence of major Congenital anomalies in alaska, 1996–2002” state epidemiology Bulletin 2008 and Alaska Maternal and Child Health Data Book 2005: Birth Defects Surveillance Edition.
6.1.7. Child MaltreatmentChild maltreatment is a complex phenomenon, encompassing varying degrees of neglect and mental injury, as well as physical and sexual abuse. Cases of child maltreatment often occur in homes where alcohol or drugs impair a parent’s ability to care for or protect a child, and child maltreatment is often seen in homes where other types of domestic abuse are occurring. Child neglect and other forms of maltreatment are contributing factors to general health status and many other health problems among children. Childhood trauma and maltreatment contribute to an adverse early child environment that can have devastating consequences throughout the lifespan.
The NSB experienced high rates of child maltreatment in 2006–2008 compared with the state average, similar to other northern and southwest remote rural areas of the state. Comparable, reliable rates are not available prior to 2006, when a statewide mandatory electronic data reporting system was implemented.17 The Healthy Alaskans 2010 target was a reduction in the rate of child maltreatment to less than 10 sub-stantiated reports per 1000 children.1
Figure 6.12: Substantiated Allegations of Child Maltreatment*: Number of substantiated reports per 1000 children ages 0–17, 2006–2009
!"#$%&'M)M*'6$I7.21."2.&/':33."-17'-F'U5"3/'`23.%&2.R&1.d*'''8$RI&%'-F'7$I7.21."2.&/'%&,-%.7',&%'(NNN'E5"3/%&1'2#&7'NO(BH'ANNMaANNL'
!
>J)K' >A)K'
AK'
(N'
92%%-G'VuE&' 9&.5&3H'8-R&H'h-.k&I$&'VuE&7'E-RI"1&/'
:327Q2' 4&23.5@':327Q217'AN(N'Y2%#&.'
*Combined neglect, physical abuse, sexual abuse, and mental injury. Data source: office of Children’s services, alaska DHss.
Rates calculated by author, based on u.s. Census 2000 population estimates for communities covered by respective area offices.
In 2009, in the Northern region—including the offices of Barrow, Delta Junction, Galena, Kotzebue, McGrath, and Nome—55% of substantiated allegations were for neglect, 8% physical abuse, 1% sexual abuse, and 35% mental injury. Statewide, over 70% of substantiated allegations were for neglect, with only 17% for mental injury.17 Alaska has one of the highest documented infant physical abuse incidences reported in the literature for any state.18 Child maltreatment is also an area of racial health disparity, with rates of maltreatment-related infant deaths that are 3.2 times higher for Alaska Native than for non-Native infants.7 Again, differences in diagnosis and reporting practices may account for some of the regional and racial differences observed.

196|Part II: Full Report|Chapter 6: Maternal and Child Health
6.1.8. Common Health Conditions Among Children 6.1.8.1. Childhood Obesity
Obesity has become one of the most common health problems of childhood. Reversing the upward trend in childhood obesity has been identified as a major statewide19 and national public health goal.20 Being overweight and obese start early, and some overweight children already experience complications such as high blood pressure and diabetes by the time they reach their teenage years.
Overweight/Obesity Data from NSB Public Health Nursing RecordsBody Mass Indexes (BMIs) were calculated based on measured height and weight for more than 1000 NSB children aged 3–18 years in the public health nursing database.21 Based on CDC standard definitions, half of the NSB children in this sample were either overweight or obese, and obesity prevalence esti-mates for children in the NSB21 are approximately 50% higher than among Alaskan children statewide.19 Because these are not random samples and the methods used in deriving these two estimates were somewhat different, comparisons must be interpreted with caution. Also, the years from which data were drawn for these estimates also differ, and this must be taken into consideration, especially given the upward trend in child obesity in recent decades.
Figure 6.13: Childhood Overweight and Obesity: Percent of children meeting BMI criteria for overweight and obesity
!"#$%&'M)(A*'U5"3/5--/'VX&%G&"#5.'21/'VI&7".@*';&%E&1.'-F'E5"3/%&1'R&&."1#'9`S'E%".&%"2'F-%'-X&%G&"#5.'21/'-I&7&'
!
A(=' AN='
<(='
AN='
869'\2#&7'<v(K'@&2%7]' :327Q2'\2#&7'<v(L'@&2%7]'
VI&7&'
VX&%G&"#5.'
overweight is defined as having a Bmi in the 85th to 95th percentile for age and gender. obese is defined as having a Bmi above the 95th percentile for age and gender.
nsB data source: nsB public Health nursing Rpms database, single year estimate based on heights and weights taken from august, 2008 to august, 2009.
alaska data source: alaska Department of Health and social services report: Childhood Obesity in Alaska, estimates based on heights and weights from the statewide Rpms database for years 2000–2005.
Problems with overweight and obesity start early—roughly half of children in the 2008–2009 NSB sample were already overweight or obese upon starting kindergarten.21
Figure 6.14: Childhood Overweight and Obesity in the NSB, by Age: Percent of children meeting BMI criteria for overweight and obesity
!"#$%&'M)(<*'U5"3/5--/'VX&%G&"#5.'21/'VI&7".@'"1'.5&'869H'I@':#&*';&%E&1.'-F'E5"3/%&1'R&&."1#'9`S'E%".&%"2'F-%'-X&%G&"#5.'21/'-I&7&'
!
(L=' AN=' A(='
<(='
(<='
AL='
A<='A(='
(J='(L='
AA=' AJ=' A>='
(L=' A(='
(A='
AL='
<L='
AB='
AL='
<B='A>='
A<='
<B='J(='
<(='
<J='
(<='
(L='
<N='
<M='
JN='
<' J' >' M' B' K' L' (N' ((' (A' (<' (J' (>' (M' (B' (K'
VI&7&'
VX&%G&"#5.'
:#&'"1'b&2%7'
nsB data source: nsB public Health nursing Rpms database, single year estimate based on heights and weights taken from august, 2008 to august, 2009. overweight is defined as having a Bmi in the 85th to 95th percentile for age and gender. obese is defined as having a Bmi above the 95th percentile for age and gender.
Chapter 6: Maternal
and Child health
North Slope Borough Baseline Community Health Analysis|197
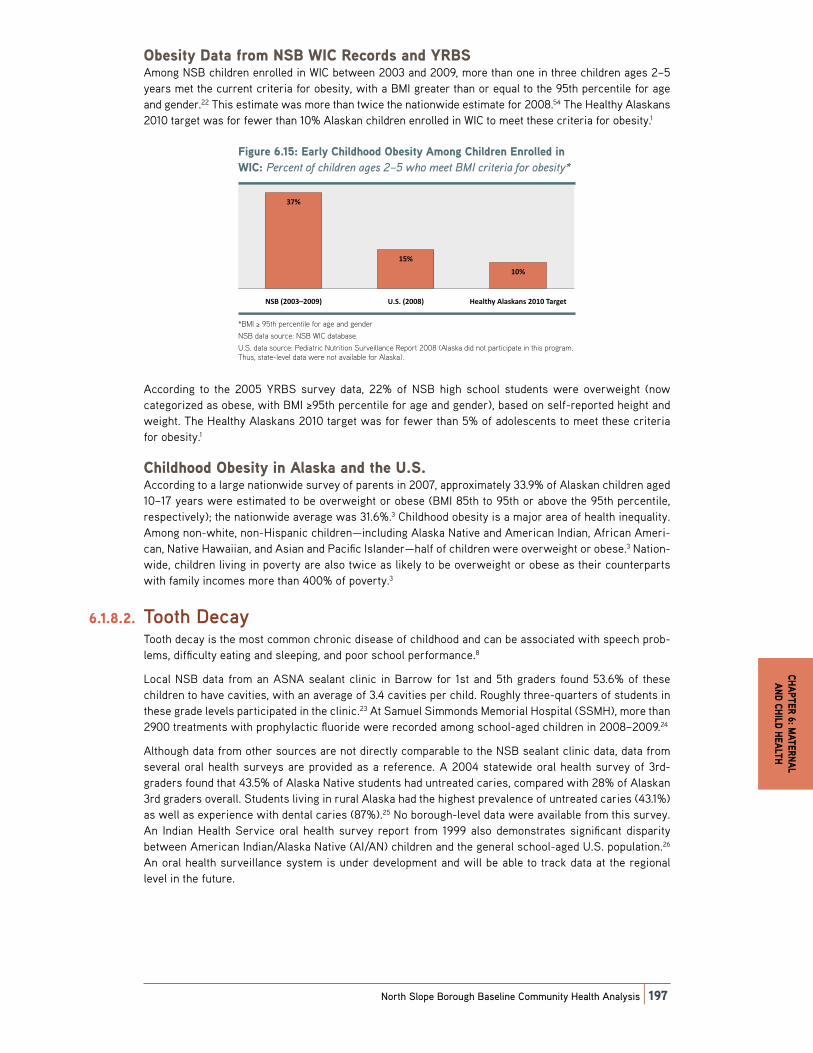
Obesity Data from NSB WIC Records and YRBSAmong NSB children enrolled in WIC between 2003 and 2009, more than one in three children ages 2–5 years met the current criteria for obesity, with a BMI greater than or equal to the 95th percentile for age and gender.22 This estimate was more than twice the nationwide estimate for 2008.54 The Healthy Alaskans 2010 target was for fewer than 10% Alaskan children enrolled in WIC to meet these criteria for obesity.1
Figure 6.15: Early Childhood Obesity Among Children Enrolled in WIC: Percent of children ages 2–5 who meet BMI criteria for obesity*
!"#$%&'M)(J*'C2%3@'U5"3/5--/'VI&7".@':R-1#'U5"3/%&1'C1%-33&/'"1'_SU*'';&%E&1.'-F'E5"3/%&1'2#&7'Aa>'G5-'R&&.'9`S'E%".&%"2'F-%'-I&7".@d'
!
<B='
(>='
(N='
869'\ANN<vANNL]' [)6)'\ANNK]' 4&23.5@':327Q217'AN(N'Y2%#&.'
*Bmi ≥ 95th percentile for age and gender
nsB data source: nsB WiC database.
u.s. data source: pediatric nutrition surveillance Report 2008 (alaska did not participate in this program. thus, state-level data were not available for alaska).
According to the 2005 YRBS survey data, 22% of NSB high school students were overweight (now categorized as obese, with BMI ≥95th percentile for age and gender), based on self-reported height and weight. The Healthy Alaskans 2010 target was for fewer than 5% of adolescents to meet these criteria for obesity.1
Childhood Obesity in Alaska and the U.S.According to a large nationwide survey of parents in 2007, approximately 33.9% of Alaskan children aged 10–17 years were estimated to be overweight or obese (BMI 85th to 95th or above the 95th percentile, respectively); the nationwide average was 31.6%.3 Childhood obesity is a major area of health inequality. Among non-white, non-Hispanic children—including Alaska Native and American Indian, African Ameri-can, Native Hawaiian, and Asian and Pacific Islander—half of children were overweight or obese.3 Nation-wide, children living in poverty are also twice as likely to be overweight or obese as their counterparts with family incomes more than 400% of poverty.3
6.1.8.2. Tooth Decay Tooth decay is the most common chronic disease of childhood and can be associated with speech prob-lems, difficulty eating and sleeping, and poor school performance.8
Local NSB data from an ASNA sealant clinic in Barrow for 1st and 5th graders found 53.6% of these children to have cavities, with an average of 3.4 cavities per child. Roughly three-quarters of students in these grade levels participated in the clinic.23 At Samuel Simmonds Memorial Hospital (SSMH), more than 2900 treatments with prophylactic fluoride were recorded among school-aged children in 2008–2009.24
Although data from other sources are not directly comparable to the NSB sealant clinic data, data from several oral health surveys are provided as a reference. A 2004 statewide oral health survey of 3rd-graders found that 43.5% of Alaska Native students had untreated caries, compared with 28% of Alaskan 3rd graders overall. Students living in rural Alaska had the highest prevalence of untreated caries (43.1%) as well as experience with dental caries (87%).25 No borough-level data were available from this survey. An Indian Health Service oral health survey report from 1999 also demonstrates significant disparity between American Indian/Alaska Native (AI/AN) children and the general school-aged U.S. population.26 An oral health surveillance system is under development and will be able to track data at the regional level in the future.

198|Part II: Full Report|Chapter 6: Maternal and Child Health
Figure 6.16: Child Oral Health: Percent of children found on exam to have untreated cavities!"#$%&'M)(>*'U5"3/'V%23'4&23.5*';&%E&1.'-F'E5"3/%&1'F-$1/'-1'&D2R'.-'52X&'$1.%&2.&/'E2X"."&7'
!
MJ='
JJ='
AK='
JJ='
((='
JM='
869*'(7.'0%2/&%7'
869*'>.5'0%2/&%7'
:327Q2*''<%/'0%2/&%7H':33'
+2E&7'
:327Q2*':327Q2'82WX&'<%/'0%2/&%7'
[)6)*'6E5--3O2#&/'U5"3/%&1H'
:33'+2E&7'
[)6)*'6E5--3O2#&/'U5"3/%&1H'
:Se:8'
nsB data source: asna Dental program February 22–26, 2010 sealant Clinic Report.
alaska data source (3rd graders): alaska oral Health assessment summary Report 2004–2005.
u.s. data source (school-aged children): 1999 iHs oral Health survey report.
6.1.8.3. AnemiaPediatric anemia, a common condition, can lead to lifelong physical and cognitive deficits that persist even when the anemia is corrected. The most common cause of anemia in children is low iron stores, and iron deficiency anemia is estimated to occur in up to 10% of 1- to 3-year-olds27 nationwide. Women and children enrolled in WIC are at particularly high risk for anemia and are screened for anemia during visits. The Healthy Alaskans 2010 target was for fewer than 15% of children less than 5 years served by WIC to have anemia (hemoglobin or hematocrit below 5th percentile of CDC population).1
Anemia prevalence among NSB children enrolled in WIC appears to be similar to the statewide average and follow the same pattern of declining prevalence with age up to 5 years. Among pregnant and post-partum WIC clients, however, anemia appears to be more common in the NSB than in Alaska overall.22,28 Variation in timing of hemoglobin measurement and other factors may account for some of this differ-ence, and further examination would be helpful to confirm and explain the high rate of anemia in post-partum women in the NSB.
Figure 6.17: Low Hemoglobin (Anemia)* Among WIC Clients, by Age, 2003–2009!"#$%&'M)(M*'^-G'4&R-#3-I"1'\:1&R"2]d':R-1#'_SU'U3"&1.7H'I@':#&H'ANN<aANNL'
!
A(='(K='
(J='(N='
A<='
>A='
A>='AA='
(M='(<='
(M='AN='
(OA'@&2%7' AO<'@&2%7' <OJ'@&2%7' JO>'@&2%7' ;%y.' ;-7.O,2%.$R'
869'
:327Q2'
low hemoglobin is defined as <11.0 g/dl in children from birth to 24 months, <11.1 g/dl in children ages 2–5 years, <11.0 g/dl in women during their 1st and 3rd trimester of pregnancy, <10.5 second trimester, and <12 g/dl in post-partum women.
nsB data from nsB WiC office, WiC/Data database, reporting period January 1, 2003 through February 27, 2009.
alaska data from Gessner, B.D.: Geographic and racial patterns of anemia prevalence among low-income alaskan children and pregnant or postpartum women limit potential etiologies. Journal of Pediatric Gastroenterology and Nutrition 48, no. 4 (2009): 475–481.
alaska reporting period 1999–2006.
Iron-deficiency anemia is particularly common among rural Alaska Native children and pregnant and post-partum women, despite diets that are typically high in iron-rich foods.28 Among WIC clients, anemia rates have been shown to be higher overall in Alaska Natives, compared with non-Natives, but Alaska Natives living in coastal and urban regions have lower anemia rates than those in other areas.28

Chapter 6: Maternal
and Child health
North Slope Borough Baseline Community Health Analysis|199
6.1.8.4. Respiratory/Ear/Nose/Throat ProblemsRespiratory problems are one of the most common ailments in children. These are discussed in Chapter 5: Respiratory Disease.
6.2. Determinants of Maternal and Child Health 6.2.1. Overview of the Determinants of Maternal
and Child Health Most maternal and child health problems—complications of pregnancy and birth, accidental injury, neglect and abuse, respiratory diseases, obesity, anemia, tooth decay, and many others—are strongly linked to the socioeconomic and physical environment in which families live. Income and poverty, adequate hous-ing and sanitation, exposure to violence or abuse, maternal education level, social support and level of paternal involvement all affect maternal and child health in significant ways. Children’s health is also par-ticularly sensitive to a wide array of factors that create the physical, social, and economic environment in which they grow and develop—housing policies, local option laws that restrict access to alcohol, land use and access to safe recreational opportunities, law enforcement, educational environment, food security, water and sanitation infrastructure, environmental toxins, and many more.
The health and well-being of mothers have profound effects on children, both before and after birth. A fair amount of data is available on maternal factors, such as smoking, alcohol use, nutrition, family planning, prenatal care, breastfeeding, that affect infant and child health. Like other communities in remote rural Alaska, the NSB has relatively high rates of a number of factors associated with an increased risk of poor birth outcomes and child health. These behaviors cannot be viewed, however, outside of the context of the conditions in which the mother and family live.
Statistics on the age, educational level, and marital status of mothers are imperfect but useful markers of the mother’s socioeconomic environment and social support, both of which heavily influence the outcome of a pregnancy and the likelihood of a healthy family. Both unmarried status and teen pregnancy are asso-ciated with poor birth outcomes.29 A recent study found that, among both Alaska Native and non-Natives, the categories of unmarried and having a father’s name missing from the birth certificate were associated with the highest post-neonatal mortality rates.30 Other risk factors for poor birth outcomes include lack of prenatal care and maternal use of tobacco and alcohol during pregnancy.30 Prenatal health factors, such as diabetes, age, genetic factors, and use of certain medications, are associated with an increased risk of certain birth defects and poor pregnancy outcomes as well.
The causes of preterm birth and associated LBW are not completely understood, but preterm birth has been found to be associated with a number of maternal risk factors, including smoking, drug use, low pre-pregnancy weight, and age of the mother being less than 17 years or more than 35 years.14 Having a major congenital anomaly has also been found to be associated with birth to a teenage mother, or to a mother receiving late or no prenatal care or who reported drinking or smoking during pregnancy.18 Mothers or fathers with less than 12 years of education, a mother being unmarried, and maternal prenatal substance abuse are factors that have been found to be associated with an increased risk of infant physical abuse.11
Well-child care and social services that support young families—for example, quality child care and early childhood education, nurse-family partnership programs, nutrition and breastfeeding support—are also vital to the well-being of mothers, infants, and children in a community, particularly those who are dis-advantaged. Injury prevention efforts, such as seatbelt and helmet laws and personal floatation device programs, also affect the number of accidental deaths to children, the leading cause of child mortality in Alaska and the U.S.
200|Part II: Full Report|Chapter 6: Maternal and Child Health
6.2.2. Selected Maternal Risk FactorsSome of the specific factors that are associated with maternal and child health outcomes are reviewed later in this chapter; however, virtually all the determinants discussed in Chapter 1: Overall Health are also important influential factors in the health of children and families as well.
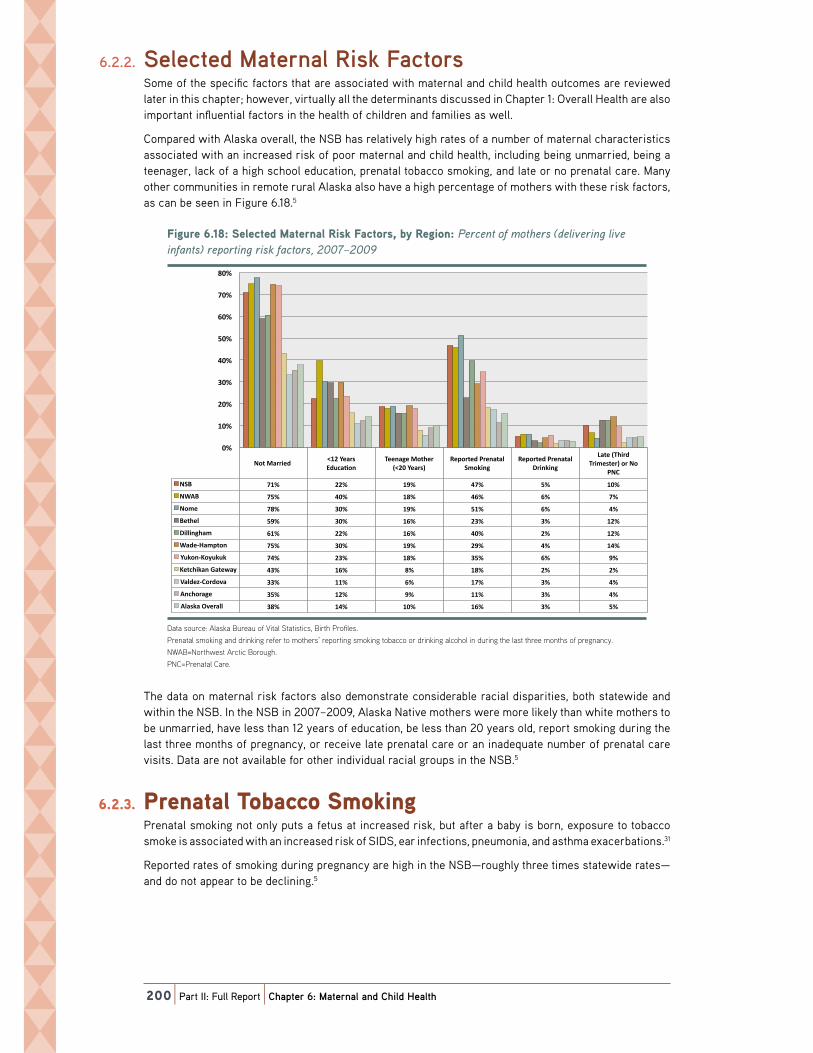
Compared with Alaska overall, the NSB has relatively high rates of a number of maternal characteristics associated with an increased risk of poor maternal and child health, including being unmarried, being a teenager, lack of a high school education, prenatal tobacco smoking, and late or no prenatal care. Many other communities in remote rural Alaska also have a high percentage of mothers with these risk factors, as can be seen in Figure 6.18.5
Figure 6.18: Selected Maternal Risk Factors, by Region: Percent of mothers (delivering live infants) reporting risk factors, 2007–2009
!"#$%&'M)(B*'6&3&E.&/'`2.&%123'+"7Q'!2E.-%7H'I@'+&#"-1*'';&%E&1.'-F'R-.5&%7'\/&3"X&%"1#'3"X&'"1F21.7]'%&,-%."1#'%"7Q'F2E.-%7H'ANNBvANNL'
!
8-.'`2%%"&/''t(A'b&2%7'C/$E2W-1'
Y&&12#&'`-.5&%'\tAN'b&2%7]'
+&,-%.&/';%&12.23'6R-Q"1#'
+&,-%.&/';%&12.23'Z%"1Q"1#'
^2.&'\Y5"%/'Y%"R&7.&%]'-%'8-'
;8U'
869' B(=' AA=' (L=' JB=' >=' (N='
8_:9' B>=' JN=' (K=' JM=' M=' B='
8-R&' BK=' <N=' (L=' >(=' M=' J='
9&.5&3' >L=' <N=' (M=' A<=' <=' (A='
Z"33"1#52R' M(=' AA=' (M=' JN=' A=' (A='
_2/&O42R,.-1' B>=' <N=' (L=' AL=' J=' (J='
b$Q-1Oh-@$Q$Q' BJ=' A<=' (K=' <>=' M=' L='
h&.E5"Q21'02.&G2@' J<=' (M=' K=' (K=' A=' A='
?23/&kOU-%/-X2' <<=' ((=' M=' (B=' <=' J='
:1E5-%2#&' <>=' (A=' L=' ((=' <=' J='
:327Q2'VX&%233' <K=' (J=' (N=' (M=' <=' >='
N='
(N='
AN='
<N='
JN='
>N='
MN='
BN='
KN='
Data source: alaska Bureau of Vital statistics, Birth profiles.
prenatal smoking and drinking refer to mothers’ reporting smoking tobacco or drinking alcohol in during the last three months of pregnancy.
nWaB=northwest arctic Borough.
pnC=prenatal Care.
The data on maternal risk factors also demonstrate considerable racial disparities, both statewide and within the NSB. In the NSB in 2007–2009, Alaska Native mothers were more likely than white mothers to be unmarried, have less than 12 years of education, be less than 20 years old, report smoking during the last three months of pregnancy, or receive late prenatal care or an inadequate number of prenatal care visits. Data are not available for other individual racial groups in the NSB.5
6.2.3. Prenatal Tobacco Smoking Prenatal smoking not only puts a fetus at increased risk, but after a baby is born, exposure to tobacco smoke is associated with an increased risk of SIDS, ear infections, pneumonia, and asthma exacerbations.31
Reported rates of smoking during pregnancy are high in the NSB—roughly three times statewide rates—and do not appear to be declining.5

Chapter 6: Maternal
and Child health
North Slope Borough Baseline Community Health Analysis|201
Figure 6.19: Prenatal Tobacco Smoking: Percent of mothers (giving birth to live infants) reporting smoking during pregnancy, 1997–2009
!"#$%&'M)(K*'6&3FO%&,-%.&/';%&12.23'Y-I2EE-'6R-Q"1#*';&%E&1.'-F'R-.5&%7'\#"X"1#'I"%.5'.-'3"X&'"1F21.7]'%&,-%."1#'7R-Q"1#'/$%"1#'.5&'327.'<'R-1.57'-F',%yE@H'(LLBaANNL':9?6'/2.2'
!
N='
(N='
AN='
<N='
JN='
>N='
869'
:327Q2'
Data source: alaska Bureau of Vital statistics, Birth profiles.
Data collected in the PRAMS survey between 1996 and 2009 suggest that about 37% of NSB mothers smoked during the last 3 months of pregnancy—more than twice as high as in the state overall (17%).32 The NSB estimates were based on between 50 and 200 respondents per time period. The Healthy Alas-kans 2010 target was for no more than 15% of women to report cigarette smoking during the last 3 months of pregnancy.1
6.2.4. Prenatal Alcohol UseAlcohol is particularly toxic to the developing fetus, and exposure to alcohol during pregnancy can result in the range of birth defects and learning and behavioral problems collectively referred to as FASD. Moreover, drinking during pregnancy can predict ongoing alcohol problems in the home that put infants and children at increased risk for neglect, abuse, unintentional injuries, and other harmful experiences.
Reported prenatal drinking levels have declined quite dramatically in the NSB over the past two decades, based on vital statistics data, collected shortly after delivery.5
Figure 6.20: Prenatal Alcohol Use: Percent of mothers (giving birth to live infants) who reported drinking alcohol during pregnancy, 1990–2009
!"#$%&'()*+,'-&./0%&12%3&4'5%&6737.'8.92:2.';<&,'5&%9&63'2/'=23:&%<'>#"?"6#'@"%3:'32'."?&'"6/763<A'B:2'%&12%3&4'4%"6C"6#'7.92:2.'4$%"6#'3:&'.7<3'D'=263:<'2/'1%ᩱEF'*++GHIGG+'8JK-'4737'
!
GL'
*GL'
IGL'
DGL'
M-J'
8.7<C7'
Data source: alaska Bureau of Vital statistics, Birth profiles.
Data collected in the PRAMS survey between 1996 and 2008 suggest a similar downward trend. These estimates were based on a total of 50–200 respondents for each 5-year period.32
Figure 6.21: Prevalence of Prenatal Alcohol Use: Percent of women surveyed reporting drinking alcohol during the last 3 months of pregnancy, 1996–2008 PRAMS data
!"#$%&'()*+,'-%&./0&12&'34'-%&1/5/0'6023730'89&,'-&%2&15'34':3;&1'9$%.&<&='%&>3%5"1#'=%"1?"1#'/023730'=$%"1#'57&'0/95'@';31579'34'>%/12<A'BCC(D*++E'-F6GH'=/5/'
!
!
+I'
EI'
B+I'
BEI'
JHK'60/9?/'
Data source: alaska pregnancy Risk assessment monitoring system. analysis and data provided by the alaska Department of Health and social services, maternal and Child Health epidemiology unit of the alaska Division of public Health.
202|Part II: Full Report|Chapter 6: Maternal and Child Health
In Alaska, the strongest risk factors associated with any and regular alcohol consumption by the mother during the 3rd trimester were older age and marijuana or cocaine use. Other risk factors for any third-trimester drinking included cigarette smoking, greater education, the experience of domestic violence, non-Native race, the experience of significant life stressors, and residence in a community that did not restrict the sale of alcohol.33
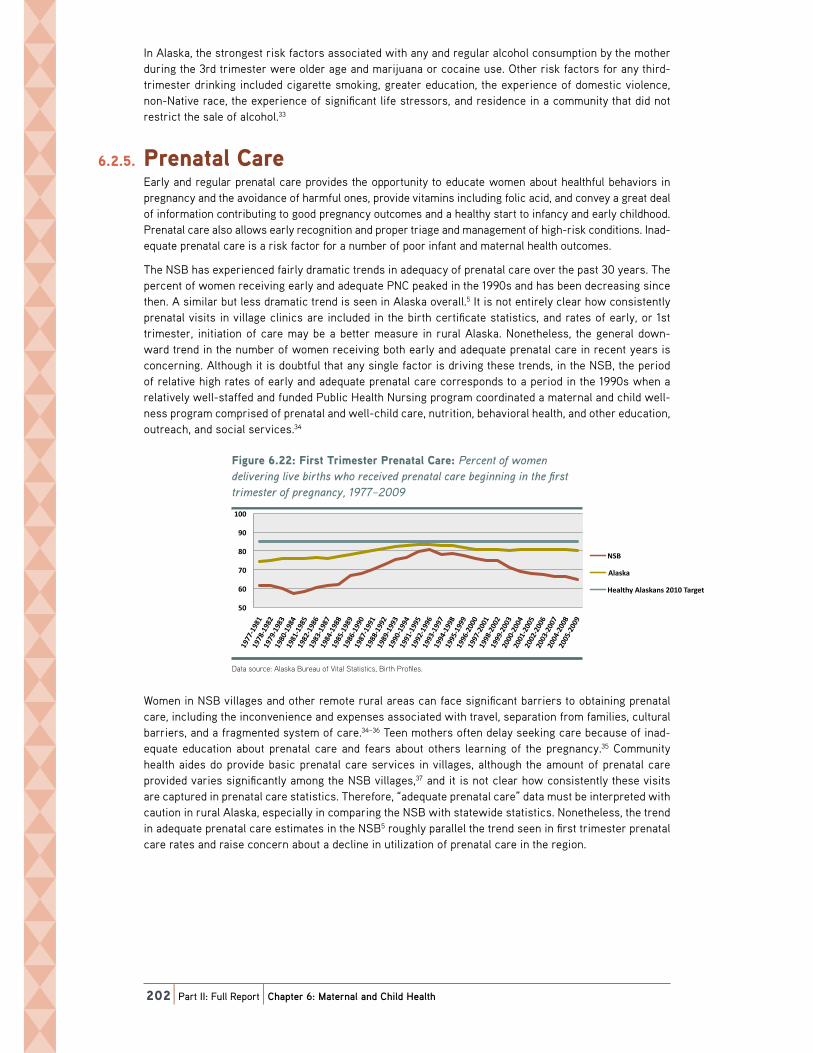
6.2.5. Prenatal CareEarly and regular prenatal care provides the opportunity to educate women about healthful behaviors in pregnancy and the avoidance of harmful ones, provide vitamins including folic acid, and convey a great deal of information contributing to good pregnancy outcomes and a healthy start to infancy and early childhood. Prenatal care also allows early recognition and proper triage and management of high-risk conditions. Inad-equate prenatal care is a risk factor for a number of poor infant and maternal health outcomes.
The NSB has experienced fairly dramatic trends in adequacy of prenatal care over the past 30 years. The percent of women receiving early and adequate PNC peaked in the 1990s and has been decreasing since then. A similar but less dramatic trend is seen in Alaska overall.5 It is not entirely clear how consistently prenatal visits in village clinics are included in the birth certificate statistics, and rates of early, or 1st trimester, initiation of care may be a better measure in rural Alaska. Nonetheless, the general down-ward trend in the number of women receiving both early and adequate prenatal care in recent years is concerning. Although it is doubtful that any single factor is driving these trends, in the NSB, the period of relative high rates of early and adequate prenatal care corresponds to a period in the 1990s when a relatively well-staffed and funded Public Health Nursing program coordinated a maternal and child well-ness program comprised of prenatal and well-child care, nutrition, behavioral health, and other education, outreach, and social services.34
Figure 6.22: First Trimester Prenatal Care: Percent of women delivering live births who received prenatal care beginning in the first trimester of pregnancy, 1977–2009
!"#$%&'M)A(*'!"%7.'Y%"R&7.&%';%&12.23'U2%&*';&%E&1.'-F'G-R&1'/&3"X&%"1#'3"X&'I"%.57'G5-'%&E&"X&/',%&12.23'E2%&'I&#"11"1#'"1'.5&'F"%7.'.%"R&7.&%'-F',%yE@H'(LBBaANNL'
!
>N'
MN'
BN'
KN'
LN'
(NN'
869'
:327Q2'
4&23.5@':327Q217'AN(N'Y2%#&.'
Data source: alaska Bureau of Vital statistics, Birth profiles.
Women in NSB villages and other remote rural areas can face significant barriers to obtaining prenatal care, including the inconvenience and expenses associated with travel, separation from families, cultural barriers, and a fragmented system of care.34–36 Teen mothers often delay seeking care because of inad-equate education about prenatal care and fears about others learning of the pregnancy.35 Community health aides do provide basic prenatal care services in villages, although the amount of prenatal care provided varies significantly among the NSB villages,37 and it is not clear how consistently these visits are captured in prenatal care statistics. Therefore, “adequate prenatal care” data must be interpreted with caution in rural Alaska, especially in comparing the NSB with statewide statistics. Nonetheless, the trend in adequate prenatal care estimates in the NSB5 roughly parallel the trend seen in first trimester prenatal care rates and raise concern about a decline in utilization of prenatal care in the region.

Chapter 6: Maternal
and Child health
North Slope Borough Baseline Community Health Analysis|203
Figure 6.23: Adequate Prenatal Care:* Percent of women delivering live births who received adequate prenatal care, 1977–2009!"#$%&'M)AA*':/&g$2.&';%&12.23'U2%&*'d;&%E&1.'-F'G-R&1'/&3"X&%"1#'3"X&'I"%.57'G5-'%&E&"X&/'2/&g$2.&',%&12.23'E2%&H'(LBBaANNL'
!
AN'
<N'
JN'
>N'
MN'
BN'
KN'
LN'
(NN'
869'
:327Q2'
4&23.5@':327Q217'AN(N'Y2%#&.'
Data source: alaska Bureau of Vital statistics, Birth profiles.
*Defined as an adequacy of prenatal Care utilization (apnCu) index score in the “adequate” or “adequate plus” range (apnCu index >/=80).
6.2.6. Maternal Health and NutritionThe health and nutritional status of a mother can have significant effects on a developing fetus. Maternal health problems such as obesity, high blood pressure, and diabetes can lead to pregnancy complications and, sometimes, health problems for the infant.
6.2.6.1. Maternal ObesityWomen who are overweight or obese are at increased risk for a number of complications during preg-nancy and delivery, including high blood pressure, diabetes, and an increased risk of operative delivery. During 1996–2008, the prevalence of pre-pregnancy overweight or obesity in the mother was almost 60% in the NSB, compared with the statewide average of approximately 40%.32 Each 5-year time period represents data from between 50 and 200 PRAMS survey respondents in the NSB.
Figure 6.24: Prevalence of Pre-Pregnancy Overweight or Obesity: Percent of women (delivering live infants) with pre-pregnancy BMI ≥ 25, 1996–2008
!"#$%&'M)A<*';%&X23&1E&'-F';%&O,%yE@'VX&%G&"#5.'-%'VI&7".@*';&%E&1.'-F'G-R&1'\/&3"X&%"1#'3"X&'"1F21.7]'G".5',%&O,%yE@'9`S'y'A>H''(LLMvANN>';+:`6'/2.2'
!
>B=' >K=' >M=' >B='M(=' MN=' >K=' >K=' >L='
<K=' <L=' J(=' JA=' J<=' JJ=' J>=' JM=' J>='
(LLMOANNN' (LLBOANN(' (LLKOANNA' (LLLOANN<' ANNNOANNJ' ANN(OANN>' ANNAOANNM' ANN<OANNB' ANNJOANNK'
869'
:327Q2'
Data source: alaska pregnancy Risk assessment monitoring system. analysis and data provided by alaska Department of Health and social services, Division of public Health, section of Women’s, Children’s and Family Health.
204|Part II: Full Report|Chapter 6: Maternal and Child Health
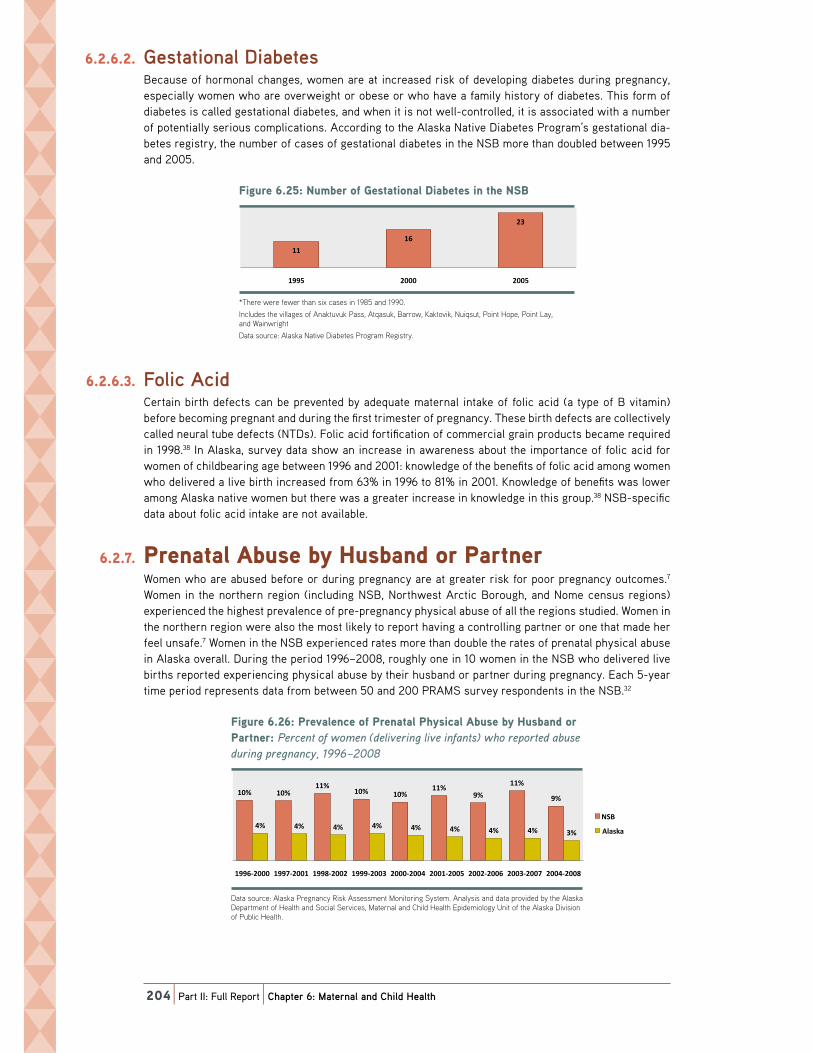
6.2.6.2. Gestational DiabetesBecause of hormonal changes, women are at increased risk of developing diabetes during pregnancy, especially women who are overweight or obese or who have a family history of diabetes. This form of diabetes is called gestational diabetes, and when it is not well-controlled, it is associated with a number of potentially serious complications. According to the Alaska Native Diabetes Program’s gestational dia-betes registry, the number of cases of gestational diabetes in the NSB more than doubled between 1995 and 2005.
Figure 6.25: Number of Gestational Diabetes in the NSB!"#$%&'M)AJ*'8$RI&%'-F'0&7.2."-123'Z"2I&.&7'"1'.5&'869'
!
(('
(M'
A<'
(LL>' ANNN' ANN>'
*there were fewer than six cases in 1985 and 1990.
includes the villages of anaktuvuk pass, atqasuk, Barrow, Kaktovik, nuiqsut, point Hope, point lay, and Wainwright
Data source: alaska native Diabetes program Registry.
6.2.6.3. Folic AcidCertain birth defects can be prevented by adequate maternal intake of folic acid (a type of B vitamin) before becoming pregnant and during the first trimester of pregnancy. These birth defects are collectively called neural tube defects (NTDs). Folic acid fortification of commercial grain products became required in 1998.38 In Alaska, survey data show an increase in awareness about the importance of folic acid for women of childbearing age between 1996 and 2001: knowledge of the benefits of folic acid among women who delivered a live birth increased from 63% in 1996 to 81% in 2001. Knowledge of benefits was lower among Alaska native women but there was a greater increase in knowledge in this group.38 NSB-specific data about folic acid intake are not available.
6.2.7. Prenatal Abuse by Husband or Partner Women who are abused before or during pregnancy are at greater risk for poor pregnancy outcomes.7 Women in the northern region (including NSB, Northwest Arctic Borough, and Nome census regions) experienced the highest prevalence of pre-pregnancy physical abuse of all the regions studied. Women in the northern region were also the most likely to report having a controlling partner or one that made her feel unsafe.7 Women in the NSB experienced rates more than double the rates of prenatal physical abuse in Alaska overall. During the period 1996–2008, roughly one in 10 women in the NSB who delivered live births reported experiencing physical abuse by their husband or partner during pregnancy. Each 5-year time period represents data from between 50 and 200 PRAMS survey respondents in the NSB.32
Figure 6.26: Prevalence of Prenatal Physical Abuse by Husband or Partner: Percent of women (delivering live infants) who reported abuse during pregnancy, 1996–2008
!"#$%&'M)A>*';%&X23&1E&'-F';%&12.23';5@7"E23':I$7&'I@'4$7I21/'-%';2%.1&%*'';&%E&1.'-F'G-R&1'\/&3"X&%"1#'3"X&'"1F21.7]'G5-'%&,-%.&/'2I$7&'/$%"1#',%yE@H'(LLMvANN>';+:`6'/2.2'
!
(N=' (N='((='
(N=' (N='((='
L='
((='
L='
J=' J=' J=' J=' J=' J=' J=' J=' <='
(LLMOANNN' (LLBOANN(' (LLKOANNA' (LLLOANN<' ANNNOANNJ' ANN(OANN>' ANNAOANNM' ANN<OANNB' ANNJOANNK'
869'
:327Q2'
Data source: alaska pregnancy Risk assessment monitoring system. analysis and data provided by the alaska Department of Health and social services, maternal and Child Health epidemiology unit of the alaska Division of public Health.

Chapter 6: Maternal
and Child health
North Slope Borough Baseline Community Health Analysis|205
6.2.8. Teen Birth RatesWhereas the cultural acceptability and support available to teen mothers vary in different cultures, birth to a teenage mother is a risk factor for a number of poor health outcomes for infants and children. Teen (15–19 years) birth rates in the NSB remain more than twice statewide rates, and although teen birth rates have declined slightly in Alaska since the early 1990s, a similar downward trend is not apparent in the NSB.5
Figure 6.27: Teen Birth Rate (Ages 15–19 Years): Number of births per 1000 females, 1993–2009!"#$%&'M)AM*'Y&&1'9"%.5'+2.&'\:#&7'(>v(L'@&2%7]*'8$RI&%'-F'I"%.57',&%'(NNN'F&R23&7H'(LL<aANNL'
!
N'
AN'
JN'
MN'
KN'
(NN'
(AN'
869'
:327Q2'
Data source: alaska Bureau of Vital statistics, Birth profiles.
6.2.9. Family PlanningFamily planning can help increase the likelihood that babies are born to mothers at a time in their lives when they are prepared for parenthood and are able to provide a stable, secure home environment. Ade-quate time between pregnancies can also decrease the likelihood of complications during the subsequent pregnancy and birth.
Among NSB high school students surveyed in the 2005 YRBS, the most common method used to pre-vent pregnancy among both males and females was condoms. Overall, 28% of students who had had sex within the past 3 months reported using no method or being unsure of the method used to prevent pregnancy during their most recent sexual intercourse. Of the students who had had sexual intercourse within the past 3 months, the percentage of NSB high school students reporting the use of birth control pills was significantly lower than in the statewide sample (9.6% vs. 23%, respectively).4
Figure 6.28: Methods Used by NSB High School Students to Prevent Pregnancy*
*among students who had had sexual intercourse within the past 3 months, the method used the most recent time.
Data source: 2005 and 2007 yRBs.
206|Part II: Full Report|Chapter 6: Maternal and Child Health
6.2.10. Breastfeeding The benefits of breastfeeding have been very well documented.39 Breastfed infants have a lower rate post-neonatal infant death and may have reduced rates of SIDS and childhood obesity. Breastfeeding is associated with a decreased incidence of a number child health problems, including meningitis, diar-rheal illness, respiratory tract infection, ear infections, and others. A woman’s decision to initiate or continue breastfeeding may be influenced by a variety of factors, including the attitudes of family, friends, hospital staff, and community, education about breastfeeding benefits, exposure to formula marketing, convenience, physical discomfort, workplace environment, and the availability of breastfeeding support if problems arise.
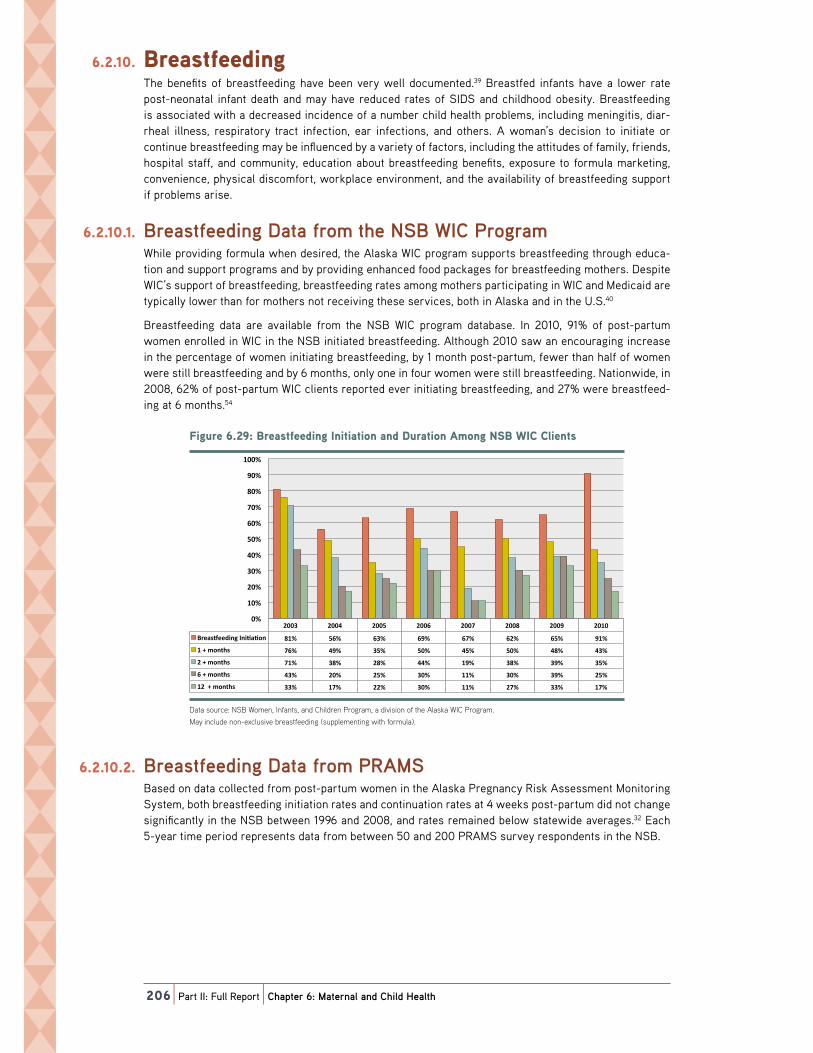
6.2.10.1. Breastfeeding Data from the NSB WIC ProgramWhile providing formula when desired, the Alaska WIC program supports breastfeeding through educa-tion and support programs and by providing enhanced food packages for breastfeeding mothers. Despite WIC’s support of breastfeeding, breastfeeding rates among mothers participating in WIC and Medicaid are typically lower than for mothers not receiving these services, both in Alaska and in the U.S.40
Breastfeeding data are available from the NSB WIC program database. In 2010, 91% of post-partum women enrolled in WIC in the NSB initiated breastfeeding. Although 2010 saw an encouraging increase in the percentage of women initiating breastfeeding, by 1 month post-partum, fewer than half of women were still breastfeeding and by 6 months, only one in four women were still breastfeeding. Nationwide, in 2008, 62% of post-partum WIC clients reported ever initiating breastfeeding, and 27% were breastfeed-ing at 6 months.54
Figure 6.29: Breastfeeding Initiation and Duration Among NSB WIC Clients!"#$%&'M)AK*'9%&27.F&&/"1#'S1"."2."-1'21/'Z$%2."-1':R-1#'869'_SU'U3"&1.7'
!
ANN<' ANNJ' ANN>' ANNM' ANNB' ANNK' ANNL' AN(N'
9%&27z&&/"1#'S1"W2W-1' K(=' >M=' M<=' ML=' MB=' MA=' M>=' L(='
('P'R-1.57' BM=' JL=' <>=' >N=' J>=' >N=' JK=' J<='
A'P'R-1.57' B(=' <K=' AK=' JJ=' (L=' <K=' <L=' <>='
M'P'R-1.57' J<=' AN=' A>=' <N=' ((=' <N=' <L=' A>='
(A''P'R-1.57' <<=' (B=' AA=' <N=' ((=' AB=' <<=' (B='
N='
(N='
AN='
<N='
JN='
>N='
MN='
BN='
KN='
LN='
(NN='
Data source: nsB Women, infants, and Children program, a division of the alaska WiC program.
may include non-exclusive breastfeeding (supplementing with formula).
6.2.10.2. Breastfeeding Data from PRAMSBased on data collected from post-partum women in the Alaska Pregnancy Risk Assessment Monitoring System, both breastfeeding initiation rates and continuation rates at 4 weeks post-partum did not change significantly in the NSB between 1996 and 2008, and rates remained below statewide averages.32 Each 5-year time period represents data from between 50 and 200 PRAMS survey respondents in the NSB.

Chapter 6: Maternal
and Child health
North Slope Borough Baseline Community Health Analysis|207
Figure 6.30: Prevalence of Breastfeeding Initiation: Percent of women (delivering live infants) who reported initiating breastfeeding, 1996–2008 PRAMS data
!"#$%&'M)AL*';%&X23&1E&'-F'9%&27.F&&/"1#'S1"."2."-1*';&%E&1.'-F'G-R&1'\/&3"X&%"1#'3"X&'"1F21.7]'G5-'%&,-%.&/'"1"."2."1#'I%&27.F&&/"1#H'(LLMvANN>';+:`6'Z2.2'
!
BB=' BL=' KN=' KN=' KN=' KN='BB=' BM='
BL='
KK=' KL=' KL=' LN=' LN=' L(=' L(=' L(=' L(='
(LLMOANNN' (LLBOANN(' (LLKOANNA' (LLLOANN<' ANNNOANNJ' ANN(OANN>' ANNAOANNM' ANN<OANNB' ANNJOANNK'
869'
:327Q2'
Data source: alaska pregnancy Risk assessment monitoring system. analysis and data provided by the alaska Department of Health and social services, Division of public Health, section of Women’s, Children’s and Family Health.
A portion of women who initiate breastfeeding are not still breastfeeding at 1 month post-partum, although the majority continue for longer than this. The Healthy Alaskans 2010 target was for at least 80% of women to be breastfeeding at 1 month (4 weeks) after the birth of their babies.
Figure 6.31: Prevalence of Breastfeeding at 4 Weeks: Percent of women (delivering live infants) who reported continuing breastfeeding for at least 4 weeks, 1996–2008 PRAMS data
!"#$%&'M)<N*';%&X23&1E&'-F'9%&27.F&&/"1#'2.'J'_&&Q7*';&%E&1.'-F'G-R&1'\/&3"X&%"1#'3"X&'"1F21.7]'G5-'%&,-%.&/'E-1."1$"1#'I%&27.F&&/"1#'F-%'2.'3&27.'J'G&&Q7H'(LLMvANN>';+:`6'/2.2'
!
>K='
MM=' M>='BN=' ML='
MM='M(=' MA=' MJ='
BM=' BB=' BK=' BL=' BL=' BL=' KN=' KN=' KN='
(LLMOANNN' (LLBOANN(' (LLKOANNA' (LLLOANN<' ANNNOANNJ' ANN(OANN>' ANNAOANNM' ANN<OANNB' ANNJOANNK'
869'
:327Q2'
Data source: alaska pregnancy Risk assessment monitoring system. analysis and data provided by the alaska Department of Health and social services, Division of public Health, section of Women’s, Children’s and Family Health.
6.2.10.3. Breastfeeding in AlaskaAlaska has one of the highest breastfeeding rates in the nation.7 According to PRAMS survey data, a very high proportion of women in Alaska initiate breastfeeding and there is not a significant difference in breastfeeding initiation rates among Alaska Native and non-Native women statewide.7 Rates among WIC participants statewide are only slightly lower: 88% of WIC participants surveyed in the PRAMS survey in 2005 reported having initiated breastfeeding, and 65% reported breastfeeding for at least 8 weeks.40
Analysis of PRAMS data shows the northern region of Alaska to have the lowest breastfeeding initia-tion rates and the largest decline between initiation and 8 weeks post-partum. Only half of women in the northern region were still breastfeeding 8 weeks after delivery. The percentage of Alaskan mothers working or in school at approximately 16 weeks post-partum did not differ appreciably by region or race.7

208|Part II: Full Report|Chapter 6: Maternal and Child Health
Figure 6.32: Breastfeeding Initiation and Continuation at 8 Weeks, by Region: Percent of women (delivering a live infant) who reported breastfeeding, 2004–2005
!"#$%&'M)<(*'9%&27.F&&/"1#'S1"."2."-1'21/'U-1."1$2."-1'2.'K'_&&Q7H'I@'+&#"-1*'';&%E&1.'-F'G-R&1'\/&3"X&%"1#'2'3"X&'"1F21.]'G5-'%&,-%.&/'I%&27.F&&/"1#H'ANNJvANN>';+:`6'/2.2'
!
LM)L'L<)M' LA)J' LN)>' KK)('
KA)B'
BJ)>' BB)A' B>)K'BN)A'
M<)M'
JL)L'
6-$.5&27.' 0$3F'U-27.' 6-$.5G&7.' :1E5-%2#&e`2.O7$' S1.&%"-%' 8V+Y4C+8'
S1"W2W-1'
K'G&&Q7',-7.O,2%.$R'
Data source: mCH 2008 Data Book.
northern Region includes the nsB, nome census area, and northwest arctic Borough.
6.2.11. Access to Healthcare and Other ServicesAs with overall health, maternal and child health depend on access to quality healthcare. In the NSB, health ser-vices for young families are shared by the NSB Health Department and SSMH, operated by ASNA. Well-child vis-its, school screenings, and childhood immunizations are primarily carried out by the NSB Public Health Nursing (PHN) program, with assistance from Community Health Aides. In recent years, PHN well-child visits and immu-nization rates, however, have often not met goals (see Chapter 8: Infectious Disease), in large part because of lack of sufficient staffing. The NSB Health Department also supports the Infant Learning Program for infants and young children with developmental needs, and runs the WIC and Integrated Behavioral Health programs, both of which serve the maternal, child, and teen populations. Prenatal care is currently provided at SSMH, with assis-tance from community health aides for village residents. In Barrow, care for sick children is provided by SSMH providers. In villages, sick-child care typically involves coordination between the community health aide program and providers at SSMH. High-risk pregnancies and children with special healthcare needs require travel to see specialists at Anchorage Native Medical Center and other urban hospitals. As discussed previously in Chapter 1, both the NSB PHN programs and SSMH suffer from chronic healthcare provider shortages and high staff turn-over,34,36,41 impeding efforts to provide continuity of care and develop trusting relationships with young families.
6.2.12. Child Poverty 6.2.12.1. Poverty Rate Estimates for Those Less Than 18 Years of Age
Experiencing poverty during childhood adversely affects health over a lifetime.42 Child poverty estimates have fluctuated widely in the NSB over the past two decades. Nationally-set poverty levels do not cur-rently take into account regional differences in cost of living.
Figure 6.33: Child Poverty: Percent of residents under age 18 years estimated to be living below the federal poverty level, 1989–2009
!"#$%&'M)<A*'U5"3/';-X&%.@*';&%E&1.'-F'%&7"/&1.7'$1/&%'2#&'(K'@&2%7'&7."R2.&/'.-'I&'3"X"1#'I&3-G'.5&'F&/&%23',-X&%.@'3&X&3H'(LKLaANNL'
!
N='
>='
(N='
(>='
AN='
869'
:327Q2'
Data source: u.s. Census Bureau small area income and poverty estimates (saipe).

Chapter 6: Maternal
and Child health
North Slope Borough Baseline Community Health Analysis|209
In 2008, the NSB fared better than most other rural regions of the state.44 In 2009, child poverty estimates decreased further in the NSB, as seen in Figure 6.33.
Table 6.2: Child Poverty: Estimated Percent of Residents Under Age 18 Years Living in Poverty, by Region, 2008
% Children in Poverty Error Margin
Wade Hampton 38% 28–47%
yukon-Koyukuk 34% 25–43%
Bethel 29% 22–35%
Dillingham 27% 19–34%
lake and peninsula 26% 19–33%
nome 26% 20–33%
prince of Wales-outer Ketchikan 22% 16–27%
skagway-Hoonah-angoon 19% 16–22%
southeast Fairbanks 19% 14–24%
northwest arctic 18% 13–23%
yakutat 17% 12–21%
Haines 16% 12–21%
Wrangell-petersburg 14% 10–18%
Kenai peninsula 13% 10–16%
aleutians east 12% 9–15%
Bristol Bay 12% 8–15%
matanuska-susitna 12% 9–15%
north slope 12% 9–16%
Ketchikan Gateway 11% 8–14%
anchorage 10% 8–12%
sitka 10% 7–12%
Valdez-Cordova 10% 8–13%
Fairbanks north star 9% 7–12%
Juneau 9% 7–11%
Kodiak island 9% 7–12%
aleutians West 8% 6–11%
Denali 8% 6–10%
Data source: County Health Rankings (citing data from saipe).
6.2.12.2. Free and Reduced Lunch Program Eligibility RatesThe percentage of children eligible for free and reduced lunch gives a reasonable estimate of the number of children living in families with household incomes less than 185% of the poverty level.
In 2011, 44% of students enrolled in the NSB School District were eligible for the Free or Reduced Lunch program. Roughly one-third of Alaska school districts had lower percentages and two-thirds had higher percentages of students eligible for the program.45

210|Part II: Full Report|Chapter 6: Maternal and Child Health
Table 6.3: Free and Reduced Lunch Program Eligibility: District Comparisons
Percent of Enrolled Students Eligible for Free or Reduced Lunch
2010 2011
st. mary’s school District 88% 92%
Bering strait school District 87% 88%
yupiit school District 91% 88%
Hydaburg City school District 94% 85%
southwest Region schools 91% 85%
yukon Koyukuk school District 82% 85%
alaska Gateway schools 90% 84%
yakutat school District 76% 81%
annette island school District 73% 79%
Kashunamuit school District 75% 77%
Kuspuk school District 76% 77%
lower Kuskokwim schools 72% 77%
lower yukon school District 67% 76%
Craig City schools 77% 75%
iditarod area schools 64% 75%
Klawock City schools 72% 74%
northwest arctic Borough school 72% 74%
Kake City schools 68% 73%
yukon Flats school District 74% 72%
Chatham school District 70% 71%
lake peninsula school District 66% 68%
Dillingham City schools 71% 64%
nome public schools 68% 64%
southeast island school District 72% 62%
Wrangell public schools 59% 61%
Haines Borough schools 60% 59%
aleutians east Borough schools 56% 58%
Hoonah City schools 68% 58%
mt. edgecumbe High school 40% 51%
Galena City schools 46% 48%
petersburg public schools 50% 47%
Kodiak island Borough schools 43% 45%
Cordova public schools 45% 44%
north slope Borough school District 45% 44%
Bristol Bay Borough schools 43% 43%
Copper River school District 43% 43%
nenana City public schools 26% 43%
Kenai peninsula school District 37% 42%
Delta Greely school District 38% 40%
anchorage school District 37% 39%
matanuska-susitna Borough school District 36% 37%
Ketchikan Gateway schools 33% 36%
sitka Borough school District 27% 33%
Fairbanks north star Borough schools 28% 30%

Chapter 6: Maternal
and Child health
North Slope Borough Baseline Community Health Analysis|211
Table 6.3: Free and Reduced Lunch Program Eligibility: District Comparisons
Percent of Enrolled Students Eligible for Free or Reduced Lunch
2010 2011
Juneau school District 22% 27%
unalaska City school District 17% 25%
Valdez City schools 25% 25%
skagway City schools 14% 8%
Data source: state of alaska Department of education and early Development: Child nutrition services, national school lunch program.
Within the NSB School District, the percentage of students eligible for the Free or Reduced Lunch pro-gram varied quite widely among the village schools, from 25% in Nuiqsut to 81% in Wainwright in 2011.45
Table 6.4: Free and Reduced Lunch Program Eligibility: NSB Village School Comparisons
Percent of Enrolled Students Eligible for Free or Reduced Lunch
2010 2011
alak school (Wainwright) 77% 81%
Harold Kaveolook school (Kaktovik) 82% 79%
nunamiut school (anaktuvuk pass) 63% 67%
tikigaq school (point Hope) 75% 63%
meade River school (atqasuk) 58% 49%
Kiita learning Center (Barrow) 35% 40%
ipalook elementary school (Barrow) 30% 35%
Kali school (point lay) 39% 33%
Barrow High school (Barrow) 29% 32%
eben Hopson sr. memorial middle school (Barrow) 32% 32%
nuiqsut trapper school (nuiqsut) 34% 25%
Data source: state of alaska Department of education and early Development: Child nutrition services, national school lunch program.
6.2.13. Family Violence and Child Maltreatment Child maltreatment is discussed previously in this chapter as a significant children’s health problem in itself. It is also a major contributor to the early childhood environment and a determinant of both chil-dren’s and overall health status. Being in an unsafe home environment or witnessing violence among other family members has profound impacts on children’s health, increasing the immediate risk of harm as well as the long-term risk for lifelong physical and mental health problems.
6.2.14. Physical Environment and Child Safety Many common health problems among children—asthma and respiratory infections, injury, obesity, birth defects—are influenced by the physical environment in which a child lives. Examples include such factors as inadequate housing, indoor and outdoor air pollution, household and environmental toxins, unsafe or inadequate water supply or waste disposal, and unsafe or inadequate space for recreation and physical activity. Relevant data on the physical environment in the NSB are reviewed in Chapter 1: Overall Health.
Specific safety practices have been shown to affect the risk of childhood injuries and death. Some examples include the use of bike and off-road vehicle helmets, personal floatation devices and seatbelts; childproofing efforts in the home; firearm safety practices; and the use of smoke and carbon monoxide detectors. Plac-ing infants on their backs to sleep and avoiding co-sleeping with an alcohol- or drug-impaired adult are important safety practices that have been shown to decrease the risk for SIDS.7 Awareness of proper infant sleep position has improved in Alaska following the initiation of the “Back to Sleep” campaign in 1996, and in
Table 6.3, continued
212|Part II: Full Report|Chapter 6: Maternal and Child Health
2005, 70% of Alaskan mothers placed their infants on their backs to sleep. There was no significant differ-ence between Alaska Native and non-Native mothers in this practice.7 To the author’s knowledge, no NSB-specific data are available at this time regarding infant sleep position, although in the 1990s, the North Slope undertook a major campaign to reduce SIDS deaths through community education and a crib loan program.34
6.2.15. Child Nutrition and Food Security Reliable access to healthy foods is extremely important to children’s health and development. The term “food security” refers to the ability to procure enough food, at all times, for an active healthy life for all household members. NSB households, particularly Iñupiat households, reported high levels of food inse-curity in the 2010 NSB Census, as discussed in Chapter 1: Overall Health.
“Research indicates the following negative outcomes are associated with food insecurity among children: poor health status; more frequent colds, ear infections, and other health problems; greater incidence of hospitalization; higher levels of aggression, hyperactivity, and anxiety as well as passivity; difficulty get-ting along with other children, and increased need for mental health services; impaired cognitive func-tioning and diminished capacity to learn; lower test scores and poorer overall school achievement; and increased likelihood of repeating a grade, school absences, tardiness, and school suspension.”46 Food insecurity, paradoxically, may also contribute to child obesity because families who do not have enough food tend to choose less expensive, high-calorie foods with low nutrients.46
The high rates of children being overweight and obese in the NSB are discussed earlier in this chapter. Typically, excess calories are in the form of “empty” calories, offering little or no nutritional value. Sugar-sweetened beverages such as soda pop and sugared fruit drinks are estimated to contribute an additional 172 calories daily to the average child’s diet in the U.S.47 The high levels of consumption of sodas and other sugared beverages reported in the 2010 NSB Census are discussed in Chapter 1: Overall Health. Although data were not collected on consumption among NSB children, reported consumption levels were highest among younger household heads, and the high level of consumption of sugared bever-ages among household heads is likely a marker for high consumption among other household members, including children. Between 2003 and 2009, 16% of NSB children aged 2–5 years enrolled in WIC were actively identified as at-risk because of a parent reporting routinely feeding them sugar-containing flu-ids.22 Based on statewide estimates, 2010 NSB Census data for adults, and anecdotal reports, however, this estimate likely considerably underestimates the true level of sugared beverage consumption among preschool-aged children in the NSB.
The lack of specific nutrients can result in health problems in children. One nutrient commonly found to be deficient among children is vitamin D. Vitamin D deficiency leads to bone disorders such as rickets, and may also increase the risk of tuberculosis, dental caries, and autoimmune disorders.48 People living at northern latitudes and those with darker skin are at increased risk for vitamin D deficiency. Vitamin D deficiency has been found to be common in Alaskan children, particularly among those who are breastfed, and routine supplementation of breastfed infants with vitamin D is recommended.48 The NSB WIC office provides breastfed infants with a 1-month supply of infant vitamins containing vitamin D at the first post-partum visit only.49 Data on the prevalence of vitamin D deficiency are not available for NSB children. Iron deficiency is also extremely common among rural Alaskan children, particularly in the northern and southwestern regions.28 The cause of the low iron stores among rural Alaskan children is not entirely understood and is probably not caused by a single factor.28 Helicobacter�pylori infection has been shown to be associated with iron-deficiency anemia among school-aged children in southwest Alaska;50 however, observed patterns make either nutritional deficiency or H.�pylori infection unlikely to be the sole etiology of the high prevalence of anemia in rural Alaska.29 Among young children, persistent prenatal effects appear to contribute to high rates of iron-deficiency and anemia in children up to at least age 5 years.51
6.2.16. Education Adequate intellectual and social stimulation from early childhood through adolescence is necessary for optimal child development and health. Whereas a nurturing home environment is crucial, quality educa-tion at the preschool through high school level can also support healthy development and improve health and social outcomes later in life.52 Higher levels of educational attainment are associated with better overall health throughout the lifespan, particularly when this education is culturally affirming. Education in the NSB is discussed in Chapter 1: Overall Health.
Chapter 6: Maternal
and Child health
North Slope Borough Baseline Community Health Analysis|213
Chapter 6 Endnotes1. Healthy�Alaskans�2010�Volume�I::�Targets�and�Strategies�for�Improved�Health:�Targets�for�Improved�Health, Alaska
Department of Health and Social Services, Division of Public Health, November 2005. Available online at http://www.hss.state.ak.us/DPH/targets/ha2010/default.htm.
2. North Slope Borough, 2010 Economic and Census Profile, Department of Planning and Community Services (forthcoming).
3. National Survey of Children’s Health, 2007. Accessed online through the Data Resource Center for Child and Adolescent Health at http://www.childhealthdata.org.
4. Alaska Youth Risk Behavior Survey (YRBS): http://www.hss.state.ak.us/dph/chronic/school/YRBSresults.htm. NSB-specific data from 2005 survey was provided courtesy of the NSB School District. Weighted state-level data are not available from the 2005 survey, so the 2007 survey was used for statewide estimates.
5. Alaska Bureau of Vital Statistics (ABVS): http://www.hss.state.ak.us/dph/bvs/data/default.htm.
6. National Center for Health Statistics, accessed through the National MCH Center for Child Death Review (http://www.childdeathreview.org/home.htm). Child mortality statistics for the U.S. are typically calculated for age groups excluding infants under one, and are, therefore,not directly comparable to Alaska census area data, where population estimates for children under age one are not readily available.
7. Alaska Maternal and Child Health Data Book 2008: Health Status Edition. http://www.epi.alaska.gov/mchepi/mchdatabook/2008.htm.
8. Focus�On:�Infants�(Birth–1): Alaska FY 2010 Title V Needs Assessment. Section of Women’s, Children’s, and Family Health: Special Summary, January 2010. Accessed online at http://www.hss.state.ak.us/dph/wcfh/titleV/assets/Infants_16Dec09.pdf
9. Infant�and�Fetal�Mortality�in�Alaska. Women’s, Children’s, and Family Health Title V Fact Sheet: Needs Assessment Update. Vol.2, No. 3, June 2007. Accessed online at http://www.epi.alaska.gov/mchepi/pubs/facts/na/Vol2_Num03.pdf.
10. Mathews, T.J., and M.F. MacDorman: Infant mortality statistics from the 2004 period linked birth/infant death data set. National�Vital�Statistics�Report 55, no 14. (2007) National Center for Health Statistics.
11. National Center for Health Statistics: National Infant Mortality Rate, Preterm Birth, and Low Birth Weight trends. Retrieved February 19, 2009 from www.marchofdimes.com/peristats.
12. Preterm Birth: Causes, consequences, and Prevention: Institute of Medicine Report Brief. July 2006. Accessed online at http://www.iom.edu/Reports/2006/Preterm-Birth-Causes-Consequences-and-Prevention.aspx.
13. Preterm Birth Trends—Alaska, 1989–2006: State of Alaska Epidemiology Bulletin No. 12. May 2, 2008. Accessed online at http://www.epi.alaska.gov/bulletins/docs/b2008_12.pdf.
14. High�Prevalence�of�Major�Congenital�Anomalies�in�Alaska,�1996–2002. State of Alaska Epidemiology Bulletin. No 16, July 14, 2008. Accessed online at http://www.epi.hss.state.ak.us/bulletins/docs/b2008_16.pdf.
15. Alaska Birth Defects Registry: NSB-specific data from the registry were provided by Gessner, B.: Alaska Department of Health and Social Services, Maternal and Child Health Epidemiology Unit.
16. Alaska Maternal and Child Health Data Book 2005: Birth Defects Surveillance Edition. Accessed online at http://www.epi.alaska.gov/mchepi/pubs/databook/2005/MCHDataBook05.pdf.
17. Office of Children’s Services, Alaska Department of Health and Social Services: http://www.hss.state.ak.us/OCS/Statistics/default.htm.
18. Gessner, B.D., M. Moore, B. Hamilton, and P. Muth: The incidence of infant physical abuse in Alaska. Child�Abuse�and�Neglect 28, no. 1, (2004): 9–23.
19. Childhood�Obesity�in�Alaska:�Alaska Department of Health and Social Services. March, 2009. Accessed online at http://www.hss.state.ak.us/dph/chronic/obesity/pubs/Childhood_Obesity.pdf.
20. Preventing Childhood Obesity: Health in the Balance (2005). The National Academies Press. Accessed online at http://www.nap.edu/openbook.php?record_id=11015.
21. North Slope Borough Public Health Nursing program Resource Patient Management System (RPMS): Data provided for this report on request by the NSB PHN program manager, August, 2009.
22. North Slope Borough Women, Infants and Children (WIC) Program, a division of the Alaska WIC Program: Upon request, WIC personnel queried the WIC program database for breastfeeding initiation and duration rates, low hemoglobin rates (USDA Risk 201), and BMI or Weight-for-Stature >95th percentile for age and gender (USDA risk 113), for the years 2003–2009.
23. Arctic Slope Native Association Barrow Dental Clinic: February 22nd to 26th Sealant Clinic Report: Prepared by Medlin, K.: Provided for this report by Gaynor-Ashley, A. Program Director, March, 2010.
24. Indian Health Service National Patient Information and Reporting System/National Data Warehouse (NPIRS/NDW): Department of Health and Human Services, Indian Health Services. http://www.ihs.gov/CIO/DataQuality/warehouse/.

214|Part II: Full Report|Chapter 6: Maternal and Child Health
25. Alaska�Oral�Health�Assessment�Summary�Report�2004–2005: State of Alaska Department of Health and Social Services, Division of Public Health, Oral Health Program. http://www.hss.state.ak.us/dph/wcfh/oralhealth/docs/OHAssessment_0405.pdf.
26. An�Oral�Health�Survey�of�American�Indian�and�Alaska�Native�Dental�Patients:�Findings,�Regional�Differences�and�National�Comparisons. Indian Health Service. Accessed online at http://www.hss.state.ak.us/dph/wcfh/oralhealth/docs/Oral_Health_1999_IHS_Survey.pdf.
27. Eden, A.N., and M.A. Mir: Iron Deficiency in 1- to 3-year-old children. A pediatric failure? Archives�of�Pediatric�Adolescent�Medicine 151, no. 10 (1997): 986–988.
28. Gessner, B.D.: Geographic and racial patterns of anemia prevalence among low-income Alaskan children and pregnant or postpartum women limit potential etiologies. Journal�of�Pediatric�Gastroenterology�and�Nutrition 48, no. 4 (2009): 475–481.
29. Alaska�Native�Maternal�and�Child�Health:�Trends�and�Data. Prepared by the Alaska Native Epidemiology Center, Division of Community Health Services, Alaska Native Tribal Health Consortium. September, 2008. http://www.anthc.org/chs/epicenter/upload/anmchdatabook.pdf.
30. Blabey, M.H., and B.D. Gessner: Three maternal risk factors associated with elevated risk of post-neonatal mortality among Alaska Native population. Maternal�Child�Health�Journal�13, no.2 (2009): 222–230.
31. CDC�Features:�Children�and�Secondhand�Smoke�Exposure. Centers for Disease Control and Prevention Accessed online at http://www.cdc.gov/Features/ChildrenAndSmoke/.
32. Alaska Pregnancy Risk Assessment Monitoring System (PRAMS): (http://www.epi.alaska.gov/mchepi/PRAMS/default.stm). NSB-specific data for this report was provided for the years 1996–2008 by the Alaska Department of Health and Social Services, Maternal and Child Health Epidemiology Unit of the Alaska Division of Public Health.
33. Perham-Hester, K.A., and B.D. Gessner: Correlates of drinking during the third trimester of pregnancy in Alaska. Maternal�and�Child�Health�Journal 1, no. 3 (1997): 165–172.
34. Lewis, M.: Former Deputy Director, NSB Department of Health and Social Services. Personal Communication, June, 2010.
35. North Slope Borough Health Department, Community Health Aide Program: Structured interviews with health aides from NSB villages, March 2010.
36. Patterson, D.: Director of Nursing, Samuel Simmonds Memorial Hospital, Barrow, Alaska. Personal communication, March 2010.
37. North Slope Borough Health Department, Community Health Aide Program: Village Clinic Monthly Reports, 2005–2008, courtesy of the NSB Health Department CHAP program.
38. Decline�in�the�Prevalence�of�Neural�Tube�Birth�Defects,�Alaska,�1996–2004.�State of Alaska Epidemiology Bulletin. No. 15. April 21, 2005. Accessed online at http://www.epi.alaska.gov/bulletins/docs/b2005_15.pdf.
39. Benefits�of�Breastfeeding: California Women, Infants, and Children. Accessed online at http://www.cdph.ca.gov/programs/breastfeeding/Documents/MO-BF-Benefits.pdf.
40. Breastfeeding�in�Alaska. Women’s, Children’s, and Family Health. Title V Fact Sheet: Needs Assessment Update Vol. 2, No. 2. May 2007. Accessed online at http://www.epi.alaska.gov/mchepi/pubs/facts/na/Vol2_Num02.pdf
41. Villanueva, T.: Clinical Director, Samuel Simmonds Memorial Hospital, Barrow, Alaska. Personal communication, March 2010.
42. Marmot, M., and R. Wilkinson: Social�Determinants�of�Health, Second Edition, Oxford University Press, 2006.
43. U.S. Census Bureau Small Area Income and Poverty Estimates (SAIPE): http://www.census.gov//did/www/saipe/.
44. County Health Rankings: Mobilizing Action Toward Community Health, a project of the Robert Wood Johnson Foundation and the University of Wisconsin Population Health Institute. Accessed online at: http://www.countyhealthrankings.org/.
45. State of Alaska Department of Education and Early Development: Child Nutrition Services: national School Lunch Program. Accessed online at http://www.eed.state.ak.us/tls/cns/nslp.html.
46. Food�Insecurity�in�Alaska.�Alaska Division of Public health Section of Chronic Disease Prevention and Health Promotion, Chronicles Volume 1, Issue 4, August 2008. Accessed online: http://www.hss.state.ak.us/dph/chronic/pubs/assets/ChroniclesV1-4.pdf.
47. Brownell, K.D., T. Farley, W.C. Willett, B.M. Popkin, F.J. Chalouplka, J.W. Thompson, and D.S. Ludwig: The Public Health and Economic Benefits of Taxing Sugar-Sweetened Beverages. The�New�England�Journal�of�Medicine 362, no. 13 (2010): 1250.
48. Vitamin�D�Deficiency�is�Common�Among�Otherwise�Healthy�Alaskan�Children. State of Alaska Epidemiology Bulletin No. 37, December 11, 2003.
49. Christiansen, W.: Former coordinator NSB Women, Infants, and Children program. Person communication, December 2009.
50. Baggett, H.C., A.J. Parkinson, P.T. Muth, B.D. Gold, and B.D. Gessner: Endemic iron deficiency associated with Helicobacter�Pylori infection among school-aged children in Alaska. Pediatrics 117, no.3 (2006): e396–e404.
Chapter 6: Maternal
and Child health
North Slope Borough Baseline Community Health Analysis|215
51. Gessner, B.D.: Early childhood hemoglobin level is a strong predictor of hemoglobin levels during later childhood among low-income Alaska children. International�Journal�of�Circumpolar�Health�68, no. 5 (2009): 459–470.
52. The�Social�Determinants�of�Health:�Early�Childhood�Education�and�Care�as�a�Determinant�of�Health.�Summary by Friendly, M., and G. Browne: Public Health Agency of Canada. Accessed online at http://www.phac-aspc.gc.ca/ph-sp/oi-ar/07_ecec-eng.php.
53. Decline in the Birth Prevalence of FAS in Alaska. Alaska�Birth�Defects�Monitor, III, no. 2. July 2010. State of Alaska Department of Health and Social Services/Division of Public health/Section of Women’s, Children’s and Family Health/MCH Epidemiology Unit. Accessed online at http://www.epi.alaska.gov/mchepi/pubs/monitor/ABDR_2010_02.pdf.
54. Pediatric Nutrition Surveillance 2008 Report. U.S. Department of Health and Human Services and Centers for Disease Control and Prevention. Accessed online at http://www.cdc.gov/pednss/pdfs/PedNSS_2008.pdf.
