chapter 6 measuring national output and national income new edition/class/cha… · • national...
TRANSCRIPT

Chapter 6Chapter 6Measuring National OutputMeasuring National Output
and National Incomeand National Income
KazuKazu MatsudaMatsudaBIZ 203BIZ 203
MacroeconomicsMacroeconomics

MEASURING NATIONAL OUTPUT AND NATIONAL INCOMEMEASURING NATIONAL OUTPUT AND NATIONAL INCOME• National income and product accounts = Data collected and published by the government describing the various components of national income and output in the economy.

= The total market value of all final goods and services produced within a given period by factors of production located within a country.
Principles ofPrinciples of ??
[1] [1] ??
?? = Goods and services produced for final use.
= Goods that are produced by one firm for use in further processing by another firm.

Wheels & Tires = $4,000. Suspension & Steering &
Transmission & Brake & Body = $6,000
Interior = $5,000Glass = $2,000Assembly and Engine =
$7,000Retail Sale = $30,000

•• ? ? = The difference between the value of goods as they leave a stage of production and the cost of the goods as they entered that stage.
Value of Sales Value added• Parts $17,000 $• Assembly and Engine $24,000 $• Retail Sale $30,000 $
• In calculating GDP, we can either
• We do not use the value of total sales in an economy to measure how much output has been produced.

[2] Exclusion of used goods & Paper transactions [2] Exclusion of used goods & Paper transactions PrinciplePrinciple
GDP is concerned only with ? .
House
Stocks, bondsAFL

[3] Exclusion of Output Produced Abroad by [3] Exclusion of Output Produced Abroad by Domestically Owned Factors of ProductionDomestically Owned Factors of Production
GDP is the value of output produced by factors of production located ? .
•The output produced by US citizen abroad ? counted in US GDP because the output is not produced within the US. •Profits earned abroad by US companies ? counted in US GDP. •The output produced by foreigners working in the US ?counted in US GDP because the output is produced within the US. •Profits earned in the US by foreign-owned companies ?counted in US GDP.
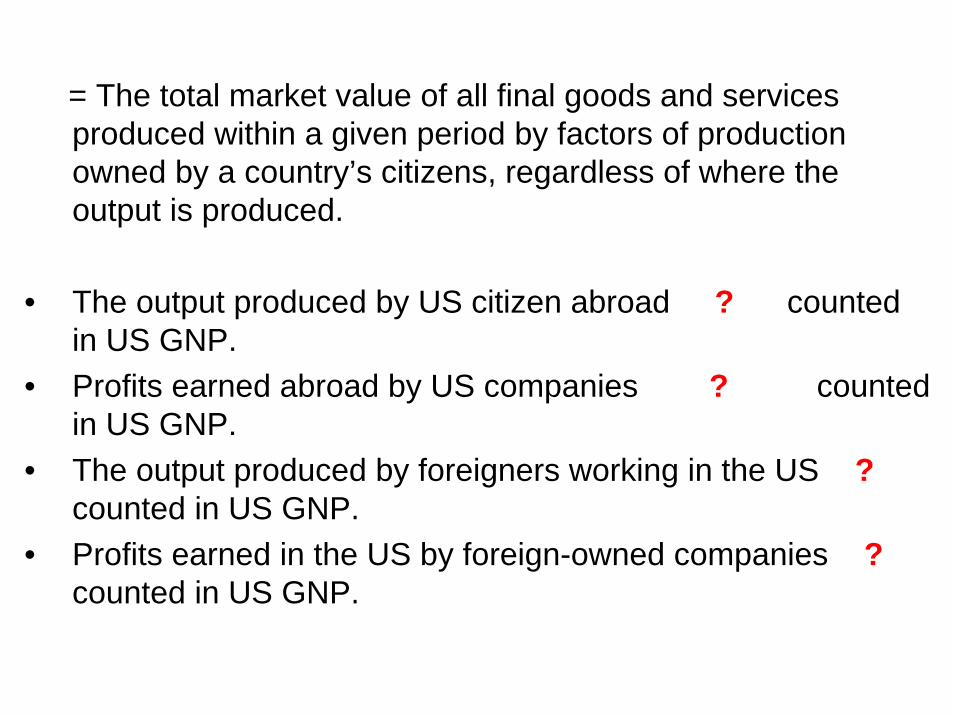
= The total market value of all final goods and services produced within a given period by factors of production owned by a country’s citizens, regardless of where the output is produced.
• The output produced by US citizen abroad ? counted in US GNP.
• Profits earned abroad by US companies ? counted in US GNP.
• The output produced by foreigners working in the US ?counted in US GNP.
• Profits earned in the US by foreign-owned companies ?counted in US GNP.

For most countries, the difference between GDP and GNP is ? . 2004: U.S. GNP = $11,788 billion, U.S. GDP = $11,734 billion.2007: U.S. GNP = $13,937 billion, U.S. GDP = $13,841 billion.
Profit by U.S. GDP U.S. GNPAmerican Honda Motor Co. Nintendo of AmericaToshiba America, Inc.Hitachi America, Ltd. Matsuda’s Paycheck
McDonald’s JapanStarbucks JapanMSFT JapanCoca Cola JapanKFC China

CALCULATING GDPCALCULATING GDP= A method of computing GDP that
measures the amount spent on all final goods during a given period.
= A method of computing GDP that measures the income—wages, rents, interest, and profits—received by all factors of production in producing final goods.
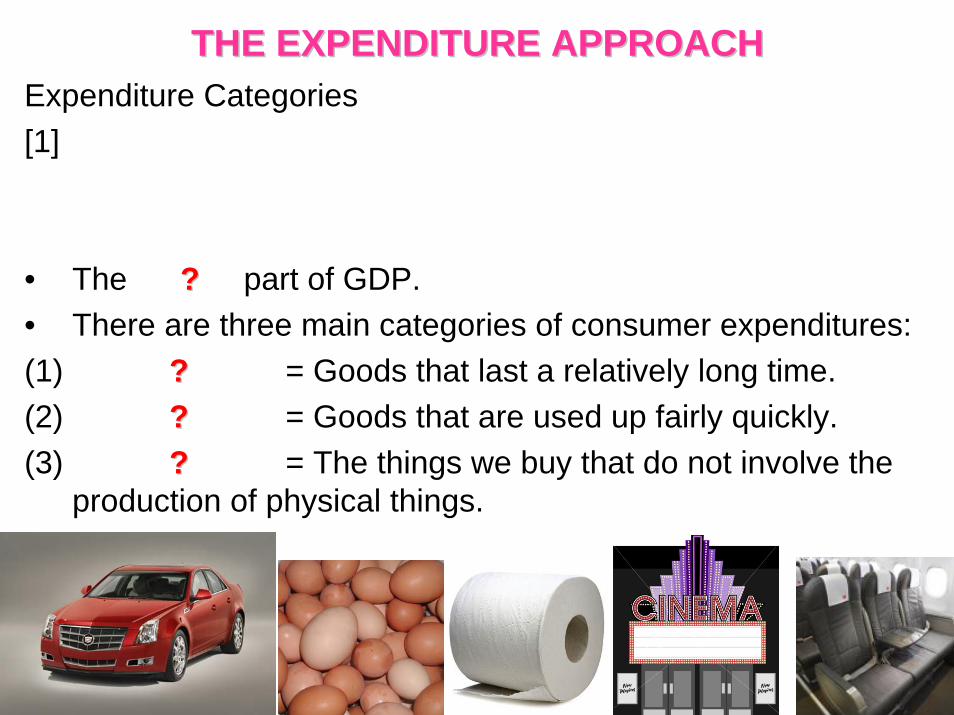
THE EXPENDITURE APPROACHTHE EXPENDITURE APPROACHExpenditure Categories[1]
• The ?? part of GDP. • There are three main categories of consumer expenditures:(1) ?? = Goods that last a relatively long time. (2) ?? = Goods that are used up fairly quickly.(3) ?? = The things we buy that do not involve the
production of physical things.

Expenditure Categories[2]
(1) ?? = Expenditures by firms for machines, tools, plants.
(2) ?? = Expenditures by households and firms on new houses and apartment buildings.
(3) ?? = The amount by which firm’s inventories change during a period. Inventories are the goods that firms produce now but intend to sell later.
THE EXPENDITURE APPROACHTHE EXPENDITURE APPROACH
GDP is not the market value of total ?? during a period – it is the market value of total ? ? .

THE EXPENDITURE APPROACHTHE EXPENDITURE APPROACHExpenditure Categories[3]
•Expenditures by ?? governments for final goods and services.•Final goods: •Services:

THE EXPENDITURE APPROACHTHE EXPENDITURE APPROACHExpenditure Categories[4]

U.S. Exports & U.S. ImportsU.S. Exports & U.S. ImportsList of countries by exports
List of the largest trading partners of the United States
Balance of Trade
List of countries by current account balance

TABLE 6.2 Components of U.S. GDP, 2007: The Expenditure Approach
Billions Of Dollars Percentage of GDP
Personal consumption expenditures (C)
9,734.2 70.3
Durable goods 1,078.2 7.8Nondurable goods 2,833.2 20.5Services 5,822.8 42.1
Gross private domestic investment (l) 2,125.4 15.4
Nonresidential 1,481.8 10.7Residential 640.7 4.6Change in business inventories 2.9 0.0
Government consumption and gross investment (G)
2,689.8 19.4
Federal 976.0 7.1State and local 1,713.8 12.4
Net exports (EX – IM) −708.0 − 5.1Exports (EX) 1,643.0 11.9Imports (IM) 2,351.0 17.0
Gross domestic product 13,841.3
100.0

? ? = The total income earned by the factors of production owned by a country’s citizens.
•• ? ? = Includes wages, salaries, and various supplements—employer contributions to social insurance and pension funds, for example—paid to households by firms and by the government.
•• Indirect taxes minus subsidiesIndirect taxes minus subsidies = Taxes such as sales taxes, customs duties, and license fees, less subsidies that the government pays for which it receives no goods or services in return.
THE INCOME APPROACHTHE INCOME APPROACH

TABLE 6.3 National Income, 2007
Billions ofDollars
Percentage of National Income
National Income 12,221.1
100.0
Compensation of employees 7,874.2 64.4Proprietors’ income 1,042.6 8.5
Rental income 65.4 0.5
Corporate profits 1,598.2 13.1
Net interest 602.6 4.9
Indirect taxes minus subsidies 961.4 7.9
Net business transfer payments 94.2 0.8Surplus of government enterprises −14.5 −0.1

TABLE 6.4 GDP, GNP, NNP and National Income, 2007
Dollars(Billions)
GDP 13,841.3
Plus: Receipts of factor income from the rest of the world + 817.5
Less: Payments of factor income to the rest of the world − 721.8
Equals: ?? 13,937.1Less: Depreciation − 1,686.6
Equals: ?? 12,250.5
Less: Statistical discrepancy − 29.4
Equals: ?? 12,221.1
Source: See Table 6.2.

•• Net national product (NNP)Net national product (NNP) = Gross national product minus depreciation; a nation’s total product minus what is required tomaintain the value of its capital stock.
Statistical discrepancyStatistical discrepancy = Data measurement error.
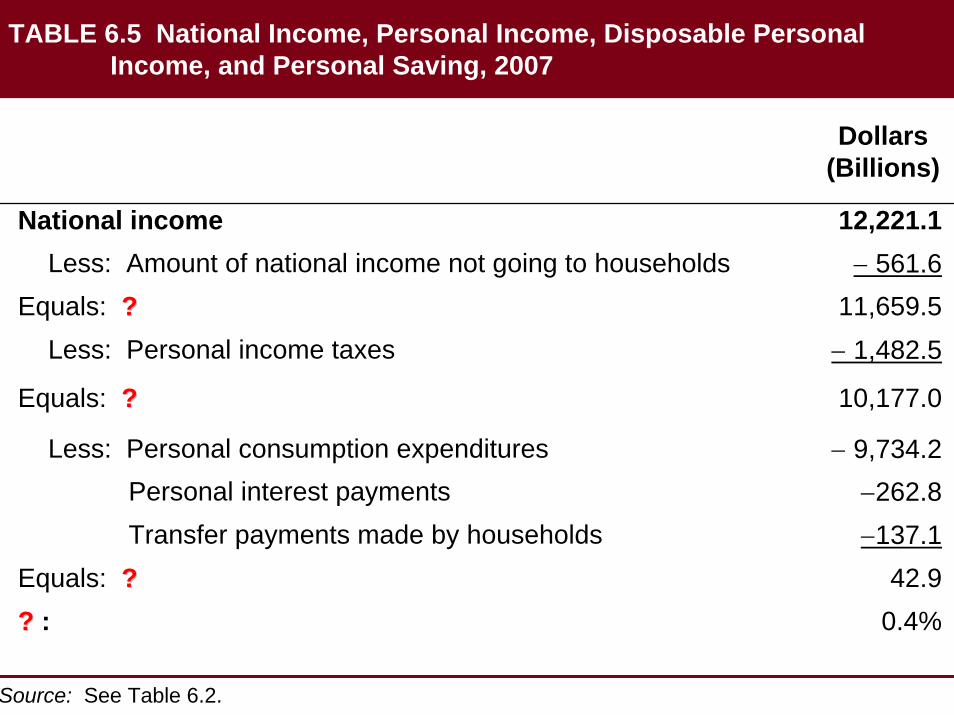
TABLE 6.5 National Income, Personal Income, Disposable PersonalIncome, and Personal Saving, 2007
Dollars(Billions)
National income 12,221.1Less: Amount of national income not going to households − 561.6
Equals: ?? 11,659.5Less: Personal income taxes − 1,482.5
Equals: ?? 10,177.0
Less: Personal consumption expenditures − 9,734.2Personal interest payments −262.8Transfer payments made by households −137.1
Equals: ?? 42.9?? : 0.4%
Source: See Table 6.2.

Oct-08 2.9Nov-08 3.8Dec-08 4.7Jan-09 4.4Feb-09 3.4Mar-09 3.5Apr-09 4.5May-09 6Jun-09 4.5Jul-09 4.2Aug-09 3.9Sep-09 4.6Oct-09 4.4

NOMINAL VERSUS REAL GDPNOMINAL VERSUS REAL GDP?? = The current prices that one pays for goods and services.
? ? = Gross domestic product measured in current dollars.
Real GDPReal GDP =
2007 2008 Output 10 15Price level $1 $4Nominal GDP
NOMINAL VERSUS REAL GDPNOMINAL VERSUS REAL GDP• All the main issues involved in computing real GDP can be discussed using a simple three-good economy and 2 years.
VS

TABLE 6.6 A Three-Good Economy
(1) (2) (3) (4) (5) (6) (7) (8)
GDP IN GDP IN GDP IN GDP IN
YEAR 1 YEAR 2 YEAR 1 YEAR 2
IN IN IN IN
PRODUCTION PRICE PER UNIT YEAR 1 YEAR 1 YEAR 2 YEAR 2
YEAR1 YEAR 2 YEAR1 YEAR 2 PRICES PRICES PRICES PRICES
Q1 Q2 P1 P2 P1 x Q1 P1 x Q2 P2 x Q1 P2 X Q2
Tea 6 11 $.50 $ .40
VS 7 4 .30 1.00
Car 10 12 .70 .90
Total

The procedure that the BEA used prior to 96 was to pick a base year and to use the prices in that base year as weights to calculate real GDP. This is a fixed-weight procedure because the weights used, which are the prices, are the same for all years – the prices that prevailed in the base year.
New Procedure: Calculating Real GDP GrowthNew Procedure: Calculating Real GDP Growth[1] Split the difference.
[2] Change of base year.

NOMINAL VERSUS REAL GDPNOMINAL VERSUS REAL GDPCALCULATING THE GDP DEFLATORCALCULATING THE GDP DEFLATOR• The GDP deflator is one measure of the overall price level.

TABLE 6.6 A Three-Good Economy
(1) (2) (3) (4) (5) (6) (7) (8)
GDP IN GDP IN GDP IN GDP IN
YEAR 1 YEAR 2 YEAR 1 YEAR 2
IN IN IN IN
PRODUCTION PRICE PER UNIT YEAR 1 YEAR 1 YEAR 2 YEAR 2
YEAR1 YEAR 2 YEAR1 YEAR 2 PRICES PRICES PRICES PRICES
Q1 Q2 P1 P2 P1 x Q1 P1 x Q2 P2 x Q1 P2 X Q2
Tea 6 11 $.50 $ .40
VS 7 4 .30 1.00
Car 10 12 .70 .90
Total

About GDPAbout GDPList of countries by GDP (Nominal)
Most Expensive Countries to Live in
List of countries by GDP (Real)
List of countries by GDP (Real, per capita)

LIMITATIONS OF THE GDP CONCEPTLIMITATIONS OF THE GDP CONCEPTGDP AND SOCIAL WELFAREGDP AND SOCIAL WELFARE• Society is better off when crime decreases; however, a
decrease in crime is not reflected in GDP. List of countries by murder rateUnited States cities by crime rateHighest Prison Population Rates
• An increase in leisure is an increase in social welfare, but not counted in GDP.
Countries with highest work hours
• Nonmarket and household activities are not counted in GDP even though they amount to real production.

LIMITATIONS OF THE GDP CONCEPTLIMITATIONS OF THE GDP CONCEPT•GDP seldom reflects losses or social ills.
•GDP also has nothing to say about the distribution of output among individuals in a society. List of countries by income equality
• Neutrality about the kinds of goods an economy produces.
• ? ? = The part of the economy in which transactions take place and in which income is generated that isunreported and therefore not counted in GDP.

Measure of WellMeasure of Well--Being, Standard of LivingBeing, Standard of LivingHDI
HDI
Despite these limitations, GDP is a highly useful measure of economic activity and well-being.
GROSS NATIONAL INCOME PER CAPITAGROSS NATIONAL INCOME PER CAPITA• Gross national income (GNI) = GNP converted into dollars
using an average of currency exchange rates over several years adjusted for rates of inflation.
• Link