chapter 6 optimization of process...
TRANSCRIPT

134
CHAPTER 6
OPTIMIZATION OF PROCESS PARAMETERS IN RING
AND ROTOR SPINNING SYSTEMS
6.1 INTRODUCTION
Many research works have been focussed on different aspects of
drafting force and its relationship with material and machine parameters in
ring spinning. Fibre crimp influences the roller drafting process by
influencing the comparative movement of fibres in the drafting zone. The
fibre friction is also considered to be an important property of textile fibres in
view of their behaviour during drafting. The way in which a fibre travels
during drafting depends on the variation of frictional forces acting on it in the
drafting zone.
New spinning technologies like rotor, air-jet and friction spinning
lack the traditional mechanical control inherent in ring spinning. One general
characteristic of these new spinning systems is the existence of a space in
which fibres are moving in an air-stream, the only mechanism of control
being a combination of fibre-to-fibre, fibre-to-metal and fibre-to-air friction.
The performance of fibres in such a space depends mainly on their frictional
characteristics. In rotor spinning system, slivers fed into the opening roller
must be opened into individual fibres and the impurities must be removed in
order to manufacture quality yarns with increased spinning performance. The
opening roller gives a high degree of fibre separation at the cost of fibre
breakage (Duru & Babaarslan 2003, Steadman et al 1989). Fibre breakage is

135
influenced by the mechanical and physical properties of the fibres, the rate of
feeding, fibre arrangement in the sliver, the type of opening roller and its
speed. The fibre breakage can be reduced by using low sliver linear density, a
high speed of sliver input, a lesser opening roller speed and a opening roller
with a low wire point density (Dyson 1974). The key variables influencing the
spinning performance were considered for optimization in ring and rotor
spinning systems.
6.2 MATERIALS AND METHODS
The properties of fibres used, method of yarn production, process
parameters used for yarn production and testing of yarn characteristics are
given in various sections of Chapter 3. The detailed work plan is shown in
Figure 6.1
6.3 RESULTS AND DISCUSSION
Since the surface properties of milkweed fibres are quite different
from cotton and have high proportion of short fibre content, the process
parameters and settings used for processing 100% cotton fibres are not
suitable for C/M blended yarn production. The process parameters in draw
frame, speed frame and ring frame needs to be optimized for better
performance and quality of C/M yarns. Due to technical constraints, the roller
settings could not be altered in miniature draw frame. The primary
consideration has been given for improving the running performance of C/M
blends and then for improving the yarn quality. Since there were no issues in
running the C/M slivers in speed frame except few occasional creel breaks,
parameters were not changed in the break draft zone of speed frame.

136

137
In case of ring frame, more creel breaks were noticed while
processing C/M rovings. The variable roving TM is considered to increase
the binding of fibres and to minimize creel breaks, roving stretch occurring
due to less cohesive nature of milkweed fibres. Accordingly, break draft and
break draft zone setting in ring frame were considered to compensate for the
variations in roving TM. The ring frame variables, namely, roving TM, break
draft and break draft zone setting which have a definite influence on drafting
force (Su & Fang 2006) were investigated by means of a full factorial design
(3 x 3 x 4).
The quality of C/M yarns were further improved by considering
the optimization of front zone variables namely, roller setting and top roller
pressure in speed frame and ring frame along with fibre friction using Box-
Behnken design.
6.3.1 Optimization of Roving TM, Break Draft and Break Draft
Zone Setting in Ring Frame by Full Factorial Design
The alkali treated milkweed fibres blended with cotton shown
better yarn characteristics and hence it is chosen for further optimization.
test procedure has been used to determine the significant differences
between various C/M yarns and 100% cotton yarn.
test for ring, compact and rotor spun blended yarns are shown in Table 6.1.
From the table it is evident that, the yarn characteristics of C/M 80/20 and
60/40 are insignificant except yarn imperfections and are significant between
C/M 60/40 and 40/60.

138
Yar
n T
ype
Yar
n C
hara
cter
istic
s
100%
C
otto
n (
)
C/M
80
/20
()
C/M
60
/40
()
C/M
40
/60
()
MSS
(M
ean
Sum
of
Squ
are)
HSD
(H
ones
t Si
gnifi
cant
di
ffer
ence
) R
ing
Yar
n Te
naci
ty (c
N/te
x)
15.3
2 14
.16
13.0
8 9.
53
1.16
1.
08
3.05
2.
518
1.17
El
onga
tion
(%)
6.12
6.
04
5.93
5.
74
0.08
0.
11
0.19
0.
174
0.31
U
neve
nnes
s (%
) 13
.72
16.8
6 17
.14
21.2
2 -3
.14
-0.2
8 -4
.08
4.
905
4.01
Im
perf
ectio
ns (/
Km
) 52
0.4
1445
.9
2077
.8
2741
.5
-925
.5
-631
.9
-663
.7
7383
7.83
49
2.16
H
airin
ess
Inde
x (H
) 6.
63
9.12
10
.32
13.2
5 -2
.49
-1
.2
-2.9
3
1.25
6 2.
03
Com
pact
Yar
n Te
naci
ty (c
N/te
x)
16.9
8 15
.21
14.0
2 12
.24
1.77
1.
19
1.58
3.
603
1.40
El
onga
tion
(%)
6.22
6.
17
6.02
5.
79
0.05
0.
15
0.23
0.
231
0.35
5 U
neve
nnes
s (%
) 13
.16
16.7
7 17
.23
21.4
5 -3
.61
-0.4
6 -4
.22
5.
101
4.09
Im
perf
ectio
ns (/
Km
) 54
0.1
1393
.3
2069
.6
2665
-8
53.2
-6
76.3
-5
95.4
48
041.
6 39
6.99
H
airin
ess
Inde
x (H
) 4.
75
5.65
6.
44
10.1
1 -0
.9
-0.7
9 -3
.67
0.
565
1.36
R
otor
Yar
n Te
naci
ty (c
N/te
x)
12.4
11
.41
11.1
9 6.
64
0.99
0.
22
4.55
2.
482
1.65
El
onga
tion
(%)
6.25
6.
13
6.06
5.
46
0.12
0.
07
0.6
0.
204
0.33
4 U
neve
nnes
s (%
) 12
.51
13.6
6 13
.94
15.6
6 -1
.15
-0.2
8 -1
.72
2.28
5 2.
74
Impe
rfec
tions
(/K
m)
150.
1 21
4.3
334.
8 68
6.3
-64.
2
-120
.5
-351
.5
4218
.619
11
7.64
H
airin
ess
Inde
x (H
) 4.
69
5.08
6.
24
8.89
-0
.39
-1.1
6 -2
.65
0.
606
1.41

139
The C/M 60/40 was considered for the optimisation trials. Though
C/M 80/20 could perform better in various spinning stages, the main
advantage of using milkweed fibre is to have pronounced thermal insulation
characteristics in the final end product. As C/M 40/60 had lot of processing
difficulties and since C/M 80/20 would be more cotton rich hiding the
positive points of milkweed fibre in the final end product, C/M 60/40 was
chosen for further studies. The various factors and their levels are given in
Table 6.2.
Table 6.2 Independent variables for 3x3x4 factorial analysis of C/M 60/40 yarns
Sl. No Factors Levels
1 Roving TM 1.0, 1.2, 1.4
2 Break draft zone setting (mm) 56, 58, 60
3 Break draft 1.14, 1.18, 1.22, 1.26
Table 6.3 shows the various yarn parameters obtained from all 36
runs. The ANOVA results are given in Table A3.1 - A3.9.

140
Tab
le 6
.3 Y
arn
para
met
ers o
f C/M
60/
40 fo
r va
riou
s com
bina
tions
in 3
x3x4
des
ign
Sl.
No
Rov
ing
TM
Bre
ak d
raft
se
ttin
g (m
m)
Bre
ak
draf
t T
enac
ity
(cN
/tex)
E
long
atio
n (%
) U
%
Thi
n (-
50%
) T
hick
(+
50%
) N
eps
(+20
0%)
Tot
al H
airi
ness
In
dex
(H)
S3
1 1.
0 56
1.
14
11.7
3 3.
78
17.6
3 31
2 93
2 71
0 19
54
12.4
5 21
83
2 1.
0 56
1.
18
11.8
1 3.
88
17.7
7 32
1 96
2 90
5 21
88
12.3
2 20
98
3 1.
0 56
1.
22
11.4
9 4.
13
17.7
2 37
8 10
45
945
2368
12
.23
1901
4
1.0
56
1.26
10
.92
3.63
18
.86
423
1125
10
35
2583
12
.89
1349
5
1.0
58
1.14
12
.47
4.11
17
.45
302
815
930
2047
12
.67
1083
6
1.0
58
1.18
12
.23
4.27
17
.34
320
929
985
2234
12
.39
996
7 1.
0 58
1.
22
12.1
4 3.
92
17.6
3 32
3 87
5 94
5 21
43
12.8
3 19
06
8 1.
0 58
1.
26
11.7
8 3.
67
18.5
2 38
9 10
98
765
2252
12
.46
1873
9
1.0
60
1.14
12
.57
4.18
15
.96
200
715
830
1745
13
.17
2231
10
1.
0 60
1.
18
12.3
9 4.
07
15.5
3 27
0 92
0 80
5 19
95
13.5
3 20
81
11
1.0
60
1.22
12
.44
4.58
15
.47
286
933
845
2064
14
.19
2348
12
1.
0 60
1.
26
12.2
7 3.
45
16.7
3 37
2 88
3 96
7 22
22
11.9
4 14
52
13
1.2
56
1.14
12
.32
5.06
15
.63
45
595
620
1260
11
.73
1394
14
1.
2 56
1.
18
14.1
2 3.
9 14
.8
70
530
835
1435
11
.32
2607
15
1.
2 56
1.
22
13.6
4 4.
87
16.5
4 10
5 69
0 85
5 16
50
11.4
5 22
51
16
1.2
56
1.26
13
.13
5.06
16
.73
605
990
1255
28
50
11.7
8 27
83
17
1.2
58
1.14
12
.97
3.83
15
.20
60
650
635
1345
11
.23
1010
18
1.
2 58
1.
18
14.6
9 3.
38
14.3
2 82
42
5 44
0 94
7 11
.25
1024
19
1.
2 58
1.
22
13.5
7 5.
54
15.1
3 12
0 53
5 57
0 12
25
11.8
0 14
51

141
Tab
le 6
.3 (C
ontin
ued)
Sl.
No
Rov
ing
TM
Bre
ak
draf
t se
ttin
g (m
m)
Bre
ak
draf
t T
enac
ity
(cN
/tex)
E
long
atio
n (%
) U
%
Thi
n (-
50%
) T
hick
(+
50%
) N
eps
(+20
0%)
Tot
al
Hai
rine
ss
Inde
x (H
) S3
20
1.2
58
1.26
13
.22
3.83
16
.24
260
750
835
1845
11
.94
1538
21
1.
2 60
1.
14
13.5
9 3.
54
15.4
8 75
43
0 56
0 10
65
11.4
3 18
94
22
1.2
60
1.18
14
.93
3.81
14
.46
75
450
420
945
11.2
5 19
10
23
1.2
60
1.22
13
.43
5.11
15
.48
115
525
695
1335
12
.00
1351
24
1.
2 60
1.
26
12.7
8 3.
54
16.1
6 20
5 67
0 80
5 16
80
12.2
3 20
83
25
1.4
56
1.14
12
.56
3.89
15
.89
30
761
681
1110
12
.05
1607
26
1.
4 56
1.
18
12.3
1 3.
91
15.4
2 85
63
9 61
0 10
20
10.0
1 89
5 27
1.
4 56
1.
22
12.7
8 4.
21
16.1
3 96
64
9 67
7 10
45
10.7
9 12
00
28
1.4
56
1.26
11
.89
3.60
16
.83
121
713
661
1495
11
.12
1341
29
1.
4 58
1.
14
12.1
7 4.
18
16.3
2 60
46
5 58
5 11
10
11.2
8 76
9 30
1.
4 58
1.
18
12.3
9 4.
07
14.6
5 55
44
5 52
0 10
20
9.72
71
5 31
1.
4 58
1.
22
12.4
4 4.
58
14.4
9 75
50
0 47
0 10
45
10.6
8 15
74
32
1.4
58
1.26
12
.18
4.14
15
.16
66
462
562
1090
11
.77
1263
33
1.
4 60
1.
14
13.6
6 4.
72
14.9
8 11
0 77
5 64
5 15
30
11.0
5 88
8 34
1.
4 60
1.
18
13.9
4 4.
86
14.4
9 75
45
0 42
0 94
5 10
.75
1452
35
1.
4 60
1.
22
13.9
3 4.
77
14.6
5 25
38
5 44
0 85
0 12
.04
1593
36
1.
4 60
1.
26
13.1
1 4.
23
15.2
1 43
48
1 43
1 95
5 12
.82
1811

142
6.3.1.1 Influence of ring frame variables on tenacity of C/M 60/40
yarns
From the ANOVA results (Table A3.2), it is observed that, the
yarn elongation is not significantly influenced by main and interaction effects
of selected variables except break draft.
From the ANOVA results (Table A3.1) it is clear that all three
variables have a significant effect on yarn tenacity. The interaction of roving
TM with break draft zone setting and break draft has a significant influence
on tenacity. From the main and interaction effect plot as shown in Figures 6.2
and 6.3, it is clear that the yarn tenacity is higher at roving TM of 1.2, break
draft zone setting of 60 mm and with break draft of 1.18.
Figure 6.2 Main effect of roving TM, break zone setting and break draft on tenacity of C/M 60/40 yarns

143
Figure 6.3 Interaction effect of roving TM, break zone setting and
break draft on tenacity of C/M 60/40 yarns
The increase in roving TM has increased the twist/inch in the
roving. Therefore, drafting force in the break draft zone would be higher
leading to better fibre straightening and parallelization which has a positive
influence on yarn tenacity. At closer break draft zone settings, the drafting
force is higher and reduces as setting is increased. Higher drafting force will
result in an increased pulling force leading to bunch of fibres dragged forward
towards the front roller nip. The Figure 6.2 reveals 60 mm as the best setting
for processing C/M 60/40 yarn.
Optimal break draft ensures better fibre configuration and
minimum fibre spread at the front roller nip contributing to better yarn
uniformity, strength and increased fibre density in cross section of fibres at
delivery rollers leading to reduced end breakages (Audivert et al 1967). At
optimum break draft, the roving twist, fibre hooks and crimp were all
effectively removed, leading to increased yarn tenacity. Beyond optimum
break draft, the drafting force decreases sharply due to fibre slippage and the

144
drafting force is only due to fibre friction which leads to decrease in yarn
tenacity. This is in agreement with findings of Das et al (2004).
6.3.1.2 Influence of ring frame variables on evenness of C/M 60/40
yarns
From the ANOVA results (Table A3.3) it is observed that all three
variables, namely roving TM, break draft zone setting and break draft have a
significant effect on yarn unevenness. The interaction of roving TM with
break draft zone setting and break draft also has a significant influence on
yarn evenness. From the main and interaction effect plot as shown in Figures
6.4 and 6.5, it is clear that the yarn U% is lower at roving TM of 1.4, break
zone setting of 60 mm and with break draft of 1.18.
Figure 6.4 Main effect plots of roving TM, break zone setting and break draft on yarn unevenness of C/M 60/40 yarns

145
Figure 6.5 Interaction effect plots of roving TM, break zone setting and break draft on yarn unevenness of C/M 60/40 yarns
At lower roving TM, the less twist in roving results in roving
stretch in creel zone leading to higher yarn unevenness. But with higher
roving TM, fibres are well bound into the structure and exhibit a controlled
movement during drafting resulting in lower yarn unevenness.
At closer break draft zone setting, the higher drafting force leads to
improper drafting and consequently results in higher yarn unevenness. With
higher break draft the sliding of fibres relative to one another causes more
fibre slippage, resulting in higher yarn unevenness. At optimal break draft, the
fibres would have been straightened and the slippage will be minimal,
conditions leading to better yarn evenness.

146
6.3.1.3 Influence of ring frame variables on imperfections of C/M
60/40 yarns
Figure 6.6 Main effect plots of roving TM, break zone setting and
break draft on imperfections of C/M 60/40 yarns
Figure 6.7 Interaction of roving TM, break zone setting and break draft on imperfections of C/M 60/40 yarns

147
From the ANOVA results (Table A3.4 A3.7) it is clear that both
main and interaction effects of all the three variables have a significant effect
on yarn imperfections. From the main and interaction effect plot of yarn
imperfections as shown in Figures 6.6 and 6.7, it is evident that the total yarn
imperfection is less at roving TM of 1.4, break zone setting of 60 mm and
with break draft of 1.18. The reasons discussed for yarn evenness is
applicable for imperfections as well.
6.3.1.4 Influence of ring frame variables on hairiness of C/M 60/40
yarns
From the ANOVA results of hairiness index and S3 (Table A3.8-
A3.9), it is noticed that roving TM and break draft setting has a significant
influence on yarn hairiness. From the main and interaction effect plot of yarn
hairiness index (H) and S3 values as shown in Figures 6.8, 6.9, 6.10 and 6.11
respectively, it is clear that the yarn hairiness is less at roving TM of 1.4,
break zone setting of 58 mm and break draft of 1.18.
Figure 6.8 Main effect plots of roving TM, break zone setting and break draft on hairiness index of C/M 60/40 yarns

148
Figure 6.9 Interaction effect plots of roving TM, break zone setting and
break draft on hairiness Index of C/M 60/40 yarns
Figure 6.10 Main effect plots of roving TM, break zone setting and break draft on S3 of C/M 60/40 yarns

149
Figure 6.11 Interaction effect plots of roving TM, break zone setting and
break draft on S3 of C/M 60/40 yarns
The increase in roving TM increases the compactness of roving
reducing the fibre spread for the given top roller pressure resulting in lower
hairiness values. Increase in break draft slightly increases hairiness but the
increase is not significant. At low drafts, the distribution of frictional forces is
such that it does not aid the removal of hooks, therefore yarn hairiness
remains slightly higher. The condition improves with further increase in break
draft resulting in lower hairiness. Beyond the optimum break draft, that is
1.18, the fibre spread increases considerably which probably increases the
hairiness.
With an increase in roller setting, the yarn hairiness decreases
initially and then increases. Increase in roller settings upto an optimum value
aids in straightening of fibre hooks thereby lowering hairiness. Beyond the
optimum value, further increase in setting will lead to increase in swimming
fibres in the drafting zone increasing hairiness.

150
6.3.1.5 Summary of results for C/M 60/40 ring spun yarns
Based on the discussions, the optimum settings recommended by
the Minitab software for producing C/M 60/40 yarns in ring frame are given
in Table 6.4.
Table 6.4 Optimized ring frame parameters for production of C/M 60/40 yarn using 3x3x4 factorial design
Process parameter Optimized value Roving TM 1.3
Break draft 1.18
Back zone setting 60 mm
In order to produce good quality C/M 60/40 yarns, the various front
zone settings are also to be experimented and tried before deciding on the
optimum process parameters. Keeping in this mind, the front zone variables
of speed frame and ring frame were studied separately using Box-Behnken
design.
6.3.2 Optimization of Speed frame and Ring frame Drafting
Parameters by Box-Behnken Design
6.3.2.1 Selection of variables in speed frame
The alkali treated milkweed fibres produce better yarn
characteristics due to the improvement in inter-fibre friction with the settings
maintained for processing 100% cotton fibre as shown in Tables 5.3-5.5 of
Chapter 5. However, the interaction effects of fibre friction with other
variable remains to be investigated. This section discusses it in length by
giving coded values for associated front zone variables.

151
According to Das et al (2006), the drafting parameters, namely, fibre
friction, top roller pressure and roller setting significantly influence the yarn
properties. Therefore, the above mentioned variables were considered for
optimization using Box and Behnken method in the speed frame drafting
field. The coded levels with the corresponding actual values of the three
variables considered in speed frame are given in Table 6.5. With respect to
the above coded levels, 15 rovings were produced.
Table 6.5 Coded levels and actual values for processing C/M 60/40 yarns in speed frame
Variables Coded Levels
-1 0 +1 Milkweed fibre friction (µ) (S1) 0.16 0.22 0.28
Roller setting (mm) (S2) 47 49 51
Top roller load (kgs) (S3) 20 25 30
6.3.2.2 Selection of variables in ring frame
Similarly, the process variables, namely, milkweed fibre friction,
top roller pressure and roller setting in ring frame are considered for
optimization using Box-Behnken method. The various coded levels and
corresponding actual values are shown in Table 6.6.
Table 6.6 Coded levels and actual values for processing C/M 60/40 yarns in ring frame
Variables Coded Levels
-1 0 +1 Milkweed fibre friction (µ) (R1) 0.16 0.22 0.28
Roller setting (mm) (R2) 40 42 44
Top roller load (kgs) (R3) 15 17.5 20

152
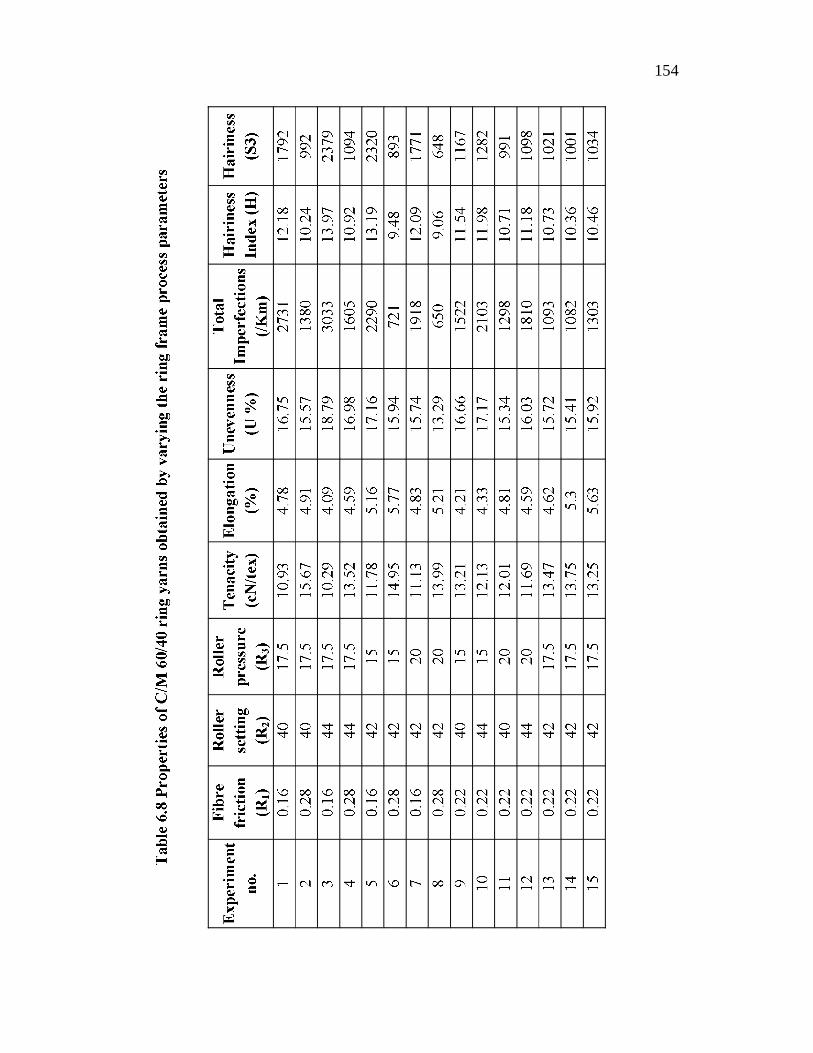
With respect to the above coded levels, 15 yarn samples were
were spun by varying the speed frame parameters and the resultant yarn
properties are shown in Table 6.7 and similarly maintaining the speed frame
parameters c ng
frame parameters and the resulting yarn properties are reported in Table 6.8.
6.3.2.3 Model building and statistical analysis of yarn properties
The empirical relationships for yarn tenacity (Y1), elongation (Y2),
unevenness (Y3), total imperfection (Y4), hairiness index (Y5) and S3 (Y6) at
speed frame and ring frame stages were obtained by application of Response
Surface Method (RSM). The final response surface equations in terms of
coded factors as determined by Minitab software after eliminating the
insignificant factors are shown in the Tables 6.9 and 6.10 for speed frame and
ring frame respectively.
The model with the R2
p < 0.05, the parameters will have a significant influence on the variable. The
higher values of R2 (Tables 6.9 and 6.10) for all the yarn properties except
breaking elongation shows that the yarn properties are well correlated with all
the chosen variables in speed frame and ring frame.

153
154

155

156
6.3.2.4 Effect of speed frame parameters on ring yarn tenacity and
elongation
The influence of speed frame process parameters namely, roller
setting and top roller pressure along with the fibre friction on C/M 60/40 ring
yarn tenacity is shown in Figure 6.12 and the corresponding ANOVA results
are given in Table A3.10. From the contour plots, it can be seen that the
maximum yarn tenacity is obtained at fibre friction value of 0.27, a roller
setting of 47.15 mm and top roller pressure of 23.53 kgf.
Figure 6.12 Effect of speed frame process parameters on tenacity of C/M 60/40 ring yarns
It is clear from the contour plot that an increase in fibre friction
invariably increases the yarn tenacity. With increase in fibre friction values,
the inter-fibre friction between the fibres will be high and greater number of
fibres ultimately contributes to the yarn strength. There seems to be an
optimum point for top roller pressure at 23.53 kgf, before and after which the
tenacity drops.
15
14
13
12
SETTING*FRICTION
0.280.240.200.16
51
50
49
48
47
15
14
1312
PRESSURE*FRICTION
0.280.240.200.16
30.0
27.5
25.0
22.5
20.0
14
1312
PRESSURE*SETTING
5150494847
30.0
27.5
25.0
22.5
20.0
FRICTION 0.22SETTING 49PRESSURE 25
Hold Values

157
At lower top roller pressures, undrafted strands were observed
which may be due to lesser influence of fibre friction field. The relatively
lower friction values of milkweed fibres could have led to uncontrolled fibre
movement in the drafting zone resulting in lower tenacity. Similarly, at top
roller loads over 23.53 kgf due to friction field overlap, uneven distribution of
fibres could have reduced the yarn strength.
Increase in roller setting, increases the yarn tenacity up to certain
level and then decreases. At narrow roller setting, the greater frictional field
causes the floating fibres to move in a controlled manner resulting in higher
tenacity. But at wider roll settings, the frictional field sharply decreases
resulting in irregular fibre movement leading to reduced yarn tenacity.
The influence of process parameters on C/M 60/40 ring yarn
elongation is shown in Figure 6.13. From the figure and ANOVA results
(Table A3.11), it is noticed that, there is no significant effect of process
variables on the yarn elongation.
Figure 6.13 Effect of speed frame process parameters on elongation of
C/M 60/40 ring yarns
4.8
4.64.6
4.44.2 4.8
4.64.6
4.44.2
SETTING*FRICTION
0.280.240.200.16
51
50
49
48
47 5.0
4.8 4.8
4.65.0
4.8 4.8
4.6
PRESSURE*FRICTION
0.280.240.200.16
30.0
27.5
25.0
22.5
20.0
4.8
4.8
4.6
4.6
4.4
4.8
4.8
4.6
4.6
4.4
PRESSURE*SETTING
5150494847
30.0
27.5
25.0
22.5
20.0
FRICTION 0.22SETTING 49PRESSURE 25
Hold Values

158
6.3.2.5 Effect of speed frame parameters on ring yarn evenness
The influence of speed frame process parameters on yarn evenness
is shown in Figure 6.14 and the corresponding ANOVA results are given in
Table A3.12. By analyzing the contour diagram and point prediction tool
from the software, it can be shown that the minimum yarn U% is obtained at
fibre friction of 0.24, roller setting of 48.64 mm and top roller pressure of
24.49 kgf. The yarn U% decreases with the increase in fibre friction as it
helps to realize a controlled fibre movement.
Figure 6.14 Effect of speed frame process parameters on evenness of C/M 60/40 ring yarns
Similarly, the yarn U% also decreases with an increase in the top
roller load up to certain level and then increases irrespective of roller setting.
The initial increase in top roller load reduces the gap between the pressure
fields of middle and front rollers. This provides a better control over the
16.5
16.0
15.5
15.0
14.5
SETTING*FRICTION
0.280.240.200.16
51
50
49
48
47
16.516.0
15.5
15.0
14.5
PRESSURE*FRICTION
0.280.240.200.16
30.0
27.5
25.0
22.5
20.0
16.0 16.0
15.5
15.0
14.5
PRESSURE*SETTING
5150494847
30.0
27.5
25.0
22.5
20.0
FRICTION 0.22SETTING 49PRESSURE 25
Hold Values

159
fibres, reducing the yarn unevenness. In addition, an increase of top roller
load enables better gripping of low cohesive milkweed fibres at roller nip
which avoids fibre slippage during roller drafting thereby improving the yarn
evenness. At higher top roller loads, there could be overlapping of friction
fields in the main drafting zone, obstructing the smooth and proper flow of
fibres leading to higher yarn unevenness. The finding is in agreement with
Das et al (2006).
With reference to roller setting, the yarn U% reduces as the roller
setting increases up to 48.64 mm and then increases at wider roller settings.
The initial decrease in yarn U% with roller setting may be due to controlled
movement of shorter, less cohesive milkweed fibres in the main drafting zone.
Further increase in yarn unevenness at wider roller setting could be due to
higher floating distance of fibres between middle and front roller nip.
6.3.2.6 Effect of speed frame parameters on ring yarn imperfections
Figure 6.15 illustrates the influence of speed frame process
parameters on yarn imperfection level. The ANOVA results are shown in
Table A3.13.
By analyzing the contour plot and point prediction tool from the
software, it can be shown that the minimum yarn imperfection value is
obtained at fibre friction of 0.24, roller setting of 48.56 mm and top roller
pressure of 25.07 kgf. With an increase in the fibre friction values, the number
of imperfection gradually decreases due to controlled movement of fibres
during drafting and reduces the incidence of drafting waves.

160
Figure 6.15 Effect of speed frame process parameters on imperfections of C/M 60/40 ring yarns
As far as top roller load is concerned, the yarn imperfection
decreases up to a certain level and then increases as top roller loads are
increased. At lower top roller load, undrafted fibre strand from the drafting
zone increases the yarn imperfections. At high top roller loads, the premature
acceleration of shorter fibres during drafting causes the fibre to move in
groups, resulting in greater numbers of thick and thin places in yarn. Changes
in the friction field could be a reason for change in imperfection with respect
to roller setting, the optimum being around 48.5 mm.
6.3.2.7 Effect of speed frame parameters on ring yarn hairiness
The influence of speed frame process parameters on hairiness index
(H) and S3 value are shown as contour plots in Figure 6.16 and 6.17 and the
corresponding ANOVA results are given in Tables A.3.14 and A3.15
2000.0
1750.0
1500.0
1250.0
1000.0
SETTING*FRICTION
0.280.240.200.16
51
50
49
48
47
2000.0
1750.0
1500.0
1250.0
1000.0
PRESSURE*FRICTION
0.280.240.200.16
30.0
27.5
25.0
22.5
20.0
1500.0
1500.0
1250.0
1000.0
PRESSURE*SETTING
5150494847
30.0
27.5
25.0
22.5
20.0
FRICTION 0.22SETTING 49PRESSURE 25
Hold Values
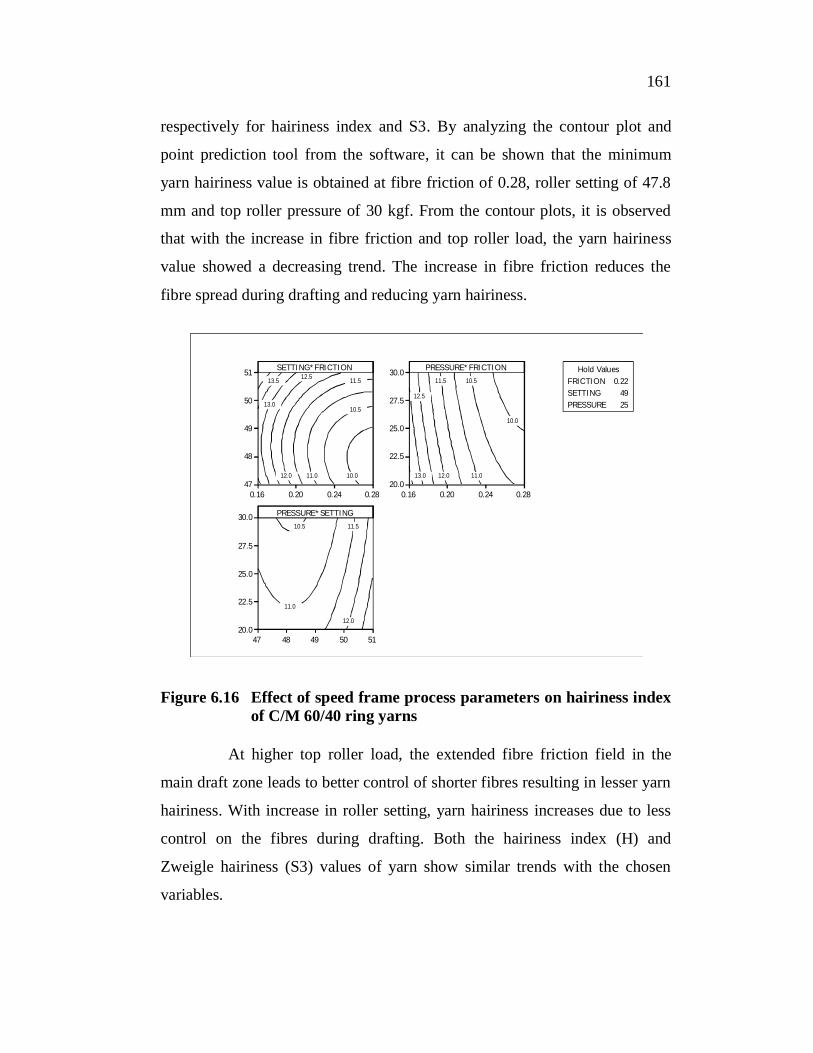
161
respectively for hairiness index and S3. By analyzing the contour plot and
point prediction tool from the software, it can be shown that the minimum
yarn hairiness value is obtained at fibre friction of 0.28, roller setting of 47.8
mm and top roller pressure of 30 kgf. From the contour plots, it is observed
that with the increase in fibre friction and top roller load, the yarn hairiness
value showed a decreasing trend. The increase in fibre friction reduces the
fibre spread during drafting and reducing yarn hairiness.
Figure 6.16 Effect of speed frame process parameters on hairiness index of C/M 60/40 ring yarns
At higher top roller load, the extended fibre friction field in the
main draft zone leads to better control of shorter fibres resulting in lesser yarn
hairiness. With increase in roller setting, yarn hairiness increases due to less
control on the fibres during drafting. Both the hairiness index (H) and
Zweigle hairiness (S3) values of yarn show similar trends with the chosen
variables.
13.5
13.0
12.5
12.0
11.5
11.0
10.5
10.0
SETTING*FRICTION
0.280.240.200.16
51
50
49
48
4713.0
12.5
12.0
11.5
11.0
10.5
10.0
PRESSURE*FRICTION
0.280.240.200.16
30.0
27.5
25.0
22.5
20.0
12.0
11.5
11.0
10.5
PRESSURE*SETTING
5150494847
30.0
27.5
25.0
22.5
20.0
FRICTION 0.22SETTING 49PRESSURE 25
Hold Values

162
Figure 6.17 Effect of speed frame process parameters on S3 value of C/M 60/40 ring yarns
6.3.2.8 Effect of ring frame parameters on ring yarn tenacity and
elongation
In this section, the effect of ring spinning parameters, namely, fibre
friction (R1), roller setting (R2) and top roller pressure (R3) on the properties
of ring spun yarn are discussed (Table 6.8). The higher R2 value in case of
yarn tenacity (Table 6.10) shows that it is better correlated with fibre friction,
roller setting and top roller load. The contour diagram of ring frame
parameters influencing ring yarn tenacity is shown in Figure 6.18. The
ANOVA results are given in Table A3.16.
1500.00
1300.00
1100.00
900.00
SETTING*FRICTION
0.280.240.200.16
51
50
49
48
47
1500.00
1300.00
1100.00
900.00
PRESSURE*FRICTION
0.280.240.200.16
30.0
27.5
25.0
22.5
20.0
1100.00900.00
PRESSURE*SETTING
5150494847
30.0
27.5
25.0
22.5
20.0
FRICTION 0.22SETTING 49PRESSURE 25
Hold Values

163
Figure 6.18 Effect of ring frame process parameters on tenacity of C/M 60/40 ring yarns
By analyzing the contour plot and point prediction tools from the
software, it can be shown that the maximum yarn tenacity is obtained at fibre
friction of 0.28, roller setting of 40.84 mm and top roller pressure of 17.65
kgf. It is clear from the contour that an increase in fibre friction invariably
increases the yarn tenacity. The trend obtained is similar to that of a speed
frame and similar reasons as discussed in section 6.3.2.2 for speed frame
holds good here as well.
The influence of process parameters on C/M 60/40 ring yarn
elongation is shown in Figure 6.19. From the ANOVA results (Table A3.17),
it is noticed that, the chosen variables have no significant effect on the yarn
elongation.
15.0
14.5
14.0
13.5
13.0
12.5
12.0
11.5SETTING*FRICTION
0.280.240.200.16
44
43
42
41
40
14.5
14.0
13.5
13.0
12.5
12.0
11.5PRESSURE*FRICTION
0.280.240.200.16
19.5
18.0
16.5
15.0
13.5
13.0
12.5PRESSURE*SETTING
4443424140
19.5
18.0
16.5
15.0
FRICTION 0.22SETTING 42PRESSURE 17.5
Hold Values

164
Figure 6.19 Effect of ring frame process parameters on elongation of C/M 60/40 ring yarns
6.3.2.9 Effect of ring frame parameters on ring yarn evenness
Figure 6.20 Effect of ring frame process parameters on evenness of C/M 60/40 ring yarns
4.8
4.64.6
4.44.2 4.8
4.64.6
4.44.2
SETTING*FRICTION
0.280.240.200.16
51
50
49
48
47 5.0
4.8 4.8
4.65.0
4.8 4.8
4.6
PRESSURE*FRICTION
0.280.240.200.16
30.0
27.5
25.0
22.5
20.0
4.8
4.8
4.6
4.6
4.4
4.8
4.8
4.6
4.6
4.4
PRESSURE*SETTING
5150494847
30.0
27.5
25.0
22.5
20.0
FRICTION 0.22SETTING 49PRESSURE 25
Hold Values
17.5
17.0
16.5
16.0
15.5
17.5
17.0
16.5
16.0
15.5
SETTING*FRICTION
0.280.240.200.16
44
43
42
41
40
16.5
16.0
15.5
15.0
14.5 14.0
16.5
16.0
15.5
15.0
14.5 14.0
PRESSURE*FRICTION
0.280.240.200.16
19.5
18.0
16.5
15.0
17.0
16.5
16.0
16.0
15.5
15.0
14.5
17.0
16.5
16.0
16.0
15.5
15.0
14.5PRESSURE*SETTING
4443424140
19.5
18.0
16.5
15.0
FRICTION 0.22SETTING 42PRESSURE 17.5
Hold Values

165
The influence of ring frame process parameters on yarn evenness is
shown as contour plots in Figure 6.20 and the corresponding ANOVA results
are given in Table A3.18.
By analyzing the contour plot and point prediction tool, it can be
shown that the minimum yarn U% value is obtained at fibre friction of 0.28,
roller setting of 41.51 mm and top roller pressure of 20 kgf. From the contour
plots, it is observed that the yarn U% decreases gradually with increase in
fibre friction and top roller load irrespective of roller setting due to better
fibre control in drafting. With the increase in roller setting, the yarn U%
decreases up to certain level and then increases, a trend exhibited with speed
frame variables.
6.3.2.10 Effect of ring frame parameters on ring yarn imperfections
By analyzing the contour plot, it can be shown that the minimum
yarn imperfection value is obtained at fibre friction of 0.27, roller setting of
41.53 mm and top roller pressure of 19.5 kgf.
Figure 6.21 Effect of ring frame process parameters on imperfections of C/M 60/40 ring yarns
2250
2000
1750
1500
1250
1000
2250
2000
1750
1500
1250
1000
SETTING*FRICTION
0.280.240.200.16
44
43
42
41
40
1750
1500
1250
1000
1750
1500
1250
1000
PRESSURE*FRICTION
0.280.240.200.16
19.5
18.0
16.5
15.0
1500
1250
12501000
1500
1250
12501000
PRESSURE*SETTING
4443424140
19.5
18.0
16.5
15.0
FRICTION 0.22SETTING 42PRESSURE 17.5
Hold Values

166
From the contour plots shown in Figure 6.21, it is apparent that
imperfections decreases with increase in fibre friction. The top roller load
does not show any significant influence on yarn imperfections.
6.3.2.11 Effect of ring frame parameters on ring yarn hairiness
The influence of ring frame process parameters on Hairiness Index
(H) and S3 value are shown as contour plots in Figure 6.22 and 6.23. The
corresponding ANOVA results for hairiness index and S3 are given in Table
A3.20 and A3.21 respectively. By analyzing the contour plots of hairiness
index and S3, it can be shown that the minimum yarn hairiness value is
obtained at fibre friction of 0.28, roller setting of 41 mm and top roller
pressure of 20 kgf.
Figure 6.22 Effect of ring frame process parameters on hairiness index of C/M 60/40 ring yarns
13.0
12.5
12.0
11.5
11.0
10.5
10.0
13.0
12.5
12.0
11.5
11.0
10.5
10.0
SETTING*FRICTION
0.280.240.200.16
44
43
42
41
40
12.0
11.5
11.0
10.5
10.0
9.5
12.0
11.5
11.0
10.5
10.0
9.5
PRESSURE*FRICTION
0.280.240.200.16
19.5
18.0
16.5
15.0
11.511.0
11.0
10.5
11.511.0
11.0
10.5
PRESSURE*SETTING
4443424140
19.5
18.0
16.5
15.0
FRICTION 0.22SETTING 42PRESSURE 17.5
Hold Values

167
Figure 6.23 Effect of ring frame process parameters on S3 value of C/M 60/40 ring yarns
From the contour diagrams, it is apparent that the yarn hairiness
value decreases with increase in fibre friction and top roller pressure. The
yarn hairiness increases above roller setting of 41 mm. Most of the trends
obtained in ring spun yarn characteristics by changing the ring frame process
variables were similar to that of changing the speed frame process variables.
6.3.2.12 Production of ring yarn with optimized drafting parameters
The numerical optimization tool in the Minitab software was used
to determine the optimum values of the process parameters in speed frame
and ring frame for spinning of better ring spun yarns. The optimum values
found from the software are shown in Table 6.11. The predicted optimized
values in speed frame and ring frame stages with corresponding predicted
yarn characteristics by the software are also shown in Figures A3.20 and
A3.21 respectively.
1800
1500
1200
900
1800
1500
1200
900
SETTING*FRICTION
0.280.240.200.16
44
43
42
41
40
1800
1500
1200
900
1800
1500
1200
900
PRESSURE*FRICTION
0.280.240.200.16
19.5
18.0
16.5
15.0
1200
900
1200
900
PRESSURE*SETTING
4443424140
19.5
18.0
16.5
15.0
FRICTION 0.22SETTING 42PRESSURE 17.5
Hold Values

168
Table 6.11 Optimized value of process variables in ring spinning
Process Fibre Friction
(X1) Roller setting
(X2) Top roller load
(X3)
Speed frame 0.28
(Alkali Treated) 48.4mm
(48.5mm) 25.56 kgf (25 kgf)
Ring frame 0.28
(Alkali Treated) 41.34mm (41.5mm)
18.72 kgf (20 kgf)
The comparison of 100% cotton yarns along with yarn
characteristics of ring and compact yarns produced with optimized parameters
are given in Table 6.12. The data reveals that the yarn characteristics are
found to be superior to those reported in Tables 6.7 and 6.8 and comparable to
that of 100% cotton yarn.
Table 6.12 Comparison of C/M 60/40 yarn properties obtained using optimized process parameters with 100% cotton yarns
Yarn Characteristics 100% Cotton C/M 60/40
Ring Compact Ring Compact Tenacity (cN/tex) 15.32 16.98 14.63 16.05 Elongation (%) 6.12 6.22 5.56 5.83
U (%) 13.72 13.16 14.12 13.97 Imperfections (IPV/ km) 520.4 540.1 790 728
Hairiness (H) 6.63 4.75 9.42 7.64
Hairiness (S3) 572 253 701 367

169
6.3.3 Optimization of Process Parameters in Rotor Spinning
Optimization of process and material parameters such as opening
roller speed and sliver linear density along with milkweed fibre friction was
done using Box-Behnken design. The coded levels and corresponding actual
values of the independent variables are given in Table 6.13.
Table 6.13 Coded levels with actual values for processing C/M 60/40 yarns in rotor spinning
Variables Coded Levels
-1 0 +1 Milkweed fibre friction (µ) (X1) 0.16 0.22 0.28 Opening roller speed (rpm) (X2) 5000 6000 7000 Sliver linear density (g/m) (X3) 3.3 3.9 4.5
The levels of speed of opening roller have been selected based on
the preliminary trials. The opening roller speed less than 5000 rpm leads to
inadequate opening of fibres which resulted in higher yarn unevenness and
imperfection values. On the other hand, higher opening roller speed greater
than 7000 rpm gave intense opening of fibres leading to higher end breakage
rate. The increased number of end breaks at higher opening roller speeds
could be attributed to the deposition of broken milkweed fibres in the rotor
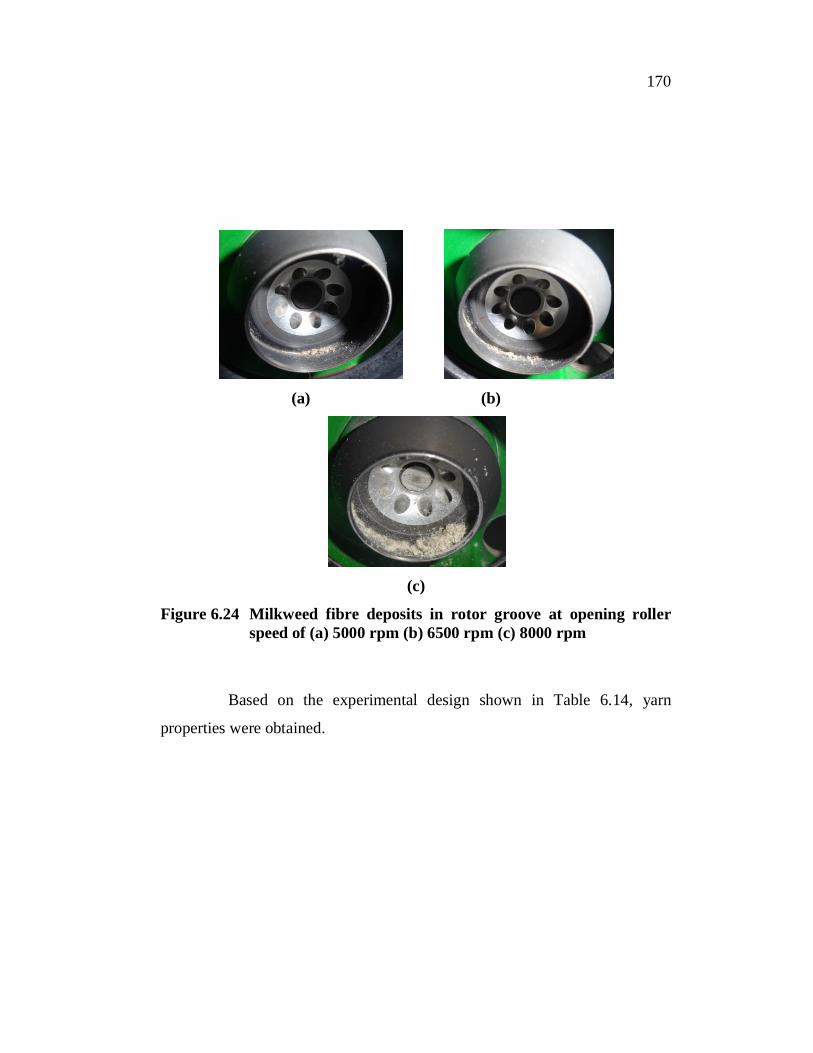
groove, obstructing the yarn formation. The fibre deposits in rotor groove at
various opening roller speeds are shown in Figure 6.24. The sliver linear
densities are selected based on count spun.
170
(a) (b)
(c)
Figure 6.24 Milkweed fibre deposits in rotor groove at opening roller speed of (a) 5000 rpm (b) 6500 rpm (c) 8000 rpm
Based on the experimental design shown in Table 6.14, yarn
properties were obtained.

171
Tab
le 6
.14
Pro
pert
ies o
f C/M
60/
40 r
otor
yar
ns o
btai
ned
by v
aryi
ng th
e ro
tor
fram
e pr
oces
s par
amet
ers
))
)

172
6.3.3.1 Model building and statistical analysis of yarn properties
The empirical relationships for yarn tenacity (Y1), elongation (Y2),
unevenness (Y3), total imperfection (Y4), hairiness index (Y5), S3 (Y6) and
end breakage rate (Y7) were obtained by application of RSM. The final
mathematical models in terms of coded factors determined by Minitab
software after eliminating the insignificant factors are shown in Table 6.15.
The yarn properties were found to be well correlated (R2 > 0.8) with all
chosen variables except breaking elongation.
6.3.3.2 Effect of process parameters on rotor yarn tenacity and
elongation
The higher R2 value in case of yarn tenacity (Table 6.15) shows that
it is better correlated with fibre friction, opening roller speed and sliver linear
density.
Figure 6.25 Effect of process parameters on C/M 60/40 rotor yarn tenacity
11.0
10.5
10.09.5
ROLLER SPEED*F RIC TIO N
0.280.240.200.16
7000
6500
6000
5500
500011.0
10.510.0
LINEA R DENSITY*FRIC TIO N
0.280.240.200.16
4.50
4.25
4.00
3.75
3.50
11.0
10.5
10.0
LINEA R DENSITY*RO LLER SPEED
70006500600055005000
4.50
4.25
4.00
3.75
3.50
FRICTION 0.22ROLLER SPEED 6000LINEAR DENSITY 3.9
Hold Values

173

174
The influence of process parameters on yarn tenacity is shown as
contour plots in Figure 6.25. The corresponding ANOVA results are given in
Table A3.22. By analyzing the contour diagram and point prediction tool, it
can be shown that the maximum yarn tenacity is obtained at fibre friction of
0.27, opening roller speed of 6285.32 rpm and sliver linear density of 3.31
g/m. It is clear from the contour that an increase in fibre friction increases the
yarn tenacity. With increase in opening roller speed, tenacity increases upto
optimum opening roller speed but decreases further.
In order to evaluate the effect of opening roller speed and sliver
linear density on intensity of opening, number of points per fibre (ppf) is
calculated according to the following formula (Kong 1996):
(6.1)
where Cppf = the number of points per fibre, n = speed of opening roller (rpm),
pt = total points on the surface of opening roller, vf = speed of sliver feed
(m/min), nts = tex of sliver (mg/m), nt
f = fibre linear density (millitex), and L =
mean fibre length (mm). The ppf values for the combination of opening roller
speed and sliver linear density are shown in Table 6.16. Initial increase in
yarn tenacity with opening roller speed could be due to increased points per
fibre (ppf) which leads to improved fibre separation and trash removal from
the sliver.

175
Table 6.16 Effect of opening roller speed and sliver linear density on points per fibre
Opening roller speed (rpm)
Sliver linear density (mg/m) ppf
5000 3300 6.615 5000 3900 6.608 5000 4500 6.616 6000 3300 7.938 6000 3900 7.930 6000 4500 7.939 7000 3300 9.261 7000 3900 9.251 7000 4500 9.262
As the opening roller speed increases, the carrying factor increases,
which in turn increases the opening intensity of the opening roller. Owing to
the better opening of fibres, it can be anticipated that the fibre tufts of smaller
and uniform size are fed into the rotor groove via transport tube. But, beyond
optimum opening roller speed, the yarn tenacity deteriorates because of two
reasons. First, higher opening roller speed causes excessive fibre breakage
resulting in decreased mean fibre length of fibres (Salhotra & Chattopadhyay
1982, Ülkü et al 1995). Secondly, the fibre straightness and degree of
alignment is lost due to throwing away of fibre into the transport tube caused
by higher opening roller speed (Ülkü et al 1993).
With the increase in sliver linear density, the yarn tenacity
decreases invariably. This decrease can be attributed to the increase in
spinning draft (between feed and opening roller) for a particular count to be
spun causing more fibre damage and frequent end-breaks resulting in weaker
yarn (Jackowski et al 2002; Cheng & Cheng 2004).
The influence of process variables on C/M 60/40 rotor yarn
elongation is shown in Figure 6.26. From the figure and ANOVA results

176
(Table A3.23), it is noticed that, no significant change in yarn elongation was
caused by changes in the chosen variables.
Figure 6.26 Effect of process parameters on C/M 60/40 rotor yarn elongation
6.3.3.3 Effect of process parameters on rotor yarn evenness
The influence of process parameters on yarn evenness is shown as
contour plots in Figure 6.27 and the corresponding ANOVA results are given
in Table A3.24. By analyzing the contour plot, it can be shown that the
minimum yarn U% is obtained at fibre friction of 0.28, opening roller speed
of 6192.41 rpm and sliver linear density of 3.31 g/m.
The increase in fibre friction reduces the yarn U% due to better
inter-fibre friction. An increase in opening roller speed results in an initial
decrease in yarn unevenness up to a certain point and then increases at higher
opening roller speed. The inadequate opening of fibres at lower opening roller
speeds leads to increase in yarn unevenness (Ishtiaque & Saxena 1998). On
6.6
6.4
6.4
6.2
6.6
6.4
6.4
6.2
RO LLER SPEED*F RIC TIO N
0.280.240.200.16
7000
6500
6000
5500
50006.6
6.4
6.2
6.6
6.4
6.2
LINEA R DENSITY*FRICTIO N
0.280.240.200.16
4.50
4.25
4.00
3.75
3.50
6.6
6.4
6.6
6.4
LINEA R DENSITY*RO LLER SPEED
70006500600055005000
4.50
4.25
4.00
3.75
3.50
FRICTION 0.22ROLLER SPEED 6000LINEAR DENSITY 3.9
Hold Values

177
the other hand, excessive action of the opening roller (higher ppf) on fibres at
higher speeds will not continue to improve the yarn evenness, but leads to the
deterioration of yarn evenness due to fibre breakage.
Figure 6.27 Effect of process parameters on C/M 60/40 rotor yarn unevenness
Further, a greater centrifugal force on fibres, caused by higher
opening roller speed, will clump them within the inlet of the transport tube at
a speed close to, or even higher than, that generated by aerodynamic forces.
This increases the probability of fibre accumulation at the inlet of the
transport tube. The low density and finer milkweed fibres could travel at
different speed compared to cotton fibres leading to uneven deposition on
rotor groove, resulting in higher yarn unevenness.
With increase in sliver linear density, the yarn U% increases
linearly. At higher sliver linear density, the feed rate becomes less, presenting
14.013.8
13.6
13.6
13.4
13.4
13.2
RO LLER SPEED*FRIC TIO N
0.280.240.200.16
7000
6500
6000
5500
5000
13.213.0
LINEA R DENSITY*FRIC TIO N
0.280.240.200.16
4.50
4.25
4.00
3.75
3.50
13.6
13.6
13.4 13.4
13.213.0
LINEA R DENSITY*RO LLER SPEED
70006500600055005000
4.50
4.25
4.00
3.75
3.50
FRICTION 0.22ROLLER SPEED 6000LINEAR DENSITY 3.9
Hold Values

178
more number of fibres per unit time to the opening roller. This resulted in
inadequate opening of fibres, leading to increased yarn U%.
6.3.3.4 Effect of process parameters on rotor yarn imperfections
The influence of process parameters on yarn imperfection is shown
as contour plots in Figure 6.28 and the corresponding ANOVA results are
given in Table A3.25.
Figure 6.28 Effect of process parameters on C/M 60/40 rotor yarn imperfections
By analyzing the contour plot, it can be shown that the minimum
yarn imperfection is obtained at fibre friction of 0.27, opening roller speed of
5842.59 rpm and sliver linear density of 3.92 g/m. It is evident from the
contour that an increase in fibre friction decreases the yarn imperfection due
to controlled flow of fibres in the transport channel and deposition of more or
less equal number of fibres in rotor groove.
460 440
420
420
400
RO LLER SPEED* FRIC TIO N
0.280.240.200.16
7000
6500
6000
5500
5000
420
400
400
LINEAR DENS ITY* FRIC TIO N
0.280.240.200.16
4.50
4.25
4.00
3.75
3.50
460
440
420 420
400
LINEAR DENS ITY* RO LLER SP EED
70006500600055005000
4.50
4.25
4.00
3.75
3.50
FRICTION 0.22ROLLER SPEED 6000LINEAR DENSITY 3.9
Hold Values

179
An increase in opening roller speed resulted in initial decrease in
yarn imperfection upto a certain level and then increases. The initial decrease
in yarn imperfection with opening roller speed could be due to better opening
of fibres. At lower opening roller speeds, inadequate opening of fibres leads
to more amount of thick and nep faults in yarn. On the other hand, higher
opening roller speed paves way to premature acceleration of low density
milkweed fibres leading to irregular deposition in rotor groove and resulted in
a higher yarn imperfection level.
With the increase in sliver linear density, the yarn imperfection
reduces slightly up to a certain level and increases steeply thereafter. Higher
yarn imperfection at lesser sliver linear density could be due to excessive
action of opening rollers on lesser number of fibres presented in unit time. At
higher sliver linear density, the feed rate becomes less, presenting more
number of fibres per unit time to the opening roller, resulting in insufficient
opening of fibres which ultimately leads to more thick and nep faults in the
yarn.
6.3.3.5 Effect of process parameters on rotor yarn hairiness
The influence of process parameters on yarn hairiness in terms of
hairiness index (H) and S3 values are shown as contour plots in Figures 6.29
and 6.30. The corresponding ANOVA results for hairiness index and S3 are
given in Table A3.26 and A3.27 respectively.
By analyzing the contour plot, it can be shown that the minimum
yarn hairiness is obtained at fibre friction of 0.28, opening roller speed of
5805 rpm and sliver linear density of 3.57 g/m. Increase in fibre friction keeps
the fibres intact in the yarn strand and results in lower hairiness. But with
higher opening roller speeds, fibre breaks occurs liberating short fibres
causing increased hairiness.

180
Figure 6.29 Effect of process parameters on C/M 60/40 rotor yarn hairiness index (H)
Figure 6.30 Effect of process parameters on C/M 60/40 rotor yarn hairiness (S3)
7.0
7.0
6.5
RO LLER SPEED*FRIC TIO N
0.280.240.200.16
7000
6500
6000
5500
5000
7.5
7.0
7.0
6.5
LINEAR DENSITY*FRIC TIO N
0.280.240.200.16
4.50
4.25
4.00
3.75
3.50
7.5
7.5 7.5
7.0
LINEAR DENSITY*RO LLER SPEED
70006500600055005000
4.50
4.25
4.00
3.75
3.50
FRICTION 0.22ROLLER SPEED 6000LINEAR DENSITY 3.9
Hold Values
400
375
350
325
300
275
250
225
ROLLER SPEED*FRICTION
0.280.240.200.16
7000
6500
6000
5500
5000
375
350
325
300
275
250
225
LINEAR DENSITY*FRICTION
0.280.240.200.16
4.50
4.25
4.00
3.75
3.50
325 300
300
275
LINEAR DENSITY*ROLLER SPEED
70006500600055005000
4.50
4.25
4.00
3.75
3.50
FRICTION 0.22ROLLER SPEED 6000LINEAR DENSITY 3.9
Hold Values
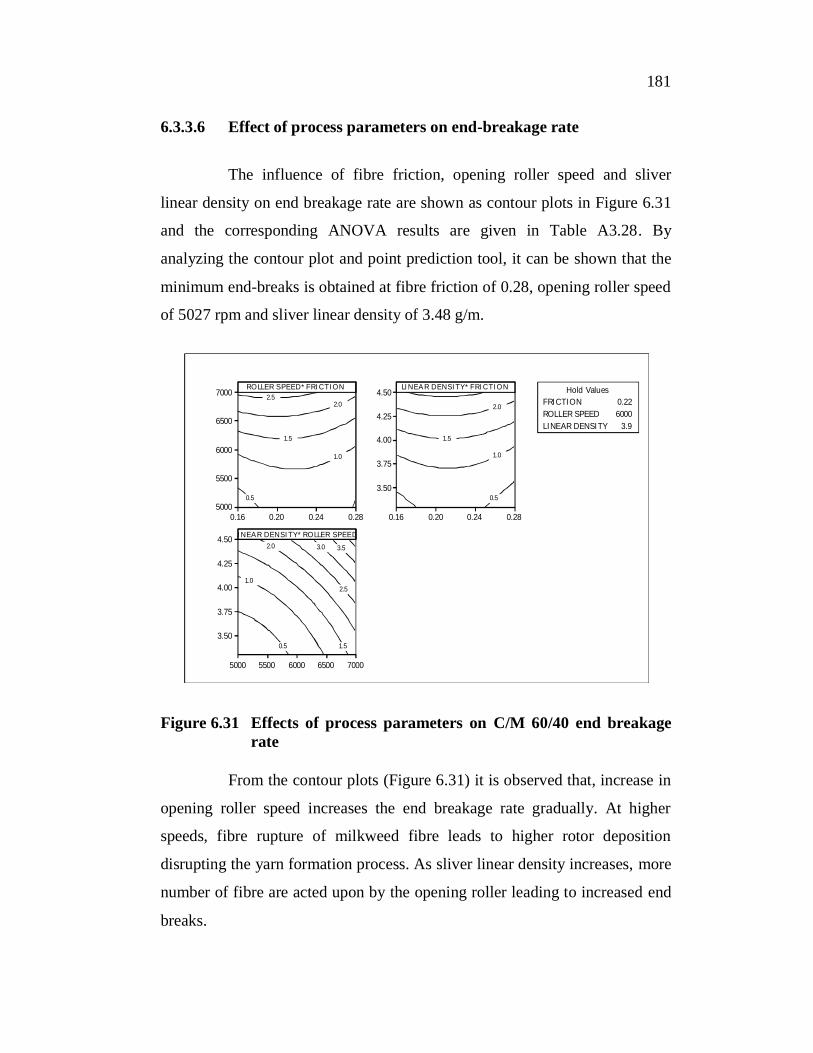
181
6.3.3.6 Effect of process parameters on end-breakage rate
The influence of fibre friction, opening roller speed and sliver
linear density on end breakage rate are shown as contour plots in Figure 6.31
and the corresponding ANOVA results are given in Table A3.28. By
analyzing the contour plot and point prediction tool, it can be shown that the
minimum end-breaks is obtained at fibre friction of 0.28, opening roller speed
of 5027 rpm and sliver linear density of 3.48 g/m.
Figure 6.31 Effects of process parameters on C/M 60/40 end breakage rate
From the contour plots (Figure 6.31) it is observed that, increase in
opening roller speed increases the end breakage rate gradually. At higher
speeds, fibre rupture of milkweed fibre leads to higher rotor deposition
disrupting the yarn formation process. As sliver linear density increases, more
number of fibre are acted upon by the opening roller leading to increased end
breaks.
2.52.0
1.5
1.0
0.5
RO LLER SPEED*FRIC TIO N
0.280.240.200.16
7000
6500
6000
5500
5000
2.0
1.5
1.0
0.5
LINEA R DENSITY* FRIC TIO N
0.280.240.200.16
4.50
4.25
4.00
3.75
3.50
3.53.0
2.5
2.0
1.5
1.0
0.5
LINEA R DENSITY* RO LLER SPEED
70006500600055005000
4.50
4.25
4.00
3.75
3.50
FRICTION 0.22ROLLER SPEED 6000LINEAR DENSITY 3.9
Hold Values

182
6.3.3.7 Production of rotor yarn with optimized parameters
The numerical optimization tool of the Minitab software was used
to determine the optimum values of the factors for spinning better rotor yarns.
The optimum values found from the software are shown in Table 6.17. The
predicted optimized values in rotor frame with corresponding predicted yarn
characteristics by the software are shown in Figure A3.22.
Table 6.17 Optimized value of process variables in rotor spinning
Process Fibre Friction (X1)
Opening roller speed (X2)
Sliver linear density (X3)
Rotor spinning 0.28 (Alkali Treated)
6010 rpm 3.54 g/m
The comparison of 100% cotton yarns along with yarn
characteristics of rotor yarns produced with optimized parameters given in
Table 6.18. The data reveals that the yarn characteristics are found to be
superior to those reported in Table 6.12 and comparable to that of 100%
cotton yarn.
Table 6.18 Comparison of C/M 60/40 yarn properties obtained using optimized rotor parameters with 100% cotton yarns
Yarn Characteristics 100% Cotton C/M 60/40 Tenacity (cN/tex) 12.40 11.85 Elongation (%) 6.25 6.43 U (%) 12.51 10.43 Imperfections (IPV/ km) 150.1 382 Hairiness (H) 4.69 6.21 Hairiness (S3) 132 199
183
6.4 CONCLUSIONS
Since the properties of milkweed fibres are quite different cotton,
especially in fibre friction, elongation and short fibre percentage, the process
parameters used for processing 100% cotton is not suitable for C/M blends.
The study is aimed to obtain the optimum process parameters in ring and rotor
spinning systems which provides the new database for processing of C/M
blends. To utilize the thermal insulation property milkweed fibres in the final
end product and to avoid processing difficulties during spinning, cotton/alkali
treated milkweed 60/40 blend was chosen for the optimization studies.
The optimization of break draft zone variables in ring frame,
namely, roving TM, break draft, break draft zone setting using full factorial
design reveals that the roving TM of 1.3, break draft of 1.18 and break draft
zone setting of 60 mm were optimum conditions for processing C/M 60/40
blended yarn.
Detailed investigations were carried out to understand the
influence of front zone variables in speed frame and ring frame, namely, roller
setting and top roller load along with fibre friction on C/M 60/40 blended
yarn characteristics using Box-Behnken Design. In speed frame, the fibre
friction of 0.28, roller setting of 48.5 mm and top roller pressure of 25 kgf
were found to be optimum values. Similarly in ring frame, the fibre friction of
0.28, front zone roller setting of 41.5 mm and front top roller pressure of 20
kgf were found to be the optimum values. In general, higher fibre friction and
moderate level of top roller load and roller setting were found to produce
desirable yarn characteristics due to the role played by those parameters in
friction field of drafting line.

184
In rotor spinning, higher fibre friction (0.28), moderate opening
roller speed (6010 rpm) and sliver linear density (3.54 g/m) as revealed by the
software output gave the best results in rotor spun yarns.
The study clearly brings out the optimum conditions in ring and
rotor spinning systems which are resulted in better spinning performance and
quality of C/M 60/40 blended yarn. The C/M 60/40 yarn produced with the
optimized parameters is almost comparable to that of 100% cotton yarn.