chapter 6 quality assurance / quality control and verification · 6 quality assurance/quality...
TRANSCRIPT
Chapter 6: QA/QC and Verification
2006 IPCC Guidelines for National Greenhouse Gas Inventories 6.1
C H A P T E R 6
QUALITY ASSURANCE / QUALITY CONTROL AND VERIFICATION

Volume 1: General Guidance and Reporting
6.2 2006 IPCC Guidelines for National Greenhouse Gas Inventories
Authors
Wilfried Winiwarter (Austria), Joe Mangino (USA)
Ayite-Lo N. Ajavon (Togo), and Archie McCulloch (UK)
Contributing Author
Mike Woodfield (UK)
Chapter 6: QA/QC and Verification
2006 IPCC Guidelines for National Greenhouse Gas Inventories 6.3
Contents
6 Quality Assurance / Quality Control and Verification
6.1 Introduction ......................................................................................................................................... 6.5 6.2 Practical considerations in developing QA/QC and verification systems ........................................... 6.6 6.3 Elements of a QA/QC and verification system ................................................................................... 6.7 6.4 Roles and responsibilities .................................................................................................................... 6.7 6.5 QA/QC plan ........................................................................................................................................ 6.8 6.6 General QC procedures ....................................................................................................................... 6.9 6.7 Category-specific QC procedures ...................................................................................................... 6.12
6.7.1 Emissions factor QC .................................................................................................................. 6.12 6.7.2 Activity data QC ........................................................................................................................ 6.14 6.7.3 Calculation-related QC .............................................................................................................. 6.16
6.8 QA procedures .................................................................................................................................. 6.17 6.9 QA/QC and uncertainty estimates ..................................................................................................... 6.18 6.10 Verification ....................................................................................................................................... 6.19
6.10.1 Comparisons of national estimates ............................................................................................ 6.19 6.10.2 Comparisons with atmospheric measurements .......................................................................... 6.21
6.11 Documentation, Archiving and Reporting ........................................................................................ 6.22 6.11.1 Internal documentation and archiving ....................................................................................... 6.22 6.11.2 Reporting ................................................................................................................................... 6.23
References ......................................................................................................................................................... 6.23
Annex 6A.1 QC checklists ............................................................................................................................. 6.25
Volume 1: General Guidance and Reporting
6.4 2006 IPCC Guidelines for National Greenhouse Gas Inventories
Tables
Table 6.1 General inventory QC procedures ..................................................................................... 6.10
Boxes
Box 6.1 Definitions of QA/QC and verification ............................................................................... 6.5 Box 6.2 ISO standards related to quality management systems ........................................................ 6.9 Box 6.3 Evaluation of data quality on external data in the transportation sector ............................ 6.15 Box 6.4 Documentation of calculations .......................................................................................... 6.17

Chapter 6: QA/QC and Verification
2006 IPCC Guidelines for National Greenhouse Gas Inventories 6.5
6 QUALITY ASSURANCE/QUALITY CONTROL AND VERIFICATION
6.1 INTRODUCTION An important goal of IPCC inventory guidance is to support the development of national greenhouse gas inventories that can be readily assessed in terms of quality. It is good practice to implement quality assurance/quality control (QA/QC) and verification procedures in the development of national greenhouse gas inventories to accomplish this goal. The procedures as described in this chapter also serve to drive inventory improvement.
The guidance is designed to achieve practicality, acceptability, cost-effectiveness, incorporation of existing experience, and the potential for application on a world-wide basis. A QA/QC and verification system contributes to the objectives of good practice in inventory development, namely to improve transparency, consistency, comparability, completeness, and accuracy of national greenhouse gas inventories.
QA/QC and verification activities should be integral parts of the inventory process. The outcomes of QA/QC and verification may result in a reassessment of inventory or category uncertainty estimates and to subsequent improvements in the estimates of emissions or removals. For example, the results of the QA/QC process may point to particular variables within the estimation methodology for a certain category that should be the focus of improvement efforts.
The terms ‘quality control’, ‘quality assurance’, and ‘verification’ are often used in different ways. The definitions of QC, QA, and verification in Box 6.1 will be used for the purposes of this guidance.
BOX 6.1 DEFINITIONS OF QA/QC AND VERIFICATION
Quality Control (QC) is a system of routine technical activities to assess and maintain the quality of the inventory as it is being compiled. It is performed by personnel compiling the inventory. The QC system is designed to:
(i) Provide routine and consistent checks to ensure data integrity, correctness, and completeness;
(ii) Identify and address errors and omissions;
(iii) Document and archive inventory material and record all QC activities.
QC activities include general methods such as accuracy checks on data acquisition and calculations, and the use of approved standardised procedures for emission and removal calculations, measurements, estimating uncertainties, archiving information and reporting. QC activities also include technical reviews of categories, activity data, emission factors, other estimation parameters, and methods.
Quality Assurance (QA) is a planned system of review procedures conducted by personnel not directly involved in the inventory compilation/development process. Reviews, preferably by independent third parties, are performed upon a completed inventory following the implementation of QC procedures. Reviews verify that measurable objectives (data quality objectives, see Section 6.5, QA/QC Plan.) were met, ensure that the inventory represents the best possible estimates of emissions and removals given the current state of scientific knowledge and data availability, and support the effectiveness of the QC programme.
Verification refers to the collection of activities and procedures conducted during the planning and development, or after completion of an inventory that can help to establish its reliability for the intended applications of the inventory. For the purposes of this guidance, verification refers specifically to those methods that are external to the inventory and apply independent data, including comparisons with inventory estimates made by other bodies or through alternative methods. Verification activities may be constituents of both QA and QC, depending on the methods used and the stage at which independent information is used.
Volume 1: General Guidance and Reporting
6.6 2006 IPCC Guidelines for National Greenhouse Gas Inventories
Before implementing QA/QC and verification activities, it is necessary to determine which techniques should be used, and where and when they will be applied. QC procedures may be general with a possible extension to category specific procedures. There are technical and practical considerations in making these decisions. The technical considerations related to the various QA/QC and verification techniques are discussed in general in this chapter, and specific applications to categories are described in the category-specific guidance in Volumes 2 to 5. The practical considerations involve assessing national circumstances such as available resources and expertise, and the particular characteristics of the inventory (e.g., whether or not a category is key).
6.2 PRACTICAL CONSIDERATIONS IN DEVELOPING QA/QC AND VERIFICATION SYSTEMS
In practice inventory compilers do not have unlimited resources. Quality control requirements, improved accuracy and reduced uncertainty need to be balanced against requirements for timeliness and cost effectiveness. A good practice system for QA/QC and verification seeks to achieve that balance, and also to enable continuous improvement of inventory estimates. Judgements to select the respective parameters will need to be made on the following:
• Resources allocated to QA/QC for different categories and the compilation process;
• Time allocated to conduct the checks and reviews of emissions and removal estimates;
• Frequency of QA/QC checks and reviews on different parts of the inventory;
• The level of QA/QC appropriate for each category;
• Availability and access to information on activity data, emission factors and other estimation parameters, including uncertainties and documentation;
• Acquisition of additional data specifically required, e.g., alternative data sets for comparisons and checks;
• Procedures to ensure confidentiality of inventory and category information, when required;
• Requirements for documenting and archiving information;
• Whether increased effort on QA/QC will result in improved estimates and reduced uncertainties;
• Whether sufficient independent data and expertise are available to conduct verification activities.
In order to prioritise QA/QC and verification efforts for certain categories, particularly in terms of activities requiring more intensive analysis and review, the following questions should be asked to identify where to focus such activities in a given inventory development cycle:
• Is this source/sink a key category according to the definition and methodologies presented in Chapter 4, Methodological Choice and Identification of Key Categories? Has the category been designated as key for qualitative reasons? For example:
- Is there considerable uncertainty associated with the estimates for this category?
- Have there been significant changes in the characteristics of this category, such as technology changes or management practices?
- Have significant changes occurred recently in the estimation methodology used for this category?
- Are there significant changes in the trends of emissions or removals for this category?
• Does the methodology use complex modelling steps or large inputs from outside databases?
• Are emission factors or other parameters associated with the estimation methodology significantly different to recognized IPCC defaults or data used in other inventories?
• Has a significant amount of time passed since emission factors or other parameters have been updated for this category?
• Has a significant amount of time passed since this category last underwent thorough QA/QC and verification procedures?
Chapter 6: QA/QC and Verification
2006 IPCC Guidelines for National Greenhouse Gas Inventories 6.7
• Has there been a significant change in how data are processed or managed for this category, such as a database platform change or change in modelling software?
• Is there a potential overlap with estimates reported under other categories (for example because of common activity data) that can generate double counting or incomplete estimates?
Answering yes to the above questions should help identify those sources/sinks where category specific QA/QC and verification activity should be prioritised. Also, the timing of the QA/QC activity should coincide with changes in the category. One time changes in methodologies or data processing, for example, may only require intensified QA/QC within the inventory cycle where those changes occurred.
In terms of the implementation of QA/QC procedures, there should be no difference between confidential and publicly available data; both should carry descriptions of the measurement and calculation procedures and the steps taken to check and verify the values reported. These procedures may be carried out on the confidential data by either the provider of the information or by the inventory compiler and, in either case, confidential source data should be protected and archived accordingly. However, the QA/QC procedures that are implemented need to remain transparent and their description available for review. For example, when data are aggregated across categories at a national level to protect confidentiality, the report should contain a description of the relevant QA/QC procedures.
6.3 ELEMENTS OF A QA/QC AND VERIFICATION SYSTEM
The following are the major elements of a QA/QC and verification system to be implemented in tracking inventory compilation, which are covered in detail in the following sections:
• Participation of an inventory compiler who is also responsible for coordinating QA/QC and verification activities and definition of roles/responsibilities within the inventory;
• A QA/QC plan;
• General QC procedures that apply to all inventory categories ;
• Category-specific QC procedures;
• QA and review procedures;
• QA/QC system interaction with uncertainty analyses;
• Verification activities;
• Reporting, documentation, and archiving procedures.
A complete QA/QC and verification system will typically consist of the elements mentioned above. General QC procedures should be applied routinely to all categories and to the inventory compilation as a whole. In addition, category-specific procedures based on the prioritisation considerations discussed in Section 6.2 should be used. Verification activities may be directed at specific categories or the inventory as a whole, and their application will depend on the availability of independent estimation methodologies that can be used for comparison.
6.4 ROLES AND RESPONSIBILITIES The inventory compiler should be responsible for coordinating the institutional and procedural arrangements for inventory activities. It is good practice for the inventory compiler to define specific responsibilities and procedures for the planning, preparation, and management of inventory activities, including:
• Data collection;
• Selection of methods, emission factors, activity data and other estimation parameters;
• Estimation of emissions or removals;
• Uncertainty assessment;
• QA/QC and verification activities;
• Documentation and archiving.
Volume 1: General Guidance and Reporting
6.8 2006 IPCC Guidelines for National Greenhouse Gas Inventories
The inventory compiler may designate responsibilities for implementing and documenting QA/QC procedures to other agencies or organisations, such as in cases where national activity data are provided by a central statistical agency. The inventory compiler should ensure that other organisations involved in the preparation of the inventory are following applicable QA/QC procedures and that appropriate documentation of these activities is available.
The inventory compiler is also responsible for ensuring that the QA/QC plan is developed and implemented. It is good practice for the inventory compiler to designate a QA/QC coordinator as the person responsible for ensuring that the objectives of the QA/QC process as set out in the QA/QC plan (see Section 6.5) are met.
6.5 QA/QC PLAN A QA/QC plan is a fundamental element of a QA/QC and verification system. The plan should, in general, outline the QA/QC and verification activities that will be implemented and the institutional arrangements and responsibilities for implementing those activities. The plan should include a scheduled time frame for the QA/QC activities that follows inventory preparation from its initial development through to final reporting in any year.
The QA/QC plan is an internal document to organise and implement QA/QC and verification activities that ensure the inventory is fit for purpose and allow for improvement. Once developed, it can be referenced and used in subsequent inventory preparation, or modified as appropriate (notably, when changes in processes occur or on advice of independent reviewers). A key component of a QA/QC plan is the list of data quality objectives, against which an inventory can be measured in a review. Data quality objectives are concrete targets to be achieved in the inventory preparation. They should be appropriate, realistic (taking national circumstances into account) and allow for an improvement of the inventory. Where possible, data quality objectives should be measurable. Such data quality objectives may be based upon and refined from the following inventory principles:
• Timeliness
• Completeness
• Consistency (internal consistency as well as time series consistency)
• Comparability
• Accuracy
• Transparency
• Improvement
As part of the QA/QC plan, it is good practice to accommodate procedural changes and a feedback of experience. Conclusions from previous reviews need to be used to improve the procedures. Such changes can also concern data quality objectives and the QA/QC plan itself. The periodic review and revision of the QA/QC plan is an important element to drive the continued inventory improvement.
In developing and implementing the QA/QC plan, it may be useful to refer to relevant standards and guidelines published by outside groups involved in inventory development. For example, the International Organization for Standardization (ISO) introduced specifications for quantification, monitoring, and reporting of greenhouse gas emissions and removals (ISO 14064) in organisations. These and other relevant ISO standards are listed in Box 6.2. Also, there are guidelines for corporate and entity level QA/QC and verification techniques, which may be reflected in the overall inventory QA/QC process for categories whose estimates rely on data prepared under those guidelines. Examples of such guidelines include the Greenhouse Gas Protocol developed by the World Business Council for Sustainable Development and the World Resources Institute (The greenhouse gas protocol – A corporate accounting and reporting standard. ISBN 156973-568-9), the Guidelines for the monitoring and reporting of greenhouse gas emissions pursuant to Directive 2003/87/EC, as well as a variety of other regional and national guidelines for emissions trading and reporting systems.
Any specific details of a QA/QC and verification system should be defined in the QA/QC plan so that national circumstances can be taken into account.
Chapter 6: QA/QC and Verification
2006 IPCC Guidelines for National Greenhouse Gas Inventories 6.9
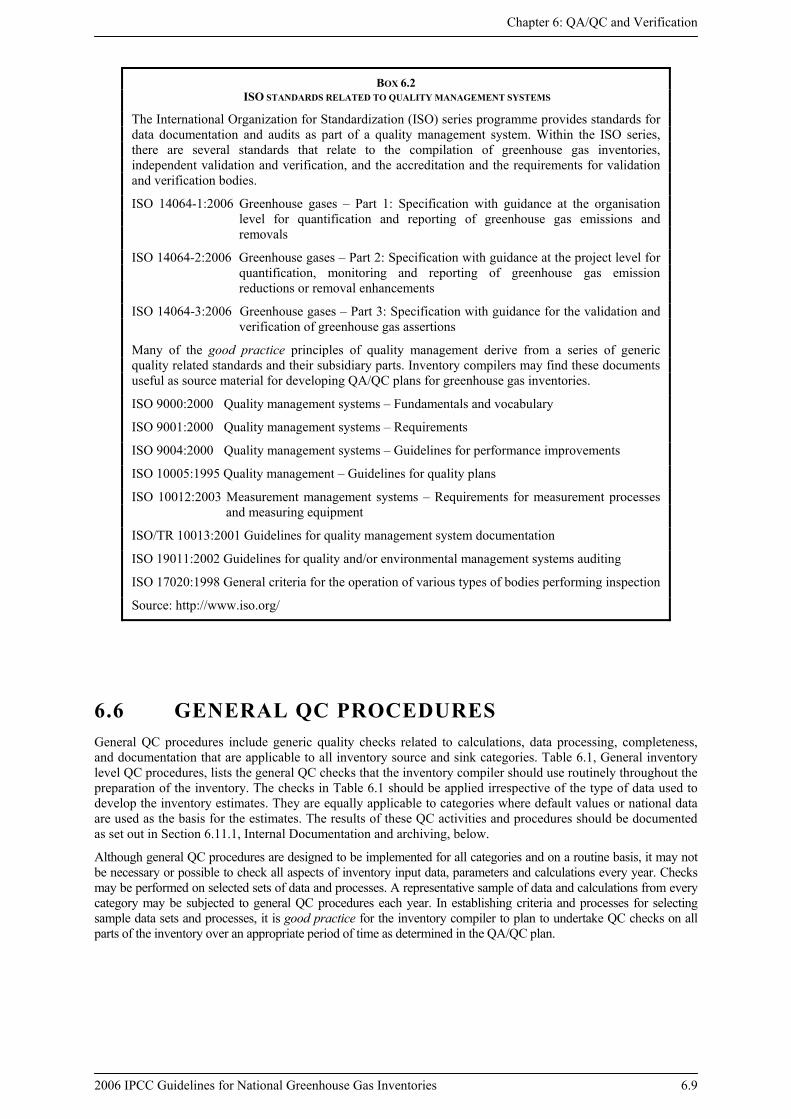
BOX 6.2 ISO STANDARDS RELATED TO QUALITY MANAGEMENT SYSTEMS
The International Organization for Standardization (ISO) series programme provides standards for data documentation and audits as part of a quality management system. Within the ISO series, there are several standards that relate to the compilation of greenhouse gas inventories, independent validation and verification, and the accreditation and the requirements for validation and verification bodies.
ISO 14064-1:2006 Greenhouse gases – Part 1: Specification with guidance at the organisation level for quantification and reporting of greenhouse gas emissions and removals
ISO 14064-2:2006 Greenhouse gases – Part 2: Specification with guidance at the project level for quantification, monitoring and reporting of greenhouse gas emission reductions or removal enhancements
ISO 14064-3:2006 Greenhouse gases – Part 3: Specification with guidance for the validation and verification of greenhouse gas assertions
Many of the good practice principles of quality management derive from a series of generic quality related standards and their subsidiary parts. Inventory compilers may find these documents useful as source material for developing QA/QC plans for greenhouse gas inventories.
ISO 9000:2000 Quality management systems – Fundamentals and vocabulary
ISO 9001:2000 Quality management systems – Requirements
ISO 9004:2000 Quality management systems – Guidelines for performance improvements
ISO 10005:1995 Quality management – Guidelines for quality plans
ISO 10012:2003 Measurement management systems – Requirements for measurement processes and measuring equipment
ISO/TR 10013:2001 Guidelines for quality management system documentation
ISO 19011:2002 Guidelines for quality and/or environmental management systems auditing
ISO 17020:1998 General criteria for the operation of various types of bodies performing inspection
Source: http://www.iso.org/
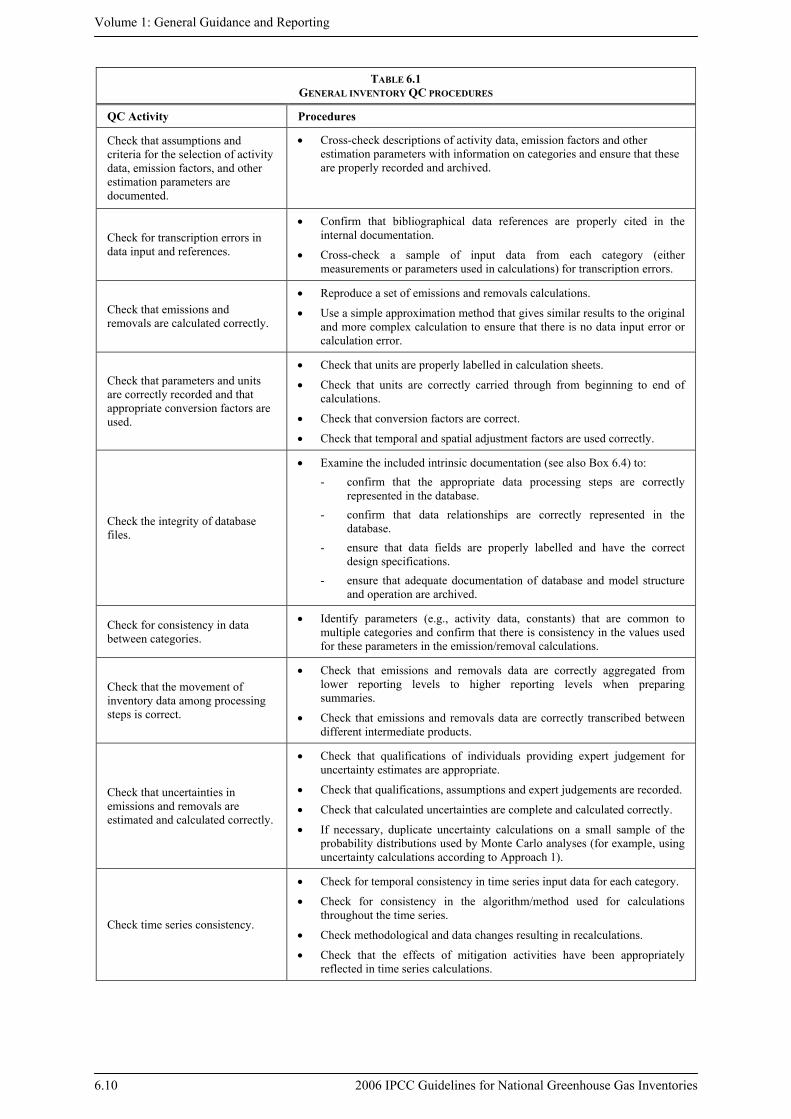
6.6 GENERAL QC PROCEDURES General QC procedures include generic quality checks related to calculations, data processing, completeness, and documentation that are applicable to all inventory source and sink categories. Table 6.1, General inventory level QC procedures, lists the general QC checks that the inventory compiler should use routinely throughout the preparation of the inventory. The checks in Table 6.1 should be applied irrespective of the type of data used to develop the inventory estimates. They are equally applicable to categories where default values or national data are used as the basis for the estimates. The results of these QC activities and procedures should be documented as set out in Section 6.11.1, Internal Documentation and archiving, below.
Although general QC procedures are designed to be implemented for all categories and on a routine basis, it may not be necessary or possible to check all aspects of inventory input data, parameters and calculations every year. Checks may be performed on selected sets of data and processes. A representative sample of data and calculations from every category may be subjected to general QC procedures each year. In establishing criteria and processes for selecting sample data sets and processes, it is good practice for the inventory compiler to plan to undertake QC checks on all parts of the inventory over an appropriate period of time as determined in the QA/QC plan.
Volume 1: General Guidance and Reporting
6.10 2006 IPCC Guidelines for National Greenhouse Gas Inventories
TABLE 6.1 GENERAL INVENTORY QC PROCEDURES
QC Activity Procedures
Check that assumptions and criteria for the selection of activity data, emission factors, and other estimation parameters are documented.
• Cross-check descriptions of activity data, emission factors and other estimation parameters with information on categories and ensure that these are properly recorded and archived.
Check for transcription errors in data input and references.
• Confirm that bibliographical data references are properly cited in the internal documentation.
• Cross-check a sample of input data from each category (either measurements or parameters used in calculations) for transcription errors.
Check that emissions and removals are calculated correctly.
• Reproduce a set of emissions and removals calculations.
• Use a simple approximation method that gives similar results to the original and more complex calculation to ensure that there is no data input error or calculation error.
Check that parameters and units are correctly recorded and that appropriate conversion factors are used.
• Check that units are properly labelled in calculation sheets.
• Check that units are correctly carried through from beginning to end of calculations.
• Check that conversion factors are correct.
• Check that temporal and spatial adjustment factors are used correctly.
Check the integrity of database files.
• Examine the included intrinsic documentation (see also Box 6.4) to: - confirm that the appropriate data processing steps are correctly
represented in the database. - confirm that data relationships are correctly represented in the
database. - ensure that data fields are properly labelled and have the correct
design specifications. - ensure that adequate documentation of database and model structure
and operation are archived.
Check for consistency in data between categories.
• Identify parameters (e.g., activity data, constants) that are common to multiple categories and confirm that there is consistency in the values used for these parameters in the emission/removal calculations.
Check that the movement of inventory data among processing steps is correct.
• Check that emissions and removals data are correctly aggregated from lower reporting levels to higher reporting levels when preparing summaries.
• Check that emissions and removals data are correctly transcribed between different intermediate products.
Check that uncertainties in emissions and removals are estimated and calculated correctly.
• Check that qualifications of individuals providing expert judgement for uncertainty estimates are appropriate.
• Check that qualifications, assumptions and expert judgements are recorded.
• Check that calculated uncertainties are complete and calculated correctly.
• If necessary, duplicate uncertainty calculations on a small sample of the probability distributions used by Monte Carlo analyses (for example, using uncertainty calculations according to Approach 1).
Check time series consistency.
• Check for temporal consistency in time series input data for each category.
• Check for consistency in the algorithm/method used for calculations throughout the time series.
• Check methodological and data changes resulting in recalculations.
• Check that the effects of mitigation activities have been appropriately reflected in time series calculations.
Chapter 6: QA/QC and Verification
2006 IPCC Guidelines for National Greenhouse Gas Inventories 6.11
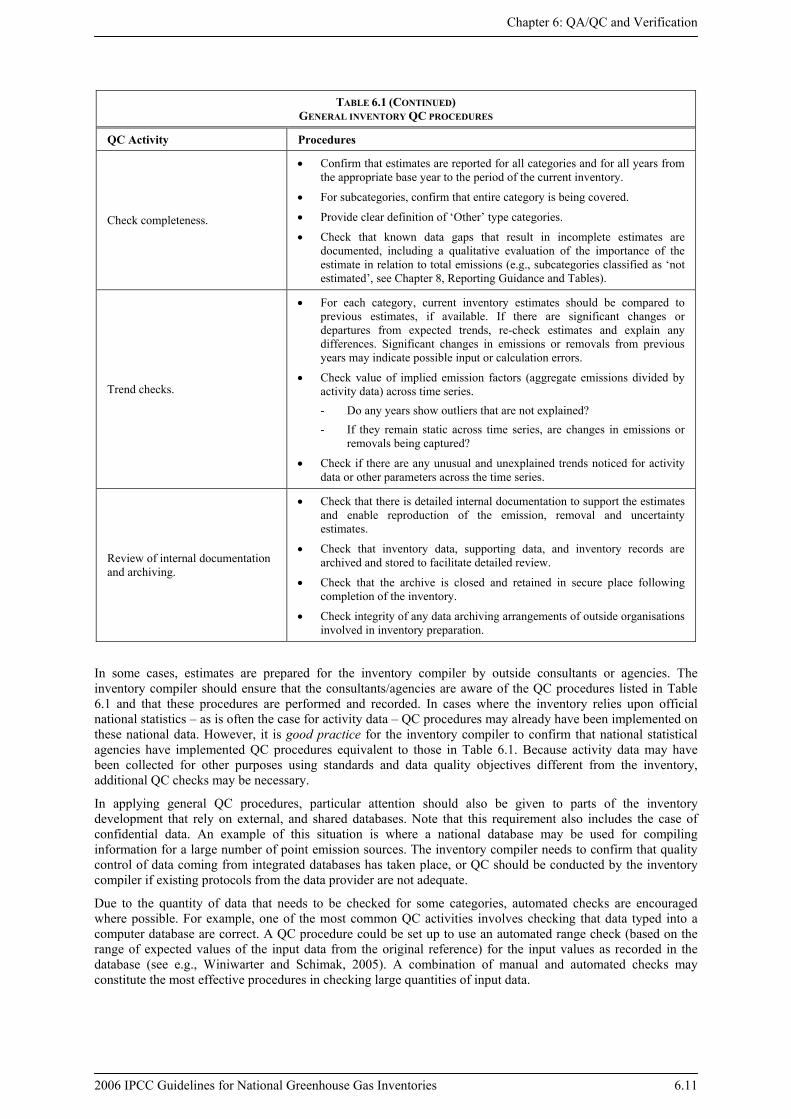
TABLE 6.1 (CONTINUED) GENERAL INVENTORY QC PROCEDURES
QC Activity Procedures
Check completeness.
• Confirm that estimates are reported for all categories and for all years from the appropriate base year to the period of the current inventory.
• For subcategories, confirm that entire category is being covered.
• Provide clear definition of ‘Other’ type categories.
• Check that known data gaps that result in incomplete estimates are documented, including a qualitative evaluation of the importance of the estimate in relation to total emissions (e.g., subcategories classified as ‘not estimated’, see Chapter 8, Reporting Guidance and Tables).
Trend checks.
• For each category, current inventory estimates should be compared to previous estimates, if available. If there are significant changes or departures from expected trends, re-check estimates and explain any differences. Significant changes in emissions or removals from previous years may indicate possible input or calculation errors.
• Check value of implied emission factors (aggregate emissions divided by activity data) across time series. - Do any years show outliers that are not explained? - If they remain static across time series, are changes in emissions or
removals being captured?
• Check if there are any unusual and unexplained trends noticed for activity data or other parameters across the time series.
Review of internal documentation and archiving.
• Check that there is detailed internal documentation to support the estimates and enable reproduction of the emission, removal and uncertainty estimates.
• Check that inventory data, supporting data, and inventory records are archived and stored to facilitate detailed review.
• Check that the archive is closed and retained in secure place following completion of the inventory.
• Check integrity of any data archiving arrangements of outside organisations involved in inventory preparation.
In some cases, estimates are prepared for the inventory compiler by outside consultants or agencies. The inventory compiler should ensure that the consultants/agencies are aware of the QC procedures listed in Table 6.1 and that these procedures are performed and recorded. In cases where the inventory relies upon official national statistics – as is often the case for activity data – QC procedures may already have been implemented on these national data. However, it is good practice for the inventory compiler to confirm that national statistical agencies have implemented QC procedures equivalent to those in Table 6.1. Because activity data may have been collected for other purposes using standards and data quality objectives different from the inventory, additional QC checks may be necessary.
In applying general QC procedures, particular attention should also be given to parts of the inventory development that rely on external, and shared databases. Note that this requirement also includes the case of confidential data. An example of this situation is where a national database may be used for compiling information for a large number of point emission sources. The inventory compiler needs to confirm that quality control of data coming from integrated databases has taken place, or QC should be conducted by the inventory compiler if existing protocols from the data provider are not adequate.
Due to the quantity of data that needs to be checked for some categories, automated checks are encouraged where possible. For example, one of the most common QC activities involves checking that data typed into a computer database are correct. A QC procedure could be set up to use an automated range check (based on the range of expected values of the input data from the original reference) for the input values as recorded in the database (see e.g., Winiwarter and Schimak, 2005). A combination of manual and automated checks may constitute the most effective procedures in checking large quantities of input data.
Volume 1: General Guidance and Reporting
6.12 2006 IPCC Guidelines for National Greenhouse Gas Inventories
6.7 CATEGORY-SPECIFIC QC PROCEDURES Category-specific QC complements general inventory QC procedures and is directed at specific types of data used in the methods for individual source or sink categories. These procedures require knowledge of the specific category, the types of data available and the parameters associated with emissions or removals, and are performed in addition to the general QC checks listed in Table 6.1. Category-specific procedures are applied on a case-by-case basis focusing on key categories (see Chapter 4, Methodological Choice and Identification of Key Categories) and on categories where significant methodological and data revisions have taken place. In particular, inventory compilers applying higher tier methods in compiling national inventories should utilise category-specific QC procedures to help evaluate the quality of national approaches. Specific applications of category-specific QC procedures are provided in the Energy, Industrial Processes and Product Use (IPPU), Agriculture, Forestry and Other Land Use (AFOLU), and Waste Volumes of this report (Volumes 2 to 5).
Category-specific QC activities include both emissions (or removals) data QC and activity data QC. The relevant QC procedures will depend on the method used to estimate the emissions or removals for a given category. If outside agencies develop estimates, the inventory compiler may, upon review, reference the QC activities of the outside agency as part of the QA/QC plan. There is no need to duplicate QC activities if the inventory compiler is satisfied that the QC activities performed by the outside agency meet the requirements of the QA/QC plan.
Several of the checking procedures mentioned in this section draw on comparisons with independent datasets. It is important to understand that discrepancies will not always indicate a problem – especially if alternate datasets are a priori expected to be less relevant and for this reason are not used for calculations directly. It should be an aim of inventory compilation to address and if possible explain such discrepancies.
6.7.1 Emissions factor QC The following sections describe QC checks on IPCC default emission factors, country-specific emission factors, and direct emission measurements from individual sites (used either as the basis for a site-specific emission factor or directly for an emissions estimate). While the term ‘emissions’ is used in this section, the same types of activities are applicable to calculation parameters for ‘removals’ as well. Inventory compilers should take into account the practical considerations discussed in Section 6.2, Practical Considerations in Developing QA/QC and Verification Systems, when determining what level of QC activities to undertake.
6.7.1.1 IPCC DEFAULT EMISSION FACTORS When using IPCC default emission factors, it is good practice for the inventory compiler to assess the applicability of these factors to national circumstances. This assessment may include an evaluation of national conditions compared to the context of the studies upon which the IPCC default emission factors were based. If there is insufficient information on the context of the IPCC default emission factors, the inventory compiler should take account of this in assessing the uncertainty of the national emissions estimates based on the IPCC default emission factors.
If possible, a supplemental activity is to compare IPCC default emission factors with site or plant-level factors to determine their representativeness relative to actual sources in the country. This supplementary check is good practice even if data are only available for a small percentage of sites or plants.
6.7.1.2 COUNTRY-SPECIFIC EMISSION FACTORS Country-specific emission factors may be developed at a national or other aggregated level within the country based on prevailing technology, science, local characteristics and other criteria. These factors are not necessarily site-specific, but are used to represent a source/sink category or subcategory of the country. The following types of QC checks should be used to evaluate the quality of country-specific factors.
QC checks on the background data used to develop emission factors: It is important to assess the adequacy of the emission factors and the QA/QC performed during their development. If emission factors are based on site-specific or source-level testing, then the inventory compiler should check if the measurement programme included appropriate QC procedures (see Section 6.7.1.3 on QC for direct emission measurements).
Chapter 6: QA/QC and Verification
2006 IPCC Guidelines for National Greenhouse Gas Inventories 6.13
Frequently, country-specific emission factors will be based on secondary data sources, such as published studies or other literature.1 In these cases, the inventory compiler could attempt to determine whether the QC activities conducted during the original preparation of the data are consistent with the applicable QC procedures outlined in Table 6.1 and whether any limitations of the secondary data have been identified and documented. The inventory compiler could also attempt to establish whether the secondary data have undergone peer review and record the scope of such a review. Specifically, it is important to investigate any potential conflicts-of-interest, when the interests of a data provider, e.g., financial interests, might influence results.
If the QA/QC associated with the secondary data is inadequate, the inventory compiler should attempt to establish QA/QC checks on the secondary data. The inventory compiler should also reassess the uncertainty of any emissions estimates derived from the secondary data. The inventory compiler may also want to consider if any alternative data, including IPCC default values, may provide a better estimate of emissions from this category.
QC checks on Models: Because models are means of extrapolating and/or interpolating from a limited set of known data, they often require assumptions and procedural steps to represent the entire inventory area. If QA/QC associated with models is inadequate or not transparent, the inventory compiler should attempt to establish checks on the models and data. In particular, the inventory compiler should check the following:
(i) Appropriateness of model assumptions, extrapolations, interpolations, calibration-based modifications, data characteristics, and their applicability to the greenhouse gas inventory methods and national circumstances;
(ii) Availability of model documentation, including descriptions, assumptions, rationale, and scientific evidence and references supporting the approach and parameters used for modelling;
(iii) Types and results of QA/QC procedures, including model validation steps, performed by model developers and data suppliers. Responses to these results should be documented;
(iv) Plans to periodically evaluate and update or replace assumptions with appropriate new measurements. Key assumptions may be identified by performing sensitivity analyses;
(v) Completeness in relation to the IPCC source/sink categories.
Comparison with IPCC default factors: Inventory compilers should compare country-specific factors with relevant IPCC default emission factors, taking into consideration the characteristics and properties on which the default factors are based. The intent of this comparison is to determine whether country-specific factors are reasonable, given similarities or differences between the national source/sink category and the ‘average’ category represented by the defaults. Large differences between country-specific factors and default factors do not necessarily indicate problems, but nevertheless may point to quality issues if the differences can not be explained.
Comparisons of emission factors between countries: Between-country emission factor comparisons can be combined with historic trends by plotting, for different countries, the reference year value (e.g., 1990), the most recent year value, and the minimum and maximum values. This analysis could be made for each source/sink category and possible aggregations. Comparisons between countries can also be made using aggregate emissions divided by activity data (implied emission factors). This type of comparison may enable outlier detection based on the statistical distribution of values from the sample of countries considered. When using between-country emission factor comparisons as a QC check, it is important to investigate similarities and differences in national circumstances for the relevant category. If source/sink category characteristics are dissimilar between countries, this diminishes the effectiveness of this check.
Comparison to plant-level emission factors: A supplementary step is to compare the country-specific factors with site-specific or plant-level factors if these are available. For example, if there are emission factors available for a few plants (but not enough to support a bottom-up approach) these plant-specific factors could be compared with the aggregated factor used in the inventory. This type of comparison provides an indication of both the reasonableness of the country-specific factor and its representativeness.
1 Secondary data sources refer to reference sources for inventory data that are not designed for the express purpose of
inventory development. Secondary data sources typically include national statistical databases, scientific literature, and other studies produced by agencies or organisations not associated with the inventory development.
Volume 1: General Guidance and Reporting
6.14 2006 IPCC Guidelines for National Greenhouse Gas Inventories
6.7.1.3 DIRECT EMISSION MEASUREMENTS Emissions from a category may be estimated using direct measurements in the following ways:
• Sample emissions measurements from a facility may be used to develop a representative emission factor for that individual site, or for the entire category (i.e., for development of a national level emission factor);
• Continuous emissions monitoring (CEM) data may be used to compile an annual estimate of emissions for a particular process. Properly implemented, CEM can provide a complete set of quantified emissions data across the inventory period for an individual facility process, and does not have to be correlated back to a process parameter or input variable like an emission factor.
The data provider should check all measurements as part of the QC activities . The use of standard measurement methods improves the consistency of resulting data and knowledge of the statistical properties of the data. If standard reference methods for measuring specific greenhouse gas emissions (and removals) are available, inventory compilers should encourage plants to use these. Plants and facilities that implement direct measurements as part of official regulatory requirements may have mandated measurement QC standards already in place. If specific standard methods are not available, the inventory compiler should confirm whether nationally or internationally recognised standard procedures to quantify performance characteristics of air quality measurement (such as ISO 10012) are used to characterize the measurements, and whether the measurement equipment is calibrated, maintained, and situated such that it gives a representative result. Additional details on using direct measurements are provided in Chapter 2, Approaches to Data Collection, specifically in Table 2.2.
Where direct measurement data from individual sites are in question, discussions with site managers can be useful to encourage improvement of the QA/QC practices at the sites. Also, supplementary QC activities are encouraged for bottom-up methods based on site-specific emission factors where significant uncertainties remain in the estimates. Site-specific factors can be compared between sites and also to IPCC or national level defaults. Distinct differences between sites or between a particular site and the IPCC defaults should elicit further review and checks on calculations. Large differences should be explained and documented.
6.7.2 Activity data QC The estimation methods for many categories rely on the use of activity data and associated input variables that are not directly prepared by the inventory compiler. Activity data at a national level are normally drawn from secondary data sources or site-specific data prepared by site or plant personnel from their own measurements. Inventory compilers should take into account the practical considerations discussed in Section 6.2 when determining the level of QC activities to undertake.
6.7.2.1 NATIONAL LEVEL ACTIVITY DATA Following are fundamental QC checks that should be considered for assessing the quality of national level activity data. In all cases, it is important to have a well-defined and documented data set from which appropriate checks can be developed.
QC checks of reference source for national activi ty data: When using national activity data from secondary data, it is good practice for the inventory compiler to evaluate and document the associated QA/QC activities. This is particularly important with regard to activity data, since most activity data are originally prepared for purposes other than as input to estimates of greenhouse gas emissions. Many statistical organisations, for example, have their own procedures for assessing the quality of the data independently of what the end use of the data may be.
The inventory compiler should determine if the level of QC associated with secondary activity data includes, at a minimum, those QC procedures listed in Table 6.1. In addition, the inventory compiler may check for any peer review of the secondary data and document the scope of this review. If the QA/QC associated with the secondary data is adequate, then the inventory compiler can simply reference the data source and document the applicability of the data for use in its estimates (see Box 6.3 for an example of this procedure).
If the QC associated with the secondary data is inadequate or if the data have been collected using standards/definitions that deviate from this guidance, then the inventory compiler should establish QA/QC checks on the secondary data. The uncertainty of estimates should be reassessed in the light of the findings. The inventory compiler should also reconsider how the data are used and whether any alternative data and international data sets may provide a better estimate of emissions or removals. If no alternative data sources are
Chapter 6: QA/QC and Verification
2006 IPCC Guidelines for National Greenhouse Gas Inventories 6.15
available, the inventory compiler should document the inadequacies associated with the secondary data QC as part of its summary report on QA/QC.
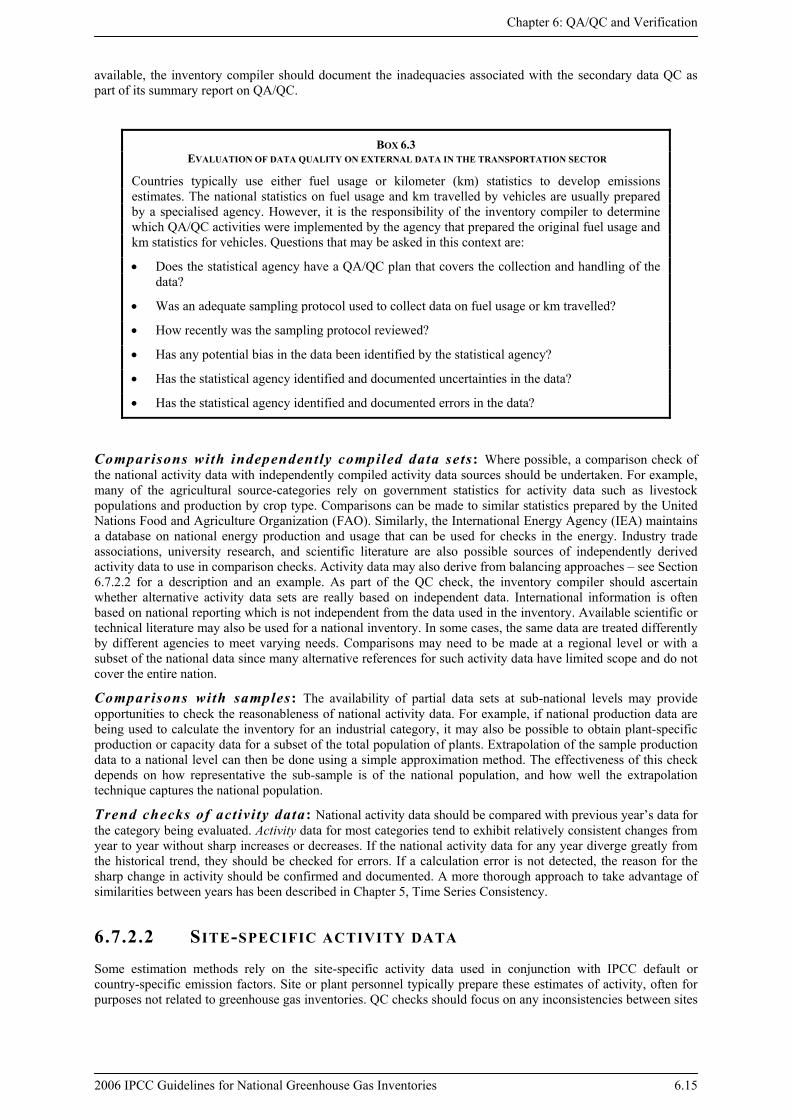
BOX 6.3 EVALUATION OF DATA QUALITY ON EXTERNAL DATA IN THE TRANSPORTATION SECTOR
Countries typically use either fuel usage or kilometer (km) statistics to develop emissions estimates. The national statistics on fuel usage and km travelled by vehicles are usually prepared by a specialised agency. However, it is the responsibility of the inventory compiler to determine which QA/QC activities were implemented by the agency that prepared the original fuel usage and km statistics for vehicles. Questions that may be asked in this context are:
• Does the statistical agency have a QA/QC plan that covers the collection and handling of the data?
• Was an adequate sampling protocol used to collect data on fuel usage or km travelled?
• How recently was the sampling protocol reviewed?
• Has any potential bias in the data been identified by the statistical agency?
• Has the statistical agency identified and documented uncertainties in the data?
• Has the statistical agency identified and documented errors in the data?
Comparisons with independently compiled data sets: Where possible, a comparison check of the national activity data with independently compiled activity data sources should be undertaken. For example, many of the agricultural source-categories rely on government statistics for activity data such as livestock populations and production by crop type. Comparisons can be made to similar statistics prepared by the United Nations Food and Agriculture Organization (FAO). Similarly, the International Energy Agency (IEA) maintains a database on national energy production and usage that can be used for checks in the energy. Industry trade associations, university research, and scientific literature are also possible sources of independently derived activity data to use in comparison checks. Activity data may also derive from balancing approaches – see Section 6.7.2.2 for a description and an example. As part of the QC check, the inventory compiler should ascertain whether alternative activity data sets are really based on independent data. International information is often based on national reporting which is not independent from the data used in the inventory. Available scientific or technical literature may also be used for a national inventory. In some cases, the same data are treated differently by different agencies to meet varying needs. Comparisons may need to be made at a regional level or with a subset of the national data since many alternative references for such activity data have limited scope and do not cover the entire nation.
Comparisons with samples: The availability of partial data sets at sub-national levels may provide opportunities to check the reasonableness of national activity data. For example, if national production data are being used to calculate the inventory for an industrial category, it may also be possible to obtain plant-specific production or capacity data for a subset of the total population of plants. Extrapolation of the sample production data to a national level can then be done using a simple approximation method. The effectiveness of this check depends on how representative the sub-sample is of the national population, and how well the extrapolation technique captures the national population.
Trend checks of activi ty data: National activity data should be compared with previous year’s data for the category being evaluated. Activity data for most categories tend to exhibit relatively consistent changes from year to year without sharp increases or decreases. If the national activity data for any year diverge greatly from the historical trend, they should be checked for errors. If a calculation error is not detected, the reason for the sharp change in activity should be confirmed and documented. A more thorough approach to take advantage of similarities between years has been described in Chapter 5, Time Series Consistency.
6.7.2.2 SITE-SPECIFIC ACTIVITY DATA Some estimation methods rely on the site-specific activity data used in conjunction with IPCC default or country-specific emission factors. Site or plant personnel typically prepare these estimates of activity, often for purposes not related to greenhouse gas inventories. QC checks should focus on any inconsistencies between sites
Volume 1: General Guidance and Reporting
6.16 2006 IPCC Guidelines for National Greenhouse Gas Inventories
to check whether these reflect errors, different measurement techniques, or real differences in emissions, operating conditions or technology. A variety of QC checks can identify errors in site-level activity data.
QC checks of measurement protocol: The inventory compiler should establish whether individual sites carried out measurements using recognised national or international standards. If the measurements conform to recognised national or international standards and a QA/QC process is in place, then no further QA/QC will be necessary. Acceptable QC procedures in use at the site may be directly referenced. If the measurements do not conform to standard methods and QA/QC is not acceptable, then the inventory compiler should carefully evaluate use of these activity data.
Comparisons between si tes and with national data: Comparisons of activity data from different reference sources and geographic scales can play a role in confirming activity data. For example, in estimating PFC emissions from primary aluminium smelting, many inventory compilers use smelter-specific activity data to prepare the inventory estimates. A QC check of the aggregated activity data from all aluminium smelters against national production statistics for the industry can identify major omissions or over-counting. Also, a comparison of production data across different sites, possibly with adjustments made for plant capacities, can indicate the reasonableness of the production data. Similar comparisons of activity data can be made for other manufacturing-based source categories where there are published data on national production. Any identified outliers should be investigated to determine if the difference can be explained by the unique characteristics of the site or there is an error in the reported activity data.
Production and consumption balances: Site-specific activity data checks may also be applied to methods based on product usage. For example, one method for estimating SF6 emissions from the use in electrical equipment relies on an account balance of gas purchases, gas sales for recycling, the amount of gas stored on site (outside of equipment), handling losses, refills for maintenance, and the total holding capacity of the equipment system. This account balance system should be used at each facility where the equipment is in place. A QC check of overall national activity could be made by performing the same kind of account balancing procedure on a national basis. This national account balancing would consider national sales of SF6 for the use in electrical equipment, the nation-wide increase in the total handling capacity of the equipment that may be obtained from equipment manufacturers, and the quantity of SF6 destroyed in the country. The results of the bottom-up and top-down account balancing analyses should agree, or large differences should be explained. Similar accounting techniques can be used as QC checks on other categories based on gas usage, e.g., substitutes for ozone-depleting substances, to check consumption and emissions.
6.7.3 Calculation-related QC The principles described above for the input data are similarly applicable to all calculation procedures used to prepare a national greenhouse gas inventory. Checks of the calculation algorithm will safeguard against duplication of inputs, unit conversion errors, or similar calculation errors. These checks can be independent ‘back-of-the-envelope’ calculations, which simplify the algorithms to arrive at an approximate method. If the original calculation and the simple approximate method disagree, it is good practice to examine both approaches to find the reason for discrepancy. Further checks on the calculation procedure will require external data (see Section 6.10, Verification).
It is a prerequisite that all calculations leading to emission or removal estimates should be fully reproducible. It is good practice to discriminate between input data, the conversion algorithm of a calculation and the output. Not only does the output need to be recorded, but also the input, the conversion algorithm, and how this algorithm accesses the input. Box 6.4 provides practical hints how to record a calculation procedure in standard spreadsheet or database calculations. Such an approach allows for intrinsic documentation of the work, and for easy understanding of the calculation procedure. The documentation should be retained with the material archived in support of the completed inventory.
Chapter 6: QA/QC and Verification
2006 IPCC Guidelines for National Greenhouse Gas Inventories 6.17
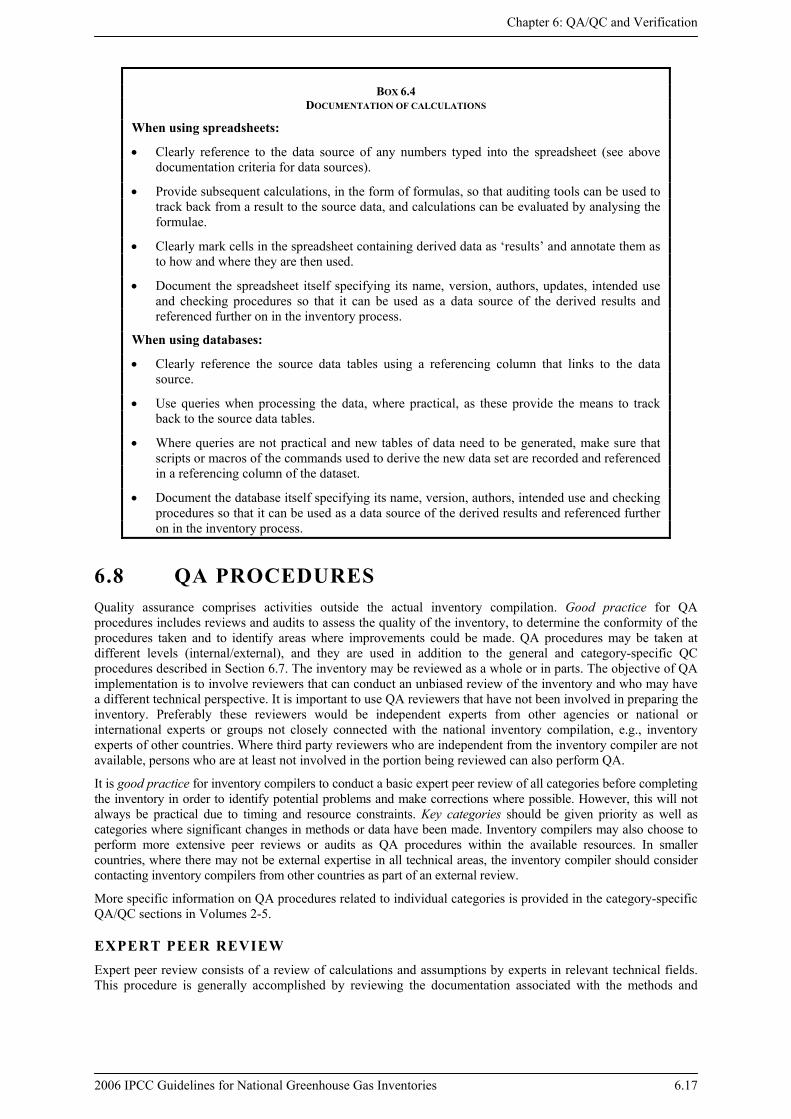
BOX 6.4
DOCUMENTATION OF CALCULATIONS
When using spreadsheets:
• Clearly reference to the data source of any numbers typed into the spreadsheet (see above documentation criteria for data sources).
• Provide subsequent calculations, in the form of formulas, so that auditing tools can be used to track back from a result to the source data, and calculations can be evaluated by analysing the formulae.
• Clearly mark cells in the spreadsheet containing derived data as ‘results’ and annotate them as to how and where they are then used.
• Document the spreadsheet itself specifying its name, version, authors, updates, intended use and checking procedures so that it can be used as a data source of the derived results and referenced further on in the inventory process.
When using databases:
• Clearly reference the source data tables using a referencing column that links to the data source.
• Use queries when processing the data, where practical, as these provide the means to track back to the source data tables.
• Where queries are not practical and new tables of data need to be generated, make sure that scripts or macros of the commands used to derive the new data set are recorded and referenced in a referencing column of the dataset.
• Document the database itself specifying its name, version, authors, intended use and checking procedures so that it can be used as a data source of the derived results and referenced further on in the inventory process.
6.8 QA PROCEDURES Quality assurance comprises activities outside the actual inventory compilation. Good practice for QA procedures includes reviews and audits to assess the quality of the inventory, to determine the conformity of the procedures taken and to identify areas where improvements could be made. QA procedures may be taken at different levels (internal/external), and they are used in addition to the general and category-specific QC procedures described in Section 6.7. The inventory may be reviewed as a whole or in parts. The objective of QA implementation is to involve reviewers that can conduct an unbiased review of the inventory and who may have a different technical perspective. It is important to use QA reviewers that have not been involved in preparing the inventory. Preferably these reviewers would be independent experts from other agencies or national or international experts or groups not closely connected with the national inventory compilation, e.g., inventory experts of other countries. Where third party reviewers who are independent from the inventory compiler are not available, persons who are at least not involved in the portion being reviewed can also perform QA.
It is good practice for inventory compilers to conduct a basic expert peer review of all categories before completing the inventory in order to identify potential problems and make corrections where possible. However, this will not always be practical due to timing and resource constraints. Key categories should be given priority as well as categories where significant changes in methods or data have been made. Inventory compilers may also choose to perform more extensive peer reviews or audits as QA procedures within the available resources. In smaller countries, where there may not be external expertise in all technical areas, the inventory compiler should consider contacting inventory compilers from other countries as part of an external review.
More specific information on QA procedures related to individual categories is provided in the category-specific QA/QC sections in Volumes 2-5.
EXPERT PEER REVIEW Expert peer review consists of a review of calculations and assumptions by experts in relevant technical fields. This procedure is generally accomplished by reviewing the documentation associated with the methods and
Volume 1: General Guidance and Reporting
6.18 2006 IPCC Guidelines for National Greenhouse Gas Inventories
results, but usually does not include rigorous certification of data or references such as might be undertaken in an audit.2 The objective of the expert peer review is to ensure that the inventory’s results, assumptions, and methods are reasonable as judged by those knowledgeable in the specific field. Also, where a country has formal stakeholder and public review mechanisms in place, these reviews can supplement expert peer reviews although they should not replace them.
There are no standard tools or mechanisms for expert peer review of greenhouse gas inventories, and its use should be considered on a case-by-case basis. If there is a high level of uncertainty associated with an estimate for a category, expert peer review may provide information to improve the estimate, or at least to better quantify the uncertainty. Effective peer reviews often involve identifying and contacting key independent organisations or research institutions to identify the most appropriate individuals to conduct the review. It is preferable for this expert input to be sought early in the inventory development process so that the experts can provide review of methods and data acquisition that could affect final calculations.
The results of expert analyses from the UNFCCC processes3 should also be considered as part of the overall QA improvement process. Results and suggestions from these processes can provide valuable feedback on areas where the inventories can be improved. However, these processes should only be considered as supplements to a nationally organised QA and review procedures.
The results of expert peer review, and the response of the inventory compiler to those findings, may be important to general acceptance of the final inventory. All expert peer reviews should be well documented, preferably in a report or checklist format that shows the findings and recommendations for improvement.
AUDITS For the purpose of good practice in inventory preparation, audits may be used to evaluate how effectively the inventory compiler complies with the minimum QC specifications outlined in the QC plan. It is important that the auditor be independent of the inventory compiler as much as possible so as to be able to provide an objective assessment of the processes and data evaluated. Audits may be conducted during the preparation of an inventory, following inventory preparation, or on a previous inventory. Audits are especially useful when new estimation methods are adopted, or when there are substantial changes in existing methods. In contrast to an expert peer review, audits do not focus on the result of calculation. Instead, they provide an in-depth analysis of the respective procedures taken to develop an inventory, and on the documentation available. It is good practice for the inventory compiler to develop a schedule of audits at strategic points in the inventory development. For example, audits related to initial data collection, measurement work, transcription, calculation and documentation may be conducted. Audits can be used to verify that the QC steps identified in Table 6.1 have been implemented, that category-specific QC procedures have been implemented according to the QC plan, and that the data quality objectives have been met.
6.9 QA/QC AND UNCERTAINTY ESTIMATES The QA/QC process and uncertainty analyses provide valuable feedback to one another. Staff involved in the QA/QC and uncertainty analyses can identify critical components of the inventory estimates and data sources that contribute to both the uncertainty level and inventory quality and which should therefore be a primary focus of inventory improvement efforts. This information should ultimately be useful in improving the methods and data sources used for the estimates. For example, the uncertainty analysis can provide insights into weaknesses in the estimate, the sensitivity of the estimate to different variables, and the greatest contributors to uncertainty, all of which can assist in setting priorities for improving data sources or methodologies.
Some of the uncertainty estimation methods rely on the use of measured data associated with the emission factors or activity data to develop probability density functions from which uncertainty estimates can be made. In the absence of measured data, many uncertainty estimates will rely on expert judgement. It is good practice to apply QC procedures to uncertainty estimation to confirm that calculations are correct and data and calculations well documented. The assumptions on which uncertainty estimation has been based should be documented for each category. Calculations of category-specific and aggregated uncertainty estimates should be checked and any errors addressed. For uncertainty estimates involving expert judgement, the qualifications of experts should also
2 Formal expert review as defined by government agencies in some countries may include standardised procedures and other
elements of a thorough audit, as described in this Chapter. 3 Examples of relevant processes include inventory reviews of Annex I Parties, reviews of National Communications and
feedback from the Consultative Group of Experts on National Communications from Parties not included in Annex I to the Convention (CGE).
Chapter 6: QA/QC and Verification
2006 IPCC Guidelines for National Greenhouse Gas Inventories 6.19
be checked and documented, as should the process of eliciting expert judgement, including information on the data considered, literature references, assumptions made and scenarios considered. Chapter 2, Approaches to Data Collection, contains advice on how to document expert judgements on uncertainties.
6.10 VERIFICATION For the purposes of this guidance, verification activities include comparisons with emission or removal estimates prepared by other bodies and comparisons with estimates derived from fully independent assessments, e.g., atmospheric concentration measurements. Verification activities provide information for countries to improve their inventories and are part of the overall QA/QC and verification system. Correspondence between the national inventory and independent estimates increases the confidence and reliability of the inventory estimates by confirming the results. Significant differences may indicate weaknesses in either or both of the datasets. Without knowing which dataset is better, it may be worthwhile to re-evaluate the inventory. This section describes approaches that can be used to verify inventory estimates at both the source/sink category and inventory wide levels.
The considerations for selecting verification approaches include: scale of interest, costs, desired level of accuracy and precision, complexity of design and implementation of the verification approaches, availability of data, and the required level of expertise needed for implementation. Not all approaches will be available to every inventory compiler due to some of these criteria, particularly the techniques included in ‘comparisons with atmospheric measurements’ described in Section 6.10.2, which can be resource and data intensive. However, there are a number of relatively simple, comparison techniques that should be available to most inventory compilers, and that can be valuable tools in the overall QA/QC and verification system. As much information required may be available on a national level, we will refer to these as national activities. The same concept can easily be transferred to other spatial units, if data are available.
Where verification techniques are used, they should be reflected in the QA/QC plan. The limitations and uncertainties associated with the verification technique itself should be thoroughly investigated prior to its implementation so that the results can be properly interpreted.
6.10.1 Comparisons of national estimates There are a number of practical verification techniques that do not require specialised modelling expertise or extended analyses. Most of these can be considered as method-based comparisons that consider the differences in national estimates based on using alternative estimation methodologies for the same category or set of categories. These comparisons look for major calculation errors and exclusion of major source categories or sub-source categories. Method-based comparisons can be designed around the multi-tier level of methods outlined for each category in the sector guidance, through comparisons to independent estimates developed by other institutions, and, to a limited extent, through cross-country comparisons. The choice of method will depend on the method used in the inventory, a clear definition and correlation of categories between methods, and the availability of alternative data.
These checks can be extremely useful in confirming the reasonableness of national inventory estimates and may help identify any gross calculation errors. Some of these techniques, such as the compilation of the reference approach for Energy Sector estimates, should be considered as part of the inventory development process.
Discrepancies between inventory data and data compiled using alternative methods do not necessarily imply that the inventory data are in error. When analysing discrepancies, it is important to consider that there may be large uncertainties associated with the alternative calculations themselves.
Applying lower t ier methods: Lower tier IPCC methods typically are based on ‘top-down’ approaches that rely on highly aggregated data at a summary category level. Inventory compilers using higher tier, ‘bottom-up’ approaches may consider using comparisons to lower-tier methods as a simple verification tool. As an example, for carbon dioxide (CO2) from fossil fuel combustion, a reference calculation based on apparent fuel consumption per fuel type is specified as a verification check in the Energy Sector procedures (see Volume 2: Energy). This reference approach estimate can be compared to the sum of sectoral-based estimates from a Tier 1, 2, or 3 approach. While the quality of the reference approach is typically lower than that of the sectoral approach, it remains useful as a simple approximation method. It is less sensitive to errors due to its simplicity and can be used as a top-down completeness check. Another example, where emissions are calculated as the sum of sectoral activities based on the consumption of a specific commodity, e.g., fuels or products like hydrofluorocarbons (HFCs), perfluorocarbons (PFCs) or sulphur hexafluoride (SF6), the emissions could be estimated using apparent
Volume 1: General Guidance and Reporting
6.20 2006 IPCC Guidelines for National Greenhouse Gas Inventories
consumption figures, e.g., national total production + import – export ± stock changes, taking into consideration any possible time lags in actual emissions.
Similar checks can be performed for industrial type sources, e.g., nitrous oxide (N2O) estimates for nitric acid production, where inventory estimates were determined for each individual production plant based on plant-specific data. The check of emission estimates would consist of the comparison between the sum of the individual plant-level emission estimates and a top-down emission estimate based on national nitric acid production figures and IPCC default Tier 1 factors. Large differences do not necessarily indicate that there are problems with the inventory estimate. As lower tier methods typically rely on more highly aggregated data, there may be relatively large uncertainties with the Tier 1 approach compared to an inventory estimated using a bottom up approach based on good practice. If differences cannot easily be explained, the inventory compiler may consider the following questions in any further QA/QC checks:
• Are there inaccuracies associated with any of the individual plant estimates (e.g., an extreme outlier may be accounting for an unreasonable quantity of emissions)?
• Are the plant-specific emission factors significantly different from each other?
• Are the plant-specific production rates consistent with published national level production rates?
• Is there any other explanation for a significant difference, such as the effect of controls, the manner in which production is reported or possibly undocumented assumptions?
This is an example of how the results of a relatively simple emission check can lead to a more intensive investigation of the representativeness of the emissions data. Knowledge of the category is required to isolate the parameter that is causing the difference in estimates and to understand the reasons for the difference.
Applying higher t ier methods: Higher tier IPCC methods typically are based on detailed ‘bottom-up’ approaches that rely on highly disaggregated data and a well-defined subcategorisation of sources and sinks. Inventory compilers may find that they can not fully implement a higher tier approach because they are lacking sufficient data or resources. However, the availability of even partial estimates for a subcategory of sources may provide a valuable verification tool for the inventory. An estimate based on higher tier data derived from a proportion of the total sources in a country can be extrapolated to the national level, provided that the sample is representative. Such an extrapolation can be used to corroborate the national estimate.
Comparisons with independently compiled est imates: Comparisons with other independently compiled inventory data on national level (if available) are a quick option to evaluate completeness, approximate emission (removal) levels and correct category allocations. Although the inventory compiler is ultimately responsible for preparing the national greenhouse gas inventory, other independent publications on this subject may be available e.g., from scientific literature or publication by other institutes or agencies. For example, national level CO2 emissions estimates associated with the combustion of fossil fuel are compiled by the International Energy Agency (IEA) and the Carbon Dioxide Information and Analysis Centre (CDIAC). Estimates of emissions of other pollutants are available from the Emission Database for Global Atmospheric Research (EDGAR) (http://www.mnp.nl/edgar/). If independently compiled datasets use IPCC Tier 1 methodologies, the same considerations discussed above will apply.
While national data are normally considered more reliable as they are able to accommodate more detailed country-specific information, and international data are normally compiled at a lower tier, these international data sets provide a good basis for comparison as they are consistent between countries. The comparisons can be made for different greenhouse gases at national, sectoral, category, and subcategory levels, as far as the differences in definitions enable them. Before conducting these types of comparisons, it is important to check the following items.
• Confirm that the underlying data for the independent estimate are not the same as that used for the inventory; a comparison is only meaningful if data being compared are different.
• Determine if the relationships between the sectors and categories in the different inventories can be defined and matched appropriately.
• Account for the data quality (e.g., QA/QC system or review) and for any known uncertainties in the estimate used for the comparison to help interpret results.
Comparisons of intensity indicators between countries: Emission (removal) intensity indicators, e.g., those commonly referred to as ‘implied emission (removal) factors', may be compared between countries (e.g., emissions per capita, industrial emissions per unit of value added, transport emissions per car, emissions from power generation per kWh of electricity produced, emissions from dairy ruminants per tonne of milk produced). These indicators provide a preliminary check and verification of the order of magnitude of the emissions or removals. Different practices and technological developments as well as the varying nature of the
Chapter 6: QA/QC and Verification
2006 IPCC Guidelines for National Greenhouse Gas Inventories 6.21
source categories will be reflected in the emission intensity indicators. Thus differences between countries need to be expected. However, these checks may flag potential anomalies at the country or sector level.
6.10.2 Comparisons with atmospheric measurements An ideal condition for verification is the use of fully independent data as a basis for comparison. Measurements of atmospheric concentrations potentially provide such datasets, and recent scientific advances allow using such data as a basis for emission modelling. The approach is particularly valuable as it is independent of standard estimation method drivers, such as sector activity data and implied emission factors. The scale of such models can be designed around local, regional, or global boundaries and can provide information on either level or trends in emissions. Some brief examples of these techniques are provided in this section; however, further discussion and elaboration can be found in more comprehensive summaries on the use of these methods for inventory verification (Rypdal et al., 2005; Bergamaschi et al., 2004; Benkovitz, 2001; Benjey and Middleton, 2002; NACP, 2002).
It should be recognized that the complexity as well as the limited application potential of atmospheric models to inventory verification, particularly at a national level, can restrict their utility to many inventory compilers. In addition, many of the techniques will require specialised modelling skills and resources in order to appropriately correlate the atmospheric data back to the inventory for comparison, and be cost- and labour intensive. Depending on specific conditions, results may be only applicable to parts of a country, to groups of countries, or to specific categories or gases. The required analysis time will also typically extend beyond an inventory cycle, thus making these types of comparisons more applicable for long term verification programs. In many cases, the uncertainties associated with the atmospheric models themselves may not be sufficiently quantified or may be too large for the model to be used effectively as a verification tool.
In contrast to the other methods described in this chapter, comparisons with atmospheric measurements cannot therefore be a standard tool for verification to be applied by an inventory compiler. Still a considerable scientific progress in this area needs to be noted and inventory compilers may wish to take advantage of the potential of this approach, as it gives independent data for verification. If applicable, national inventory compilers may also consider joining forces with neighbouring countries, in cases when emission modelling from atmospheric measurement is more reliable for larger entities than countries.
Despite the limitations given, there are a number of evolving techniques that deserve to be mentioned here:
Inverse Modell ing: The concentrations of greenhouse gases in air samples are measured at monitoring sites and can be used to provide emission estimates by a technique known as inverse modelling. Inverse models calculate emission fluxes from concentration measurements and atmospheric transport models. For local and regional estimation, complex mathematical and statistical models are required together with continuous, or quasi-continuous, measurements that capture all pollution incidents. The source discrimination of air sampling-derived emissions requires highly precise and labour-intensive analysis, which may prevent the applicability of inverse modelling approaches to source-specific emissions verification. In contrast to national inventories, flux assessments from inverse modelling include the effect of natural sources/sinks as well as international transport. Considering the limited monitoring network currently available for many of the greenhouse gases and the resulting uncertainties in the model results, inverse modelling is not likely to be frequently applied as a verification tool of national inventories in the near future. Even the availability of satellite-borne sensors for greenhouse gas concentration measurements (see Bergamaschi et al., 2004) will not fully resolve this problem, due to limitations in spatial, vertical and temporal resolution. However, there is increasing scientific recognition for the potential of these techniques for both level and trend verification of national inventories.
Inverse modelling techniques are undergoing rapid development and are being applied now in national inventories estimates (O'Doherty et al., 2003), European emission estimates (Manning et al., 2003) and to provide geographical distributions of emissions within the European Union (Ryall et al., 2001). Ultimately, the application of these techniques relies on a comparison of the uncertainty between the calculated inventory estimates and the inverse model-derived estimates (Rypdal et al., 2005, Bergamaschi et al., 2004). Where the uncertainty of the model results is less than the calculated inventory uncertainty, the model can be used to improve the inventory. Also, where the model results are significantly different from the inventory, this can point to missing sources or possibly large calculation errors.
Fluorinated gases and methane (CH4) are considered the most suitable greenhouse gases for which inverse modelling could provide verification of emission estimates (Rypdal et al., 2005, Bergamaschi et al., 2004). The fluorinated compounds are considered good candidates for inverse modelling verification because: they have virtually no natural source interference in the atmospheric measurements, there can be considerable uncertainties in inventory methods, they are long-lived, and the loss mechanisms are well known. Methane is considered a favourable candidate because of the generally high uncertainty in emission estimates resulting from inventory
Volume 1: General Guidance and Reporting
6.22 2006 IPCC Guidelines for National Greenhouse Gas Inventories
methodologies, and the strong atmospheric signal to noise ratio of measurements. Modelling of CO2 emissions for national inventory verification is probably not a priority since the inventory methods already have low uncertainties, except where agriculture, forestry and other land-use is dominant. The impacts of large natural sources and sinks on atmospheric measurements make a correlation to strictly anthropogenic sources difficult. However, it may improve understanding of contributions from forests and natural sources and sinks. Due to the large uncertainties associated with some of the N2O inventory methodologies verification through atmospheric measurements would be desirable. However, the influence of natural sources and sinks on measurements, as well as the long atmospheric lifetime lead to a poor signal to noise ratio in measured concentrations. Thus further investigations are required before inverse modelling can successfully be applied to the verification of inventories of N2O.
Continental Plumes: A strong difference between source and non-source regions may generally be found between a continent and an ocean where routine measurements of the difference between background air concentrations and the offshore plume concentrations, coupled with wind vector analysis or trajectory analysis, may provide an indication of emissions on a broad scale (Cape et al., 2001; Derwent et al., 2001). For example, a number of greenhouse gases, including chlorofluorocarbons (CFCs), N2O and CH4 from the European continental plume have been detected at Mace Head, Ireland. These results have then been used for subsequent quantification of the European emission source strength by inverse modelling (Derwent et al., 1998a, 1998b; Vermeulen et al., 1999).
Use of Proxy Emission Databases: In the cases where one of the components measured in the air samples has a well characterised emission inventory (a ‘marker’ or ‘tracer’ compound), the emissions of greenhouse gases may be estimated from atmospheric measurements of their concentration ratio to this marker compound. The technique is appropriate if sources of the compounds are co-located, and it has been used in the U.S.A., for example with carbon monoxide (CO ) as the marker (Barnes et al., 2003a, 2003b), and in the EU employing radon (222Rn: Biraud et al., 2000).
Global Dynamic Approaches: Trends over time in the atmospheric concentration of particular compounds may also indicate a change in the global balance between sources and sinks and give an estimate of the globally aggregated emissions, constraining the total of national emissions from an aggregate perspective and possibly indicating areas of weakness in the inventories. Such approaches have been taken for CH4 (Dlugokencky et al., 1994), sulphur hexafluoride (SF6) (Maiss and Brenninkmeijer, 1998), PFC-14 and carbon tetrafluoride (CF4) ( Harnisch and Eisenhauer, 1998). These methods can be applicable to cover a large proportion of global emissions, and monitoring is possible on a routine basis.
6.11 DOCUMENTATION, ARCHIVING AND REPORTING
6.11.1 Internal documentation and archiving It is good practice to document and archive all information relating to the planning, preparation, and management of inventory activities. This includes:
• Responsibilities, institutional arrangements, and procedures for the planning, preparation, and management of the inventory process;
• Assumptions and criteria for the selection of activity data and emission factors;
• Emission factors and other estimation parameters used, including references to the IPCC document for default factors or to published references or other documentation for emission factors used in higher tier methods;
• Activity data or sufficient information to enable activity data to be traced to the referenced source;
• Information on the uncertainty associated with activity data and emission factors;
• Rationale for choice of methods;
• Methods used, including those used to estimate uncertainty and those used for recalculations;
• Changes in data inputs or methods from previous inventories (recalculations);
• Identification of individuals providing expert judgement for uncertainty estimates and their qualifications to do so;
Chapter 6: QA/QC and Verification
2006 IPCC Guidelines for National Greenhouse Gas Inventories 6.23
• Details of electronic databases or software used in the production of the inventory, including versions, operating manuals, hardware requirements and any other information required to enable their later use;
• Worksheets and interim calculations for category estimates, and aggregated estimates and any re-calculations of previous estimates;
• Final inventory report and any analysis of trends from previous years;
• QA/QC plans and outcomes of QA/QC procedures;
• Secure archiving of complete datasets, to include shared databases that are used in inventory development. This is particularly important for categories that rely on the multi-step development of emissions from a large set of primary data from outside sources.
It is good practice for inventory compilers to maintain this documentation for every inventory produced and to provide it for review. It is good practice to maintain and archive this documentation in such a way that every inventory estimate can be fully documented and reproduced if necessary.
Records of QA/QC procedures are important information to enable continuous improvement to inventory estimates. It is good practice for records of QA/QC activities to include the checks/audits/reviews that were performed, when they were performed, who performed them, and corrections and modifications to the inventory resulting from the QA/QC activity. An example checklist to use for recording QC activities at both the general and category-level is provided in Annex 6A.1.
6.11.2 Reporting It is good practice to report a summary of implemented QA/QC activities and key findings as a supplement to each country’s national inventory, which itself is described in Volumes 2-5 and by the tables in this volume. However, it is not practical or necessary to report all the internal documentation that is retained by the inventory compiler. In this summary, the inventory compiler should focus on the following activities.
• Reference to a QA/QC plan, its implementation schedule, and the responsibilities for its implementation should be discussed.
• Describe which activities were performed internally and what external reviews were conducted for each source/sink category and on the entire inventory.
• Present the key findings, describing major issues regarding quality of input data, methods, processing, or estimates for each category and show how they were addressed or plan to be addressed in the future.
• Explain significant trends in the time series, particularly where trend checks point to substantial divergences. Any effect of recalculations or mitigation strategies should be included in this discussion.
References Barnes, D.H., Wofsy, S.C., Fehlau, B.P., Gottlieb, E.W., Elkins, J.W., Dutton, G.S. and Montzka S.A. (2003a)
Urban/industrial pollution for the New York City-Washington, D. C., corridor, 1996-1998:1. Providing independent verification of CO and PCE emissions inventories, Geophys J. Res., 108(D6), 4185, 10.1029/2001JD001116, 2003a.
Barnes, D.H., Wofsy, S.C., Fehlau, B.P., Gottlieb, E.W., Elkins, J.W., Dutton, G.S., and Montzka, S.A. (2003b). Urban/industrial pollution for the New York City-Washington, D. C., corridor, 1996-1998: 2. A study of the efficacy of the Montreal Protocol and other regulatory measures, Geophys J. Res., 108(D6), 4186, 10.1029/2001JD001117, 2003b.
Benjey, W. and Middleton, P. (2002). ‘The Climate-Air Quality Scale Continuum and the Global Emission Inventory Activity.’ Presented at the EPA Emissions Conference, April 15-18.
Benkovitz C. (2001). ‘Compilation of Regional to Global Inventories of Anthropogenic Emissions’. Submitted for publication in “Emissions of Chemical Species and Aerosols into the Atmosphere”, Precursors of Ozone and their Effects in the Troposphere (POET), Kluwer Academic Publishers, Dordrecht, Netherlands.
Volume 1: General Guidance and Reporting
6.24 2006 IPCC Guidelines for National Greenhouse Gas Inventories
Bergamaschi, P., Behrend, H. and Andre, J., eds.(2004). Inverse Modeling of National and EU Greenhouse Gas Emission Inventories. Report of the October 23-24 workshop “Inverse Modeling for Potential Verification of National and EU Bottom-up GHG Inventories”, held by the European Commission, Joint Research Centre. Report published.
Biraud, S., Ciais, P., Ramonet, M., Simmonds, P., Kazan, V., Monfray, P., O'Doherty S., Spain T.G. and Jennings, S.G. (2000). European greenhouse gas emissions estimated from continuous atmospheric measurements and radon 222 at Mace Head, Ireland, J. Geophys. Res., 105(D1), 1351-1366.
Cape, J.N., Methven, J. and Hudson L.E. (2000). The use of trajectory cluster analysis to interpret trace gas measurements at Mace Head, Ireland, Atmospheric Environment, 34 (22), 3651-3663.
Derwent, R.G., Simmonds, P.G., O'Doherty, S. and Ryall, D.B. (1998a). The impact of the Montreal Protocol on halocarbon concentrations in northern hemisphere baseline and European air masses at Mace Head Ireland over a ten year period from 1987-1996, Atmospheric Environment 32(21), 3689-3702
Derwent, R.G., Simmonds, P.G., O'Doherty, S., Ciais P., and Ryall, D.B. (1998b). European source strengths and northern hemisphere baseline concentrations of radiatively active trace gases at Mace Head Ireland, Atmospheric Environment 32(21), 3703-3715.
Derwent, R.G., Manning, A.J. and Ryall D.B. (2001). Interpretation of Long-Term Measurements of Ozone-Depleting Substances and Radiatively Active Trace Gases: Phase III, Final Report: DETR Contract No: EPG 1/1/103, Dec 2001.
Dlugokencky, E.J., Steele, L.P., Lang, P.M. and Mesarie, K.A., (1994). The growth rate and distribution of atmospheric CH4. J. Geophys. Res. 99, 17021-17043.
EDGAR. Emission Database for Global Atmospheric Research (EDGAR). RIVM-MNP, Bilthoven, TNO-MEP, Apeldoorn, JRC-IES, Ispra and MPIC-AC, URL: http://www.mnp.nl/edgar/
Harnisch, J. and Eisenhauer, A. (1998). Natural CF4 and SF6 on Earth, Geophys. Res. Lett., 25(13), 2401-2404.
IPCC (1997). Revised 1996 IPCC Guidelines for National Greenhouse Gas Inventories: Volumes 1, 2 and 3. Houghton, J.T., Meira Filho, L.G., Lim, B., Tréanton, K., Mamaty, I., Bonduki, Y., Griggs, D.J. and Callander, B.A. (Eds), Intergovernmental Panel on Climate Change (IPCC), IPCC/OECD/IEA, Paris, France.
Levin I., Glatzel-Mattheier H., Marik T., Cuntz M., Schmidt M., Worthy D.E. (1999) Verification of German methane emission inventories and their recent changes based on atmospheric observations, J. Geophys. Res., 104, 3447-3456.
Maiss, M. and Brenninkmeijer, C.A.M. (1998) Atmospheric SF6: trends, sources and prospects. Environ. Sci. Techn. 32, 3077-3086.
Manning, A.J., Ryall, D.B., Derwent, R.G., Simmonds, P.G. and O'Doherty S. (2003). Estimating European emissions of ozone-depleting and greenhouse gases using observations and a modelling back-attribution technique, J. Geophys. Res. Vol. 108, No. D14, 4405, 10.1029/2002JD002312, 17 July 2003.
NACP. (2002). The North American Carbon Programme. NACP Committee of the U.S. Carbon Cycle Science Steering Group (Steven C. Wofsy, Robert C. Harris, co-chairs), Chapter 2, Major Elements of the North American Carbon Program Plan. U.S. Global Change Research Program, Wachington, D.C., 2002. http://www.esig.ucar.edu/nacp
O' Doherty, S., McCulloch, A., O' Leary, E., Finn, J. and Cunningham, D. (2003). Climate Change: Emissions of Industrial Greenhouse Gases (HFCs, PFCs and Sulphur Hexafluoride), Final Report, Environmental Protection Agency ERDTI Report Series No. 10, EPA, Johnstown Castle, C. Wexford, Ireland, 2003.
Ryall, D.B., Derwent, R.G., Manning, A.J., Simmonds, P.G. and O'Doherty S. (2001). Estimating source regions of European emissions of trace gases from observations at Mace Head, Atmospheric Environment, 35, 2507-2523.
Rypdal, K., Stordal, F., Fuglestvedt, J.S. and Berntsen, T. (2005). Bottom-up vs. top-down methods in assessing compliance with the Kyoto Protocol, Climate Policy 5, 393-405.
Vermeulen, A.T., Eisma, R., Hensen, A. and Slanina J. (1999). Transport model calculations of NW-European methane emissions, Environmental Science & Policy, 2, 315-324.
Winiwarter, W. and Schimak G. (2005). Environmental Software Systems for Emission Inventories, Environmental Modelling & Software 20, 1469-1477.

Chapter 6: QA/QC and Verification
2006 IPCC Guidelines for National Greenhouse Gas Inventories 6.25
Annex 6A.1 QC checklists
FORMS AND CHECKLISTS FOR QUALITY CONTROL FOR SPECIFIC SOURCE CATEGORIES
This annex contains a number of example forms that provide means to record both general and category-specific QC activities. These forms are only examples, and inventory compilers may find other means to effectively record their QA/QC activities (to be defined in the QA/QC plan). Refer to the IPCC Guidelines chapters on QA/QC and Verification, Data Collection, and for each category as described in Volume 2-5 for more detailed guidance on developing QC checks.
A1. GENERAL QC CHECKLIST
( to be completed for each category and for each inventory)
A2. CATEGORY-SPECIFIC QC CHECKLIST (CHECKS TO BE DESIGNED FOR EACH CATEGORY)
Part A: Data Gathering and Selection Part B: Secondary Data and Direct Emission Measurement
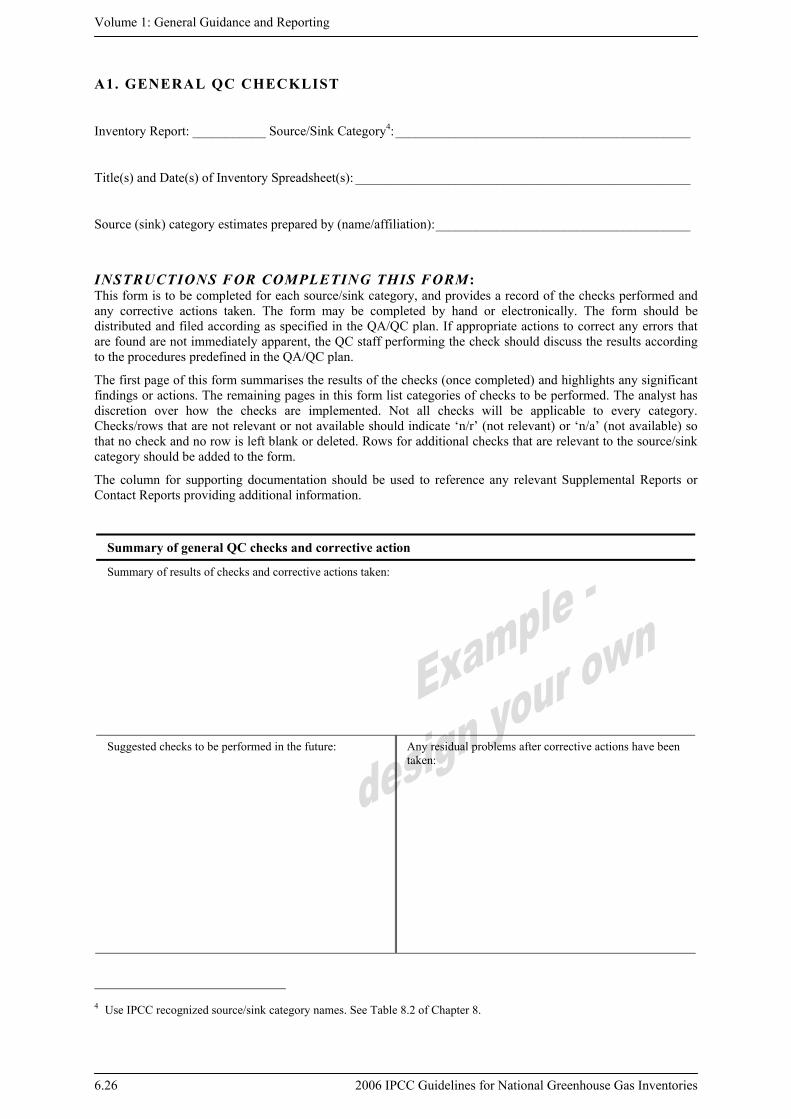
Volume 1: General Guidance and Reporting
6.26 2006 IPCC Guidelines for National Greenhouse Gas Inventories
A1. GENERAL QC CHECKLIST
Inventory Report: ___________ Source/Sink Category4:____________________________________________
Title(s) and Date(s) of Inventory Spreadsheet(s): __________________________________________________
Source (sink) category estimates prepared by (name/affiliation):______________________________________
INSTRUCTIONS FOR COMPLETING THIS FORM: This form is to be completed for each source/sink category, and provides a record of the checks performed and any corrective actions taken. The form may be completed by hand or electronically. The form should be distributed and filed according as specified in the QA/QC plan. If appropriate actions to correct any errors that are found are not immediately apparent, the QC staff performing the check should discuss the results according to the procedures predefined in the QA/QC plan.
The first page of this form summarises the results of the checks (once completed) and highlights any significant findings or actions. The remaining pages in this form list categories of checks to be performed. The analyst has discretion over how the checks are implemented. Not all checks will be applicable to every category. Checks/rows that are not relevant or not available should indicate ‘n/r’ (not relevant) or ‘n/a’ (not available) so that no check and no row is left blank or deleted. Rows for additional checks that are relevant to the source/sink category should be added to the form.
The column for supporting documentation should be used to reference any relevant Supplemental Reports or Contact Reports providing additional information.
Summary of general QC checks and corrective action
Summary of results of checks and corrective actions taken:
Suggested checks to be performed in the future:
Any residual problems after corrective actions have been taken:
4 Use IPCC recognized source/sink category names. See Table 8.2 of Chapter 8.
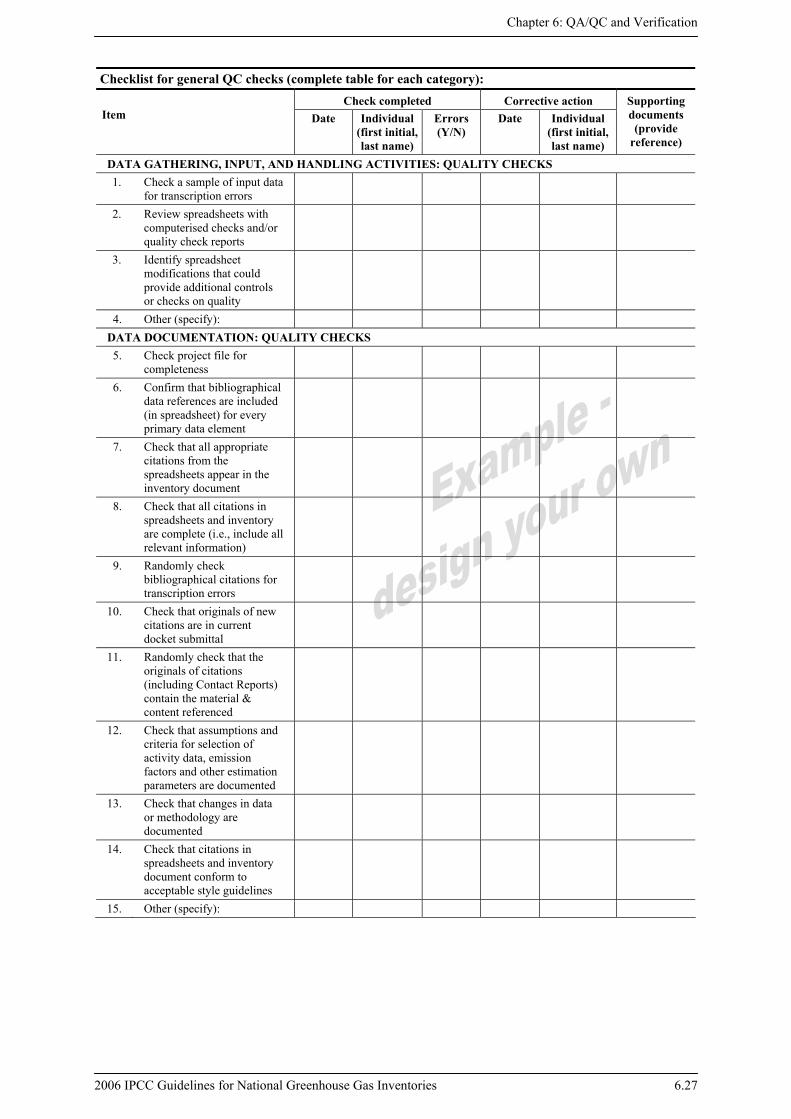
Chapter 6: QA/QC and Verification
2006 IPCC Guidelines for National Greenhouse Gas Inventories 6.27
Checklist for general QC checks (complete table for each category): Check completed Corrective action
Item Date Individual (first initial, last name)
Errors (Y/N)
Date Individual (first initial, last name)
Supporting documents (provide
reference)
DATA GATHERING, INPUT, AND HANDLING ACTIVITIES: QUALITY CHECKS 1. Check a sample of input data
for transcription errors
2. Review spreadsheets with computerised checks and/or quality check reports
3. Identify spreadsheet modifications that could provide additional controls or checks on quality
4. Other (specify): DATA DOCUMENTATION: QUALITY CHECKS
5. Check project file for completeness
6. Confirm that bibliographical data references are included (in spreadsheet) for every primary data element
7. Check that all appropriate citations from the spreadsheets appear in the inventory document
8. Check that all citations in spreadsheets and inventory are complete (i.e., include all relevant information)
9. Randomly check bibliographical citations for transcription errors
10. Check that originals of new citations are in current docket submittal
11. Randomly check that the originals of citations (including Contact Reports) contain the material & content referenced
12. Check that assumptions and criteria for selection of activity data, emission factors and other estimation parameters are documented
13. Check that changes in data or methodology are documented
14.
Check that citations in spreadsheets and inventory document conform to acceptable style guidelines
15. Other (specify):
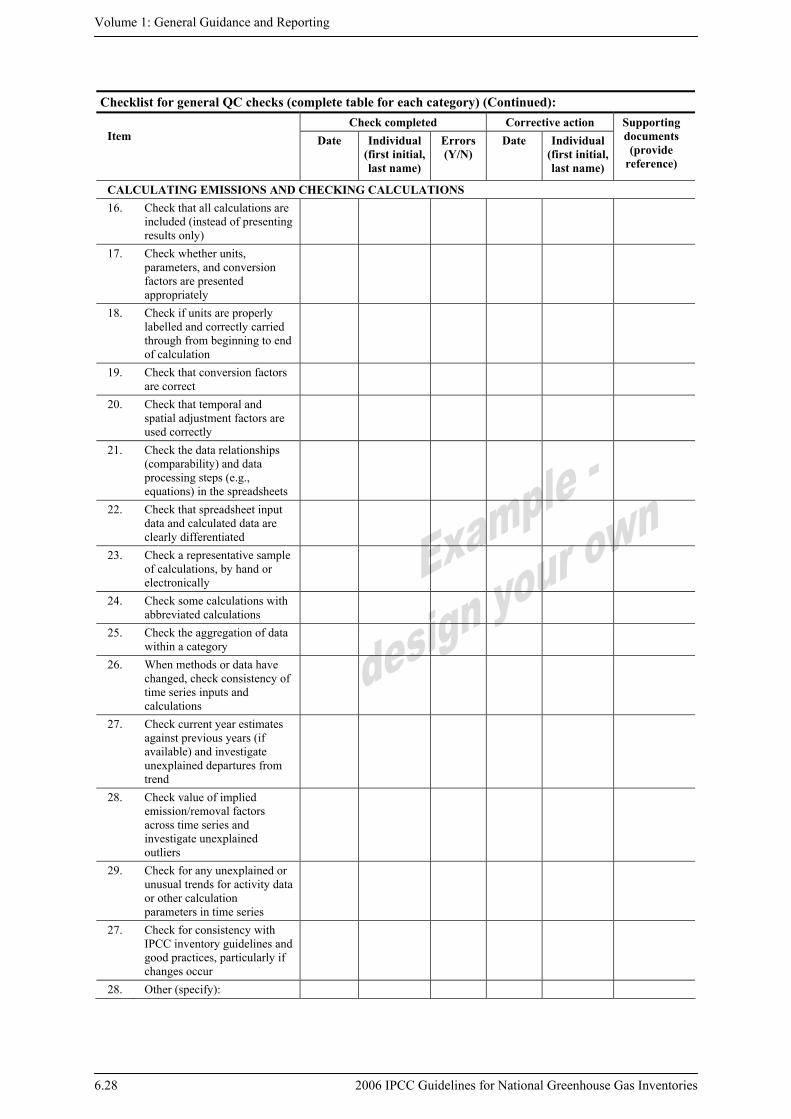
Volume 1: General Guidance and Reporting
6.28 2006 IPCC Guidelines for National Greenhouse Gas Inventories
Checklist for general QC checks (complete table for each category) (Continued): Check completed Corrective action
Item
Date Individual (first initial, last name)
Errors (Y/N)
Date Individual (first initial, last name)
Supporting documents (provide
reference)
CALCULATING EMISSIONS AND CHECKING CALCULATIONS 16. Check that all calculations are
included (instead of presenting results only)
17. Check whether units, parameters, and conversion factors are presented appropriately
18. Check if units are properly labelled and correctly carried through from beginning to end of calculation
19. Check that conversion factors are correct
20. Check that temporal and spatial adjustment factors are used correctly
21. Check the data relationships (comparability) and data processing steps (e.g., equations) in the spreadsheets
22. Check that spreadsheet input data and calculated data are clearly differentiated
23. Check a representative sample of calculations, by hand or electronically
24. Check some calculations with abbreviated calculations
25. Check the aggregation of data within a category
26. When methods or data have changed, check consistency of time series inputs and calculations
27. Check current year estimates against previous years (if available) and investigate unexplained departures from trend
28. Check value of implied emission/removal factors across time series and investigate unexplained outliers
29. Check for any unexplained or unusual trends for activity data or other calculation parameters in time series
27. Check for consistency with IPCC inventory guidelines and good practices, particularly if changes occur
28. Other (specify):
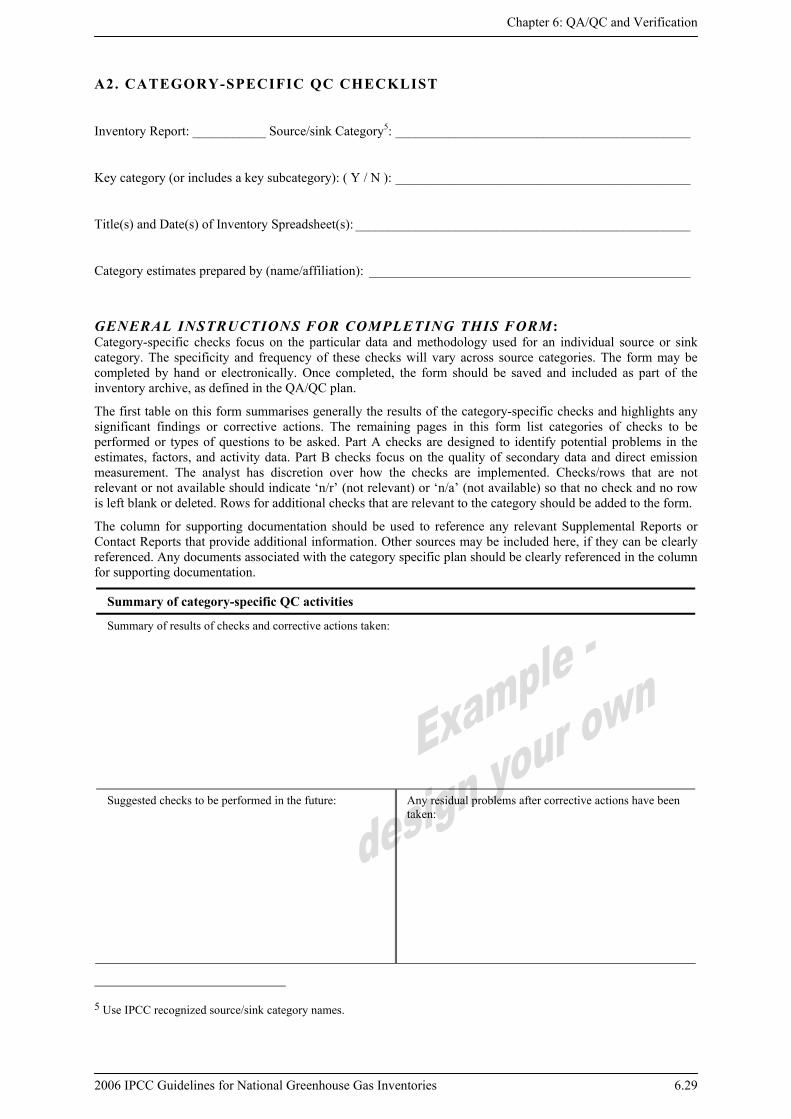
Chapter 6: QA/QC and Verification
2006 IPCC Guidelines for National Greenhouse Gas Inventories 6.29
A2. CATEGORY-SPECIFIC QC CHECKLIST
Inventory Report: ___________ Source/sink Category5: ____________________________________________
Key category (or includes a key subcategory): ( Y / N ): ____________________________________________
Title(s) and Date(s) of Inventory Spreadsheet(s): __________________________________________________
Category estimates prepared by (name/affiliation): ________________________________________________
GENERAL INSTRUCTIONS FOR COMPLETING THIS FORM: Category-specific checks focus on the particular data and methodology used for an individual source or sink category. The specificity and frequency of these checks will vary across source categories. The form may be completed by hand or electronically. Once completed, the form should be saved and included as part of the inventory archive, as defined in the QA/QC plan.
The first table on this form summarises generally the results of the category-specific checks and highlights any significant findings or corrective actions. The remaining pages in this form list categories of checks to be performed or types of questions to be asked. Part A checks are designed to identify potential problems in the estimates, factors, and activity data. Part B checks focus on the quality of secondary data and direct emission measurement. The analyst has discretion over how the checks are implemented. Checks/rows that are not relevant or not available should indicate ‘n/r’ (not relevant) or ‘n/a’ (not available) so that no check and no row is left blank or deleted. Rows for additional checks that are relevant to the category should be added to the form.
The column for supporting documentation should be used to reference any relevant Supplemental Reports or Contact Reports that provide additional information. Other sources may be included here, if they can be clearly referenced. Any documents associated with the category specific plan should be clearly referenced in the column for supporting documentation.
5 Use IPCC recognized source/sink category names.
Summary of category-specific QC activities
Summary of results of checks and corrective actions taken:
Suggested checks to be performed in the future:
Any residual problems after corrective actions have been taken:
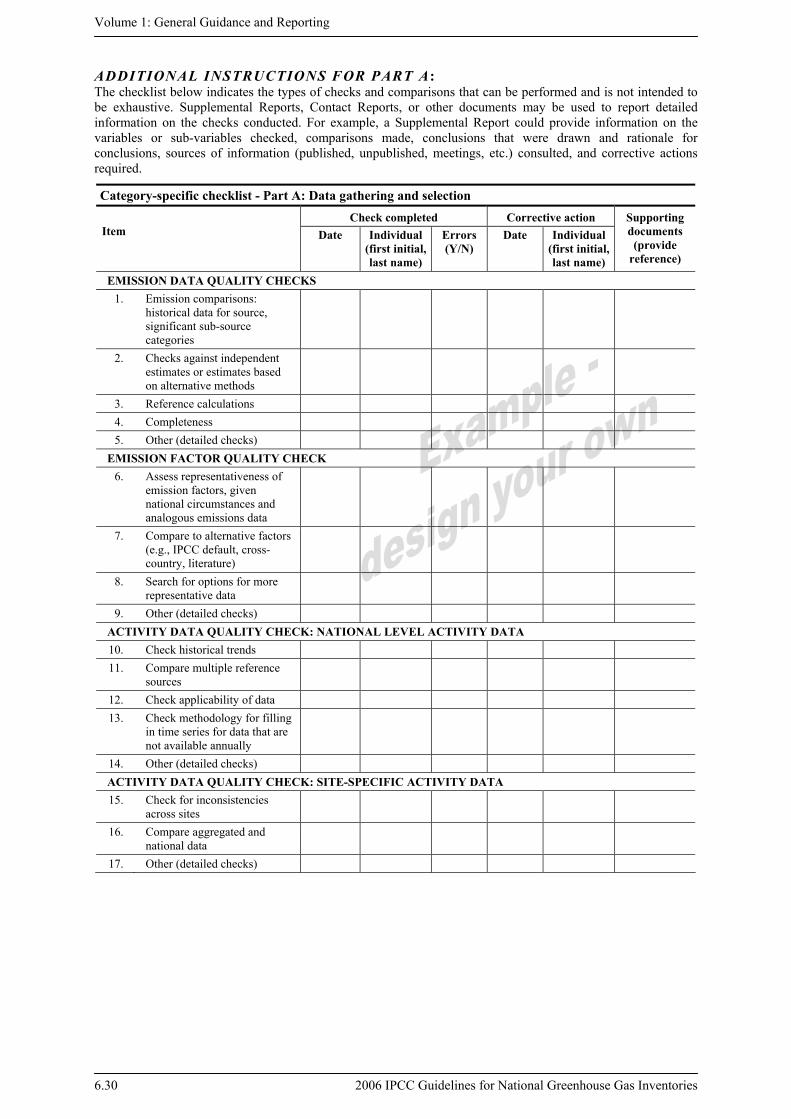
Volume 1: General Guidance and Reporting
6.30 2006 IPCC Guidelines for National Greenhouse Gas Inventories
ADDITIONAL INSTRUCTIONS FOR PART A: The checklist below indicates the types of checks and comparisons that can be performed and is not intended to be exhaustive. Supplemental Reports, Contact Reports, or other documents may be used to report detailed information on the checks conducted. For example, a Supplemental Report could provide information on the variables or sub-variables checked, comparisons made, conclusions that were drawn and rationale for conclusions, sources of information (published, unpublished, meetings, etc.) consulted, and corrective actions required.
Category-specific checklist - Part A: Data gathering and selection Check completed Corrective action
Item Date Individual (first initial, last name)
Errors (Y/N)
Date Individual (first initial, last name)
Supporting documents (provide
reference)
EMISSION DATA QUALITY CHECKS 1. Emission comparisons:
historical data for source, significant sub-source categories
2. Checks against independent estimates or estimates based on alternative methods
3. Reference calculations 4. Completeness 5. Other (detailed checks)
EMISSION FACTOR QUALITY CHECK 6. Assess representativeness of
emission factors, given national circumstances and analogous emissions data
7. Compare to alternative factors (e.g., IPCC default, cross-country, literature)
8. Search for options for more representative data
9. Other (detailed checks) ACTIVITY DATA QUALITY CHECK: NATIONAL LEVEL ACTIVITY DATA 10. Check historical trends 11. Compare multiple reference
sources
12. Check applicability of data 13. Check methodology for filling
in time series for data that are not available annually
14. Other (detailed checks) ACTIVITY DATA QUALITY CHECK: SITE-SPECIFIC ACTIVITY DATA 15. Check for inconsistencies
across sites
16. Compare aggregated and national data
17. Other (detailed checks)
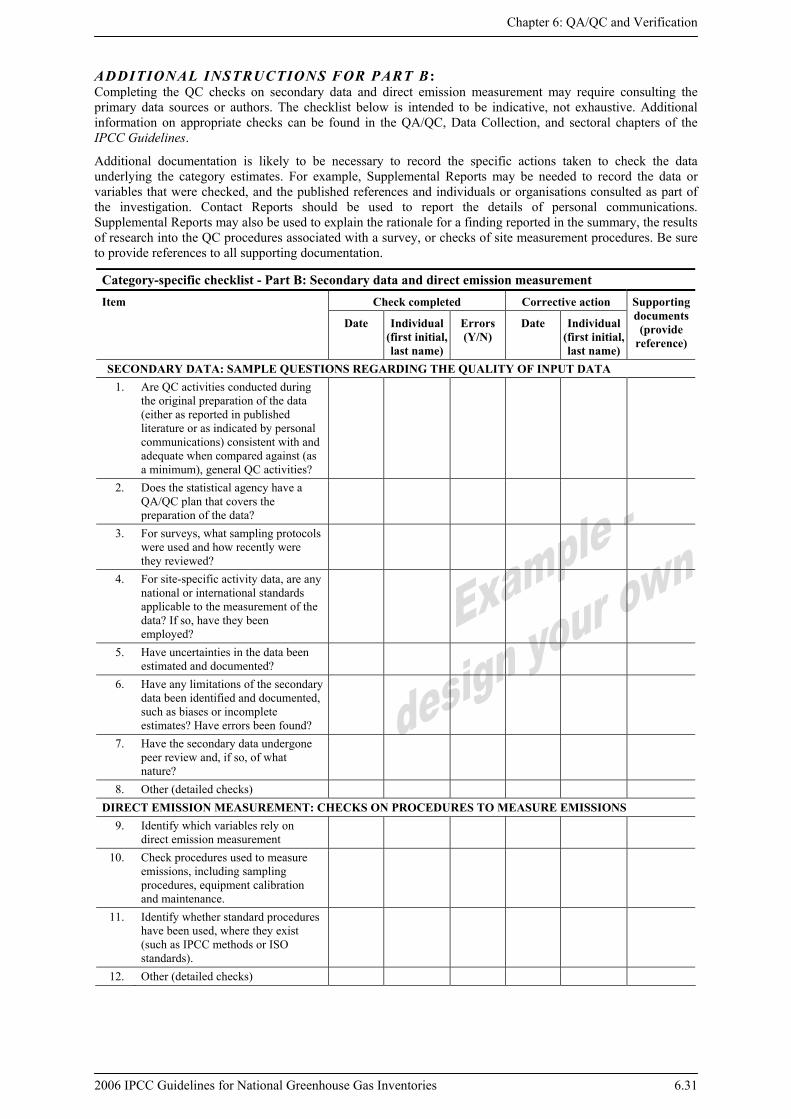
Chapter 6: QA/QC and Verification
2006 IPCC Guidelines for National Greenhouse Gas Inventories 6.31
ADDITIONAL INSTRUCTIONS FOR PART B: Completing the QC checks on secondary data and direct emission measurement may require consulting the primary data sources or authors. The checklist below is intended to be indicative, not exhaustive. Additional information on appropriate checks can be found in the QA/QC, Data Collection, and sectoral chapters of the IPCC Guidelines.
Additional documentation is likely to be necessary to record the specific actions taken to check the data underlying the category estimates. For example, Supplemental Reports may be needed to record the data or variables that were checked, and the published references and individuals or organisations consulted as part of the investigation. Contact Reports should be used to report the details of personal communications. Supplemental Reports may also be used to explain the rationale for a finding reported in the summary, the results of research into the QC procedures associated with a survey, or checks of site measurement procedures. Be sure to provide references to all supporting documentation.
Category-specific checklist - Part B: Secondary data and direct emission measurement Check completed Corrective action Item
Date Individual (first initial, last name)
Errors (Y/N)
Date Individual (first initial, last name)
Supporting documents (provide
reference)
SECONDARY DATA: SAMPLE QUESTIONS REGARDING THE QUALITY OF INPUT DATA 1. Are QC activities conducted during
the original preparation of the data (either as reported in published literature or as indicated by personal communications) consistent with and adequate when compared against (as a minimum), general QC activities?
2. Does the statistical agency have a QA/QC plan that covers the preparation of the data?
3. For surveys, what sampling protocols were used and how recently were they reviewed?
4. For site-specific activity data, are any national or international standards applicable to the measurement of the data? If so, have they been employed?
5. Have uncertainties in the data been estimated and documented?
6. Have any limitations of the secondary data been identified and documented, such as biases or incomplete estimates? Have errors been found?
7. Have the secondary data undergone peer review and, if so, of what nature?
8. Other (detailed checks) DIRECT EMISSION MEASUREMENT: CHECKS ON PROCEDURES TO MEASURE EMISSIONS
9. Identify which variables rely on direct emission measurement
10. Check procedures used to measure emissions, including sampling procedures, equipment calibration and maintenance.
11. Identify whether standard procedures have been used, where they exist (such as IPCC methods or ISO standards).
12. Other (detailed checks)