chapter 6. soils - university of kansascpcb.ku.edu/media/cpcb/research/assets/2011_wetland/ch 6...
TRANSCRIPT

2011 NWCA Field Operations Manual Chapter 6. Soils
CHAPTER 6. SOILS
Introduction. . . . . . . . . . . . . . . . . . . . . . . . . . . . . . . . . . . . . . . . . . . . . . . . . . . . . . . . . . . . . . . . . . . . . . . 6.1 SAMPLING PROCEDURES. . . . . . . . . . . . . . . . . . . . . . . . . . . . . . . . . . . . . . . . . . . . . . . . . . . . . . .
6.1.1 Identifying Soil Pit Locations. . . . . . . . . . . . . . . . . . . . . . . . . . . . . . . . . . . . . . . . . . . . . . . . . . . 6.1.1.1 Standard Locations for Soil Pits. . . . . . . . . . . . . . . . . . . . . . . . . . . . . . . . . . . . . . . . . . . .6.1.1.2 Alternate Locations – Moving Soil Pits to Avoid Obstacles . . . . . . . . . . . . . . . . . . . . . .
6.1.2 Description of Soil Profiles. . . . . . . . . . . . . . . . . . . . . . . . . . . . . . . . . . . . . . . . . . . . . . . . . . . . Overview of Soil Profile Description Activities . . . . . . . . . . . . . . . . . . . . . . . . . . . . . . . . . . . . . .
6.1.2.1 Excavating Soil Pits for Profile Description. . . . . . . . . . . . . . . . . . . . . . . . . . . . . . . . . . . Easy to Sample Soils . . . . . . . . . . . . . . . . . . . . . . . . . . . . . . . . . . . . . . . . . . . . . . . . . . . . . . .Difficult to Sample Soils . . . . . . . . . . . . . . . . . . . . . . . . . . . . . . . . . . . . . . . . . . . . . . . . . . . . .
6.1.2.2 Initial Color for Saturated Soils and Detection of Hydrogen Sulfide (H2S) Odor. . . . . . . 6.1.2.3 Delineating Soil Horizons. . . . . . . . . . . . . . . . . . . . . . . . . . . . . . . . . . . . . . . . . . . . . . . . . 6.1.2.4 Describing Soil Texture. . . . . . . . . . . . . . . . . . . . . . . . . . . . . . . . . . . . . . . . . . . . . . . . . . 6.1.2.5 Estimating Percent Rock and Roots. . . . . . . . . . . . . . . . . . . . . . . . . . . . . . . . . . . . . . . . 6.1.2.6 Describing Soil Color and Identifying Redoximorphic and Other Soil Features. . . . . . ..6.1.2.7 Identifying Hydric Soil Indicators. . . . . . . . . . . . . . . . . . . . . . . . . . . . . . . . . . . . . . . . . . .
6.1.3 Soil Sample Collection. . . . . . . . . . . . . . . . . . . . . . . . . . . . . . . . . . . . . . . . . . . . . . . . . . . . . . 6.1.3.1 Collecting Soil Samples for Isotope and Enzyme Analysis. . . . . . . . . . . . . . . . . . . . . . . 6.1.3.2 Collecting Bulk Density and Chemistry Samples. . . . . . . . . . . . . . . . . . . . . . . . . . . . . .
Preparing Labels and Sample Collection Bags. . . . . . . . . . . . . . . . . . . . . . . . . . . . . . . . . . . . . Expanding the Representative Pit and Collecting Soil Samples. . . . . . . . . . . . . . . . . . . . . . . .
6.1.4 Water Depth In Pit After Equilibration. . . . . . . . . . . . . . . . . . . . . . . . . . . . . . . . . . . . . . . . . . . 6.1.5 Backfilling the Soil Pit . . . . . . . . . . . . . . . . . . . . . . . . . . . . . . . . . . . . . . . . . . . . . . . . . . . . . . . 6.1.6 Soil Tool Decontamination and Maintenance. . . . . . . . . . . . . . . . . . . . . . . . . . . . . . . . . . . . .
6.2 SAMPLE AND DATA HANDLING . . . . . . . . . . . . . . . . . . . . . . . . . . . . . . . . . . . . . . . . . . . . . . . . . . 6.2.1 At the Site. . . . . . . . . . . . . . . . . . . . . . . . . . . . . . . . . . . . . . . . . . . . . . . . . . . . . . . . . . . . . . . . 6.2.2 At Field Lodging or Office. . . . . . . . . . . . . . . . . . . . . . . . . . . . . . . . . . . . . . . . . . . . . . . . . . . . 6.2.4 Data Forms, Tracking Forms, and Shipping Records . . . . . . . . . . . . . . . . . . . . . . . . . . . . . .
6.3 LITERATURE CITED. . . . . . . . . . . . . . . . . . . . . . . . . . . . . . . . . . . . . . . . . . . . . . . . . . . . . . . . . . . . 6.4 SUPPLEMENTARY MATERIAL. . . . . . . . . . . . . . . . . . . . . . . . . . . . . . . . . . . . . . . . . . . . . . . . . . . . 6.4.1 List of Soil Resources to be Carried in Field or Vehicle . . . . . . . . . . . . . . . . . . . . . . . . . . . . . 6.4.2 Other Useful Soil Resources . . . . . . . . . . . . . . . . . . . . . . . . . . . . . . . . . . . . . . . . . . . . . . . . . 6.4.3 Glossary of Soil Terminology. . . . . . . . . . . . . . . . . . . . . . . . . . . . . . . . . . . . . . . . . . . . . . . . . 6.5 REFERENCE CARDS. . . . . . . . . . . . . . . . . . . . . . . . . . . . . . . . . . . . . . . . . . . . . . . . . . . . . . . . . . .
Reference Card S-1, Sides A and B. Soil Protocol Flowchart Reference Card S-2, Side A. Soil Pit Placement and Characteristics of Soil Horizon Types Reference Card S-2, Side B. Distinguishing Soil Horizons Reference Card S-3, Side A. Soil Structure, Coats, and Films; Guidelines for Cover Estimation . . Reference Card S-3, Side B. Examples of Some Redox and Other Soil Features Reference Card S-4, Side A. Determining Soil Texture Reference Card S-4, Side B. Soil Color Determinations Reference Card S-5, Side A. USDA Land Resource Regions (LRRs) Reference Card S-5, Side B. Hydric Soil Indicators by Land Resource Region, Evaluating Hydric Soil Indicators.
6.6 EQUIPMENT LIST, DATA FORMS, AND SAMPLE LABELS. . . . . . . . . . . . . . . . . . . . . . . . . . . . . . Equipment and Supply Checklist Form S-1: NWCA Soil Profile Data Example Labels for Soil Isotope and Sediment Enzyme Samples Soil Bulk Density or Chemistry Sample Tag Soil Bulk Density or Chemistry Sample Label Form T-4: NWCA Soil Chemistry and Bulk Density Sample Tracking
6-36-66-66-76-86-86-9
6-106-106-126-146-156-176-196-196-226-246-246-286-286-326-386-396-396-406-406-406-426-426-436-436-436-436-47
6-59
6-1

2011 NWCA Field Operations Manual Chapter 6. Soils
6-2

2011 NWCA Field Operations Manual Chapter 6. Soils
6-3
CHAPTER 6. SOILS The presence of hydric soil is a defining characteristic of wetland ecosystems. Soils influence surface and ground water movement in wetlands and provide a matrix for biogeochemical processes that affect wetland vegetation and other wetland ecosystem components, which reflect ecological condition (Tiner 1999, Mitsch and Gosselink 2007). The types of data to be collected as part of the NWCA are:
Soil profile and physical characteristics Hydric soil field indicators Soil chemistry and bulk density Soil isotopes and enzymes.
For more detailed information on the rationale for the soil indicator, see "Ecological Indicators for the 2011 National Wetland Condition Assessment" (USEPA in prep.). This chapter provides detailed protocols and methods for sampling the NWCA Soil Indicator. The Assessment Area and Buffer (AB) Team collects all soils data at each NWCA site. Soil sampling is conducted at four Soil Pits within each Assessment Area (AA), and includes 1) on-site description of the soil profile at 4 soil pits and 2) collection of four types of soil samples (chemistry, bulk density, isotope, and enzyme) for laboratory analysis (one pit only). A brief overview of sampling tasks is provided in the flowcharts on Reference Card S-1 (on the following two pages and in Section 6.5). While reading the protocols in this chapter it will be useful to refer to the flowcharts on Reference Card S-1, to several other Reference Cards that summarize key protocols or provide key information (Section 6.5), and to the soils data forms and equipment checklist (Section 6.6). Reference Cards may be laminated for easy access and use in the field. In addition to this chapter, two other field references are required to complete the soil protocols. They are:
Munsell Color X-Rite. 2009. Munsell Soil Color Charts. Grand Rapids, MI. USDA, NRCS (United States Department of Agriculture, Natural Resources Conservation Service). 2010. Field Indicators of Hydric Soils in the United States, Version 7.0. L.M. Vasilas, G.W. Hurt, and C.V. Noble (eds.). USDA, NRCS, in cooperation with the National Technical Committee for Hydric Soils. http://soils.usda.gov/use/hydric/ or ftp://ftp-fc.sc.egov.usda.gov/NSSC/Hydric_Soils/FieldIndicators_v7.pdf
Another useful reference, which should be carried in the vehicle or as needed into the field is:
Schoeneberger, P.J., D.A. Wysocki, E.C. Benham, and W.D. Broderson. 2002. Field Book for Describing and Sampling Soils, Version 2.0. Natural Resources Conservation Service, National Soil Survey Center, Lincoln, Nebraska, USA. ftp://ftp-fc.sc.egov.usda.gov/NSSC/Field_Book/FieldBookVer2.pdf
A list of additional reference material and a glossary of important soil terminology are provided in Section 6.4.

2011 NWCA Field Operations Manual Chapter 6. Soils
6-4
Reference Card S-1, Side A. NWCA Soil Protocol Flowchart
NO
Photograph the Soil Profile (Appendix D) either after horizon delineation or after the profile description is completed, as convenient.
1) Place a lettered flag (A, B, C, or D) at the Soil Pit location to identify it. 2) Excavate one Soil Pit to 60cm deep and extract a slab for soil profile using appropriate tools and methods for soil
conditions. Record pit depth, time of excavation, and lighting conditions on Form S-1. If an impenetrable layer prevents excavation and pit cannot be moved, record pit depth and type of impenetrable layer
on Form S-1. 3) Collect all soil profile data (see below) in this pit, then dig the next Soil Pit to 60cm and describe its soil profile. 4) Repeat until all four pits have been excavated and described to 60cm. Choose the Representative Pit. 5) Do not refill any pit until all pits have been examined, all samples have been collected from the Representative Pit, and water
depth data have been collected in all four pits.
Are standing water or obstacles present at the standard Soil Pit Location?
If water or mud ≥ 0.25m deep or other obstacle (e.g., TES species, large rock, tree, woody debris) is present, move pit to an alternate location as close to SE corner of Veg Plot as possible. Record pit location on Form S-1.
NO
If water and soft sediment < 0.25m deep, locate soil pit just outside SE corner of Veg Plot. Record pit location on Form S-1.
Place Soil Pit just outside SE corner of designated Veg Plot. Record pit location on Form S-1.
YES
Identify standard locations for Soil Pits (i.e., outside the SE corner of designated Veg Plot).
A. Soil Pit Location and Excavation to 60cm (See Section 6.1.1)
B. Soil Profile Description at Each Soil Pit (See Section 6.1.2)
YES Does soil have an inundated or saturated layer?
Immediately upon excavation, record initial soil matrix color and determine whether H2S odor (rotten egg) is detected (Form S-1).
Randomly select one Representative Soil Pit from the subset of pits that most represent the soils conditions of the AA.
Delineate soil horizons and for each horizon observed at each Soil Pit, determine and record on Form S-1 (Front):
Determine presence of Hydric Soil Indicators in the Soil Profile: 1) Use Reference Card S-5 to determine the Land Resource
Region (LRR) in which the AA occurs.
1) Horizon depth 2) Horizon boundary abruptness 3) Soil texture 4) % Rock fragments 5) % Roots 6) Soil matrix color 7) Presence and type of
redoximorphic or other features 8) % Horizon composed of distinct
or prominent redox and other features
9) Color of most evident redox or other feature
2) Evaluate the soil for the presence of Hydric Soil Indicators for the selected LRR and record on Form S-1 (Back).
Excavate soil, using an auger, to 125cm from the Representative Pit, or if easier dig pit to125 cm, and describe the soil profile from 60cm down to 125 cm. Complete photography of the soil profile for this pit.
Continue to Soil Sample Collection flowchart (Reference Card S-1, Side B).

2011 NWCA Field Operations Manual Chapter 6. Soils
6-5
Reference Card S-1, Side B. Soil Protocol Flowchart
C. Soil Sample Collection (See Section 6.1.3)
Soil Isotope and Sediment Enzyme Samples Collect soil isotope sample and sediment enzyme sample before expanding the Representative Pit for bulk density and chemistry sample collection. Collect 3 cores for the isotope sample and 6 for the enzyme sample. The same procedure is used for collecting both kinds of samples. 1) Fill out the appropriate sample tag and
sample label. Affix tag to outside of bag. 2) Use the syringe-corer to extract the
required number of 10-cm long soil cores from evenly spaced undisturbed locations within 1-m area surrounding the 60-cm pit.
3) Place all cores for the sample into the prepared sample bag. Properly fold the sample label into the top edge of the bag with the soil cores and carefully seal and staple the bag.
4) Place sealed bag of soil into a plastic food storage box, and place box in a small ice chest to keep it cool during the sampling day.
Bulk Density Samples1) For each horizon > 8cm thick
located in the top 60cm of the soil profile, prepare one bulk density sample bag, with completed sample tag and sample label.
2) Collect 3 soil cores using a small can, or if this is not feasible, a known volume of soil using another method, e.g., cut out a block of soil.
3) Place all 3 cores, or the soil blocks, into the sample bag.
4) Record the volume or dimensions of each of the cores or soil blocks making up the sample on the Sample Label.
Once the Representative Pit has been identified, collect four kinds of soil samples
Select tools appropriate to site conditions and expand the Representative Soil Pit and collect Bulk Density and Chemistry Soil Samples.
Chemistry/PSDASamples 1) For each horizon > 8cm
thick located down to 125cm, prepare one chemistry sample bag, with completed Sample Tag and Sample Label.
2) Collect 1 to 2.5 liters of soil (depending on rock and root content) for each sample.
1) Carefully remove air from sample bag.
2) Properly fold sample label into the top edge of the bag and staple bag shut.
3) Keep samples in a cool location during the day.
F. Soil Sample Handling and Processing (See Section 6.2, Chapter 2, Appendix A)
1) After all data and all samples have been gathered at all four pits, collect water depth data at each pit.
2) For each pit, record water depth values in the appropriate fields of the Soil Pit Water Depth section of its Form S-1: NWCA Soil Profile Data (Back).
1) Ensure all data and samples have been collected from all soil pits.
2) Backfill each pit and replace vegetation cap.
D. Soil Pit Water Depth (Section 6.1.4), Back-filling Soil Pits (Section 6.1.5), and Soil Tool Decontamination and Maintenance (Section 6.1.6)
1) Clean and decontaminate soils equipment.
2) Maintain soils equipment weekly by routinely lubricating all threads for connecting joints.
Wh 1) Keep bulk density and chemistry samples as cool as possible
by placing them in a shaded location whenever possible, and place isotope and sediment enzyme samples on ice.
ile at the Site:
2) At the end of the sample day, double check that all samples have been collected.
3) Complete Form T-1: NWCA 2011 Site and Sample Status and Tracking. a) In the Sample Status section of Form T-1, indicate the soil
isotope, the sediment enzyme, and the soil chemistry and bulk density samples have been collected.
b) Record sample id numbers on the labels for the soil isotope and sediment enzyme samples on Form T-1 in the WRS Sample Tracking section.
At Field Lodging or Office 1) Submit Form T-1 to Information Management Team; pack isotope
and enzyme samples in the ice-chest for immediately (within 24 hours) shipped samples to be sent to the EPA Lab, Corvallis, OR.
2) Ship batched bulk density and chemistry samples every two weeks
to the NRCS Lab with completed Form T-4: Bulk Density and Chemistry Soil Sample Tracking.
3) When packing soil samples for shipping, include a copy of the
pertinent tracking forms in the package and send any required copies to the Information Management Team.
4) Carefully seal the package, fill out shipping labels and affix to
package, affix required labels for regulated soils, and deliver package to shipping company.

2011 NWCA Field Operations Manual Chapter 6. Soils
6.1 SAMPLING PROCEDURES Protocols for NWCA soil sampling include several major elements (see Reference Card S-1), which are described in detail in this section: 1) Identifying Soil Pit location (Section 6.1.1) 2) Excavating pit (Sections 6.1.2 and 6.1.3) 3) Soil profile description (Section 6.1.2) 4) Soil sample collection (Section 6.1.3) 5) Water depth measurements (6.1.4) Prior to the sampling season, it will be helpful if you can consult with your local National Resource Conservation Service (NRCS) soil scientist for advice about likely soil conditions and the best methods for sampling soils at particular NWCA sites. Assistance with soils from the local NRCS office can be arranged through your Regional Monitoring Coordinator for the NWCA. This assistance could include: 1) obtaining preliminary site-specific information on soils for the site packet and 2) office or field meetings with the soil scientist for advice on specific issues concerning sampling soils on-site. Before going to each NWCA site, review the soil survey, maps, and photo information in the Site Packet (See Chapter 2). Use the Site Packet review and any discussions with the soil scientist to select the tools best suited to the anticipated soil conditions for the site to carry into the Assessment Area (AA) (see also Equipment List (Section 6.6) and Sections 6.1.2 and 6.1.3). Note that the NRCS soil scientist may also have specialized equipment to lend you for specific conditions in your area. Every effort should be made to obtain soils data and samples at each Soil Pit to the depth specified in the protocols (e.g., 60cm or 125cm). However, occasionally, due to inundation, cemented soils, or other major obstacles, it may not be possible to excavate the soil to the specified depth (even using excavation and sampling techniques appropriate to the site conditions (see Sections 6.1.2 and 6.1.3)). In such instances, describe soils and collect samples to the greatest depth feasible, and, if at all possible, to at least 30cm deep. 6.1.1 Identifying Soil Pit Locations The AB Team identifies the locations for soil sampling in the AA once the Vegetation (Veg) Team has established the Veg Plots to avoid disturbing plant communities prior to vegetation sampling. Prior to digging, clear proposed Soil Pit locations with the Botanist/Ecologist to ensure no threatened, endangered, or sensitive (TES) plant species are present. If any TES species are observed, move the proposed Soil Pit to an alternate location without TES species. Soil observations are made at four Soil Pits labeled with the letters, A, B, C, or D.
Designation of the pits as A, B, C, or D is at the convenience of the AB Team. A flag with the letter name for each Soil Pit is placed near its excavation site, so the Veg Team can easily note the locations of the Soil Pits on the sketch map or on an annotated aerial photo.
Soil Pits are typically placed at Standard Locations, but may be placed in Alternate
Locations to avoid certain obstacles (see below for details).
6-6

2011 NWCA Field Operations Manual Chapter 6. Soils
6-7
Data for each Soil Pit are recorded on a separate Form S-1: Soil Profile Data and the Soil Pit name (letter designation) is recorded in the header.
6.1.1.1 Standard Locations for Soil Pits Standard Soil Pit locations are just outside the southeast (SE) corners of the four Veg Plots furthest from the AA CENTER (Figure 6-1, Reference Card S-2, Side A). The standard location is used unless a combination of water depth and soft substrate ≥ 0.25m deep, or large wood or rock prevents soil access. If such an impediment to Soil Pit placement occurs, follow the procedures in Section 6.1.1.2 to select an Alternate Soil Pit Location. Standard AAs – For the Standard-Circular or Standard Circular-Shifted AA Layout, five 100-m2
Veg Plots are positioned at prescribed distances from the AA CENTER along cardinal bearings (See Chapter 5; Reference Card V-1). Locate each Soil Pit immediately outside the southeast corner of a Veg Plot as illustrated in Figure 6-1A. Alternate AAs – The location of Veg Plots vary with the shape and size of the Alternate AA (Reference Card AA-1) and the associated Veg Plot Layout (See Chapter 5; Reference Card V-1), but the Soil Pits are still located just outside the SE corner (or the corner closest to SE) of each of the four Veg Plots furthest from the AA CENTER (Figure 6-1B). The Veg Team will have designated the Veg Plots numbers on flags in the SE most corners of the plots. Recording Soil Pit Locations – Record the number of the Veg Plot with which each Soil Pit is associated on its Form S-1 in the Soil Pit Location field and fill in the bubble for Standard location outside SE corner of Veg Plot.
Figure 6-1. Standard Soil Pit Locations. A. Standard Circular AA Layout with five Veg Plots and four Soil Pits. B. Narrow Polygon AA Veg Plot Layout with Soil Pits.
4 AA CENTER
NA
3
2
1
Veg Plot
Soil Pit locations 5
5
2 4 325m 1
200m
40m

2011 NWCA Field Operations Manual Chapter 6. Soils
6.1.1.2 Alternate Locations – Moving Soil Pits to Avoid Obstacles If a combination of water depth and soft substrate ≥ 0.25m deep, the presence of TES plant species, large wood, or rock prevent soil access at the standard Soil Pit location, move the pit so it is outside of and as close as possible to the SE corner of the Veg Plot. Moving the Soil Pit – Place the Soil Pit so it is at least 2m away from an upland edge or other non-wetland landcover type that might influence soil condition. If more than one Soil Pit must be relocated, try to maintain 10m between soil pits. Recording Soil Pit Locations – Record the new Soil Pit location on its corresponding Form S-1. Fill in the Alternate Location bubble in the Soil Pit Location field and record distance and bearing of the pit from the SE corner of the nearest Veg Plot. 6.1.2 Description of Soil Profiles At each of the four Soil Pit locations (see Section 6.1.1), the AB Team collects data describing the properties of the soil profile (Form S-1: Soil Profile Data, Reference Cards S-1 through S-5). Soils are characterized by multiple horizons, each of which has unique properties. Soil horizons develop from the action of water, plants, and soil biota on the soil parent material. All horizons present at a given location (e.g., an NWCA soil pit) constitute the soil profile. Understanding general differences in major types of soil horizons (Text Box 6-1) can aid in distinguishing horizon boundaries; however, the AB Team will not determine horizon types when evaluating soils. During sampling, the AB Team consecutively numbers (beginning with 1 at the soil surface) each distinct soil horizon observed at each Soil Pit. Horizon names will be added post-sampling by a soil scientist based on the soil profile data collected by the AB Team.
Text Box 6-1. Major Soil Horizon Types O – Organic horizon consisting of high accumulations of organic carbon (if you feel more than a couple of
mineral grains (grit from sand, stickiness from clay, silt deposits on hands) it is most likely a mineral horizon high in organic matter (OM), not an organic soil)
A – Mineral horizon formed at the surface from significant organic carbon accumulation (will be darker in color
than the horizons below due to OM accumulation) E – Mineral horizon that exhibits significant loss of organic carbon, Fe (Iron), Mn (Manganese), Al (Aluminum),
and/or clays (usually paler in color and lighter in texture (less clayey) than horizons below) B –Mineral horizon with accumulations of Fe, Mn, secondary minerals, Al-organic compounds, and/or clay, or
development of soil structure (can be higher in clay, may be brighter in color, or may contain more redoximorphic (redox) concentrations than the horizons above it)
C – Mineral soil little affected by soil genesis, or soft bedrock or former bedrock. Lacking properties of O, A, E,
and B horizons (lacks structure, may appear to look like parent material (hard bedrock) but breaks into mineral grains and gravel upon excavation)
L – Inorganic and organic limnic materials deposited in water by precipitation or derived from underwater and
floating aquatic plants and aquatic animals (lacks structure, may appear to look like parent material (hard bedrock) but breaks into mineral grains and gravel upon excavation)
R – Strongly cemented bedrock horizon W – A layer of water found under floating but fixed vegetation Note: O, A, E, B horizons, and mucky mineral layers must be at least 1-cm thick to be considered a horizon.
6-8

2011 NWCA Field Operations Manual Chapter 6. Soils
Overview of Soil Profile Description Activities To describe the soil profiles for each of the four Soil Pits in the AA, the AB Team will: Excavate the Soil Pit (Section 6.1.2.1) Make initial observations of changeable properties, if soil is saturated or inundated (6.1.2.2) Delineate soil horizons (Section 6.1.2.3) Describe soil texture for each horizon (Section 6.1.2.4), Estimate percent rocks and roots for each horizon (Section 6.1.2.5) Describe soil color, redoximorphic, and other features for each horizon (Section 6.1.2.6) Identify hydric soil indicators (Section 6.1.2.7) Photograph the soil profile (Section 6.1.2.3 and Appendix D) Important: Note that although the soil profile description generally proceeds in the order listed above, soil profile description is an iterative process and information from all steps inform horizon delineation and hydric soil indicator identification. The AB Team will use Soil Pits of two depths to describe soil profiles in the AA; three 60cm deep Soil Pits and one 125cm deep Representative Pit. An overview of the two Soil Pit types is provided here. Detailed protocols for profile description activities are presented in Sections 6.1.2.1 – 6.1.2.7. All Soil Pits Initially Excavated to 60cm – Each of the four Soil Pits is excavated to a depth of 60cm and its profile described. 1) As each Soil Pit is excavated to 60cm, immediately begin soil profile description; giving your
initial attention to characteristics that may fade or change rapidly upon exposure to air (i.e., hydrogen sulfide odor and color, Section 6.1.2.2).
2) Record on Form S-1, all components of the profile data for each horizon using the protocols described in Sections 6.1.2.3 - 6.1.2.7.
3) Once the profile description is completed for one Soil Pit, move to the next Soil Pit location
and excavate and describe its soil profile.
One Representative Pit Excavated to 125cm – After the profile descriptions are completed for the four 60cm Soil Pits, use this information to select one pit for expanded soil profile description and collection of soil samples down to, or as near as possible to,125cm. The pit selected for excavation to 125cm should be randomly selected from the subset of the four 60-cm pits that are most representative of the soils in the AA.
Guidelines for selecting the Representative Soil Pit: 1) Random selection – If all four Soil Pits have similar or dissimilar soils, randomly select
the Representative Pit. If two pits are similar, and two are different from the first set, but similar to one another, randomly select the Representative Pit from the two pits that represent the dominant condition for the AA. For example, if two pits are inundated and two are saturated and the dominant condition is saturation, randomly choose the representative pit from the two that are saturated.
2) Common physical setting, texture, or hydric soil field indicators – If three of the four
pits are similar and one is different, randomly select the representative pit from the three similar pits. For example: common physical settings (e.g., three pits lacking water and
6-9

2011 NWCA Field Operations Manual Chapter 6. Soils
one submerged, three pits in swales one on a low hummock), similar texture (e.g., three pits with clayey soils and one with coarser, sandier texture), or presence of hydric soil field indicators (e.g., three pits with hydric indicators, one without).
3) Ease of excavation – If any of the Soil Pits most representative of the AA soils coincide
with an obstacle (e.g., large roots, rocks, etc.); select the pit that is most easily sampled.
Expanding the Representative Pit to collect additional soil profile data: 1) Extract or view the soil profile from 60 to 125cm using one of the following approaches:
a) In most soils, an auger (Figure 6-2b) can be used to extend the depth of the Representative Pit to 125 cm and extract successive segments of the soil profile.
b) For difficult soils, use the excavation technique appropriate for the soil conditions (See the Difficult to Sample Soils subheading in Section 6.1.2.1).
2) Carefully lay out the soil core or slab segments end to end, on plastic sheeting placed on
the ground surface, in spatial order to mirror the in situ position of the soil.
3) View the reconstructed soil profile and describe all horizons between 60 and 125cm (Sections 6.1.2.2 – 6.1.2.8).
4) Later, when the Representative Pit is expanded to collect soil samples (Section 6.1.3);
reexamine the pit wall to refine the soil profile description. Techniques for expanding the pit for soil sample collection and protocols for collecting and preparing soil samples for shipping to the laboratory are described in Sections 6.1.3 and 6.2, respectively.
6.1.2.1 Excavating Soil Pits for Profile Description
As each Soil Pit is excavated, complete the Soil Pit Attributes section, and, if applicable, the Representative Pit section of Form S-1 (Front). 1) Record depth (cm) of the hole dug for each Soil Pit in the Total Pit Depth field. In the case of
the Representative Pit, this is the depth for the initial profile description (usually 60cm). 2) Note the time of pit excavation. 3) Indicate the prevailing Lighting Conditions during soil profile description activities. 4) Important – For the Representative Pit:
a) Fill in the Representative Pit bubble on the appropriate Form S-1 b) Record the Final Pit depth after excavation and sample completed (Section 6.1.2.3) c) Ensure the site specific Sample ID for the Representative Pit on Form S-1 (typically
preprinted) matches the Sample ID on the Bulk Density or Chemistry Soil Sample Tag and the Bulk Density or Chemistry Soil Sample Label (Section 6.1.2.3). Note that the last digit on the tags and labels is absent from Form S-1 because it reflects the horizon number from which each sample is collected.
See procedures below for excavating Easy to Sample Soils and Difficult to Sample Soils.
Easy to Sample Soils (e.g., not submerged, not cemented)
1) Begin by removing the vegetation surface layer using a shovel with a long narrow blade (e.g., ~30cm in length, Figure 6-2a).
6-10

2011 NWCA Field Operations Manual Chapter 6. Soils
a) Use shallow shovel cuts (~15cm deep or just through the vegetation layer) to outline a rectangular area wider than the shovel blade and about 45cm long to define the “vegetation cap”.
b) Use the cutting edge of the shovel to slice through as many roots as possible. If
needed, use pruners to cut large roots that could tear the vegetation cap apart when it is lifted. Scoop up this upper block of soil just under the root mass with the shovel.
c) Set the cap of rooted vegetation, shoot side up, in the shade. The vegetation cap will be
replaced after soil sampling is complete and the Soil Pit is backfilled, to allow the vegetation to reestablish.
2) Each of the four Soil Pits should be excavated to 60cm. Initially, dig a pit to a depth of at
least 30 to 40cm. Use the shovel or an auger (Figure 6-2a,b, Text Box 6-2) to excavate the remainder of the soil pit to a depth of 60cm.
3) If water or slumping soil in a pit prevents soil extraction to the 60cm depth, excavate the soil slab to the greatest depth possible and describe the soil profile to that depth. Then, if possible, use techniques for Difficult to Samples Soils (subheading below, Text Box 6-2) to excavate down to 60cm and complete the profile description.
4) If a large rock, log, very large root, or disturbed area (animal burrow, tree-fall pit) is encountered before reaching 60cm, move or expand the pit.
5) If a cemented horizon or similar impenetrable material is encountered and is large enough in extent to make moving the pit impractical, excavate the pit to the maximum possible depth. Record the occurrence and type of the impenetrable layer or object and its depth from the surface in the Impenetrable Layer section on Form S-1.
6) Use a knife (e.g., inexpensive hunting or kitchen knife) or root pruners to clean the soil on
one narrow face of the pit by removing plant tissue or soil transferred from other depths. 7) Remove the soil slab and, if taken, auger cores:
a) On the cleaned face end of the pit, carefully make cuts perpendicular to the face of approximately a shovel width to demarcate the sides of the soil slab to be extracted.
b) Slice through the soil about 10cm behind the cleaned pit face to connect the side cuts. c) Push the shovel 30cm deep and pull back on the shovel as the other AB Team member
gently holds the soil against the blade.
d) Carefully slide the slab section from the shovel blade onto a clean plastic sheet or tarp.
e) Clean loose soil out of the pit and extract a second slab section to the 60-cm depth using the shovel (or extract this lower section with an auger).
f) Match up the slab sections or the upper slab section and lower augered sections end-to-
end mirroring the soil’s in situ position.
8) Once the soil slab, or slab and core, is extracted, immediately conduct the protocols for detection of hydrogen sulfide odor, and if the soil is inundated or saturated, for initial matrix color (Section 6.1.2.2). Then continue with all other soil profile description activities (Sections 6.1.2.3 to 6.1.2.7).
6-11

2011 NWCA Field Operations Manual Chapter 6. Soils
Difficult to Sample Soils
Subaqueous (submerged) soils, saturated sands, organic soils, and clayey soils can be challenging when attempting to obtain an intact soil slab or soil core. See Text Box 6-2 and Figure 6-2 and 6-2 continued for special tools and alternate extraction methods.
Shallowly Submerged Soils (e.g., water ≤ 0.25m deep) – If soil strength allows, soil pits 60cm deep may be excavated from under shallow water using a hand pump to evacuate water and digging techniques similar to those used for soils that are not submerged. If water is swift or soil too unconsolidated, special tools may be required.
Saturated Soils – Slumping of soil may be minimized by lifting the soil slab away from the pit face very slowly or using extraction tools other than a shovel.
Submerged Sandy Soils – A tube extractor may be useful for unconsolidated sandy soils.
Low-Strength Organic Soils – A peat auger may be required for high organic content soils.
Heavy Clay Soils – To avoid breaking the shovel handle when excavating heavy clay soil (particularly if dry), extract a thin slab.
Once the soil pit is dug and the slab and core extracted, immediately conduct soil profile description activities (Sections 6.1.2.2 to 6.1.2.7).
Text Box 6-2. Special Tools and Soil Extraction Methods 1) Augers: Augers are available in many styles of bucket and cutting tips (Figure 6-2b) for
different soil conditions. Use an auger for extending the Representative Pit to 125cm and in conditions where the soil cannot be retrieved with a shovel. Note, augers mix the soil sample so they are not used to obtain bulk density samples. For profile description and chemistry sample collection, take care to mark the depth from which the soil is removed using an auger because of the potential for compression or expansion of the soil as it is extracted.
2) Tube extractor (King soil extractor, Figure 6-2 continued): The King soil extractor is used for
submerged sandy soils and low-strength organic soils. It is typically constructed from a plastic or metal tube (15-cm diameter and 60cm long) with a metal tube-clamp at its base for adjusting tube diameter. Hammer the King extractor into the unconsolidated substrate. Dig a slot alongside the tube and insert a spade to cover the deep end of the tube. Tip the tube and spade over into the slot and lift tube onto a floating sled. Expand the tube slightly and extrude the soil in the tube, forcing it out with a plunger.
3) Coffer dam and hand pump (Figures 6-2 continued and 6-8c): For submerged soils with
shallow standing water, build a coffer dam using the spoils from the pit. If needed, use plastic or metal sheeting to reinforce the dam walls around the soil pit area. With the dam in place, remove the standing water with a hand pump and proceed to excavate a slab and describe the soil profile. Remove vegetation around the base of the coffer dam if necessary to achieve a seal for the dam walls against the ground. It may be necessary to operate the hand pump continuously during extraction of the soil slab and collection of soil samples.
4) Plastic snow sled: At sites with standing water or soft sediments (Figure 6-2 continued), a
plastic snow sled is a useful platform to lay out slabs and cores for viewing for profile description, for facilitating sample collection, and to store equipment.
5) Consult with local soil scientist: In some cases, the local soil scientist may suggest
alternative sampling methods appropriate to particular site conditions. The soil scientist may be able to loan you the tools (e.g., peat sampler, gas-powered water pump, or specialized equipment that is used locally) and provide training on their use so samples can be more readily and quickly extracted.
6) Soil Probe (Figure 6-2d): May be useful for collecting isotope soil samples in drier clay soils.
6-12

2011 NWCA Field Operations Manual Chapter 6. Soils
A
B
C
D
Figure 6-2. Examples of Tools for Soil Pit Excavation or Soil Extraction. Photos by Gregg Lomnicky. A. (Left to right) Tiling, Sharpshooter, Regular Shovels. B. (Left to Right) Auger handle extensions, ratchet handle, mud auger buckets (solid), bucket auger with handle, auger buckets. C. Bulk density corer (steel tubing with beveled edge). D. (Left to Right) Soil Probe, Hammer Corer. The tools most commonly used in the NWCA are a tiling or sharpshooter shovel (A) and an auger (B) for pit excavation and chemistry sampling, and a can (see Figures 6-8 and 6-9) for bulk density sample collection. Other tools pictured (C and D) may be useful for specific conditions and may be available from a local soil scientist (e.g., see Text Boxes 6-2 and 6-6).
6-13

2011 NWCA Field Operations Manual Chapter 6. Soils
Figure 6-2 continued. Upper: King soil extractor and plastic snow sled (Photos by Regina Poeske). Lower: Hand pump and soil coffer dam (Photos by Gregg Lomnicky) 6.1.2.2 Initial Color for Saturated Soil and Detection of Hydrogen Sulfide (H2S) Odor 1) Assess these properties immediately upon excavating the soil pit and before delineating
the horizons, as color can change or hydrogen sulfide odor dissipate rapidly upon exposure to air.
6-14
2011 NWCA Field Operations Manual Chapter 6. Soils
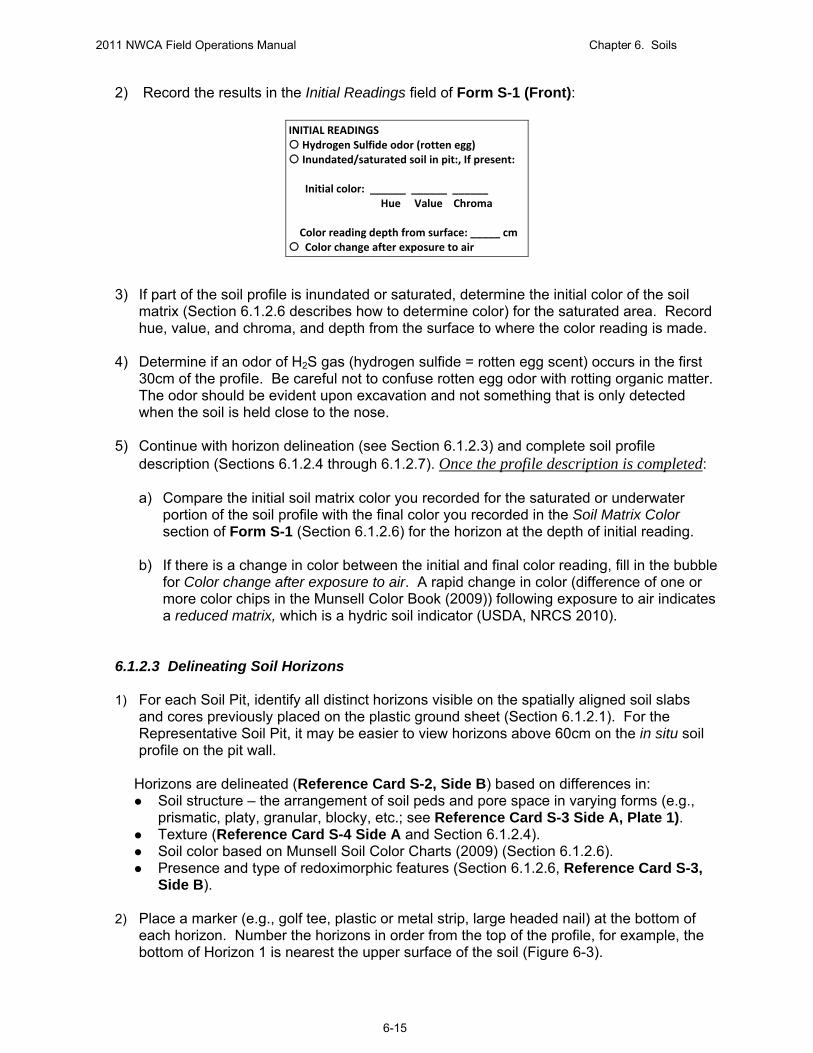
2) Record the results in the Initial Readings field of Form S-1 (Front): INITIAL READINGS
Hydrogen Sulfide odor (rotten egg) Inundated/saturated soil in pit:, If present: Initial color: ______ ______ ______ Hue Value Chroma Color reading depth from surface: _____ cm Color change after exposure to air
3) If part of the soil profile is inundated or saturated, determine the initial color of the soil
matrix (Section 6.1.2.6 describes how to determine color) for the saturated area. Record hue, value, and chroma, and depth from the surface to where the color reading is made.
4) Determine if an odor of H2S gas (hydrogen sulfide = rotten egg scent) occurs in the first
30cm of the profile. Be careful not to confuse rotten egg odor with rotting organic matter. The odor should be evident upon excavation and not something that is only detected when the soil is held close to the nose.
5) Continue with horizon delineation (see Section 6.1.2.3) and complete soil profile
description (Sections 6.1.2.4 through 6.1.2.7). Once the profile description is completed:
a) Compare the initial soil matrix color you recorded for the saturated or underwater portion of the soil profile with the final color you recorded in the Soil Matrix Color section of Form S-1 (Section 6.1.2.6) for the horizon at the depth of initial reading.
b) If there is a change in color between the initial and final color reading, fill in the bubble
for Color change after exposure to air. A rapid change in color (difference of one or more color chips in the Munsell Color Book (2009)) following exposure to air indicates a reduced matrix, which is a hydric soil indicator (USDA, NRCS 2010).
6.1.2.3 Delineating Soil Horizons 1) For each Soil Pit, identify all distinct horizons visible on the spatially aligned soil slabs
and cores previously placed on the plastic ground sheet (Section 6.1.2.1). For the Representative Soil Pit, it may be easier to view horizons above 60cm on the in situ soil profile on the pit wall.
Horizons are delineated (Reference Card S-2, Side B) based on differences in: Soil structure – the arrangement of soil peds and pore space in varying forms (e.g.,
prismatic, platy, granular, blocky, etc.; see Reference Card S-3 Side A, Plate 1). Texture (Reference Card S-4 Side A and Section 6.1.2.4). Soil color based on Munsell Soil Color Charts (2009) (Section 6.1.2.6). Presence and type of redoximorphic features (Section 6.1.2.6, Reference Card S-3,
Side B).
2) Place a marker (e.g., golf tee, plastic or metal strip, large headed nail) at the bottom of each horizon. Number the horizons in order from the top of the profile, for example, the bottom of Horizon 1 is nearest the upper surface of the soil (Figure 6-3).
6-15

2011 NWCA Field Operations Manual Chapter 6. Soils
6-16
3) Clear loose organic debris from the top of the profile at the ground surface, then measure the depth from the top of the soil profile to the bottom of each horizon in centimeters (a metric fiberglass seamstress tape with a fishing weight on the bottom end works well).
4) For the Soil Pit under consideration, record the depth to the lower boundary of each
horizon in the Depth to Lower Boundary of Horizon column of Form S-1 (Front). For example, in Figure 6-3 (diagram), the lower horizon boundaries are at 2cm for Horizon 1, 4cm for Horizon 2, 7cm for Horizon 3, 20cm for Horizon 4, and 45cm for Horizon 5.
5) If either boundary of a horizon is less than 2cm wide, fill in the abrupt boundary bubble in the Horizons section of Form S-1 (Front).
6) Space is provided for nine horizons on Form S-1; although, it is unlikely you will routinely
encounter that many horizons in a particular profile. If more than nine horizons at a single pit are ever encountered, flag the last horizon and make a note in the Comments section that data for additional horizons are continued on another page of Form S-1 (Front).
7) Once the horizons are delineated and marked, photograph the soil profile as directed in
Appendix D.
4
5
Ground Surface
60 cm
Soil Pit Bottom
23 1
Figure 6-3. Left top: Soil slab diagram with horizons marked. Left bottom: Soil slab photo by Eric Vance, EPA. Right: Example soil profiles illustrating horizons distinguished by different colors, structure, or texture. Profile photos from USDA-NRCS (2010).
2011 NWCA Field Operations Manual Chapter 6. Soils
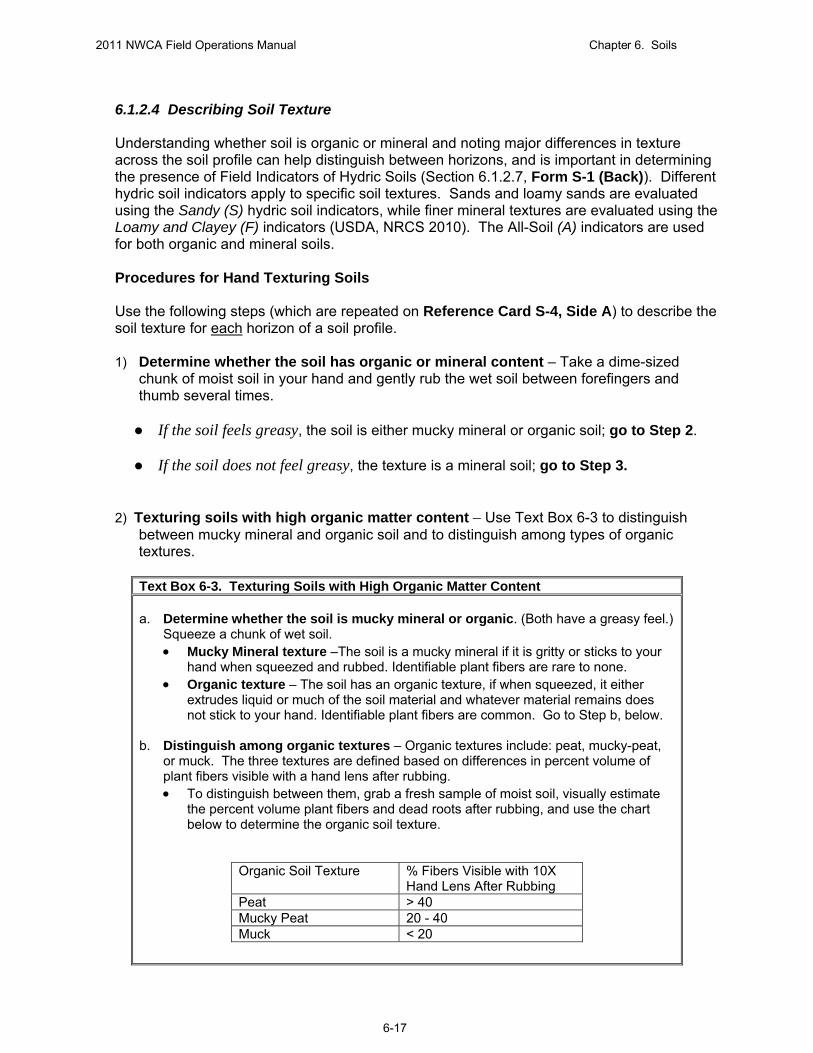
6.1.2.4 Describing Soil Texture Understanding whether soil is organic or mineral and noting major differences in texture across the soil profile can help distinguish between horizons, and is important in determining the presence of Field Indicators of Hydric Soils (Section 6.1.2.7, Form S-1 (Back)). Different hydric soil indicators apply to specific soil textures. Sands and loamy sands are evaluated using the Sandy (S) hydric soil indicators, while finer mineral textures are evaluated using the Loamy and Clayey (F) indicators (USDA, NRCS 2010). The All-Soil (A) indicators are used for both organic and mineral soils. Procedures for Hand Texturing Soils Use the following steps (which are repeated on Reference Card S-4, Side A) to describe the soil texture for each horizon of a soil profile. 1) Determine whether the soil has organic or mineral content – Take a dime-sized
chunk of moist soil in your hand and gently rub the wet soil between forefingers and thumb several times.
If the soil feels greasy, the soil is either mucky mineral or organic soil; go to Step 2.
If the soil does not feel greasy, the texture is a mineral soil; go to Step 3.
2) Texturing soils with high organic matter content – Use Text Box 6-3 to distinguish
between mucky mineral and organic soil and to distinguish among types of organic textures.
Text Box 6-3. Texturing Soils with High Organic Matter Content a. Determine whether the soil is mucky mineral or organic. (Both have a greasy feel.)
Squeeze a chunk of wet soil. Mucky Mineral texture –The soil is a mucky mineral if it is gritty or sticks to your
hand when squeezed and rubbed. Identifiable plant fibers are rare to none. Organic texture – The soil has an organic texture, if when squeezed, it either
extrudes liquid or much of the soil material and whatever material remains does not stick to your hand. Identifiable plant fibers are common. Go to Step b, below.
b. Distinguish among organic textures – Organic textures include: peat, mucky-peat,
or muck. The three textures are defined based on differences in percent volume of plant fibers visible with a hand lens after rubbing. To distinguish between them, grab a fresh sample of moist soil, visually estimate
the percent volume plant fibers and dead roots after rubbing, and use the chart below to determine the organic soil texture.
Organic Soil Texture % Fibers Visible with 10X Hand Lens After Rubbing
Peat > 40 Mucky Peat 20 - 40 Muck < 20
6-17

2011 NWCA Field Operations Manual Chapter 6. Soils
3) Texturing mineral soils – Use Figure 6-4 below to guide you through simple field tests
for determining texture for mineral soils.
Texturing Mineral Soil
Begin by picking up a golf ball-sized or slightly larger sample of soil from the center of the horizon. Remove roots and rocks.
Add water with spray bottle and break down all lumps. The soil is prepared when plastic and moldable, like moist putty or cookie dough. Place a golf-ball sized sample in your palm.
Add dry soil and start again.
Figure 6-4. Flowchart for simple hand tests to determine soil texture of three major mineral soil groups. Modified from Thien (1979).
4) Record the texture results for each horizon – For the Soil Pit and horizon you are
considering, fill in the bubble reflecting the observed texture for the horizon in the Soil Texture section of Form S-1.
If the soil is mucky mineral, loamy/clayey, or sandy, fill in the appropriate bubble. If the soil is organic fill in the appropriate texture bubble in the Organic field to indicate
whether the texture is peat, mucky peat, or muck. If you cannot determine which organic texture applies, fill in the bubble for unspecified organic texture.
Does soil remain in a ball when squeezed?
Place ball of soil between thumb and forefinger gently pushing the soil with the thumb, squeezing it outward into a thick ribbon. Push the ribbon over the forefinger. Measure the length when it bends or breaks from its own weight.
Is soil too dry? Is soil too wet?
SAND
Does soil form a ribbon more than ½ inch long?
YES YES
NO NO NO
YES
NO YES LOAMY
SANDY AND SOILS CLAYEY
SOILS
6-18

2011 NWCA Field Operations Manual Chapter 6. Soils
6.1.2.5 Estimating Percent Rocks and Roots 1) Examine an area of each horizon (e.g., ~10cm2) and estimate the percent of the surface
area of the soil matrix occupied by rocks > 2mm diameter and by roots.
Percent surface area is estimated directly from 0-100%. Review Plate 3. Surface Area Estimation of Soil Features on Reference Card S-3, Side A to familiarize yourself with the appearance of different percentages for a particular feature. Note that the same percentage can look different depending on whether the feature is aggregated or dispersed. Do not deliberate extensively over surface area estimates (e.g., for small values choosing between 1 or 3%, or 5 or 10%; for higher values choosing between 25 and 35%, or 75% or 85%). It is not appropriate to agonize over small differences because this precision exceeds the accuracy of our ability to detect surface area differences.
2) Record the percentage for each feature in the appropriate column on Form S-1 (Front):
Percent rock fragments > 2mm in diameter Percent roots
6.1.2.6 Describing Soil Color and Identifying Redoximorphic and Other Soil Features For each horizon evaluate the following properties and record the data on Form S-1: 1) Determine the color of the soil matrix (dominant part of soil) using a Munsell Soil Color
Book (Munsell Color X-Rite 2009) (Figure 6-5) and the procedures in Text Box 6-4 (repeated on Reference Card S-4, Side B). Record the color codes for the hue, value, and chroma matching the soil matrix in the Soil Matrix Color section on Form S-1: NWCA Soil Profile Data (Front). Color reflects physical and chemical properties of the soil and provides information on hydric conditions. Soil color has three components; hue, value, and chroma. Chroma is particularly important as a hydric soil indicator.
2) Determine whether redoximorphic, organic, or mottle features are present in the horizon.
See Reference Card S-3, Side B for examples illustrating some of these features. Redoximorphic and other soil features provide information about inundation and other soil properties.
Redoximorphic (Redox) features are color patterns (deviations from the soil matrix
color) caused by recent redistribution of carbon (C), Iron (Fe), or Manganese (Mn) as a result of reduction and oxidation processes associated with wetting and drying cycles (Vepraskas 1995, USDA, NRCS 2010). Redox features include uncemented concentrations and depletions (losses) of these elements, and are observed in pore linings, ped faces, or the soil matrix as soft masses and colors that contrast with soil matrix color (USDA, NRCS 2010). A soft mass is a splotch in the soil and a pore lining would have iron or other elements coating the larger voids (i.e., root channels, cracks between peds). Depletions are gray zones that occur in the matrix or on pore linings and ped faces.
Mottles are any other kind of splotch of color.
6-19

2011 NWCA Field Operations Manual Chapter 6. Soils
Nodules and Concretion – Nodules are cemented bodies (commonly spherical or tubular) that can be removed as discrete units from the soil, but which do not have discernible crystalline structure when viewed with a 10X hand lens. Concretions are similar to nodules, but have concentric layers of material around a point (Schoeneberger et al. 2002).
Organic bodies typically occur at the tips of roots and are commonly 1 to 3 cm in
diameter with muck or mucky modified textures. Other organic features include stripped zones and organic infilling. Stripped zones
are areas where iron-manganese oxides and/or organic matter have been stripped from the matrix and the primary base color of the soil material is exposed. The stripped areas and translocated oxides and organic matter form a contrasting pattern of two or more colors with diffuse boundaries (USDA, NRCS 2010).
For more detailed discussion of these features, see Field Indicators of Hydric Soils in the United States (USDA, NRCS 2010) and Schoeneberger et al. (2002).
3) If redox, organic, or mottle features are absent from a horizon, fill in the bubble in the Absent field of the Redoximorphic, Organic, or Mottle Features section of Form S-1 and proceed to describing the next horizon.
4) If present in a horizon, note which kind of redox or other features occur by filling in all
pertinent bubbles in the Feature Types fields of the Redoximorphic, Organic, or Mottle Features section of Form S-1: Composition: Fe = iron, Mn = manganese, C = carbon, U = unable to specify. Redox Features: S = Soft masses, N = nodules, concretions, P= pore linings, D =
depletions. Mottles and Organic Features: M = mottles, MS = masked sand grains, OB = organic
bodies, OF = other organic features.
5) If masked sand grains are present (see Reference Card S-3, Side A, Plate 2), estimate the percentage of the horizon that they occupy and record this value in the % Masked Sand Grains field. This is important for determining if a sandy soil is hydric. Also a sandy soil with a thick black surface and 30 percent or more unmasked grains is an indication that the site is becoming drier. To determine if more than 70 percent of the grains are masked it should look like almost 100 percent black to the naked eye when soil is moist. Under a 10x hand lens you should see 30 percent or less of the individual grains uncoated.
6) Estimate the percent surface area (0 to 100%) of a horizon occupied by a combination of
distinct and prominent redox features (see Reference Card S-3, Side B). Record these estimates in the % Horizon with Distinct or Prominent Features column of the Redoximorphic Features section of Form S-1.
Note, the terms “faint”, “distinct”, and “prominent” refer to level of color contrast
between soil matrix and redox features, not to discreteness of redox features. Use the tables on Reference Card S-4, Side B (see Schoeneberger et al. (2002) for
more detail) to quickly distinguish faint from distinct and prominent contrast levels between redox features and the soil matrix.
6-20

2011 NWCA Field Operations Manual Chapter 6. Soils
Exclude faint contrast redoximorphic features from the percent estimates.
7) Determine the colors (see Text Box 6-4) of the most evident (in terms of contrast and abundance) redoximorphic or other features observed in the matrix of each horizon. Record this color information in the Hue, Value, and Chroma color fields in the Redoximorphic, Organic, or Mottle Features section of Form S-1.
Text Box 6-4. Evaluating Color for the Soil Matrix and for Redoximorphic Features Determining Color of the Soil Matrix: 1) To determine soil matrix color, choose a representative, freshly broken surface of a soil ped
that is not coated with clay, Fe (Iron), or Mn (Manganese). 2) Use a spray bottle to wet the soil if it is dry. Spray until moist, but not saturated. As soon as
the water is absorbed into the soil, read the color from the Munsell Soil Color Book (Munsell Soil Color, X-Rite 2009) (See Step 3).
3) Match the soil matrix color (hue, value, and chroma) to the soil color chips from the Munsell
Soil Color Book (See Figure 6-5). Hue is found on the Munsell page tab and labeled using numbers and letters (e.g., 2.5YR or 10R). Value is found on the left side of the page along the y-axis of the color chip array and is represented by numbers (e.g., 2.5, 8). Chroma is found at the bottom of the page along the x-axis of the color chip array and is represented by numbers or by numbers and letters for gleyed soils (e.g., 1, 8, 5G, 10GY).
4) Observe the soil color in direct sunlight with the sun at your back and shining over your right
shoulder whenever possible (Figure 6-5). Match the color of the soil with the closest color chip from the Munsell Soil Color Book. Start at the 10YR page and go left for redder and right for yellower or grayer colors. The color chips in the Munsell Book have central holes so that the soil can be directly
compared through the hole to the chip of interest. Take care to keep the color chips clean and dry.
5) Record color codes for the hue, value, and chroma matching the soil matrix color on Form S-1:
NWCA Soil Profile Data (Front). Determining Color of Redoximorphic, Organic, or Mottle Features: 1) When redoximorphic or other features (See Reference Card S-3 for examples) are present in
the horizon, determine the color for the most evident feature observed. 2) Select a representative, freshly broken surface of a soil ped that clearly illustrates the redox or
other feature of interest. 3) Focus on this feature and use Steps 2 through 4 (as described above for determining Soil
Matrix color) to match the feature color with the closest color chip from the Munsell Color Book. Record the color codes for the hue, value, and chroma matching in the appropriate fields on Form S-1: NWCA Soil Profile Data (Front).
6-21

2011 NWCA Field Operations Manual Chapter 6. Soils
Hue
Value
Chroma
Match soil color by viewing soil clod through center holes to compare to color chips
Viewing color book with sun shining over right shoulder
Hue
Figure 6-5. Using a Munsell Soil Color Book. Photos by Thanh Nguyen and Amanda Nahlik, USEPA.
6.1.2.7 Identifying Hydric Soil Indicators The next component of soil profile description is to evaluate the soil profile for the presence of Hydric Soil Indicators using the:
Field Indicators of Hydric Soils in the United States (USDA-NRCS 2010); hereafter the Hydric Soil Indicators manual. This manual is the standard for the NWCA for determining the presence of the hydric soil indicators.
Procedures for evaluating hydric soil indicators for the NWCA are described in Text Box 6-5 (repeated on Reference Card 5). Hydric soil indicators form as a result of the soil being
6-22

2011 NWCA Field Operations Manual Chapter 6. Soils
saturated, and anaerobic, long enough to meet the definition of a hydric soil. Note, hydric soil indicators were designed for determining wetland boundaries, and hydric soils in the interior of wetlands may not always display these indicators (USDA, NRCS 2010). Hydric Soil Indicators are texture specific – Different indicators apply to different texture
groups (USDA, NRCS 2010). The All Soil (A) indicators are applicable to all soils. Textures from sands to loamy fine sands are evaluated using the Sandy Soils (S)
indicators. Finer textured mineral soils (loamy very fine sand and finer) are evaluated using the
Loamy/Clayey Soil (F) indicators. Hydric Soil Indicators are regionally specific – Specific subsets of the hydric soil
indicators are used for different USDA Land Resource Regions (LLRs). A map illustrating LRRs applicable to your state, and a list of hydric indicators for each LLR, are provided on Reference Card S-5 and in the NRCS Hydric Soil Indicators Manual (USDA, NRCS 2010).
Hydric Soil Indicator Codes – Hydric Soil Indicator names have two parts, a descriptive
label (e.g., Histic epipedon, Dark surface, Iron Manganese mass) and an alpha-numeric code (e.g., A2, S7, F12, etc.), where A, F, or S each represent a texture group and the number refers to a specific indicator in that group (See USDA, NRCS 2010, Reference Card S-5, and Form S-1).
Text Box 6-5. Procedures for Evaluating Hydric Soil Indicators 1. Data describing Hydric Soil Indicators are recorded in the Hydric Soil Indicators section
of Form S-1 NWCA Soil Profile Data (Back). 2. Determine the USDA-NRCS Land Resource Region (LRR) in which the AA being
sampled is located by consulting the LRR map on Reference Card S-5 (or in the Hydric Soils Indicators Manual). The hydric soil indicators that apply to each LRR are listed on the back of Reference Card S-5 and included in parentheses next to the indicator names in the Hydric Soil Indicators section of Form S-1 NWCA Soil Profile Data (Back).
3. While examining the soil profile, use the Field Indicators of Hydric Soils in the United
States (USDA, NRCS 2010) manual and the information on texture, color, redoximorphic features (which you previously recorded for each horizon on the front side of Form S-1) to determine whether the hydric indicators specific to the LRR where the AA is located are present.
4. Evaluate the profile for all regionally appropriate Hydric Soil Indicators that fall into the
soil texture groups A (All Soils), or F (Loamy/Clayey Soils), or S (Sandy Soils) pertinent to the soil profile under examination.
5. Record the presence of any of these hydric soils indicators in the Hydric Soil Indicators
section of Form S-1 NWCA Soil Profile Data (Back) by filling in the appropriate bubbles.
6. All hydric soil indicators that are observed are assumed to occur in the soil profile
location specified in the description of that indicator in Field Indicators of Hydric Soils in the United States (USDA, NRCS 2010). If something unusual is observed, note the soil horizon number and describe the anomaly in the Hydric Indicator Comments section of Form S-1 NWCA Soil Profile Data (Back).
6-23

2011 NWCA Field Operations Manual Chapter 6. Soils
6.1.3 Soil Sample Collection
Soil samples are collected from the Representative Soil Pit after profile description down to 60cm has been completed for all four soil pits. The description of the lower soil profile may have been completed for the Representative Pit earlier (See Section 6.1.2) if the soil was easily augured to 125cm. Alternatively, if it is easier, complete the 60 to 125cm section of the soil description of the Representative Pit as the pit expanded for sample collection. Soil Sample Types Four types of soil samples are collected at the Representative Pit in the following order: 1) Isotope Samples – collected for isotope analysis of 15N from the surface layer of three
locations near the Representative Pit (Section 6.1.3.1). 2) Sediment Enzyme Samples – collected for enzyme analysis from the surface layer of three
locations near the Representative Pit (Section 6.1.3.1). 3) Bulk Density (BD) Samples – collected for determination of bulk density from each horizon
greater than 8cm thick down to 60cm (Section 6.1.3.2). 4) Chemistry /Particle Size Density Analysis (PSDA) Samples (hereafter Chemistry) –
collected for chemical, physical, and nutrient analysis from each horizon greater than 8cm thick down to 125cm (Section 6.1.3.2).
Carefully follow the protocols in Sections 6.1.3.1 and 6.1.3.2 for collection of each specific soil sample type. 6.1.3.1 Collecting Soil Samples for Isotope and Enzyme Analysis Soil isotope and soil enzyme (called sediment enzyme) samples are collected in near proximity to the Representative Soil Pit before it is expanded for collection of bulk density and chemistry samples. Collection of these two sample types is very similar, but note that three cores will be collected and placed into a quart-size plastic bag for the isotope sample while 6 cores will be collected in a gallon-size plastic bag for the soil enzyme sample. Preparing the Sample Bags 1) Fill out the Soil Isotope Sample Label (example below). It is printed as an adhesive label
with a pre-assigned Sample ID# and Site ID. Fill in all requested information and affix the label to the front of a quart-size zipper plastic bag. Place clear tape over top of the label to protect it from dirt and debris, and to ensure that it stays affixed to the sample bag.
Sample ID
Number Site ID
6-24

2011 NWCA Field Operations Manual Chapter 6. Soils
2) Fill out the Sediment Enzyme Sample Label (example below). It is printed as an adhesive
label with a pre-assigned Sample ID# and Site ID. Fill in all requested information and affix the label to the front of a gallon-size zipper plastic bag. Place clear tape over top of the label to protect it from dirt and debris, and to ensure that it stays affixed to the sample bag.
Sample ID
Number Site ID
Collecting the Isotope and Sediment Enzyme Samples 1) Collect three isotope soil cores and six sediment enzyme cores, before expanding the
Representative Soil Pit for bulk density and chemistry samples. The core sampling locations should be spaced evenly around the soil pit and positioned in undisturbed areas within a 1-m radius of where the pit will be expanded (see diagram below). The spacing of the sampling locations for the cores may be shifted so they are positioned in undisturbed areas.
2) Clear vegetation and any loose litter (e.g., fallen leaves, branches, etc.) from the surface of
the soil in the sampling area.
6-25

2011 NWCA Field Operations Manual Chapter 6. Soils
3) From each of the three locations, extract three 10-cm deep soil cores (measured from the soil surface and including the O horizon – uppermost organic soil layer, if present) using the soil syringe-corer device. Avoid sampling through thick root mats and rhizomes as this will contaminate the analysis. Minimal amounts of small roots are acceptable in the core.
Remove the plunger while taking the soil core (Figure 6-6a). Push the syringe tube into to the soil to the 10cm (60 mL) mark on the wall of the syringe
tube. The air hole should be above the soil (Figure 6-6b). While the syringe tube is still in the soil, replace the plunger in the syringe, pushing it
down just enough to cover the air hole. This will create a vacuum to aid in removing the core (Figure 6-6c).
Carefully remove the syringe tube containing the soil from the ground by gently twisting
and lifting it upwards. If necessary, use your fingers or a hand trowel to break the soil from under the core and support the core as it is lifted from the surrounding matrix (Figure 6-6d).
If this syringe device is unavailable (or if the soil is too dry for the device), a standard
stainless steel soil probe (7/8” or similar diameter, see Figure 6-2d) can be used to collect a 10 cm deep soil core.
4) Remove each core from the coring device as described below.
Extract the core after it is collected into the labeled sample bag using the plunger (Figure 6-6e) or your fingers if a soil probe is used.
If using the plunger, avoid pushing it beyond the end of the syringe-corer (Figure 6-6f).
5) Place one of the three cores collected from each location in the prepared quart-size sample bag for isotope analysis. Place two cores from each location in the prepared gallon-size sample bag for sediment enzyme analysis. When all three locations are sampled there will be three cores in the quart-size bag and six in the gallon-size bag.
6) Roll down the top of each sample bag to remove excess air. Once the air is evacuated from
the bag, seal the top by zippering it. Double check that the zipper is secure. 7) Record the Sample ID number from the Sample Label for the isotope and for the sediment
enzyme sample in the Sample ID field in the Soil Isotope/Sediment Enzymes section on the back of Form S-1. Note anything usual about the sample in the Comments field. If no sample is collected for either soil isotopes or sediment enzymes, fill in the appropriate No Sample Collected bubble, and explain the reason in the Comments field.
8) Place each sample bag in a second bag of the same size (i.e., double-bag the sample).
Press out the excess air and seal the top by zippering it. Double check that the zipper is secure.
9) Keep the samples on ice or cool while in the field or traveling (e.g., in a small ice chest). 10) Follow the protocols in Section 6.2 on sample tracking, shipping, and handling of samples.
6-26

2011 NWCA Field Operations Manual Chapter 6. Soils
a
Remove the plunger.
b
Push the syringe 10 cm into the soil. The air hole should be above the soil.
c
Replace the plunger, pushing it down just enough to cover the air hole.
d
Carefully remove the syringe, supporting the soil core as it is lifted.
e
Slowly extract the core using the plunger.
f
Avoid pushing the plunger beyond the end of the coring device.
Figure 6-6. Extracting a soil core for an isotope soil sample or sediment enzyme sample. Photos by Casey Pollock and Amanda Nahlik, USEPA.
6-27

2011 NWCA Field Operations Manual Chapter 6. Soils
6.1.3.2 Collecting Bulk Density and Chemistry Samples Soil samples for bulk density analysis and for chemistry analysis (includes chemical, physical, and nutrient analyses) are collected from the Representative Pit. To collect samples: Select techniques for excavating soils and sample collection that are suitable for the
conditions encountered at each Representative Pit (See Expanding the Representative Pit and Collecting Soil Samples and Text Box 6-6, below). Your local NRCS soil scientist may be able suggest equipment appropriate to particular locations or conditions.
Collect both the bulk density and the chemistry sample from a given horizon before moving
on to the next horizon.
Collect bulk density samples for every horizon greater than 8cm thick down to 60-cm depth. A bulk density sample is typically comprised of three individual cores of known volume for each horizon that are placed together in one sample bag.
Collect chemistry samples for every horizon greater than 8cm thick down to the125-cm depth. Chemistry samples for each horizon are comprised of 1 to 2.5 liters or quarts of soil.
Samples are generally collected for all described horizons (Form S-1 (Front)), except when horizons are less than 8cm thick as these shallow horizons are not practical to sample. The only exception to this shallow horizon rule is for Organic (O) and A horizons (at the top of the profile, Text Box 6-1). In this situation, the O and A should be combined and sampled as one layer.
As each soil sample is collected, indicate that it has been collected by filling in its type (bulk
density or chemistry) in the appropriate horizon row of the Sample Collected column under the Horizons section of the Form S-1 for the Representative Pit.
Protocols for collecting bulk density and chemistry samples are detailed in the next two subheadings: 1) Preparing Labels and Sample Collection Bags, and 2) Expanding the Representative Pit and Collecting Bulk Density and Chemistry Samples. Preparing sample tags, labels, and collection bags is initiated prior to collecting samples, but some label information is completed during sample collection. Properly sealing the sample bags continues throughout sample collection. Thus, for convenience these activities are described before the protocols for expanding the Representative Pit and collecting soil samples are presented. Preparing Labels and Sample Collection Bags Precise preparation of sample tags, labels, and bags for the Chemistry and Bulk Density samples is critical to ensuring each soil sample is connected to the horizon, the NWCA site from which it originated, and to its associated data on Form S-1 for the Representative Pit. Before beginning preparation of sample bags, make certain that you have the correct set of preprinted sample tags and labels for the NWCA Site at which you are working. As you collect samples, be sure to associate the correct preprinted tag and label with each sample. 1) The Soil Sample Tag – For each horizon and sample type, begin by completing the
preprinted adhesive sample tag (see example below) with the Sample ID Number and Horizon Number pertinent to the sample you will collect.
6-28

2011 NWCA Field Operations Manual Chapter 6. Soils
a) The preprinted Sample ID Number at the top of the sample tag has several elements:
Site ID number: In the example above = NWCA11-9999. Make sure the Site ID
matches the site you are sampling.
Visit Identifier (1 = primary sampling visit, 2 = second visit (QA revisit)): In the example, the visit number = 1. Be sure this number corresponds with the visit you are making to the site.
Information specific to each site that is automatically generated when the label is printed to aid in sample tracking, but which is not immediately relevant to sample collection: o Last two digits of calendar year when samples are collected: In example = 11. o Code for state in which site occurs: In the example = OR (Oregon). o Federal Information Processing Code (FIPS) for the county: In example = 002. o County pedon number (generated by Information Management Team based on
number of sites in a particular county): In the example = 001. o nth horizon (the horizon sampled): In the example = 1.
b) The Horizon Number is also pre-printed in the bottom row of the sample tag. Since the
sample tags are preprinted it is critical to double check that you are using the correct tag for the horizon being sampled. If a horizon that was described on Form S-1 is too thin to sample (< 8cm thick), avoid inadvertently using its preprinted tag on another sample.
c) Fill out the other sample and horizon specific information requested on the tag:
Record the Date of sampling. Indicate whether this is Visit 1 (primary sample visit) or 2 (QA revisit). Indicate the Sample Type (Chemistry/PDSA or Bulk Density) Record the Horizon Location (the depth range in which the horizon occurs (e.g., 0 -
16cm, 27 – 54cm) from Form S-1. d) Affix the completed sample tag to the outside front of an 8mil thick plastic soil sample
bag. Cover the entire label with clear tape to protect it from moisture and mud. e) Note that the adhesive sheet of sample tags for a site is printed in two columns
(Section 6.6); one for bulk density and one for chemistry samples. Horizon numbers are the same across rows (e.g., one tag for bulk density and one for the chemistry sample for the same horizon), and increment between rows from Horizon 1 to Horizon 7. If more than seven horizons are observed, use blank tags for the remaining horizons being careful to record the Sample ID# from the preprinted tags and modifying the last digit to reflect the horizon number of the sample you are labeling. For example, if you were sampling Horizon 8 for the site in the example above, the Sample ID# would be NWCA-9999-1-11-OR-002-001-8.
6-29

2011 NWCA Field Operations Manual Chapter 6. Soils
2) The Soil Sample Label (see example below) – Completely fill out the sample label (preprinted on waterproof paper) for the same sample:
a) Make sure the Sample ID# and the Horizon # on the Soil Sample Label matches those
on the Soil Sample Tag. b) Indicate whether the sample is a Chemistry/PSDA or a Bulk Density sample. c) Fill in the Date and indicate the Visit #. d) Provide the Horizon Location from Form S-1, making sure it matches the sample tag. e) For bulk density samples only: Fill in the information for calculating volume after the
soil cores or blocks have been collected (See Collecting Bulk Density and Chemistry Samples, below).
f) For chemistry samples only: If any rocks are removed from the chemistry sample
record the percent of sample volume comprised by the removed rocks. Unless very large and heavy, rocks should not be removed from the chemistry sample, and rocks should never be removed from the bulk density sample.
g) After the sample is collected, note anything unusual about the sample in the comments
section of the label. 3) Remember to ensure the Sample ID on the Bulk Density or Chemistry Soil Sample Tag
and the Bulk Density or Chemistry Soil Sample Label matches the preprinted Sample ID for the Representative Pit on Form S-1. Note that the last digit on the tags and labels is absent from Form S-1 because it reflects the horizon number from which each sample is collected.
6-30

2011 NWCA Field Operations Manual Chapter 6. Soils
4) As you collect each soil sample (see Expanding the Representative Pit and Collecting Soil
Samples, below), place it in its properly tagged 8-mil thick plastic sample bag. These bags are durable, and when correctly folded and stapled retain the field state moisture content of the sample. Consequently, it is critical to sample integrity to make sure this seal is properly executed:
a) After the bag is filled with the required amount of soil, double check that all identification
data is correct and corresponds exactly on the sample tag and on the sample label. b) Once this inspection is done, use the following procedures illustrated in Figure 6-7 to
attach the label and seal the bag:
Figure 6-7. Sealing the bulk density or chemistry soil sample bag. Photos 1-3, Teresa Magee, USEPA, stapler image courtesy of Richard Pullman, USDA-NRCS.
Heavy Duty Stapler
2) Make a second fold taking the top 2.5cm (1 inch) of the first fold and folding backwards towards the sample tag on the front of the bag.
1) Take the top 5cm (2 inches) of the sample bag and make the first fold away from side of bag on which the sample tag is affixed. Note, the sample tag displays key tracking information and must always be affixed to the front of the bag.
Note: sample label inserted between first and second folds before stapling
3) Insert the sample label tab into the second fold with the label information facing outward. Use a heavy duty stapler and staple through the fold and label. Next staple the left and right sides of the double fold. Note the bag in this illustration is thinner and somewhat smaller than the actual sample bag will be.
6-31

2011 NWCA Field Operations Manual Chapter 6. Soils
6-32
Expanding the Representative Pit and Collecting Soil Samples To collect bulk density and chemistry samples and confirm the profile description conducted earlier (Section 6.1.2), expand the Representative Pit using a shovel and/or tiling spade and an auger. The basic procedure for expanding the Representative Pit and collecting samples is described below under a) Overview, b) Collecting Bulk Density Samples, and c)Collecting Chemistry Samples. Alternative sampling techniques for difficult to sample soils are provided in Text Box 6-6.
Figure 6-2 illustrates a variety of soil excavating and sampling tools. Figure 6-8 illustrates Representative Pit excavation and summarizes sample collection. Figure 6-9 illustrates details of bulk density sample collection.
Overview of Pit Expansion and Sample Collection 1) For the top 60cm of the soil profile in which both bulk density and chemistry samples are
collected, excavate the hole to the dimensions needed (usually not more than 1m X 1m and 60cm deep) to access (Figure 6-8a, b) and view the soil (Figure 6-8c).
2) Mark horizons with golf tees, nails, or plastic/metal tabs so that you have a guide for the
depths at which to collect the samples for each horizon (Figure 6-8c). 3) To collect soil samples, begin by clearing off vegetation and loose litter from the top horizon.
Collect both the bulk density sample (typically three cores of known volume) and the chemistry sample (1 to 2.5 liters or quarts) for the top horizon before digging down to the next horizon (Figure 6-8d, e).
4) Once a horizon is sampled, excavate off the remaining material from that horizon to form a
shelf with the horizontal surface being the top of the next horizon (Figure 6-8f). 5) When the next horizon is exposed, cut out three bulk density cores for that horizon and then
collect the chemistry sample (Figure 6-8g). 6) Continue excavation until all horizons (>8cm thick) to a depth of 60cm have been exposed
and all bulk density samples collected (bulk density samples are not collected below 60cm). 7) Collect chemistry samples from horizons that occupy the 60 to 125cm depth range with an
auger, or if it is easier, by using a shovel. When using an auger: a) Take care to note the horizon boundary depths for the horizon for which you are
collecting the sample so that the soil is pulled from the correct depth. You can also confirm that the correct soil horizon has been sampled by comparing the extracted soil with the soil profile data collected earlier for this horizon.
b) For shallow horizons, it may be necessary to bore more than one auger hole to obtain enough material (1.5 to 2.5 liters) for a chemistry sample.
c) When using an auger to grab chemistry samples be careful to extract a clean sample for the horizon of interest (e.g., not contaminated by debris from other soil layers).
8) In some instances, water may seep in from the sides and fill the pit. If this happens it will be
necessary to pump water out of the pit to continue soil excavation and sample collection (See Figure 6-8f-i). In some cases, (e.g., very wet, high organic, low-strength, cemented soils, or other difficult soils) alternate excavation techniques will be needed (Text Box 6-6).
9) Keep all samples cool and out of the sun during the sampling day.

2011 NWCA Field Operations Manual Chapter 6. Soils
6-33
a b c
Figure 6‐8. Expanding the Representative Soil Pit and Collecting Soil Samples Photos by Gregg Lomnicky. 1) Expand the Representative Pit using straight vertical cuts (a) at existing pit edge and lifting out slab of soil (b). 2) Use the excavated soil to create a berm or coffer dam outside the Representative Pit (c). 3) Excavate the pit to 60cm or as deep as possible before encountering ground water (c). 4) Mark horizon boundaries on the pit wall (c) to facilitate soil sample collection, and to confirm the initial soil profile description you made for this pit. In this example, ground water was encountered at about 35cm deep so the pit was initially excavated to about 35cm (c). Three horizons are visible; Horizon 1 (0 to 10cm), Horizon 2 (10 to 20cm), Horizon 3 (20 to 29cm), and part of Horizon 4, which begins around 29cm and extends to 60cm+, can also be seen (c). 5) Collect bulk density and chemistry soil samples (see d‐h) from the exposed horizons above 60cm depth or above water level. If water is present, collect all accessible samples, then evacuate water from pit (i), excavate the next lower horizons down to 60cm, and collect soil samples (this may require alternate excavation techniques; see Text Boxes 6‐2 and 6‐6). 6) In soils that are above the water table and not completely saturated, use an auger to extract material to complete profile description and collect chemistry soil samples for each horizon from 60 to 125cm deep. If the soil is saturated in this depth range, alternate sample approaches (see Text Boxes 6‐2 and 6‐6) may allow collection of samples.
Collecting soil for bulk density and chemistry samples – Horizon 1 d e
Remove vegetation and debris from top horizon and smooth the surface of the soil at the top of the pit to expose Horizon 1 (d).
Collect the cores for the bulk density sample (d) (See Figure 6‐9 for details of bulk density sample collection).
Collect the soil for the chemistry sample (e).

At the end of the day, once all samples are collected, refill the pit.
If possible, return the soil to the pit in horizon order.
Replace and tap vegetation to top of the refilled pit (j).
Collect the cores for the bulk density sample. In (g), bulk density cores were collected on the right side of the Horizon 2 shelf (note missing soil).
Excavate any remaining Horizon 2 soil on the bench to expose Horizon 3 and collect the bulk density and chemistry samples (h).
Collect soil chemistry samples for each horizon occurring between 60 and 125cm
In some cases, (e.g., as in the very wet soils as illustrated here or other difficult soils) alternate excavation techniques will be needed (Text Box 6‐6).
After collecting the Horizon 1 samples, remove any remaining Horizon 1 soil in the sample area to form a bench exposing Horizon 2 (f).
Collecting soil for bulk density and chemistry samples – Horizon 2 to the Horizon at 60cm depth
Collect the soil for the chemistry sample for Horizon 2 (g).
Continue this process until bulk density and chemistry samples have been collected for all horizons down to 60cm.
This is typically done using an auger (not pictured).
If needed pump out water to access horizons (i).
Figure 6‐8 Continued.
2011 NWCA Field Operations Manual Chapter 6. Soils
6-34
i
f g
h
j

2011 NWCA Field Operations Manual Chapter 6. Soils
Collecting Bulk Density Samples Knowing bulk density (ratio of the mass of solids to the total or bulk volume) is critical to converting sample data from a weight to a volume basis to allow correct interpretation of chemical and nutrient levels in the soil (USDA, NRCS 2009). A known volume of uncompacted soil is necessary for determining bulk density. General protocol for bulk density sample collection at each horizon above 60cm 1) Collect three soil cores, or alternatively (if required by soil characteristics) three soil blocks
(e.g., 5cm on a side) or one larger block or cylinder of soil. 2) Place all soil cores or blocks from one horizon together in the appropriate pre-tagged
sample bag. Do not remove or discard roots or rocks from the sample. 3) As each soil core or block is collected and deposited into the sample bag, record its volume
information (volume in cm3, if known; diameter and length for cores, dimensions for blocks) on the bulk density sample label.
4) Carefully seal the sample bag and attach the sample label (see Preparing Labels and
Sample Collection Bags). 5) Once the sample is collected, fill in the bulk density bubble in the Sample Collected column
of Form S-1. 6) Make every effort to obtain the bulk density sample for each horizon. However, if soil
conditions prohibit sample collection, leave the bulk density bubble in the Samples Collected column of Form S-1 unfilled, flag the horizon, and note the reason in the Comments section.
For many wetland soils, a small can with known diameter and depth (or with a known volume) is an excellent, inexpensive tool for extracting bulk density cores (Figure 6-9). Consequently, the NWCA will employ a small can as the primary tool for bulk density sample collection. Some soils or site conditions (e.g., high organic matter soils, inundation, or severe compaction when using can corer) will require other techniques for collecting bulk density samples and several alternate methods are described in Text Box 6-6. Your local soil scientist may also be able to alert you to problem soils in your sample area, before you go in the field, and advise you on the bulk density sampling methods that will be most effective. Can core method Wherever possible (most moist to dry soils), use a small can to collect three cores for each bulk density sample at a particular horizon). A small can, such as a sliced olive can (2.25 ounces dry weight, 6 ounce liquid volume), with a 6.5-cm diameter and a 4.5-cm depth (~150 cm3 volume), makes an excellent bulk density corer for most wetland soils. Cut two or three holes with a bottle/can opener equidistantly around the rim of the can’s bottom (Figure 6-9a-c) to allow air to escape as the can is inserted into the soil and to allow you to see how full the can is during bulk density sample collection. To collect bulk density cores at each horizon: 1) Begin with the top horizon (at the ground surface). Smooth a planar horizontal area at the
top of the horizon where bulk density will be sampled (see Figure 6-8d). Choose an area that appears representative of the horizon from which to extract the sample.
2) Be careful to avoid compacting the core when inserting the can into the soil:
6-35

2011 NWCA Field Operations Manual Chapter 6. Soils
a) If the horizon is thicker than the height of the can, use the palm of your hand to gently push the can into the smoothed area until the bottom of the can is flush with the soil surface (Figure 6-9a, b).
b) If the horizon is not as thick as the can, carefully push the can into soil until the open end
of the can reaches, but does not cross, the lower boundary of the horizon. c) If you hit some resistance in pushing the can into the soil, lay a board across the bottom
of the can and tap lightly with a hammer or geology pick until the bottom of the can is flush with the ground surface or is at the lower boundary of the horizon.
3) Dig out the sampling can plus a little of the surrounding soil (Figure 6-9c, d) and, with a knife
blade, cut off the excess soil so the sample material is flush with the top of the can (Figure 6-9e). If the can is not full (e.g., because the horizon is thin), be careful not to push additional soil into the can during excavation.
4) Empty the contents of the can into the previously labeled sample bag. Collect two more cores to complete the sample for this horizon. Record volume information for each core on the sample label.
5) Repeat steps 2 through 4 for each sampleable horizon down to 60cm.
b a
Figure 6-9. Collecting a bulk density core using a small can. Photos by Gregg Lomnicky.
e d
c
6-36

2011 NWCA Field Operations Manual Chapter 6. Soils
Collecting Chemistry Samples Once you have collected the bulk density sample for a horizon, collect a chemistry sample from the same horizon. 1) Slice or otherwise extract (Figure 6-8e, g) a representative sample from boundary to
boundary of the horizon and for a lateral extent large enough to include the observed short-range variability.
2) If there are no rock fragments (larger than 2mm), then 1.0 to 1.5 liters or quarts of sample
are needed for the chemistry sample to accommodate the required lab tests. 3) If course rock fragments are present, collect a larger volume of soil. You do not need to
remove rock fragments; the lab will do that for you. However, once the rock fragments are removed, 1.0 to 1.5 liters or quarts of soil must remain. Therefore, if your soil is 50% rock you need 2 to 3 quarts of sample. If there are large rock fragments too big to be placed in the sample bag, estimate their total volume and remove them from the sample. Record the % volume of the sample comprised by the rock removed in the For Chemistry Samples Only section of the Soil Sample Label. This is critical information for calculating percent rock fragments during lab analysis.
4) Once the chemistry soil sample is obtained place it into the designated sample bag.
Carefully attach its completed label and properly seal the bag using the procedures described above under the Preparing Labels and Sample Collection Bags subheading. Fill in the chemistry bubble in the Sample Collected column of Form S-1.
5) Make every effort to obtain the chemistry sample for each horizon. However, if soil
conditions prohibit sample collection, leave the chemistry bubble in the Sample Collected column of Form S-1 unfilled, flag the horizon and note the reason in the Comment section.
Text Box 6-6. Techniques for Collecting Bulk Density and Chemistry Samples in Difficult Soils For All Alternate Techniques for Collecting Soil Samples: Carefully follow the procedures for bagging and labeling the samples described in Preparing and Labeling Sample Bags above. Ensure that both the sample tag and the sample label have been filled out completely for each sample. For bulk density samples, be sure to record the diameter and length for each core or the dimensions of subsamples with non-cylindrical shapes (e.g., cubes, rectangular blocks) on the Sample Label. If the Soil has a Water Table Present: Excavate only to just above the depth of the water table. Sample all horizons above the water table. Once the bulk density and chemistry samples are collected for horizons above the water table, begin excavation below the water table using the hand pump to pump the water out of the hole. Try to get to at least 60cm deep by excavation. Excavate to the bottom of each lower horizon and sample it before trying to get deeper. If possible, for the bulk density sample at each horizon above 60cm, carve out cubes of known dimension (e.g., 5cm on a side) and place the block(s) in the sample bag. Remember to collect a chemistry sample for each horizon above 60cm as you are collecting the bulk density samples. Once you get to 60cm, collect chemistry samples for the area from 60 to 125cm deep with a bucket auger, taking care to get a clean chemistry sample of each horizon. Drier Soils (Hammered Corer): Hammered soil core samplers consist of a slide and a drop hammer that is attached to a solid coring device about 5cm in diameter and of varying lengths (Figure 6-2). Hammered corers are efficient for extracting bulk density samples in many soil conditions (excluding gravelly, loose organic, soupy, or sandy soils); but this tool is heavy, so not ideal for routinely carrying into the field over long distances. However, when soils are too dry for retrieving bulk density cores with a can, a hammered corer (if available) may work well. You will need to ensure that the soil cores extracted using
6-37

2011 NWCA Field Operations Manual Chapter 6. Soils
Text Box 6-6. Techniques for Collecting Bulk Density and Chemistry Samples in Difficult Soils the hammered corer are not severely compacted. Check for compaction by comparing the length of the soil core in the hammered corer with the depth of the void left by its removal. If the core length is more than 10% less than the void length, another sampling approach should be selected. When using a hammered corer, be sure to carefully follow the instructions for its operation. Organic Soils: If the water table is below the surface, obtain the soil samples for the non-inundated upper layers from the side of the pit. If the hydraulic conductivity is slow enough, dig and remove samples below the water table as far as practical and place on a plastic sheet or sled in an orderly fashion (i.e., in the in situ order from the surface) for describing and processing. If samples can be removed for bulk density in the normal manner, do so. You can also carve out cubes of known dimension (e.g., 5cm on a side) and place them in the bulk density sample bag. Note the sample dimensions on the Sample Label. Collect samples from below the water table with a Macaulay peat sampler or using the King soil extractor technique (see below). Place the sample for each horizon in its designated sample bag, knead the bag to remove air, fold top, insert label in fold and staple. Place this sealed bag into another sample bag, getting all the air out to limit oxidation, and staple this bag as well. Sulfidic Soil Materials (Tidal Marsh): Follow this protocol whenever sampling tidal marsh soils and any other soils known to contain sulfides (rotten egg odor usually present). Excavate using the normal technique or one of the modified techniques for sampling saturated soils. Bulk density can be done in the typical manner for the technique used. For chemistry samples, place samples in sample bags and knead the bag so that all air is eliminated when the bag is secured. Fold top, staple, and label. Place in another bag, getting all the air out, minimizing head space, and stapling this bag as well. It is important to avoid exposure to air keep the soil from oxidizing or the pH of the soil will change drastically. Adding some ambient soil water to the sample can limit oxidation. Keep containers in a dark and cool place. Indicate in the comments section of the Soil Sample Label that the sample may contain sulfides so that once it reaches the lab it can be stored correctly and processed as quickly as possible. Tube Extractor Method (King soil extractor, see Figure 6-2): When using the King soil extractor to obtain bulk density samples, use a sharp knife to slice through the bottom of the horizon being sampled and then cut bulk density samples out of the middle of the horizon. You may need to use two or three extractor tubes of sample to obtain enough soil for each horizon to get enough material for bulk density and chemistry samples. Once the bulk density samples are obtained put the rest of the soil material for that horizon into the chemistry sample bag. 6.1.4 Water Depth in Pit after Equilibration After all AB Team sampling tasks are completed and prior to filling in the soil pit holes, collect water depth data at each soil pit and record the data in the appropriate field of the Soil Pit Water Depth section of Form S-1: NWCA Soil Profile Data (Back). 1) If the area in the vicinity of the soil pit is inundated and surface water is present, record
water depth in centimeters in the Surface Water field as a positive number. If no surface water is present, fill in the bubble in the Absent column.
2) If there is water in the soil pit, measure the depth in centimeters from the ground surface
down to the top of the water level and record this depth as a negative number in the Water Level in Pit field. If no water is present in the pit, fill in the bubble in the Absent column.
3) Note whether the soil is saturated at a depth above any standing water in the pit or
anywhere in the pit if there is no standing water. Record the depth from the ground to the point at which saturation occurs as negative number in the Saturation field. Saturated soil is indicated by:
6-38

2011 NWCA Field Operations Manual Chapter 6. Soils
a) Water seeping from the pit walls above the water level (e.g., general seepage, or along ped faces or from macropores).
b) Pit surfaces with a sheen of moisture or which appear to be glistening.
If no evidence of saturation is present, fill in the bubble in the Absent column of this field.
4) Record the time (24 hour clock) that the water level observation was made in the Time field of the Soil Pit Water Depth section of the form.
6.1.5 Backfilling the Soil Pits Soils pits can be backfilled once the water depth data has been collected. Before backfilling a soil pit, check to be certain all samples and profile data have been collected and all information has been recorded on the data forms. 1) If the soil pit is the Representative Pit, for each horizon greater than 8cm thick, double check
that the bulk density samples (in horizons ≤ 60cm deep) and chemistry samples (in horizons to 125cm deep) that have been collected are recorded in the Sample Collected column under the Horizons section of the Form S-1 for the Representative Pit.
2) Remember to record the Final Pit Depth for the Representative Pit in the Representative Pit
section of Form S-1. 3) Return the excavated soil into the pit. 4) Once the pit is filled, replace the vegetation cap that was removed and set aside at the
beginning of Soil Pit excavation. 5) Tamp the vegetation cap down into the soil to give it a chance to re-root and enhance its
likelihood of surviva (Figure 6-8j). 6.1.6 Soil Tool Decontamination and Maintenance 1) Clean soil sampling tools as thoroughly as possible at the end of every sample day while still
on-site to remove excess soil and any alien species propagules. See Chapter 2 for details of procedures for preventing inadvertent transport of taxa from the site.
2) Once back at lodgings or other convenient location, carefully and thoroughly clean all soils
equipment and keep all threads for connecting joints well-oiled or lubricated. This is imperative to keep tools in good working order.
3) Note: If tools are exposed to contaminants such as oil, use the appropriate state approved
safety protocols for cleaning them (See Appendix E for an example protocol).
6-39

2011 NWCA Field Operations Manual Chapter 6. Soils
6.2 SAMPLE AND DATA HANDLING There are two components to soil sample handling. One is completed before leaving the site; the other, at the field lodging or office. 6.2.1 At the Site 1) During the sampling day, keep all soil samples as cool as possible
a) Keep bulk density and chemistry samples out of direct sun and, if possible, in the shade. b) Keep the soil isotope and sediment enzyme samples on ice and out of the direct sun and
in the shade whenever possible. 2) At the end of the sample day, double check that all samples (isotope, sediment enzyme,
bulk density, and chemistry) have been collected and that label and tag information is accurate and legible.
3) Ensure all identification information for each isotope, sediment enzyme, bulk density, and
chemistry sample corresponds exactly on all Sample Tags, Sample Labels, and Form S-1 for the Representative Pit.
4) Complete Form T-1: NWCA 2011 Site and Sample Status and Tracking.
a) In the Sample Status section of Form T-1, indicate the soil isotope (SISO), the sediment enzyme (SEDE), and the soil chemistry and bulk density samples (SCBD) have been collected for the site.
b) Record the sample id numbers for the soil isotope and sediment enzyme samples on
Form T-1 in the WRS Sample Tracking section. Make sure that the information on the Isotope Soil Sample Label and the Sediment Enzyme Sample Label on the sample bags and Form T-1 correspond exactly.
6.2.2 At Field Lodging or Office See Chapter 2 for an overview of sample shipping and Appendix A for detailed protocols on packing, tracking, and shipping soil samples and for shipping addresses. Isotope and Sediment Enzyme Soil Samples The isotope and sediment enzyme samples for each AA will be sent to the USEPA Lab in Corvallis, Oregon, within 24 hours of collection in an ice chest with the other immediately shipped samples. These samples are water chemistry, water chemistry duplicate (when taken), algal toxins, and chlorophyll-a. The protocol below covers the details of shipping that pertain to the isotope and sediment samples. See Chapter 2 for information that pertains to all of the immediately shipped samples. See Appendix A for detailed protocols on packing, tracking, and shipping samples and for shipping addresses. 1) Confirm that the label affixed to each sample has the correct Site ID, is complete, and is
covered with clear tape. 2) Ensure that any air has been removed from the sample bag and that it is completely sealed.
6-40

2011 NWCA Field Operations Manual Chapter 6. Soils
3) Place each individual isotope and sediment sample bag in another, separate, gallon-sized self-sealing plastic bag, making sure the gallon bag is sealed to protect the sample from moisture in the ice-chest.
4) Affix the APHIS Regulated Soils permit on the outside of the ice-chest for immediately
shipped samples. Be certain you use the Regulated Soils Permit for isotope and sediment enzyme soil samples, i.e., the permit for samples sent to the USEPA Lab in Corvallis, Oregon.
5) Go to Chapter 2 and complete the protocols on packing and shipping the samples to be
immediately shipped. Soil Bulk Density and Chemistry Samples The bulk density and chemistry samples will be sent to the UDSA-NRCS Lab in Lincoln, Nebraska. These soil samples may be stored and shipped in batches every two weeks. 1) For each sample, confirm the Sample Tag with the Sample ID is completed, legible, and
affixed to the front of the sample bag and covered with clear plastic tape. 2) For each sample, confirm the Sample Label is complete and legible, the sample bag has
been sealed and the Sample Label is stapled in the fold sealing the bag (see Figure 6-7) 3) Record tracking information (sample id and collection date) for the Bulk Density and
Chemistry Samples on Form T-4: NWCA Chemistry and Bulk Density Soil Sample Tracking.
4) Ensure all identification information and tracking data for each sample corresponds exactly
on the Sample Tag affixed to the bag, on the Sample Label stapled to the bag, and on Form T-4.
5) Pack soil samples, organizing them by site, neatly in a shipping carton. 6) Make two copies of the completed Form T-4. Retain one for your records, transmit the
original to the Information Management Team, and place one inside a self-sealing plastic bag and place in on top of the soil samples in the shipping box. See Chapter 2 for details of copying forms and transmitting them to the Information Management Team.
7) An APHIS Regulated Soils permit must be displayed on the shipping package containing the
bulk density and chemistry soil samples. Ensure that you have the Regulated Soils Permit for soil samples sent to the USDA-NRCS Lab in Lincoln, Nebraska and that it is affixed to the outside of the package.
8) Fill out the shipping label (See Appendix A and Form T-4 for the shipping address). 9) Once you are certain that all samples and completed tracking forms are included in the
shipping box, carefully seal the package, affix shipping label. 10) Deliver the package of soil samples to the shipping company and retain all receipts and
records of shipping.
6-41

2011 NWCA Field Operations Manual Chapter 6. Soils
6.2.4 Soil Data Forms, Tracking Forms, and Shipping Records After reviewing the soil data forms for completeness order them sequentially and place them in the Data Packet for the AA. See Chapter 2 for protocols on copying and shipping completed soils data and tracking forms to the Information Management Team. See Appendix D for information on transmitting the image files of the soil profile photos. 6.3 LITERATURE CITED Mitsch, W.J. and J.G. Gosselink. 2007. Wetlands. John Wiley & Sons, Hoboken, NJ. Munsell Color X-Rite. 2009 . Munsell Soil Color Charts. Munsell Color Corporation. Grand Rapids, MI. Schoeneberger, P.J., D.A. Wysocki, E.C. Benham, and W.D. Broderson. 2002. Field Book for Describing and Sampling Soils, Version 2.0. Natural Resources Conservation Service, National Soil Survey Center, Lincoln, Nebraska, USA. ftp://ftp-fc.sc.egov.usda.gov/NSSC/Field_Book/FieldBookVer2.pdf Thien, S.J. 1979. A flow diagram for teaching texture by feel analysis. Journal of Agronomic Education. 8:54-55. Tiner, R.W. 1999. Wetland Indicators: A Guide to Wetland Identification, Delineation, Classification, and Mapping. Lewis Publishers, Boca Raton, FL. USDA, NRCS (U.S. Department of Agriculture, Natural Resources Conservation Service). 2009. Soil Survey Manual. Chapter 3. Soil Survey Division Staff. U.S. Department of Agriculture Handbook 18. Updated electronically and available at: http://soils.usda.gov/technical/manual/, verified 26 Feb. 2010. USDA, NRCS (U.S. Department of Agriculture, Natural Resources Conservation Service). 2010. Field Indicators of Hydric Soils in the United States, Version 7.0. L.M. Vasilas, G.W. Hurt, and C.V. Noble (eds.). United States Department of Agriculture, Natural Resources Conservation Service, in cooperation with the National Technical Committee for Hydric Soils. (http://soils.usda.gov/use/hydric/ or ftp://ftp-fc.sc.egov.usda.gov/NSSC/Hydric_Soils/FieldIndicators_v7.pdf) USEPA (U.S. Environmental Protection Agency). In Preparation. Ecological Indicators for the 2011 National Wetland Condition Assessment. EPA-XXX-YY-0000. U.S. Environmental Protection Agency, Washington, DC. Vepraskas, M.J. 1995 (revised). Redoximorphic Features for Identifying Aquic Conditions. Techical Bulletin 301, North Carolina State University, Raleigh, NC.
6-42

2011 NWCA Field Operations Manual Chapter 6. Soils
6.4 SUPPLEMENTARY MATERIAL 6.4.1 List of Soil Resources to be Carried in Vehicle
Munsell Color X-Rite. 2009. Munsell Soil Color Charts. Grand Rapids, MI. United States Department of Agriculture, Natural Resources Conservation Service. 2010. Field Indicators of Hydric Soils in the United States, Version 7.0. L.M. Vasilas, G.W. Hurt, and C.V. Noble (eds.). USDA, NRCS, in cooperation with the National Technical Committee for Hydric Soils. Schoeneberger, P.J., D.A. Wysocki, E.C. Benham, and W.D. Broderson. 2002. Field Book for Describing and Sampling Soils, Version 2.0. Natural Resources Conservation Service, National Soil Survey Center, Lincoln, Nebraska, USA. 6.4.2 Other Useful Soil Resources United States Department of Agriculture, Natural Resources Conservation Service Website: http://soils.usda.gov/ USACE (United States Army Corps of Engineers). 2009. Regional Supplements to Corps Delineation Manual. Website: http://www.usace.army.mil/cecw/pages/reg_supp.aspx Any additional references recommended by your regional soil scientist. 6.4.3 Glossary of Soil Terminology Color Components:
Hue - The quality that distinguishes one color from another. Five principle colors: red, yellow, green, blue, and purple and 5 intermediate colors. Hue is generally found in the upper right hand corner of the Munsell Soil Color Book pages. Value - The quality that distinguishes a light color from a dark one. This refers to the grey level of the color and ranges from white to black. Value decreases as you go down a column on the Munsell Soil Color Book pages. Chroma -The quality that distinguishes the difference from a pure hue to a gray shade. Chroma generally runs from left to right on the Munsell Color Book pages with grayer colors as you go to the left.
Hydric Soils - Soils formed under conditions of saturation, flooding, or ponding long enough during the growing season to develop anaerobic conditions in the upper part. Matrix- The dominant soil volume that is continuous in appearance and may envelope other features. When three colors occur, such as when a matrix, depletions, and concentrations are present, the matrix may represent less than 50 percent of the total. Mottle – Splotch of color in the soil matrix. Muck - Sapric organic soil material in which virtually all of the organic material is so decomposed that identification of plant forms is not possible.
6-43

2011 NWCA Field Operations Manual Chapter 6. Soils
Nodules and Concretion – Nodules are cemented bodies (commonly spherical or tubular) that can be removed as discrete units from the soil, but which do not have discernible crystalline structure when viewed with a 10X hand lens. Concretions are similar to nodules, but have concentric layers of material around a point. Organic Bodies – Typically occur at the tips of roots and are commonly 1 to 3cm in diameter with muck or mucky modified textures. Other Organic Features – Include stripped zones and organic infilling. Ped - A single unit of soil structure. Soil Horizon - A layer, approximately parallel to the surface of the soil, distinguishable from adjacent layers by distinctive properties produced by soil-forming processes.
O Horizon – Organic horizon consisting of high accumulations of organic carbon (if you feel more than a couple of mineral grains (grit from sand, stickiness from clay, silt deposits on hands) it is most likely a mineral horizon high in organic matter (OM) not an organic soil).
A Horizon – Mineral horizon formed at the surface from significant organic carbon accumulation (will be darker in color than the horizons below due to OM accumulation).
E Horizon – Mineral horizon that exhibits significant loss of organic carbon, Fe (Iron), Mn (Manganese), Al (Aluminum), and/or clays (usually paler in color and lighter in texture (less clayey) than horizons below).
B Horizon –Mineral horizon with accumulations of Fe, Mn, secondary minerals, Al-organic
compounds, and/or clay, or development of soil structure (can be higher in clay, may be brighter in color, or may contain more redoximorphic (redox) concentrations than the horizons above it).
C Horizon – Mineral soil little affected by soil genesis, or soft bedrock or former bedrock. Lacking properties of O, A, E, and B horizons (lacks structure, may appear to look like parent material (hard bedrock) but breaks into mineral grains and gravel upon excavation).
L Horizon – Organic and inorganic limnic materials deposited in water by precipitation or derived from underwater and floating aquatic plants and aquatic animals (lacks structure, may appear to look like parent material (hard bedrock) but breaks into mineral grains and gravel upon excavation).
R Horizon – Strongly cemented bedrock horizon.
W Horizon – A layer of water found under floating but fixed vegetation.
Soil Profile – Vertical arrangement of layers of soil down to the bedrock or zone absent of weathering. Soil Texture - The relative proportions, by weight, of sand, silt, and clay particles in the soil material less than 2mm in size. Stripped Zones – Areas where iron-manganese oxides and/or organic matter have been stripped from the matrix and the primary base color of the soil material is exposed. The stripped
6-44

2011 NWCA Field Operations Manual Chapter 6. Soils
areas and translocated oxides and organic matter form a contrasting pattern of two or more colors with diffuse boundaries. Redoximoprhic (Redox) Features - Features formed by the processes of reduction, translocation, and/or oxidation of Fe and Mn oxides; formerly called mottles and low-chroma colors. Redox features include uncemented concentrations and depletions (losses) of these elements, and are observed in pore linings, ped faces, or the soil matrix as soft masses and colors that contrast with soil matrix color (USDA, NRCS 2010). A soft mass is a splotch in the soil and a pore lining would have iron or other elements coating the larger voids (i.e., root channels, cracks between peds). Redox Concentrations - Bodies of apparent accumulation of Fe-Mn oxides. Redox concentrations include soft masses, pore linings, nodules, and concretions. They appear as reddish, yellowish, or black splotches in the soil. For the purposes of hydric indicators, nodules and concretions (hard, brittle concentrations) are excluded from the concept of redox concentrations unless otherwise specified by specific indicators. Most hydric indicators require distinct or prominent concentrations, therefore faint concentrations do not reflect a hydric indicator. Redox Depletions - Bodies of low chroma (2 or less) having value of 4 or more where Fe-Mn oxides have been stripped or where both Fe-Mn oxides and clay have been stripped. Redox depletions are gray splotches or zones that, for most hydric indicators, must contrast distinctly or prominently with the matrix to count. Depletions can occur in the matrix or on pore linings and ped faces.
6-45

2011 NWCA Field Operations Manual Chapter 6. Soils
6-46

2011 NWCA Field Operations Manual Chapter 6. Soils
6.5 REFERENCE CARDS
Reference Card S-1, Sides A and B. Soil Protocol Flowchart Reference Card S-2, Side A. Soil Pit Placement, Characteristics of Soil Horizon Types Reference Card S-2, Side B. Distinguishing Soil Horizons Reference Card S-3, Side A. Soil Structure, Coats and Films, and Guidelines for Cover Estimation Reference Card S-3, Side B. Examples of Some Redox and Other Soil Features Reference Card S-4, Side A. Determining Soil Texture Reference Card S-4, Side B. Soil Color Determinations Reference Card S-5, Side A. USDA Land Resource Regions (LLRs) Reference Card S-5, Side B. Hydric Soil Indicators by Land Resource Region, Evaluating Hydric Soil Indicators
6-47

2011 NWCA Field Operations Manual Chapter 6. Soils
6-48

Reference Card S-1, Side A. NWCA Soil Protocol Flowchart
NO
Photograph the Soil Profile (Appendix D) either after horizon delineation or after the profile description is completed, as convenient.
1) Place a lettered flag (A, B, C, or D) at the Soil Pit location to identify it. 2) Excavate one Soil Pit to 60cm deep and extract a slab for soil profile using appropriate tools and methods for soil
conditions. Record pit depth, time of excavation, and lighting conditions on Form S-1. If an impenetrable layer prevents excavation and pit cannot be moved, record pit depth and type of impenetrable layer
on Form S-1. 3) Collect all soil profile data (see below) in this pit, then dig the next Soil Pit to 60cm and describe its soil profile. 4) Repeat until all four pits have been excavated and described to 60cm. Choose the Representative Pit. 5) Do not refill any pit until all pits have been examined, all samples have been collected from the Representative Pit, and water
depth data have been collected in all four pits.
Are standing water or obstacles present at the standard Soil Pit Location?
If water or mud ≥ 0.25m deep or other obstacle (e.g., TES species, large rock, tree, woody debris) is present, move pit to an alternate location as close to SE corner of Veg Plot as possible. Record pit location on Form S-1.
NO
If water and soft sediment < 0.25m deep, locate soil pit just outside SE corner of Veg Plot. Record pit location on Form S-1.
Place Soil Pit just outside SE corner of designated Veg Plot. Record pit location on Form S-1.
YES
Identify standard locations for Soil Pits (i.e., outside the SE corner of designated Veg Plot).
A. Soil Pit Location and Excavation to 60cm (See Section 6.1.1)
B. Soil Profile Description at Each Soil Pit (See Section 6.1.2) YES Does soil have an inundated or saturated layer?
Randomly select one Representative Soil Pit from the subset of pits that most represent the soils conditions of the AA.
Delineate soil horizons and for each horizon observed at each Soil Pit, determine and record on Form S-1 (Front): 1) Horizon depth 2) Horizon boundary abruptness 3) Soil texture 4) % Rock fragments 5) % Roots 6) Soil matrix color 7) Presence and type of
redoximorphic or other features 8) % Horizon composed of distinct
or prominent redox and other features
9) Color of most evident redox or other feature
Immediately upon excavation, record initial soil matrix color and determine whether H2S odor (rotten egg) is detected (Form S-1).
Determine presence of Hydric Soil Indicators in the Soil Profile: 1) Use Reference Card S-5 to determine the Land Resource
Region (LRR) in which the AA occurs. 2) Evaluate the soil for the presence of Hydric Soil Indicators for the
selected LRR and record on Form S-1 (Back).
Excavate soil, using an auger, to 125cm from the Representative Pit, or if easier dig
pit to125 cm, and describe the soil profile from 60cm down to 125 cm. Complete photography of the soil profile for this pit.
Continue to Soil Sample Collection flowchart (Reference Card S-1, Side B). Refer to NWCA-Field Operations Manual (Chapter 6. Soils) for more detail on the information summarized on this card.
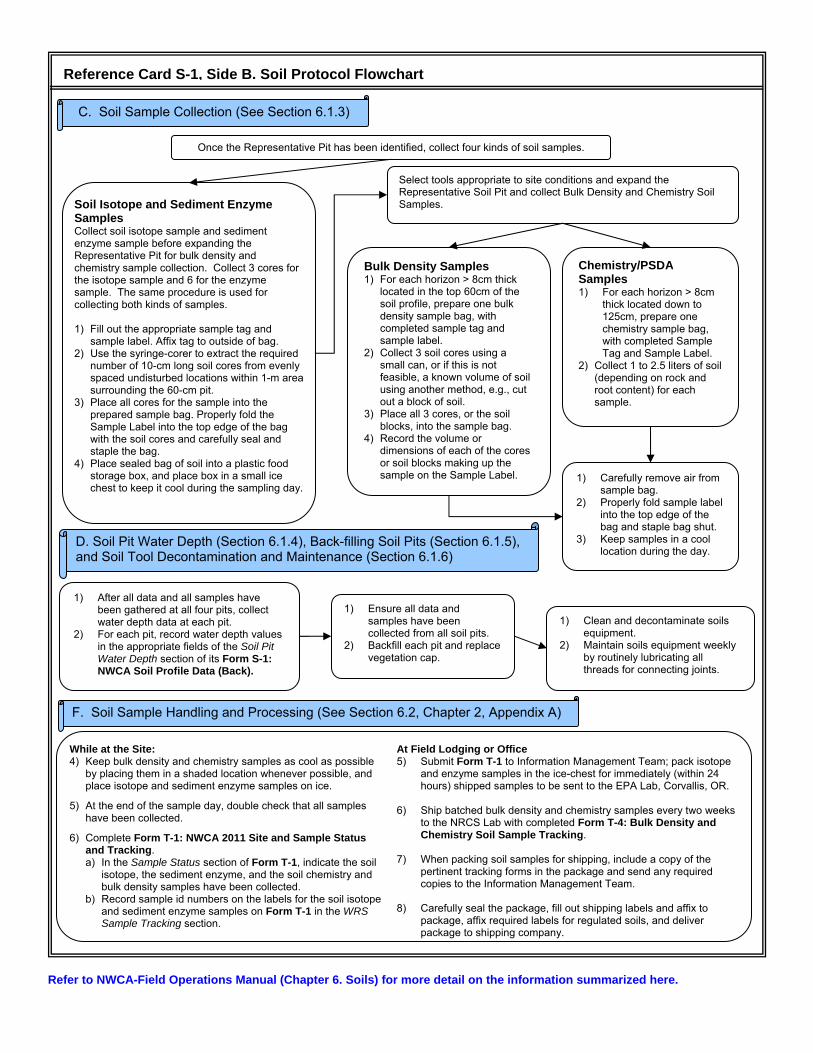
Reference Card S-1, Side B. Soil Protocol Flowchart
Refer to NWCA-Field Operations Manual (Chapter 6. Soils) for more detail on the information summarized here.
Soil Isotope and Sediment Enzyme Samples Collect soil isotope sample and sediment enzyme sample before expanding the Representative Pit for bulk density and chemistry sample collection. Collect 3 cores for the isotope sample and 6 for the enzyme sample. The same procedure is used for collecting both kinds of samples. 1) Fill out the appropriate sample tag and
sample label. Affix tag to outside of bag. 2) Use the syringe-corer to extract the required
number of 10-cm long soil cores from evenly spaced undisturbed locations within 1-m area surrounding the 60-cm pit.
3) Place all cores for the sample into the prepared sample bag. Properly fold the Sample Label into the top edge of the bag with the soil cores and carefully seal and staple the bag.
4) Place sealed bag of soil into a plastic food storage box, and place box in a small ice chest to keep it cool during the sampling day.
C. Soil Sample Collection (See Section 6.1.3)
Once the Representative Pit has been identified, collect four kinds of soil samples.
Select tools appropriate to site conditions and expand the Representative Soil Pit and collect Bulk Density and Chemistry Soil Samples.
Chemistry/PSDASamples
Bulk Density Samples1) For each horizon > 8cm thick
located in the top 60cm of the soil profile, prepare one bulk density sample bag, with completed sample tag and sample label.
1) For each horizon > 8cm thick located down to 125cm, prepare one chemistry sample bag, with completed Sample Tag and Sample Label. 2) Collect 3 soil cores using a
small can, or if this is not feasible, a known volume of soil using another method, e.g., cut out a block of soil.
2) Collect 1 to 2.5 liters of soil (depending on rock and root content) for each sample.
3) Place all 3 cores, or the soil blocks, into the sample bag.
4) Record the volume or dimensions of each of the cores or soil blocks making up the sample on the Sample Label. 1) Carefully remove air from
sample bag. 2) Properly fold sample label
into the top edge of the bag and staple bag shut.
F. Soil Sample Handling and Processing (See Section 6.2, Chapter 2, Appendix A)
1) After all data and all samples have been gathered at all four pits, collect water depth data at each pit.
2) For each pit, record water depth values in the appropriate fields of the Soil Pit Water Depth section of its Form S-1: NWCA Soil Profile Data (Back).
1) Ensure all data and samples have been collected from all soil pits.
2) Backfill each pit and replace vegetation cap.
D. Soil Pit Water Depth (Section 6.1.4), Back-filling Soil Pits (Section 6.1.5), and Soil Tool Decontamination and Maintenance (Section 6.1.6)
3) Keep samples in a cool location during the day.
1) Clean and decontaminate soils equipment.
2) Maintain soils equipment weekly by routinely lubricating all threads for connecting joints.
While at the Site: At Field Lodging or Office 5) Submit Form T-1 to Information Management Team; pack isotope
and enzyme samples in the ice-chest for immediately (within 24 hours) shipped samples to be sent to the EPA Lab, Corvallis, OR.
4) Keep bulk density and chemistry samples as cool as possible by placing them in a shaded location whenever possible, and place isotope and sediment enzyme samples on ice.
5) At the end of the sample day, double check that all samples have been collected.
6) Ship batched bulk density and chemistry samples every two weeks to the NRCS Lab with completed Form T-4: Bulk Density and Chemistry Soil Sample Tracking.
6) Complete Form T-1: NWCA 2011 Site and Sample Status and Tracking.
7) When packing soil samples for shipping, include a copy of the pertinent tracking forms in the package and send any required copies to the Information Management Team.
a) In the Sample Status section of Form T-1, indicate the soil isotope, the sediment enzyme, and the soil chemistry and bulk density samples have been collected.
b) Record sample id numbers on the labels for the soil isotope and sediment enzyme samples on Form T-1 in the WRS Sample Tracking section.
8) Carefully seal the package, fill out shipping labels and affix to package, affix required labels for regulated soils, and deliver package to shipping company.
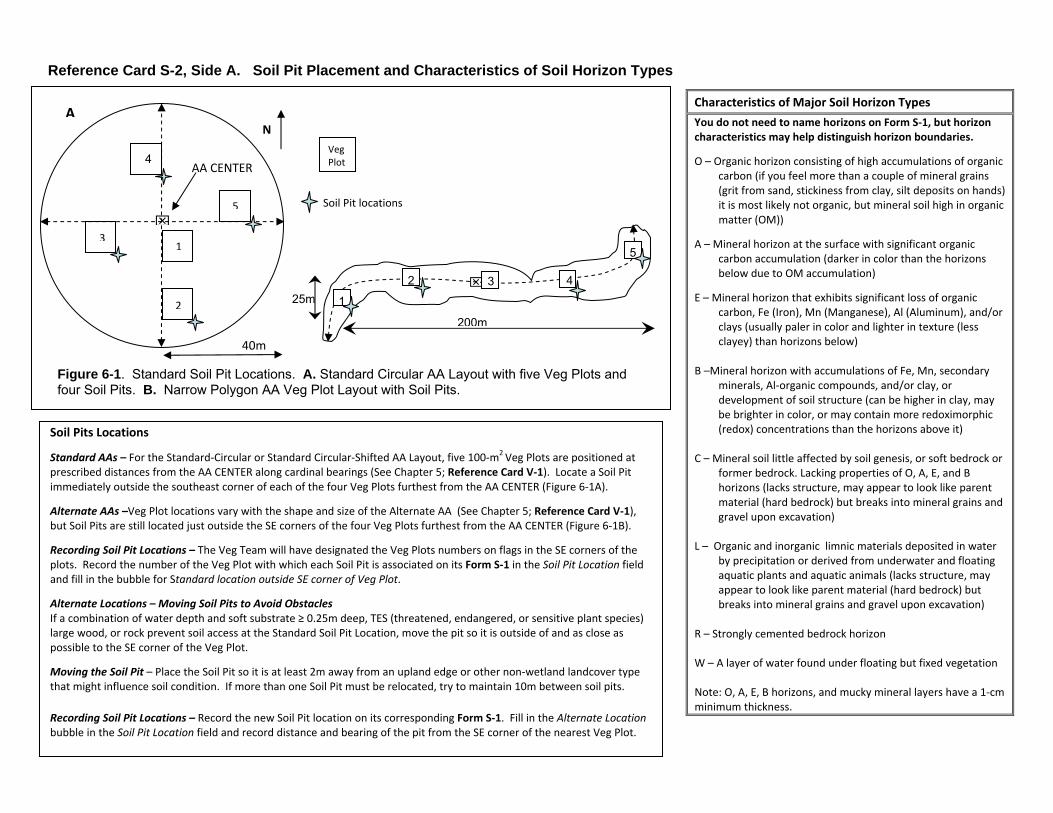
Reference Card S-2, Side A. Soil Pit Placement and Characteristics of Soil Horizon Types
Characteristics of Major Soil Horizon Types
You do not need to name horizons on Form S‐1, but horizon characteristics may help distinguish horizon boundaries.
O – Organic horizon consisting of high accumulations of organic carbon (if you feel more than a couple of mineral grains (grit from sand, stickiness from clay, silt deposits on hands) it is most likely not organic, but mineral soil high in organic matter (OM))
A – Mineral horizon at the surface with significant organic carbon accumulation (darker in color than the horizons below due to OM accumulation)
E – Mineral horizon that exhibits significant loss of organic carbon, Fe (Iron), Mn (Manganese), Al (Aluminum), and/or clays (usually paler in color and lighter in texture (less clayey) than horizons below)
B –Mineral horizon with accumulations of Fe, Mn, secondary
minerals, Al‐organic compounds, and/or clay, or development of soil structure (can be higher in clay, may be brighter in color, or may contain more redoximorphic (redox) concentrations than the horizons above it)
C – Mineral soil little affected by soil genesis, or soft bedrock or
former bedrock. Lacking properties of O, A, E, and B horizons (lacks structure, may appear to look like parent material (hard bedrock) but breaks into mineral grains and gravel upon excavation)
L – Organic and inorganic limnic materials deposited in water
by precipitation or derived from underwater and floating aquatic plants and aquatic animals (lacks structure, may appear to look like parent material (hard bedrock) but breaks into mineral grains and gravel upon excavation)
R – Strongly cemented bedrock horizon W – A layer of water found under floating but fixed vegetation Note: O, A, E, B horizons, and mucky mineral layers have a 1‐cm minimum thickness.
Soil Pits Locations
Standard AAs – For the Standard‐Circular or Standard Circular‐Shifted AA Layout, five 100‐m2 Veg Plots are positioned at prescribed distances from the AA CENTER along cardinal bearings (See Chapter 5; Reference Card V‐1). Locate a Soil Pit immediately outside the southeast corner of each of the four Veg Plots furthest from the AA CENTER (Figure 6‐1A).
Alternate AAs –Veg Plot locations vary with the shape and size of the Alternate AA (See Chapter 5; Reference Card V‐1), but Soil Pits are still located just outside the SE corners of the four Veg Plots furthest from the AA CENTER (Figure 6‐1B).
Recording Soil Pit Locations – The Veg Team will have designated the Veg Plots numbers on flags in the SE corners of the plots. Record the number of the Veg Plot with which each Soil Pit is associated on its Form S‐1 in the Soil Pit Location field and fill in the bubble for Standard location outside SE corner of Veg Plot.
Alternate Locations – Moving Soil Pits to Avoid Obstacles If a combination of water depth and soft substrate ≥ 0.25m deep, TES (threatened, endangered, or sensitive plant species) large wood, or rock prevent soil access at the Standard Soil Pit Location, move the pit so it is outside of and as close as possible to the SE corner of the Veg Plot.
Moving the Soil Pit – Place the Soil Pit so it is at least 2m away from an upland edge or other non‐wetland landcover type that might influence soil condition. If more than one Soil Pit must be relocated, try to maintain 10m between soil pits.
Recording Soil Pit Locations – Record the new Soil Pit location on its corresponding Form S‐1. Fill in the Alternate Location bubble in the Soil Pit Location field and record distance and bearing of the pit from the SE corner of the nearest Veg Plot.
Figure 6-1. Standard Soil Pit Locations. A. Standard Circular AA Layout with five Veg Plots and four Soil Pits. B. Narrow Polygon AA Veg Plot Layout with Soil Pits.
4 AA CENTER
N A
3
2
1
Veg Plot
Soil Pit locations 5
5
2 4325m 1
200m
40m

Reference Card S-2, Side B. Distinguishing Soil Horizons.
4
5
Ground Surface
60 cm
Soil Pit Bottom
23 1
Distinguishing Soil Horizons. Left top: Soil slab diagram with horizons marked. Left bottom: Soil slab photo (Eric Vance, EPA). Right : Example soil profiles illustrating horizons distinguished by different colors, structure, or texture. Profile photos from USDA, NRCS (2010).
Soil Horizons are delineated based on differences in:
Soil structure (e.g., Reference Card S‐3 Side A, Plate 1, see also Schoeneberger et al. 2002).
Texture (see Reference Card S‐4 Side A).
Soil color based on Munsell Soil Color Charts (2009) (see Reference Card S‐4 Side B).
Presence and type of redoximorphic other features (See Reference Card S‐3 Side A and B).
Place marker (e.g., golf tee) at bottom of
each horizon. Number horizons in order from the top of the profile (e.g., see figure at left).
Measure depth from the top of the soil
profile to the bottom of each horizon in centimeters (a metric fiberglass seamstress tape works well).
For the Soil Pit under consideration,
record the depth to the lower boundary of each horizon in the Depth to Lower Boundary of Horizon column of Form S‐1 (Front).
If the lower boundary of a horizon is less
than 2cm thick, fill in the abrupt boundary bubble in the Horizons section of Form S‐1 (Front).
Refer to NWCA-Field Operations Manual (Chapter 6. Soils) for more detail on the reference information summarized on this card.

Reference Card S-3, Side A. Soil Structure, Coats and Films, Guidelines for Cover Estimation.
Plate 1. Examples of Soil Structure Types. Plate 2. Coats and Films on Peds. Formed by translocation and deposition (e.g., clay films (argillans), clay bridging, manganese (black), iron (orange or red) dark organic stains, masked sand grains, etc.).
35% 75%
Plate 3. Examples of Surface Area Estimation for Soil Features. Percent surface area of soil matrix occupied by other components, (e.g., rocks, roots, redox and other features with contrasting colors).
Refer to NWCA-Field Operations Manual (Chapter 6. Soils) for more detail on the reference information summarized on this card. Graphics from (or adapted from) Schoeneberger, P.J., D.A. Wysocki, E.C. Benham, and W. D. Broderson. 2002. Field Book for Describing and Sampling Soils, Version 2.0. Natural Resources Conservation Service, National Soil Survey Center, Lincoln, Nebraska, USA.

Reference Card S-3, Side B. Examples of Some Redox and Other Soil Features
Legend A – Iron redox concentrations as pore linings B – Iron redox concentrations as pore linings C – Depletions as pore linings D – Redox concentrations in sandy soil E – Pore linings and soft masses F – Redox concentration as soft masses G – Stripped zones in sandy soil H – Organic bodies Photos by Lenore Vasilas, NRCS and Gregg Lomnicky, Dynamac
A
G H
B C
D E
F
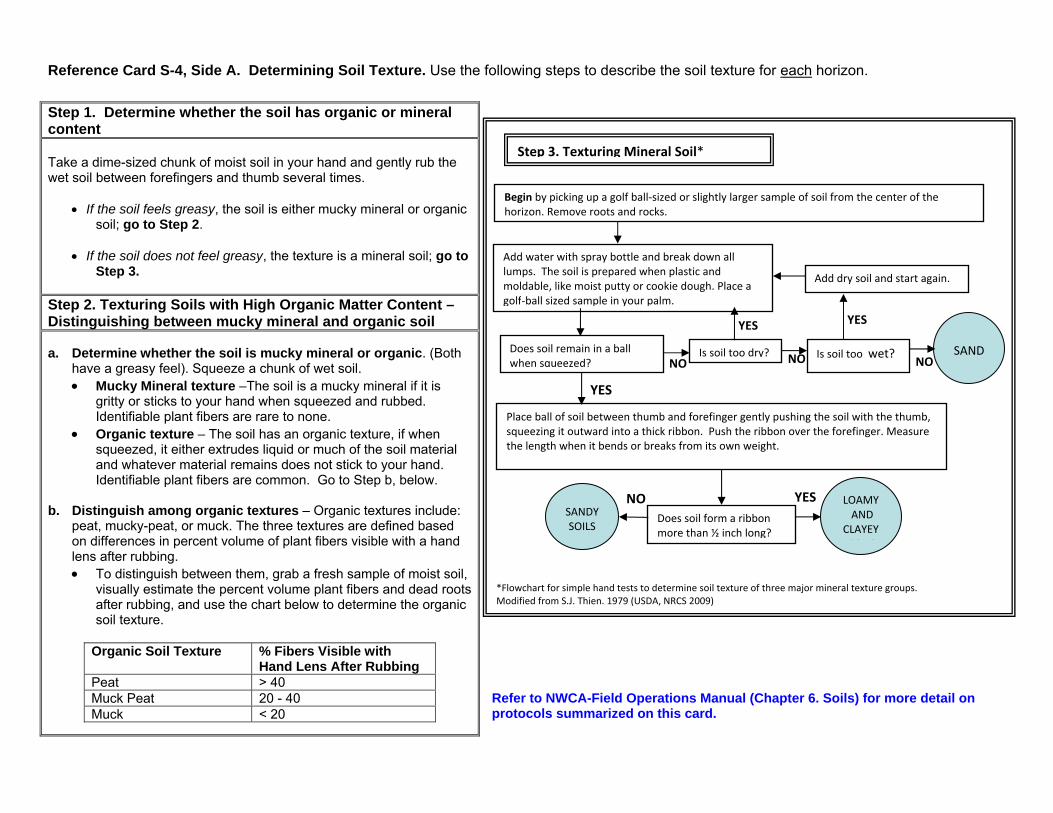
Reference Card S-4, Side A. Determining Soil Texture. Use the following steps to describe the soil texture for each horizon.
Step 1. Determine whether the soil has organic or mineral content Take a dime-sized chunk of moist soil in your hand and gently rub the wet soil between forefingers and thumb several times.
If the soil feels greasy, the soil is either mucky mineral or organic soil; go to Step 2.
If the soil does not feel greasy, the texture is a mineral soil; go to Step 3.
Step 2. Texturing Soils with High Organic Matter Content – Distinguishing between mucky mineral and organic soil a. Determine whether the soil is mucky mineral or organic. (Both
have a greasy feel). Squeeze a chunk of wet soil. Mucky Mineral texture –The soil is a mucky mineral if it is
gritty or sticks to your hand when squeezed and rubbed. Identifiable plant fibers are rare to none.
Organic texture – The soil has an organic texture, if when squeezed, it either extrudes liquid or much of the soil material and whatever material remains does not stick to your hand. Identifiable plant fibers are common. Go to Step b, below.
b. Distinguish among organic textures – Organic textures include:
peat, mucky-peat, or muck. The three textures are defined based on differences in percent volume of plant fibers visible with a hand lens after rubbing. To distinguish between them, grab a fresh sample of moist soil,
visually estimate the percent volume plant fibers and dead roots after rubbing, and use the chart below to determine the organic soil texture.
Organic Soil Texture % Fibers Visible with Hand Lens After Rubbing
Peat > 40 Muck Peat 20 - 40 Muck < 20
Add water with spray bottle and break down all lumps. The soil is prepared when plastic and moldable, like moist putty or cookie dough. Place a golf‐ball sized sample in your palm.
Does soil remain in a ball when squeezed?
Place ball of soil between thumb and forefinger gently pushing the soil with the thumb, squeezing it outward into a thick ribbon. Push the ribbon over the forefinger. Measure the length when it bends or breaks from its own weight.
Begin by picking up a golf ball‐sized or slightly larger sample of soil from the center of the horizon. Remove roots and rocks.
Is soil too dry? Is soil too wet?
Add dry soil and start again.
SAND
Does soil form a ribbon more than ½ inch long?
YES
NO
YES
NO NO
YES
NO YES LOAMY AND CLAYEY SO S
SANDY SOILS
Step 3. Texturing Mineral Soil*
*Flowchart for simple hand tests to determine soil texture of three major mineral texture groups. Modified from S.J. Thien. 1979 (USDA, NRCS 2009)
Refer to NWCA-Field Operations Manual (Chapter 6. Soils) for more detail on protocols summarized on this card.

Reference Card S-4, Side B. Soil Color Determinations
Tables for Distinguishing Faint from Distinct or Prominent Color Contrast for Redoximorphic or Other Features Compared to the Soil Matrix (from Schoeneberger et al. 2002). Use these tables to determine the redox or other color features (distinct + prominent) for which to estimate surface area (Form S‐1, NWCA‐FOM Section 6.1.2.6, Step 6).
Evaluating Color for the Soil Matrix and for Redoximorphic Features
Determining Color of the Soil Matrix: 1) To determine soil matrix color, choose a representative, freshly broken surface of a soil ped
that is not coated with clay, Fe (Iron), or Mn (Manganese). 2) Use a spray bottle to wet the soil if it is dry. Spray until moist, but not saturated. As soon as
the water is absorbed into the soil, read the color from the Munsell Soil Color Book (Munsell Soil Color, X‐Rite 2009) (See Step 3). For horizons with high organic content (e.g., A and O horizons), rub the soil between your fingers, then read the color of rubbed material.
3) Match the soil matrix color (hue, value, and chroma) to the soil color chips from the Munsell
Soil Color Book. Hue is found on the Munsell page tab and labeled using numbers and letters (e.g., 2.5YR or 10R). Value is found on the left side of the page along the y‐axis of the color chip array and is represented by numbers (e.g., 2.5, 8). Chroma is found at the bottom of page along the x‐axis of the color chip array and is represent by numbers or by numbers and letters for gley sois (e.g., 1, 8, 5G, 10GY).
4) Observe the soil color in direct sunlight with the sun at your back and shining over your right
shoulder whenever possible. Match the color of the soil with the closest color chip from the Munsell Soil Color Book.
Start at the 10YR page and go left for redder and right for yellower or grayer colors.
The color chips in the Munsell Book have central holes so that the soil can be directly compared through the hole to the chip of interest.
Take care to keep the color chips clean and dry. 5) Record color codes for the hue, value, and chroma matching the soil matrix color on Form S‐1:
NWCA Soil Profile Data (Front). Determining Color of Redoximorphic, Organic, or Mottle Features: 1) When redoximorphic or other features (See Reference Card S‐3 for examples) are present in
the horizon, determine the color for the most evident feature observed. 2) Select a representative, freshly broken surface of a soil ped that clearly illustrates the redox or
other feature of interest. 3) Focus on this feature and use Steps 2 through 4 (as described above for determining Soil
Matrix color) to match the feature color with the closest color chip from the Munsell Color Book. Record the color codes for the hue, value, and chroma matching in the appropriate fields on Form S‐1: NWCA Soil Profile Data (Front).
Refer to NWCA-Field Operations Manual (Chapter 6. Soils) for more detail on protocols summarized on this card.

Reference Card S-5, Side A. USDA Land Resource Regions (LRRs). Use this map to identify the LRR appropriate to the location of the AA being sampled. Use the list of Hydric Soil Indicators by Land Resource Regions on Side B of this Reference Card to identify the Hydric Soil Indicators pertinent to the AA. Refer to NWCA-Field Operations Manual (Chapter 6. Soils) and Field Indicators of Hydric Soils in the United States (USDA, NRCS 2010) for more detail.

Reference Card S-5, Side B. Hydric Soil Indicators by Land Resource Regions, Evaluating Hydric Soil Indicators
Refer to NWCA-Field Operations Manual (Chapter 6. Soils) and Field Indicators of Hydric Soils in the United States (USDA, NRCS 2010) for more detail.
Procedures for Evaluating Hydric Soil Indicators 1. Data describing Hydric Soil Indicators are recorded in the
Hydric Soil Indicators section of Form S-1 NWCA Soil Profile Data (Back).
2. Determine the USDA-NRCS Land Resource Region (LRR) in
which the AA being sampled is located by consulting the LRR map on the front of this card or in the Hydric Soils Indicators Manual. The hydric soil indicators that apply to each LRR are listed in the table to the left and included in parentheses next to the indicator names in the Hydric Soil Indicators section of Form S-1 NWCA Soil Profile Data (Back).
3. While examining the soil profile, use the Field Indicators of Hydric Soils in the United States (USDA, NRCS 2010) manual and the information on texture, color, redoximorphic features (which you previously recorded for each horizon on the front side of Form S-1) to determine whether the hydric indicators specific to the LRR where the AA is located are present.
4. Evaluate the profile for all regionally appropriate Hydric Soil
Indicators that fall into the soil texture groups A (All Soils), or F (Loamy/Clayey Soils), or S (Sandy Soils) pertinent to the soil profile under examination.
5. Record the presence of any of these hydric soils indicators in
the Hydric Soil Indicators section of Form S-1 NWCA Soil Profile Data (Back) by filling in the appropriate bubbles.
6. All hydric soil indicators that are observed are assumed to
occur in the soil profile location specified in the description of that indicator in Field Indicators of Hydric Soils in the United States (USDA, NRCS 2010). If something unusual is observed, note the soil horizon number and describe the anomaly in the Hydric Indicator Comments section of Form S-1 NWCA Soil Profile Data (Back).
Hydric Soil Indicators LRR
All Soils Sandy Soils Loamy/Clayey Soils
A A1,A2,A3,A4,A11, A12 S1, S4, S5, S6 F1, F2, F3, F6, F7, F8
B A1, A2, A3, A4, A11, A12 S1, S4, S5, S6 F1, F2, F3, F6, F7, F8, F9
C A1, A2, A3, A4, A5, A11, A12 S1, S4, S5, S6 F1, F2, F3, F6, F7, F8, F9
D A1, A2, A3, A4, A9, A11, A12 S1, S4, S5, S6 F1, F2, F3, F6, F7, F8, F9
E A1, A2, A3, A4, A11 , A12 S1, S4, S5, S6 F1, F2, F3, F6, F7, F8
F A1, A2, A3, A4, A5, A9, A11, A12
S1, S3, S4, S5, S6 F1, F2, F3, F6, F7, F8
G A1, A2, A3, A4, A9, A11, A12 S1, S2, S4, S5, S6 F1, F2, F3, F6, F7, F8
H A1, A2, A3, A4, A9, A11, A12 S1, S2, S4, S5, S6 F1, F2, F3, F6, F7, F8
I A1, A2, A3, A4, A11, A12 S1, S4, S5, S6 F1, F2, F3, F6, F7, F8
J A1, A2, A3, A4, A11, A12 S1, S4, S5, S6 F1, F2, F3, F6, F7, F8
K A1, A2, A3, A4, A5, A11, A12 S1, S4, S5, S6 F1, F2, F3, F6, F7, F8
L A1, A2, A3, A4, A5, A11, A12 S1, S4, S5, S6 F1, F2, F3, F6, F7, F8
M A1, A2, A3, A4, A5, A10, A11, A12
S1, S3, S4, S5, S6 F1, F2, F3, F6, F7, F8
N A1, A2, A3, A4, A5, A10, A11, A12
S1, S4, S5, S6, S7 F2, F3, F6, F7, F8, F12, F13
O A1, A2, A3, A4, A5, A11, A12 S1, S4, S5, S6 F1, F2, F3, F6, F7, F8, F12
P A1, A2, A3, A4, A5, A6, A7, A9, A11, A12
S4, S5, S6, S7 F2, F3, F6, F7, F8, F12, F13
R A1, A2, A3, A4, A5, A11, A12
S1, S3, S4, S5, S6, S7, S8, S9
F2, F3, F6, F7, F8
S A1, A2, A3, A4, A5, A11, A12
S1, S4, S5, S6, S7, S8, S9
F2, F3, F6, F7, F8, F19, F20
T A1, A2, A3, A4, A5, A6, A7, A9, A11, A12, A16
S4, S5, S6, S7, S8, S9 F2, F3, F6, F7, F8, F11, F12, F13, F17, F18, F20
U A1, A2, A3, A4, A5, A6, A7, A8, A11, A12
S4, S5, S6, S7, S8, S9 F2, F3, F6, F7, F8, F10, F13
*For descriptions of the Hydric Soil Indicators please see: Field Indicators of Hydric Soils in the United States. **LLRs for areas outside the conterminous United States have been omitted.

2011 NWCA Field Operations Manual Chapter 6. Soils
6.6 SOIL EQUIPMENT LIST, DATA FORMS, AND LABELS Equipment Checklist Forms Form S-1: NWCA Soil Profile Data (Front) Form S-1: NWCA Soil Profile Date (Back) Form T-4: NWCA Soil Sample Tracking Sample Tags and Labels Soil Isotope and Sediment Enzyme Sample Labels Soil Bulk Density or Chemistry Sample Tag Soil Bulk Density or Chemistry Sample Label
6-59

2011 NWCA Field Operations Manual Chapter 6. Soils
6-60

SOIL EQUIPMENT AND SUPPLY CHECKLIST Protocols, forms, checklists, supplies ___This equipment checklist ___References Cards S-1 through S-4 ___Data Forms on waterproof paper:
___Form S-1: NWCA Soil Profile Data (Four/site, but carry extras in case soil has many horizons) ___Form T-4: NWCA Bulk Density and Chemistry Soil Sample Tracking ___Form T-1: NWCA Site and Sample Status/WRS Tracking Form
___Site packet including a copy of the NRCS soils map and soil survey information for the site ___2 covered clipboards, with storage for completed forms for the AB Team ___Waterproof field notebook, pencils, mechanical pencils and lead, waterproof pens or marker ___Clear packing tape to place over labels (labels listed by sample type below) Field guides that must be carried in the field __ For color determinations: Munsell Color X-Rite. 2009. Munsell Soil Color Charts. Grand Rapids, MI. ___For Hydric Soil Indicator determinations: United States Department of Agriculture, Natural Resources
Conservation Service. 2010. Field Indicators of Hydric Soils in the United States, Version 7.0. L.M. Vasilas, G.W. Hurt, and C.V. Noble (eds.). USDA, NRCS, in cooperation with the National Technical Committee for Hydric Soils.
Supporting reference to keep in vehicle or carry in field ___Schoeneberger, P.J., D.A. Wysocki, E.C. Benham, and W.D. Broderson. 2002. Field Book for Describing and
Sampling Soils, Version 2.0. Natural Resources Conservation Service, National Soil Survey Center, Lincoln, Nebraska, USA.
Sampling supplies and tools (Note: other soil tools may be available to borrow from local soil scientist) ___Tote, pack, or field vest to carry tools and small equipment ___Excavating and profile description supplies (Note: Carry excavating tools pertinent to likely soil conditions)
___4 Pin flags labeled A, B, C, or D for marking soil pit locations ___Tiling or Sharpshooter style shovel ___Bucket auger with interchangeable extension handles and appropriate head(s) for anticipated soil conditions
(regular, mud, sand, dutch, etc). A ratchet handle crossbar may often be useful. ___King tube soil extractor for saturated/inundated conditions, particularly in sandy soils ___Root-pruners (or other cutting tools for roots) ___Metal flashing 12” tall for supporting/sealing earthen coffer dam built from Soil Pit spoils for inundated soils ___Small scoop for bailing water from pit ___Hand water pump ___Four, 6 mil thick, ~1.5m2 black plastic sheets for laying out soil slabs/cores at each Soil Pit ___Plastic or metal strips or golf tees for marking soil horizons ___Metric tape measure (e.g., a fiberglass seamstress’s measuring tape with lead weight (e.g., fishing weight)
attached to the bottom) ___Spray bottle with water for moistening soil as needed ___10X Hand lens ___Sharp knife shaving soil slices to expose fresh surface, for cutting out bulk density samples in difficult soils
(e.g., peat, or saturated soils extracted with the King tub extractor method). ___ Small flashlight for viewing in situ soil profile in Representative Soil Pit
___Isotope soil sample and sediment enzyme samples supplies ___Quart-size zipper plastic bag and gallon-sized zipper plastic bag ___Isotope Soil Sample Label ___Sediment Enzyme Sample Label ___Syringe corer (2 – one for use and one for back-up) ___Sealable plastic food storage container to store filled isotope soil and sediment enzyme sample bags ___Moderate sized ice chest to keep isotope and sediment enzyme samples cool (chlorophyll-a samples will
also be kept in ice chest) ___ Bulk density and chemistry soil sample supplies
___8ml thick plastic soil sample bags for bulk density and chemistry soil samples ___Bulk density and chemistry soil sample tags and labels to affix to sample bags ___Heavy-duty sample bag stapler ___Small can to serve as soil bulk density core extractor (recommend a can ~6.5cm diameter, 4.5cm deep,
e.g., small, sliced olive can) ___Tote, pack, and/or ice chest for storing and carrying soil samples

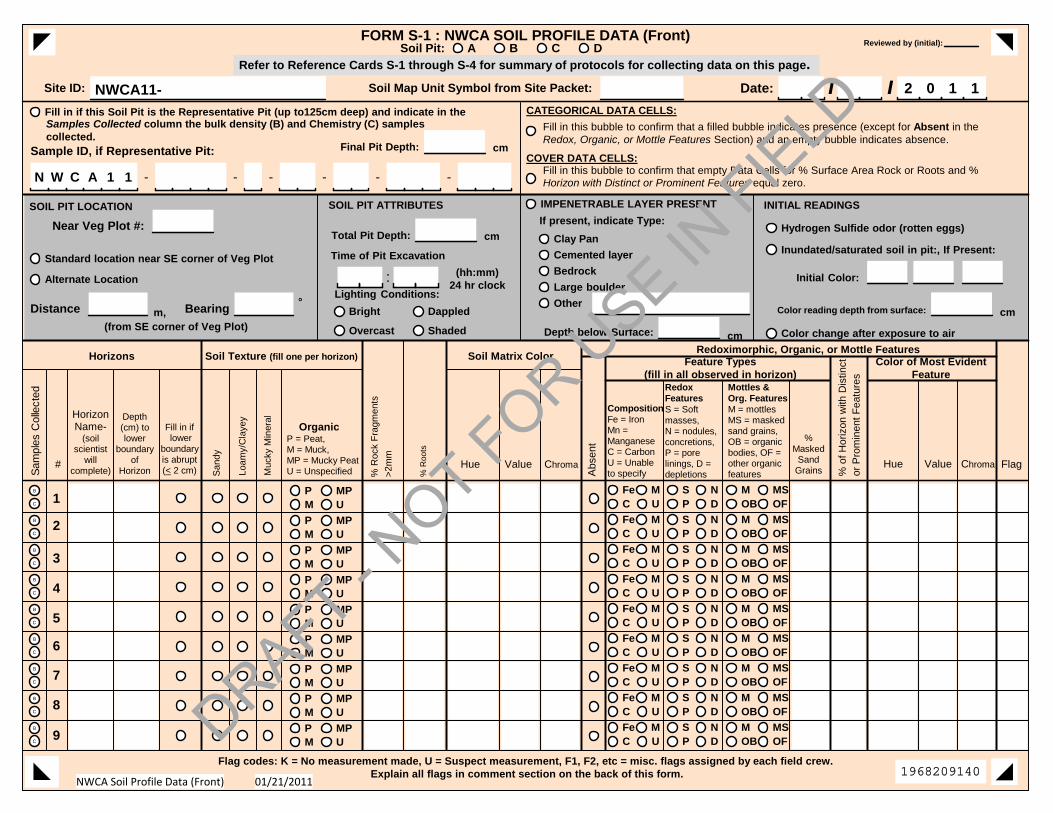
PM
MPU
Fe S MC U
MP D
NOB OF
MSB
C
PM
MPU
Fe S MC U
MP D
NOB OF
MSB
C
PM
MPU
Fe S MC U
MP D
NOB OF
MSB
C
PM
MPU
Fe S MC U
MP D
NOB OF
MSB
C
PM
MPU
Fe S MC U
MP D
NOB OF
MSB
C
PM
MPU
Fe S MC U
MP D
NOB OF
MSB
C
PM
MPU
Fe S MC U
MP D
NOB OF
MSB
C
PM
MPU
Fe S MC U
MP D
NOB OF
MSB
C
PM
MPU
Fe S MC U
MP D
NOB OF
MSB
C
Refer to Reference Cards S-1 through S-4 for summary of protocols for collecting data on this page.
Redoximorphic, Organic, or Mottle Features
% o
f H
oriz
on w
ith D
istin
ct
or P
rom
inen
t F
eatu
res
Flag codes: K = No measurement made, U = Suspect measurement, F1, F2, etc = misc. flags assigned by each field crew. Explain all flags in comment section on the back of this form.
CompositionFe = IronMn =ManganeseC = CarbonU = Unableto specify
Color of Most EvidentFeature
FORM S-1 : NWCA SOIL PROFILE DATA (Front)
01/21/2011NWCA Soil Profile Data (Front)
HorizonName-
(soilscientist
willcomplete)
Depth(cm) tolower
boundaryof
Horizon
Fill in if lower
boundaryis abrupt(< 2 cm)
Site ID: NWCA11- Date: 2 0 1 1/ /Soil Map Unit Symbol from Site Packet:
Soil Pit: A B C D
Near Veg Plot #:
SOIL PIT LOCATION
Standard location near SE corner of Veg Plot
Alternate Location
(from SE corner of Veg Plot)
SOIL PIT ATTRIBUTES
CATEGORICAL DATA CELLS:
Fill in this bubble to confirm that a filled bubble indicates presence (except for Absent in theRedox, Organic, or Mottle Features Section) and an empty bubble indicates absence.
COVER DATA CELLS:Fill in this bubble to confirm that empty Data Cells for % Surface Area Rock or Roots and %Horizon with Distinct or Prominent Features equal zero.
Fill in if this Soil Pit is the Representative Pit (up to125cm deep) and indicate in the
Sample ID, if Representative Pit:
- - - - - -N W C A 1 1
Lighting Conditions:
Bright
Overcast
Dappled
Shaded
cmTotal Pit Depth:
°Bearingm,Distance
IMPENETRABLE LAYER PRESENT
If present, indicate Type:
Clay Pan
cmDepth below Surface:
Cemented layer
Bedrock
Large boulder
Other
INITIAL READINGS
Hydrogen Sulfide odor (rotten eggs)
Inundated/saturated soil in pit:, If Present:
Color change after exposure to air
Initial Color:
Time of Pit Excavation
:
cmColor reading depth from surface:
San
dy
Loam
y/C
laye
y
Muc
ky M
iner
al
% R
ock
Fra
gmen
ts
>2m
m
% R
oots
Abs
ent
Hue Value Chroma
RedoxFeaturesS = Softmasses,N = nodules,concretions,P = porelinings, D =depletions
Mottles &Org. FeaturesM = mottlesMS = maskedsand grains,OB = organicbodies, OF =other organicfeatures
Flag
Feature Types(fill in all observed in horizon)
#
Horizons Soil Texture (fill one per horizon) Soil Matrix Color
(hh:mm)24 hr clock
OrganicP = Peat,M = Muck,MP = Mucky PeatU = Unspecified
Hue Value Chroma
1
2
3
4
5
6
7
8
9
cmFinal Pit Depth:
%Masked
SandGrains
Samples Collected column the bulk density (B) and Chemistry (C) samplescollected.
Sam
ples
Col
lect
edReviewed by (initial):
1968209140
DRAFT - NOT FOR U
SE IN FIE
LD

Hydric Soil Indicator Comments
NWCA Soil Profile Data (Back) 01/21/2011
FORM S-1 : NWCA SOIL PROFILE DATA (Back)Soil Pit: A B C D
Site ID: NWCA11- Date: 2 0 1 1/ /Hydric Soil Indicators (USDA Land Resource Region in the 48 conterminous US States (A to U) in which each indicator applies) - Refer to 1) Reference CardS-5 in the NWCA Field Operations Manual and 2) United States Department of Agriculture, National Resources Conservation Service. 2010 Field indicators of Hydric Soils in the UnitedStates, Version 7.0. L.M. Vasilas, G.W. Hurt, and C.V. Noble (eds.), USDA, NRCS, in cooperation with the National Technical Committee for Hydric Soils.
Soil Pit Water Depth (cm)
A1 - Histosol (A-U)
A2 - Histic Epipedon (A-U)
A3 - Black Histic (A-U)
A4 - Hydrogen Sulfide (A-U)
A5 - Stratified Layers (C, F, K-U)
A6 - Organic Bodies (P, T, U)
A7 - 5 cm Mucky Mineral (P, T, U)
A8 - Muck presence (U)
A9 - 1 cm Muck (D, F, G, H, P, T)
A11 - Depleted Below Dark Surface (A-U)
A12 - Thick Dark Surface (A-U)
A16 - Coast Prairie Redox (T)
A10 - 2 cm Muck (M, N)
Fill in all that apply:
- No Hydric Soil Indicator Observed
All Soils
F1 - Loamy Mucky Mineral (A-M, O)
F2 - Loamy Gleyed Matrix (A-U)
F3 - Depleted Matrix (A-U)
F6 - Redox Dark Surface (A-U)
F7 - Depleted Dark Surface (A-U)
F8 - Redox Depressions (A-U)
F9 - Vernal Pools (B-D)
F10 - Marl (U)
F11 - Depleted Ochric (T)
F12 - Iron-Manganese Mass (N-P, T)
F13 - Umbric Surface (N, P, T)
F16 - High Plains Depressions (H)
F17 - Delta Ochric (T)
F18 - Reduced Vertic (T)
F19- Piedmount Flood Plain Soils (S)
F20 - Anomalus Bright Loamy Soils (S, T)
Loamy/Clayey Soils
S1 - Sandy Mucky Mineral (A-O, R, S)
S2 - 2.5 cm Mucky Peat or Peat (G, H)
S4 - Sandy Gleyed Matrix (A-U)
S5 - Sandy Redox (A-U)
S6 - Stripped Matrix (A-U)
S7 - Dark Surface (N, P, R-U)
S8 - Polyvalue Below Surface (R-U)
S9 - Thin Dark Surface (R-U)
S3 - 5 cm Mucky Peat or Peat (F, M, R)
Sandy Soils
Flag Comment Flag Comment
Flag codes:K = No measurement made, U = Suspect measurement, F1, F2, etc = misc.flags assigned by each field crew. Explain all flags in comment section.
Saturation (depth from ground surface down tolevel of saturated soil, e.g. glistening, oozing pit wall)
Water level in pit (depth from ground surfacedown to water level)
Surface Water (depth of water above groundsurface)
Water Type cm Absent Flag
:(hh:mm) 24 hr clockTime of water level observation:
No Sample Collected
No Sample CollectedSediment Enzymes
Soil Isotope/Sediment Enzymes
Sample ID Comments Soil Isotope
Reviewed by (initial):
Sample ID Comments
6604003054
DRAFT - NOT FOR U
SE IN FIE
LD

SOIL ISOTOPE
NWCA11-7771 Visit#: 1
_____ /_____ /2011
999983
SEDIMENT ENZYMES
NWCA11-7771 Visit#: 1
_____ /_____ /2011
999985
Example Labels for Soil Isotope and Sediment Enzyme Samples


▼Use for Bulk Density Samples Horizons 1-7 ▼Use for Chemistry Soil Samples Horizons 1-7
NWCA 2011: Bulk Density or Chemistry Soil Sample TagNWCA11‐9999‐1‐11‐OR‐002‐001‐1
Date: ___/___/2011 Visit #: o1 o2 ‐ Chemistry/PSDA – Bulk Density Horizon #: 1 Horizon Location: ____cm to ____cm
NWCA 2011: Bulk Density or Chemistry Soil Sample TagNWCA11‐9999‐1‐11‐OR‐002‐001‐1
Date: ___/___/2011 Visit #: o1 o2 ‐ Chemistry/PSDA – Bulk Density Horizon #: 1 Horizon Location: ____cm to ____cm
NWCA 2011: Bulk Density or Chemistry Soil Sample TagNWCA11‐9999‐1‐11‐OR‐002‐001‐2
Date: ___/___/2011 Visit #: o1 o2 ‐ Chemistry/PSDA – Bulk Density Horizon #: 2 Horizon Location: ____cm to ____cm
NWCA 2011: Bulk Density or Chemistry Soil Sample TagNWCA11‐9999‐1‐11‐OR‐002‐001‐2
Date: ___/___/2011 Visit #: o1 o2 ‐ Chemistry/PSDA – Bulk Density Horizon #: 2 Horizon Location: ____cm to ____cm
NWCA 2011: Bulk Density or Chemistry Soil Sample TagNWCA11‐9999‐1‐11‐OR‐002‐001‐3
Date: ___/___/2011 Visit #: o1 o2 ‐ Chemistry/PSDA – Bulk Density Horizon #: 3 Horizon Location: ____cm to ____cm
NWCA 2011: Bulk Density or Chemistry Soil Sample TagNWCA11‐9999‐1‐11‐OR‐002‐001‐3
Date: ___/___/2011 Visit #: o1 o2 ‐ Chemistry/PSDA – Bulk Density Horizon #: 3 Horizon Location: ____cm to ____cm
NWCA 2011: Bulk Density or Chemistry Soil Sample TagNWCA11‐9999‐1‐11‐OR‐002‐001‐4
Date: ___/___/2011 Visit #: o1 o2 ‐ Chemistry/PSDA – Bulk Density Horizon #: 4 Horizon Location: ____cm to ____cm
NWCA 2011: Bulk Density or Chemistry Soil Sample TagNWCA11‐9999‐1‐11‐OR‐002‐001‐4
Date: ___/___/2011 Visit #: o1 o2 ‐ Chemistry/PSDA – Bulk Density Horizon #: 4 Horizon Location: ____cm to ____cm
NWCA 2011: Bulk Density or Chemistry Soil Sample TagNWCA11‐9999‐1‐11‐OR‐002‐001‐5
Date: ___/___/2011 Visit #: o1 o2 ‐ Chemistry/PSDA – Bulk Density Horizon #: 5 Horizon Location: ____cm to ____cm
NWCA 2011: Bulk Density or Chemistry Soil Sample TagNWCA11‐9999‐1‐11‐OR‐002‐001‐5
Date: ___/___/2011 Visit #: o1 o2 ‐ Chemistry/PSDA – Bulk Density Horizon #: 5 Horizon Location: ____cm to ____cm
NWCA 2011: Bulk Density or Chemistry Soil Sample TagNWCA11‐9999‐1‐11‐OR‐002‐001‐6
Date: ___/___/2011 Visit #: o1 o2 ‐ Chemistry/PSDA – Bulk Density Horizon #: 6 Horizon Location: ____cm to ____cm
NWCA 2011: Bulk Density or Chemistry Soil Sample TagNWCA11‐9999‐1‐11‐OR‐002‐001‐6
Date: ___/___/2011 Visit #: o1 o2 ‐ Chemistry/PSDA – Bulk Density Horizon #: 6 Horizon Location: ____cm to ____cm
NWCA 2011: Bulk Density or Chemistry Soil Sample TagNWCA11‐9999‐1‐11‐OR‐002‐001‐7
Date: ___/___/2011 Visit #: o1 o2 ‐ Chemistry/PSDA – Bulk Density Horizon #: 7 Horizon Location: ____cm to ____cm
NWCA 2011: Bulk Density or Chemistry Soil Sample TagNWCA11‐9999‐1‐11‐OR‐002‐001‐7
Date: ___/___/2011 Visit #: o1 o2 ‐ Chemistry/PSDA – Bulk Density Horizon #: 7 Horizon Location: ____cm to ____cm


NWCA 2011: Bulk Density or Chemistry Soil Sample Label
Stap
le under sample bag fold
Sample Type: Chemistry/PSDA Bulk Density
Sample ID: NWCA11‐9999‐1‐11‐OR‐002‐001‐1 Date: ___/___/2011 Visit #: 1 2
Horizon #: 1 Horizon Location: ____cm to ____cm
For Bulk Density Samples Only: Indicate cores or blocks collected by filling in appropriate bubble. Record volume information in one of the following ways: 1) The volume as cubic centimeters, 2) the diameter and length of cylindrical core, or 3) the dimensions of a block.
Core or Block 1: Core or Block 2: Core or Block 3:
_____ Volume (cm³) _____ Volume (cm³) _____ Volume (cm³)
Cylindrical
____ Diameter (cm) ____ Length (cm)
____ Diameter (cm) ____ Length (cm)
____ Diameter (cm) ____ Length (cm)
Block
____ Width (cm)
____ Length (cm)
____ Depth (cm)
____ Width (cm)
____ Length (cm)
____ Depth (cm)
____ Width (cm)
____ Length (cm)
____ Depth (cm)
Comments:
For Chemistry Samples Only: Rocks in the soil should be retained in the sample; however, if they must be removed, record the estimated volume of the sample they comprised. _______ % Sample Volume Comprised by Removed Rock
NWCA 2011: Bulk Density or Chemistry Soil Sample Label
Stap
le under sample bag fold
Sample Type: Chemistry/PSDA Bulk Density
Sample ID: NWCA11‐9999‐1‐11‐OR‐002‐001‐1 Date: ___/___/2011 Visit #: 1 2
Horizon #: 1 Horizon Location: ____cm to ____cm
For Bulk Density Samples Only: Indicate cores or blocks collected by filling in appropriate bubble. Record volume information in one of the following ways: 1) The volume as cubic centimeters, 2) the diameter and length of cylindrical core, or 3) the dimensions of a block.
Core or Block 1: Core or Block 2: Core or Block 3:
_____ Volume (cm³) _____ Volume (cm³) _____ Volume (cm³)
Cylindrical
____ Diameter (cm) ____ Length (cm)
____ Diameter (cm) ____ Length (cm)
____ Diameter (cm) ____ Length (cm)
Block
____ Width (cm) ____ Length (cm) ____ Depth (cm)
____ Width (cm) ____ Length (cm) ____ Depth (cm)
____ Width (cm) ____ Length (cm) ____ Depth (cm)
Comments:
For Chemistry Samples Only: Rocks in the soil should be retained in the sample; however, if they must be removed, record the estimated volume of the sample they comprised. _______ % Sample Volume Comprised by Removed Rock

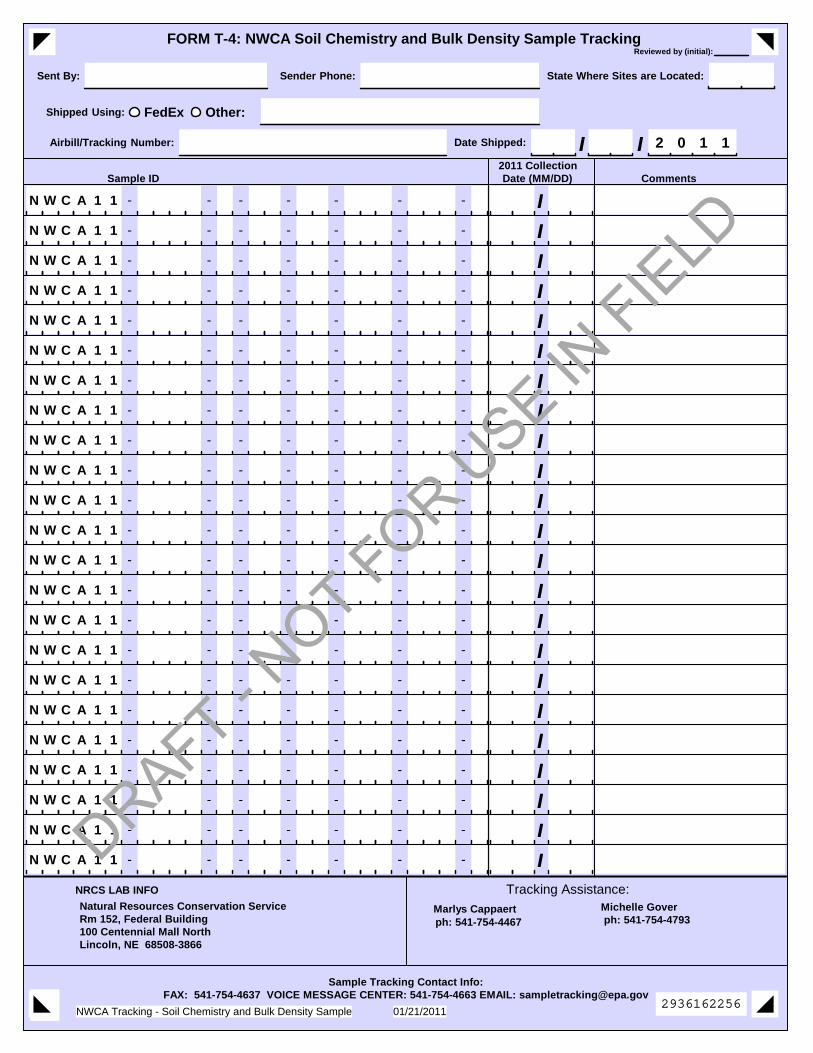
2011 Collection Sample ID Date (MM/DD) Comments
- - - - - - -N W C A 1 1 /- - - - - - -N W C A 1 1 /- - - - - - -N W C A 1 1 /- - - - - - -N W C A 1 1 /- - - - - - -N W C A 1 1 /- - - - - - -N W C A 1 1 /- - - - - - -N W C A 1 1 /- - - - - - -N W C A 1 1 /- - - - - - -N W C A 1 1 /- - - - - - -N W C A 1 1 /- - - - - - -N W C A 1 1 /- - - - - - -N W C A 1 1 /- - - - - - -N W C A 1 1 /- - - - - - -N W C A 1 1 /- - - - - - -N W C A 1 1 /- - - - - - -N W C A 1 1 /- - - - - - -N W C A 1 1 /- - - - - - -N W C A 1 1 /- - - - - - -N W C A 1 1 /- - - - - - -N W C A 1 1 /- - - - - - -N W C A 1 1 /- - - - - - -N W C A 1 1 /- - - - - - -N W C A 1 1 /
FORM T-4: NWCA Soil Chemistry and Bulk Density Sample Tracking
01/21/2011NWCA Tracking - Soil Chemistry and Bulk Density Sample
Sent By: Sender Phone: State Where Sites are Located:
Shipped Using: FedEx Other:
Airbill/Tracking Number: Date Shipped: 2 0 1 1/ /
Sample Tracking Contact Info:FAX: 541-754-4637 VOICE MESSAGE CENTER: 541-754-4663 EMAIL: [email protected]
Marlys Cappaert ph: 541-754-4467
NRCS LAB INFO Tracking Assistance:Natural Resources Conservation ServiceRm 152, Federal Building100 Centennial Mall NorthLincoln, NE 68508-3866
Michelle Gover ph: 541-754-4793
Reviewed by (initial):
2936162256
DRAFT - NOT FOR U
SE IN FIE
LD
