chapter 7 accounting (cs) (sp) (cs) (sp) - deca ontario · chapter 7—accounting from your local...
TRANSCRIPT

Chapter 7—Accounting
From your local convenience store, to Apple, every business requires accounting on some level.
Whether it’s to release information to investors, help management make decisions or report business
earnings to the government, every business needs to understand its financial situation. Understanding
past financial performance can help guide the business towards success in the future. In this chapter,
you will learn about accounting and GAAP, financial ratios, financial statements and managerial
accounting.
By the end of this chapter, you will be able to:
• Explain the concept of accounting (CS)
• Compare U.S. Generally Accepted Accounting Principles (GAAP) and International Financial Reporting Standards (IFRS) (SP)
• Journalize business transactions (CS)
• Discuss the nature of the accounting cycle (CS)
• Explain the nature of balance sheets (SP)
• Describe the nature of income statements (SP)
• Describe the nature of cash flow statements (SP)
• Interpret financial ratios significant to investors (SP)
• Explain the role of managerial accounting techniques in business management (SP)
• Explain the nature of managerial cost accounting (e.g., activities, costs, cost drivers, etc.) (SP)
• Describe the scope of costs in managerial accounting (e.g., direct cost, indirect cost, sunk cost, differential cost, etc.) (SP)
• Describe marginal analysis techniques and applications (SP)
• Discuss the use of variance analysis in managerial accounting (SP)
• Discuss the nature of cost accounting budgets (SP)
• Discuss the nature of cost allocation (SP)
7.1 What is Accounting?
Accounting provides insight into the financial state of organizations through identifying, recording,
analyzing, summarizing and communicating the financial information. The first step in the accounting
process is to identify any financial transactions, which relate to the organization. An organization
purchases $50, 000 worth of inventory, pays its electricity bill, or sells a bicycle; these are all examples of
financial transactions within an organization. Once transactions relevant to the organization are
identified, they are recorded in a general journal. The transactions are recorded in chronological order,
denominated by dollars and cents so they can be analyzed and summarized through a variety of
financial statements.
Financial statements, including the balance sheet, income statement, cash flow statement and
Statement of Owners’ Equity are communicated to interested parties such as internal and external
users. These financial statements will be further explored in Section 7.2.
It is important for employees handling the accounting within an organization to remain ethical. Ethics is
defined as the moral principles of an entity when deciding between the right and wrong thing to do.
Since most people or entities would have different sets of moral principles, Generally Accepted
Accounting Principles (GAAP) are set in place to help guide accountants to record transactions and
remain accurate, honest and fair throughout the accounting process. GAAP is divided into authoritative
GAAP and non-authoritative GAAP. Authoritative GAAP are binding guidelines that companies must
follow. In the US, the source of authoritative GAAP is the Financial Accounting Standards Board. Non-
authoritative GAAP, on the other hand, comes from widely accepted industry practices. While non-
authoritative GAAP is not binding, companies often choose to adhere to these rules voluntarily.
For the purposes of this book, we will primarily refer to Authoritative GAAP. In particular, you should be
aware that any references to GAAP are to US GAAP that are in effect at the time of writing (2016).
Accounting standards can change from time to time. You are encouraged to consult the FASB website to
read more information about changes to GAAP.
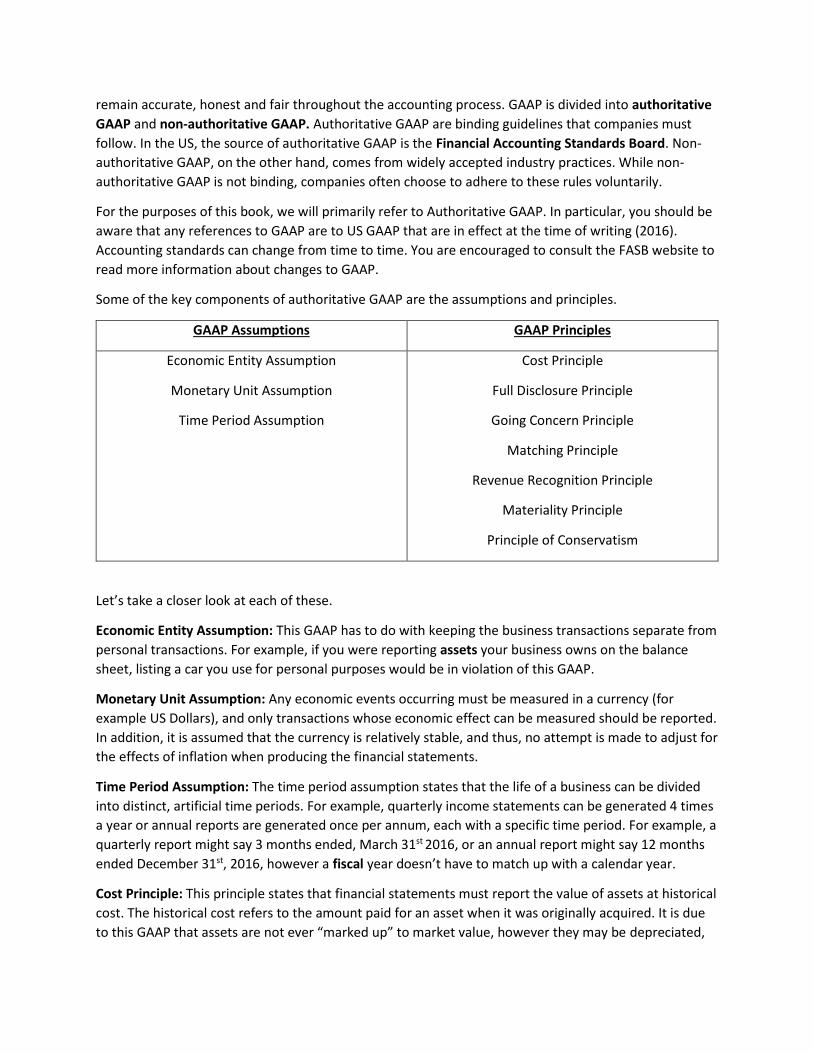
Some of the key components of authoritative GAAP are the assumptions and principles.
GAAP Assumptions GAAP Principles
Economic Entity Assumption
Monetary Unit Assumption
Time Period Assumption
Cost Principle
Full Disclosure Principle
Going Concern Principle
Matching Principle
Revenue Recognition Principle
Materiality Principle
Principle of Conservatism
Let’s take a closer look at each of these.
Economic Entity Assumption: This GAAP has to do with keeping the business transactions separate from
personal transactions. For example, if you were reporting assets your business owns on the balance
sheet, listing a car you use for personal purposes would be in violation of this GAAP.
Monetary Unit Assumption: Any economic events occurring must be measured in a currency (for
example US Dollars), and only transactions whose economic effect can be measured should be reported.
In addition, it is assumed that the currency is relatively stable, and thus, no attempt is made to adjust for
the effects of inflation when producing the financial statements.
Time Period Assumption: The time period assumption states that the life of a business can be divided
into distinct, artificial time periods. For example, quarterly income statements can be generated 4 times
a year or annual reports are generated once per annum, each with a specific time period. For example, a
quarterly report might say 3 months ended, March 31st 2016, or an annual report might say 12 months
ended December 31st, 2016, however a fiscal year doesn’t have to match up with a calendar year.
Cost Principle: This principle states that financial statements must report the value of assets at historical
cost. The historical cost refers to the amount paid for an asset when it was originally acquired. It is due
to this GAAP that assets are not ever “marked up” to market value, however they may be depreciated,

amortized, or written-off if they are deemed to be impaired. We will address these special situations
later on in this chapter.
Full Disclosure Principle: The full disclosure principle states that all information relevant to lenders,
shareholders and investors to make informed decisions about the company must be disclosed. For
example, if a company is facing a major lawsuit, and it is likely that the company will lose, it must be
disclosed.
Going Concern Principle: This principle requires accountants to report information about an entity as if
it were to operate indefinitely, or until its objectives were completed and not to sell its assets in the
near future. If the company appears as if it is going to shut down, this should be disclosed to all
interested parties.
Matching Principle: The matching principle requires the use of accrual based accounting, as opposed to
cash based accounting. Accrual based accounting means that revenues and expenses are recorded
when they occur, and not when the cash is exchanged between the parties involved. Cash based
accounting records sales and expenses when the money is exchanged in cash, not when they are
actually incurred. For example, if you performed a service of $500 for a client on account, meaning they
will pay you in 30 days, you would record the sale of $500 when the service is completed under accrual
based accounting, but under cash based accounting you would record it 30 days later when payment is
received. In addition, expenses that helped generate revenues must be matched and both must be
reported in the same fiscal period.
Revenue Recognition Principle: The revenue recognition principle uses accrual based accounting, and
records revenues when they are earned. An organization can report an income of $10, 000 despite
having received $0 in cash, because it has finalized $10, 000 worth of sales.
If you have taken Grade 12 Accounting, you may be familiar with the mnemonic device “RCMP.” RCMP
illustrates four criteria that must be satisfied for recognizing revenue under Canadian GAAP:
1) Risks and rewards have been transferred from seller to buyer.
2) Collectability is assured.
3) The value of the goods or services can be Measured
4) Performance is achieved.
US GAAP, on the other hand, uses slightly different criteria for revenue recognition. These are set out
based on the requirements of the Securities and Exchange Commission (SEC):
1) Persuasive evidence of an arrangement exists
2) Delivery has occurred or services have been rendered
3) The Seller’s price to the buyer is fixed or determinable
4) Collectability is reasonably assured.
Materiality Principle: The materiality principle sates that an accountant does not have to follow a GAAP
if the amount in question is insignificant and/or it would be too costly to correct the insignificant
mistake. An accountant’s judgement is required to determine whether or not something is insignificant.
For example, it was recorded that office supplies were purchased for $135 instead of $153 in a company
that has a net profit of $500, 000 that year. The $18 increase in expense would be insignificant, in
comparison to the net profit, and therefore if it were too late to correct the mistake the accountant
would not be required to under the materiality principle.
Principle of Conservatism: The principle of conservatism states that when there are different,
acceptable accounting treatment under GAAP, accountants should choose the method that is least likely
to overstate assets and/or net income. It is important to note that accountants must still remain
objective and realistic. The principle of conservatism does NOT suggest that accountants should
deliberately understate assets and/or net income.
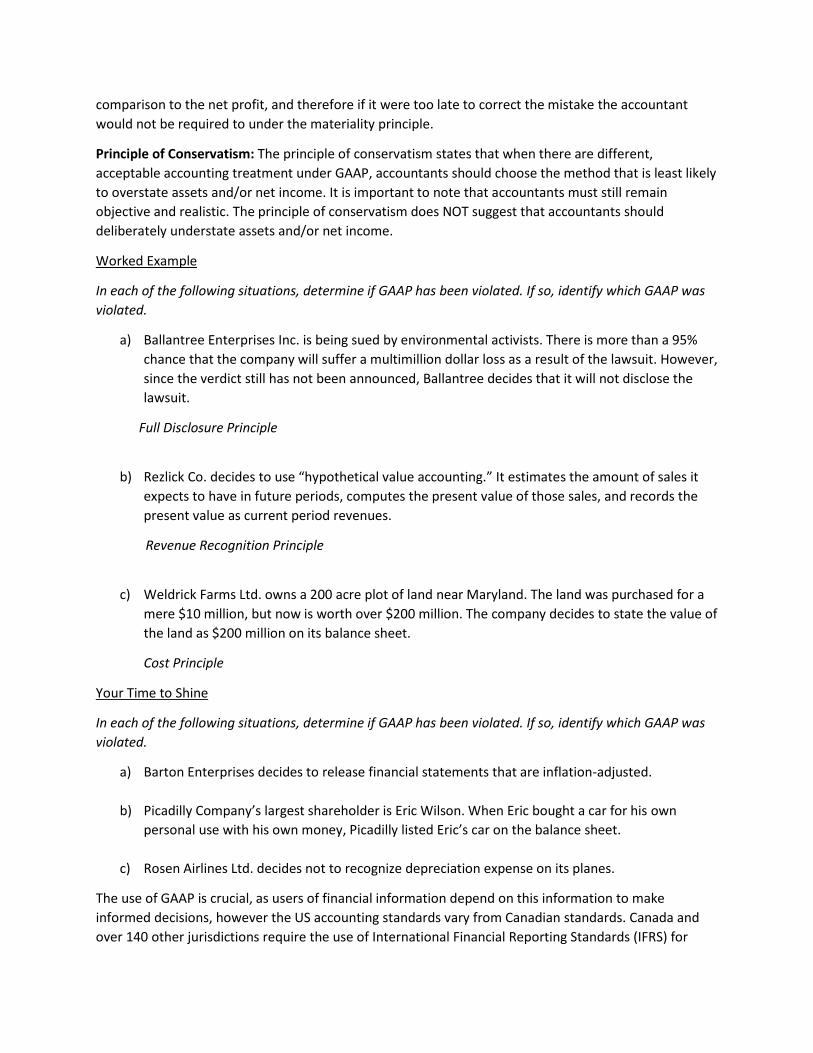
Worked Example
In each of the following situations, determine if GAAP has been violated. If so, identify which GAAP was
violated.
a) Ballantree Enterprises Inc. is being sued by environmental activists. There is more than a 95%
chance that the company will suffer a multimillion dollar loss as a result of the lawsuit. However,
since the verdict still has not been announced, Ballantree decides that it will not disclose the
lawsuit.
Full Disclosure Principle
b) Rezlick Co. decides to use “hypothetical value accounting.” It estimates the amount of sales it
expects to have in future periods, computes the present value of those sales, and records the
present value as current period revenues.
Revenue Recognition Principle
c) Weldrick Farms Ltd. owns a 200 acre plot of land near Maryland. The land was purchased for a
mere $10 million, but now is worth over $200 million. The company decides to state the value of
the land as $200 million on its balance sheet.
Cost Principle
Your Time to Shine
In each of the following situations, determine if GAAP has been violated. If so, identify which GAAP was
violated.
a) Barton Enterprises decides to release financial statements that are inflation-adjusted.
b) Picadilly Company’s largest shareholder is Eric Wilson. When Eric bought a car for his own
personal use with his own money, Picadilly listed Eric’s car on the balance sheet.
c) Rosen Airlines Ltd. decides not to recognize depreciation expense on its planes.
The use of GAAP is crucial, as users of financial information depend on this information to make
informed decisions, however the US accounting standards vary from Canadian standards. Canada and
over 140 other jurisdictions require the use of International Financial Reporting Standards (IFRS) for
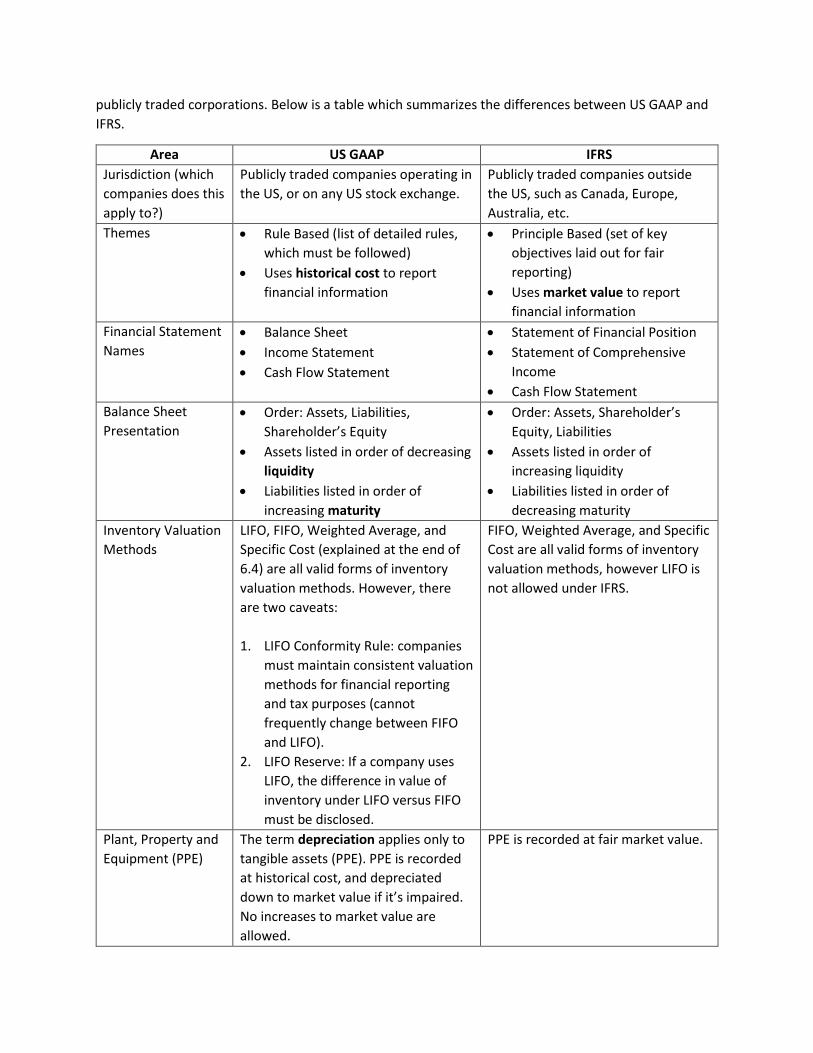
publicly traded corporations. Below is a table which summarizes the differences between US GAAP and
IFRS.
Area US GAAP IFRS
Jurisdiction (which
companies does this
apply to?)
Publicly traded companies operating in
the US, or on any US stock exchange.
Publicly traded companies outside
the US, such as Canada, Europe,
Australia, etc.
Themes • Rule Based (list of detailed rules,
which must be followed)
• Uses historical cost to report
financial information
• Principle Based (set of key
objectives laid out for fair
reporting)
• Uses market value to report
financial information
Financial Statement
Names
• Balance Sheet
• Income Statement
• Cash Flow Statement
• Statement of Financial Position
• Statement of Comprehensive
Income
• Cash Flow Statement
Balance Sheet
Presentation
• Order: Assets, Liabilities,
Shareholder’s Equity
• Assets listed in order of decreasing
liquidity
• Liabilities listed in order of
increasing maturity
• Order: Assets, Shareholder’s
Equity, Liabilities
• Assets listed in order of
increasing liquidity
• Liabilities listed in order of
decreasing maturity
Inventory Valuation
Methods
LIFO, FIFO, Weighted Average, and
Specific Cost (explained at the end of
6.4) are all valid forms of inventory
valuation methods. However, there
are two caveats:
1. LIFO Conformity Rule: companies
must maintain consistent valuation
methods for financial reporting
and tax purposes (cannot
frequently change between FIFO
and LIFO).
2. LIFO Reserve: If a company uses
LIFO, the difference in value of
inventory under LIFO versus FIFO
must be disclosed.
FIFO, Weighted Average, and Specific
Cost are all valid forms of inventory
valuation methods, however LIFO is
not allowed under IFRS.
Plant, Property and
Equipment (PPE)
The term depreciation applies only to
tangible assets (PPE). PPE is recorded
at historical cost, and depreciated
down to market value if it’s impaired.
No increases to market value are
allowed.
PPE is recorded at fair market value.
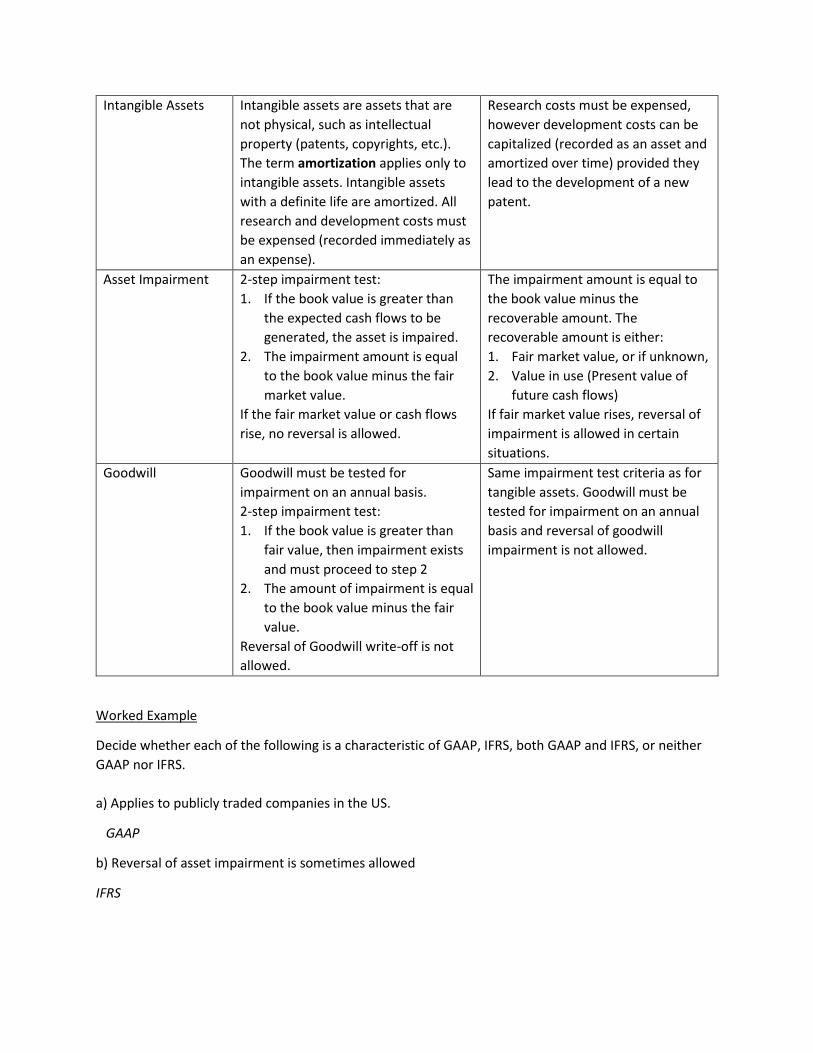
Intangible Assets Intangible assets are assets that are
not physical, such as intellectual
property (patents, copyrights, etc.).
The term amortization applies only to
intangible assets. Intangible assets
with a definite life are amortized. All
research and development costs must
be expensed (recorded immediately as
an expense).
Research costs must be expensed,
however development costs can be
capitalized (recorded as an asset and
amortized over time) provided they
lead to the development of a new
patent.
Asset Impairment
2-step impairment test:
1. If the book value is greater than
the expected cash flows to be
generated, the asset is impaired.
2. The impairment amount is equal
to the book value minus the fair
market value.
If the fair market value or cash flows
rise, no reversal is allowed.
The impairment amount is equal to
the book value minus the
recoverable amount. The
recoverable amount is either:
1. Fair market value, or if unknown,
2. Value in use (Present value of
future cash flows)
If fair market value rises, reversal of
impairment is allowed in certain
situations.
Goodwill Goodwill must be tested for
impairment on an annual basis.
2-step impairment test:
1. If the book value is greater than
fair value, then impairment exists
and must proceed to step 2
2. The amount of impairment is equal
to the book value minus the fair
value.
Reversal of Goodwill write-off is not
allowed.
Same impairment test criteria as for
tangible assets. Goodwill must be
tested for impairment on an annual
basis and reversal of goodwill
impairment is not allowed.
Worked Example
Decide whether each of the following is a characteristic of GAAP, IFRS, both GAAP and IFRS, or neither
GAAP nor IFRS.
a) Applies to publicly traded companies in the US.
GAAP
b) Reversal of asset impairment is sometimes allowed
IFRS
Your Time to Shine
Decide whether each of the following is a characteristic of GAAP, IFRS, both GAAP and IFRS, or neither
GAAP nor IFRS.
a) LIFO is not allowed.
b) The use of the Modified Accelerated Cost Recovery System (MACRS) is allowed for computing
depreciation
7.2 The Accounting Statements
Every business must keep track of its financial transactions in order to accurately report its financial
positions at the end of each fiscal period. This is done through a general journal. A general journal is
where transactions in an organization are originally recorded and organized in a chronological order.
First, the debits are recorded in a transaction, followed by the credits. For example, when a company
makes a sale, acquires new inventory, or buys a new truck, it is all recorded in the general journal.
General Journal
The general journal (as illustrated on the next page), consists of 5 columns. The first column shows the
date. The year is stated once at the top per page, as well as the month, with the day of the month
copied out for each transaction. The month or year is only written when a new one has begun, or a new
page in the general journal is being used. The next column shows the account name, which simply states
the accounts that were affected by the transaction. Third is the P.R. column, referring to page reference.
Each account (e.g. cash, bank loan, sales, etc.) has its own general ledger (further explained later in this
section). The page reference is the account’s number, so that an accountant may easily refer between
the general journal and ledger. Refer to Figure 6.2.1 for numbering accounts.
Following the P.R. column, there are the debit and credit columns. Double-entry accounting requires at
least two accounts to be affected every transaction. One of the two accounts will receive a debit
transaction which affects the “left” side of an account, while the other receives a credit transaction
which affects the “right” side of an account. The total monetary value of the debits and credits must
balance out, regardless of the number of affected accounts. Assets and Expenses have a natural debit
balance, and Liabilities, Equity and Revenues have a natural credit balance. This means a debit entry
increases Assets and Expenses, and decreases Liabilities, Equity and Revenue, whereas credits have the
opposite effects on each of these accounts. For example, when there are two accounts affected by a
transaction like on August 1st and 7th in Figure 6.2.2, the debit and credit columns show the same value,
hence balancing the debits and credits. However, the transaction on August 9th, consists of more than 2
accounts as we have a new truck worth $25,000, which is a debit to assets, but we paid $10,000 cash for
it, which is a credit to assets. This means the overall assets of the organization increased by $15,000.
$15,000 of the value of the truck was agreed to be paid back over one month, so the liability account,
accounts payable, is increased by applying a credit of $15,000, which brings out total credits up to
$25,000, to match the debit value.
Account Type Account Number Description
Assets 100-199 Anything with monetary value a business owns (e.g. a car)
Liabilities 200-299 Money the business owes to creditors; a debt (e.g. a bank loan)
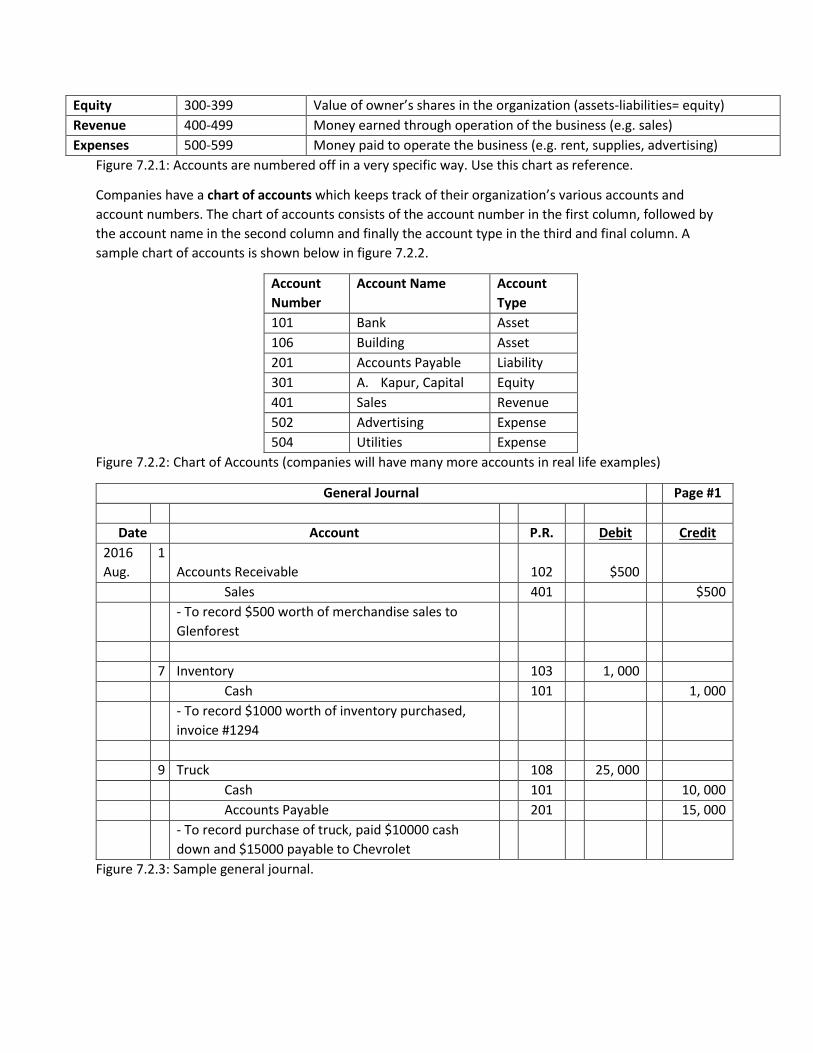
Equity 300-399 Value of owner’s shares in the organization (assets-liabilities= equity)
Revenue 400-499 Money earned through operation of the business (e.g. sales)
Expenses 500-599 Money paid to operate the business (e.g. rent, supplies, advertising)
Figure 7.2.1: Accounts are numbered off in a very specific way. Use this chart as reference.
Companies have a chart of accounts which keeps track of their organization’s various accounts and
account numbers. The chart of accounts consists of the account number in the first column, followed by
the account name in the second column and finally the account type in the third and final column. A
sample chart of accounts is shown below in figure 7.2.2.
Account
Number
Account Name Account
Type
101 Bank Asset
106 Building Asset
201 Accounts Payable Liability
301 A. Kapur, Capital Equity
401 Sales Revenue
502 Advertising Expense
504 Utilities Expense
Figure 7.2.2: Chart of Accounts (companies will have many more accounts in real life examples)
General Journal Page #1
Date Account P.R. Debit Credit
2016
Aug.
1
Accounts Receivable
102
$500
Sales 401 $500
- To record $500 worth of merchandise sales to
Glenforest
7 Inventory 103 1, 000
Cash 101 1, 000
- To record $1000 worth of inventory purchased,
invoice #1294
9 Truck 108 25, 000
Cash 101 10, 000
Accounts Payable 201 15, 000
- To record purchase of truck, paid $10000 cash
down and $15000 payable to Chevrolet
Figure 7.2.3: Sample general journal.
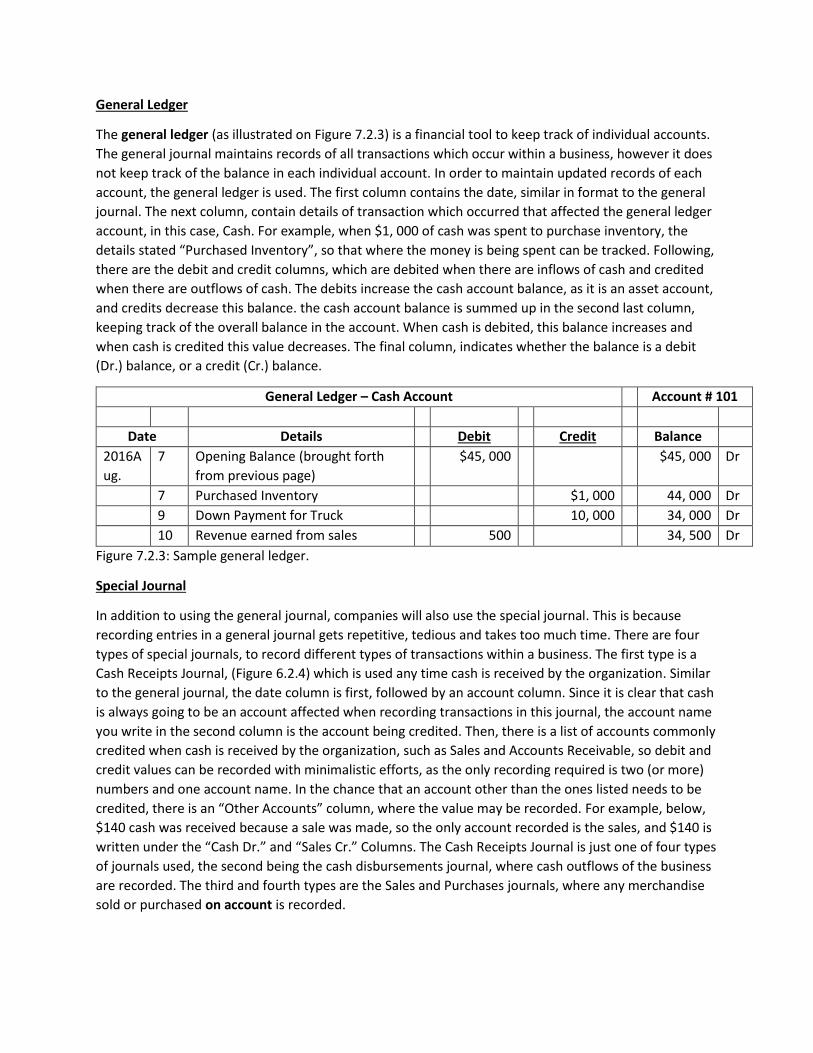
General Ledger
The general ledger (as illustrated on Figure 7.2.3) is a financial tool to keep track of individual accounts.
The general journal maintains records of all transactions which occur within a business, however it does
not keep track of the balance in each individual account. In order to maintain updated records of each
account, the general ledger is used. The first column contains the date, similar in format to the general
journal. The next column, contain details of transaction which occurred that affected the general ledger
account, in this case, Cash. For example, when $1, 000 of cash was spent to purchase inventory, the
details stated “Purchased Inventory”, so that where the money is being spent can be tracked. Following,
there are the debit and credit columns, which are debited when there are inflows of cash and credited
when there are outflows of cash. The debits increase the cash account balance, as it is an asset account,
and credits decrease this balance. the cash account balance is summed up in the second last column,
keeping track of the overall balance in the account. When cash is debited, this balance increases and
when cash is credited this value decreases. The final column, indicates whether the balance is a debit
(Dr.) balance, or a credit (Cr.) balance.
General Ledger – Cash Account Account # 101
Date Details Debit Credit Balance
2016A
ug.
7 Opening Balance (brought forth
from previous page)
$45, 000 $45, 000 Dr
7 Purchased Inventory $1, 000 44, 000 Dr
9 Down Payment for Truck 10, 000 34, 000 Dr
10 Revenue earned from sales 500 34, 500 Dr
Figure 7.2.3: Sample general ledger.
Special Journal
In addition to using the general journal, companies will also use the special journal. This is because
recording entries in a general journal gets repetitive, tedious and takes too much time. There are four
types of special journals, to record different types of transactions within a business. The first type is a
Cash Receipts Journal, (Figure 6.2.4) which is used any time cash is received by the organization. Similar
to the general journal, the date column is first, followed by an account column. Since it is clear that cash
is always going to be an account affected when recording transactions in this journal, the account name
you write in the second column is the account being credited. Then, there is a list of accounts commonly
credited when cash is received by the organization, such as Sales and Accounts Receivable, so debit and
credit values can be recorded with minimalistic efforts, as the only recording required is two (or more)
numbers and one account name. In the chance that an account other than the ones listed needs to be
credited, there is an “Other Accounts” column, where the value may be recorded. For example, below,
$140 cash was received because a sale was made, so the only account recorded is the sales, and $140 is
written under the “Cash Dr.” and “Sales Cr.” Columns. The Cash Receipts Journal is just one of four types
of journals used, the second being the cash disbursements journal, where cash outflows of the business
are recorded. The third and fourth types are the Sales and Purchases journals, where any merchandise
sold or purchased on account is recorded.
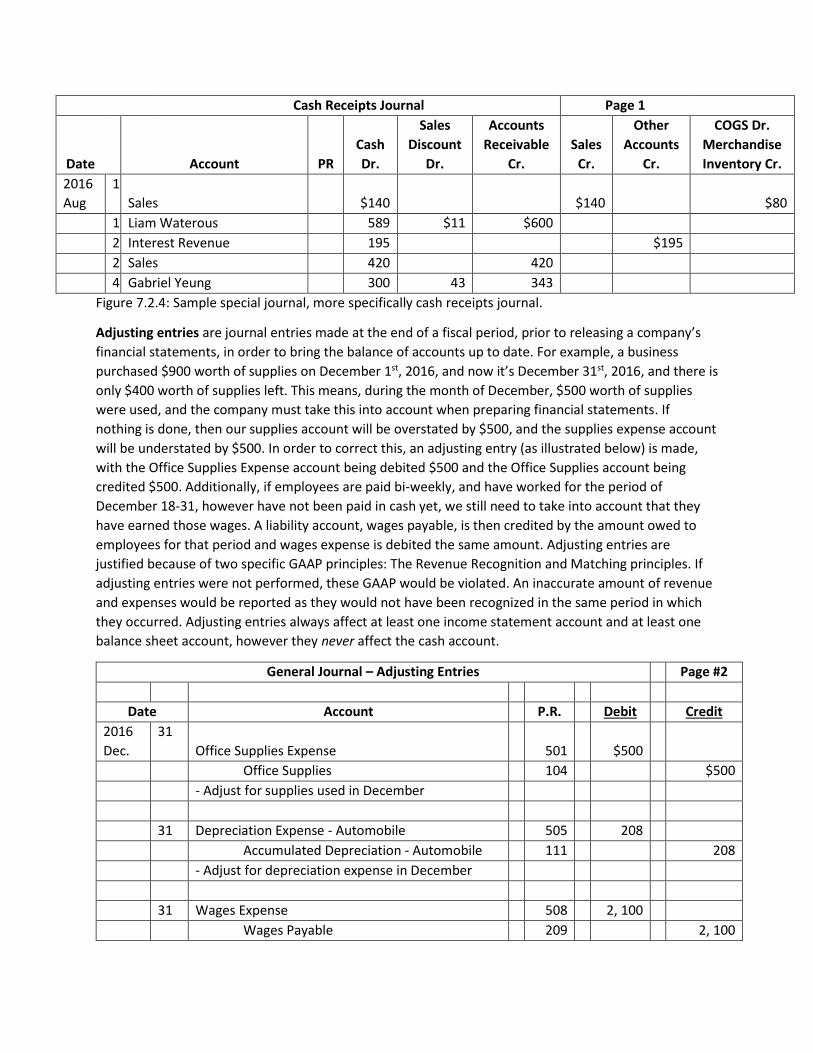
Cash Receipts Journal Page 1
Date
Account
PR
Cash
Dr.
Sales
Discount
Dr.
Accounts
Receivable
Cr.
Sales
Cr.
Other
Accounts
Cr.
COGS Dr.
Merchandise
Inventory Cr.
2016
Aug
1
Sales
$140
$140
$80
1 Liam Waterous 589 $11 $600
2 Interest Revenue 195 $195
2 Sales 420 420
4 Gabriel Yeung 300 43 343
Figure 7.2.4: Sample special journal, more specifically cash receipts journal.
Adjusting entries are journal entries made at the end of a fiscal period, prior to releasing a company’s
financial statements, in order to bring the balance of accounts up to date. For example, a business
purchased $900 worth of supplies on December 1st, 2016, and now it’s December 31st, 2016, and there is
only $400 worth of supplies left. This means, during the month of December, $500 worth of supplies
were used, and the company must take this into account when preparing financial statements. If
nothing is done, then our supplies account will be overstated by $500, and the supplies expense account
will be understated by $500. In order to correct this, an adjusting entry (as illustrated below) is made,
with the Office Supplies Expense account being debited $500 and the Office Supplies account being
credited $500. Additionally, if employees are paid bi-weekly, and have worked for the period of
December 18-31, however have not been paid in cash yet, we still need to take into account that they
have earned those wages. A liability account, wages payable, is then credited by the amount owed to
employees for that period and wages expense is debited the same amount. Adjusting entries are
justified because of two specific GAAP principles: The Revenue Recognition and Matching principles. If
adjusting entries were not performed, these GAAP would be violated. An inaccurate amount of revenue
and expenses would be reported as they would not have been recognized in the same period in which
they occurred. Adjusting entries always affect at least one income statement account and at least one
balance sheet account, however they never affect the cash account.
General Journal – Adjusting Entries Page #2
Date Account P.R. Debit Credit
2016
Dec.
31
Office Supplies Expense
501
$500
Office Supplies 104 $500
- Adjust for supplies used in December
31 Depreciation Expense - Automobile 505 208
Accumulated Depreciation - Automobile 111 208
- Adjust for depreciation expense in December
31 Wages Expense 508 2, 100
Wages Payable 209 2, 100
- To adjust for accrued wages for December
Figure 7.2.5: Sample general journal with adjusting entries.
Remember to always adjust your entries to prevent overstating or understating the values of your
accounts for the fiscal period.
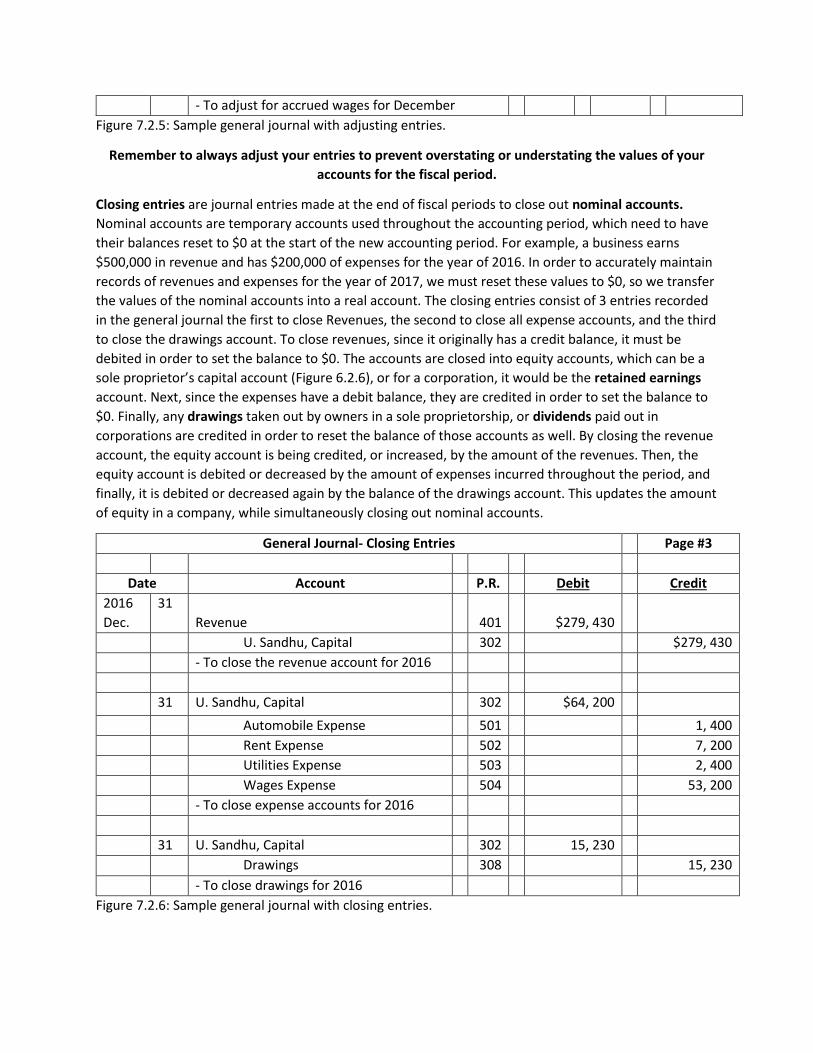
Closing entries are journal entries made at the end of fiscal periods to close out nominal accounts.
Nominal accounts are temporary accounts used throughout the accounting period, which need to have
their balances reset to $0 at the start of the new accounting period. For example, a business earns
$500,000 in revenue and has $200,000 of expenses for the year of 2016. In order to accurately maintain
records of revenues and expenses for the year of 2017, we must reset these values to $0, so we transfer
the values of the nominal accounts into a real account. The closing entries consist of 3 entries recorded
in the general journal the first to close Revenues, the second to close all expense accounts, and the third
to close the drawings account. To close revenues, since it originally has a credit balance, it must be
debited in order to set the balance to $0. The accounts are closed into equity accounts, which can be a
sole proprietor’s capital account (Figure 6.2.6), or for a corporation, it would be the retained earnings
account. Next, since the expenses have a debit balance, they are credited in order to set the balance to
$0. Finally, any drawings taken out by owners in a sole proprietorship, or dividends paid out in
corporations are credited in order to reset the balance of those accounts as well. By closing the revenue
account, the equity account is being credited, or increased, by the amount of the revenues. Then, the
equity account is debited or decreased by the amount of expenses incurred throughout the period, and
finally, it is debited or decreased again by the balance of the drawings account. This updates the amount
of equity in a company, while simultaneously closing out nominal accounts.
General Journal- Closing Entries Page #3
Date Account P.R. Debit Credit
2016
Dec.
31
Revenue
401
$279, 430
U. Sandhu, Capital 302 $279, 430
- To close the revenue account for 2016
31 U. Sandhu, Capital 302 $64, 200
Automobile Expense 501 1, 400
Rent Expense 502 7, 200
Utilities Expense 503 2, 400
Wages Expense 504 53, 200
- To close expense accounts for 2016
31 U. Sandhu, Capital 302 15, 230
Drawings 308 15, 230
- To close drawings for 2016
Figure 7.2.6: Sample general journal with closing entries.
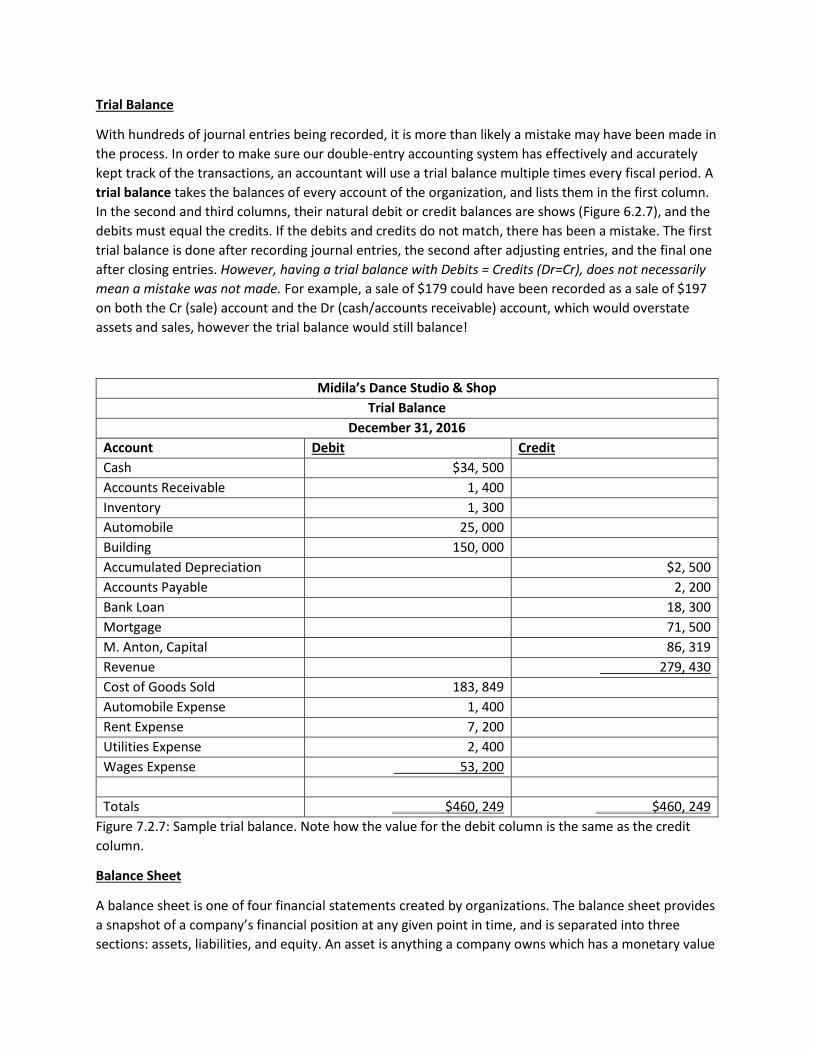
Trial Balance
With hundreds of journal entries being recorded, it is more than likely a mistake may have been made in
the process. In order to make sure our double-entry accounting system has effectively and accurately
kept track of the transactions, an accountant will use a trial balance multiple times every fiscal period. A
trial balance takes the balances of every account of the organization, and lists them in the first column.
In the second and third columns, their natural debit or credit balances are shows (Figure 6.2.7), and the
debits must equal the credits. If the debits and credits do not match, there has been a mistake. The first
trial balance is done after recording journal entries, the second after adjusting entries, and the final one
after closing entries. However, having a trial balance with Debits = Credits (Dr=Cr), does not necessarily
mean a mistake was not made. For example, a sale of $179 could have been recorded as a sale of $197
on both the Cr (sale) account and the Dr (cash/accounts receivable) account, which would overstate
assets and sales, however the trial balance would still balance!
Midila’s Dance Studio & Shop
Trial Balance
December 31, 2016
Account Debit Credit
Cash $34, 500
Accounts Receivable 1, 400
Inventory 1, 300
Automobile 25, 000
Building 150, 000
Accumulated Depreciation $2, 500
Accounts Payable 2, 200
Bank Loan 18, 300
Mortgage 71, 500
M. Anton, Capital 86, 319
Revenue 279, 430
Cost of Goods Sold 183, 849
Automobile Expense 1, 400
Rent Expense 7, 200
Utilities Expense 2, 400
Wages Expense 53, 200
Totals $460, 249 $460, 249
Figure 7.2.7: Sample trial balance. Note how the value for the debit column is the same as the credit
column.
Balance Sheet
A balance sheet is one of four financial statements created by organizations. The balance sheet provides
a snapshot of a company’s financial position at any given point in time, and is separated into three
sections: assets, liabilities, and equity. An asset is anything a company owns which has a monetary value

and is expected to generate future economic benefits for the company, whereas liabilities are any
monetary values the company owes to creditors. Debtors are people to whom owe you money, and
creditors are people you owe money to. Equity represents the owner/shareholders’ residual claim on
the company’s assets, after the liabilities have been paid. It can be calculated using the fundamental
accounting equation. The equation is written as A = L + OE, where A=Assets, L=Liabilities and
OE=Owner’s Equity. Assets and liabilities are broken into 2 sections (Figure 6.2.8) based on liquidity or
maturity. Liquidity is the ability of an asset to be converted into cash, so highly liquid assets including
cash, accounts receivable, which is usually less than 30 or 60 days. The first asset section on the balance
sheet titled “Current Assets”, includes assets which can be liquidated within a year, whereas assets less
liquid than that are classified under “Fixed Assets”. Within each of these categories, each individual
asset is sorted by decreasing liquidity, so the most liquid assets are listed first. Maturity is similar to
liquidity, but is used for liabilities, as the maturity date refers to the date on which the liability is due.
Liabilities are classified into current liabilities and fixed liabilities, due in less than one year and more
than one year respectively. Finally, there is the equity section, which shows the beginning value of the
equity account from the start of the period, then adds net income (or subtracts net loss), and subtracts
the drawings for the period, to give you the net change in owner’s equity for the period. The net change
is summed up with the equity from the beginning of the period, to calculate the current equity of the
owner(s) in the business.
A title for any financial statement generally has the same formatting; a header with three lines. The first
line consists of the company’s name, the second contains the name of the financial statement, and the
third contains the date or date range for which the statement was made. The balance sheet consists of
three columns of numbers. The last column consists of the totals of each major category, including total
current assets, total fixed assets and total assets. Total current and fixed assets are summed up to get
total assets, so under the value of the two totals you can see a single underline meaning the $15,000 of
current assets and $465,000 of fixed assets are to be totalled. Since A=L+OE, total assets is double
underlined as its total must equal the total of liabilities and owner’s equity combined, and it’s the end of
the assets section on the balance sheet. Moving further down there are current liabilities, long-term
liabilities, and ending equity from this period which all sum up to give the total liabilities and owner’s
equity, that, according to the fundamental accounting equation should be equal to total assets. A dollar
sign is included at the top of each column, or under any underlining of numbers, and negative numbers
are indicated through the use of brackets.
The middle column of numbers on the balance sheet gives the net individual balances of balance sheet
items, meaning it shows the value of any item after additions or subtractions to the value. The first row
is where the additions and subtractions happen. The historical cost of the assets for example are taken,
then the accumulated depreciation is subtracted from that cost in order to achieve the net balance of
that individual item or account.
As seen in the first column under fixed assets values are listed, with accumulated depreciation below
indicated with brackets around it, meaning these values must be subtracted from the historical cost,
then the net value is listed in the second column. All the sums of the net values are listed in the final and
third column.

Katherine’s Bakery
Balance Sheet
December 31, 2017
Assets
Current Assets
Bank $10, 000
Accounts Receivable 2, 100
Supplies 500
Prepaid Insurance 2, 400
Total Current Assets $15,000
Fixed Assets
Equipment $70, 000
Accumulated Depreciation –Equipment (20, 000) $50, 000
Trucks $50, 000
Accumulated Depreciation – Trucks (5, 000) 45, 000
Building $400, 000
Accumulated Depreciation – Building (30, 000) 370, 000
Total Fixed Assets 465, 000
Total Assets $480, 000
Liabilities and Owner’s Equity
Current Liabilities
Accounts Payable $2, 400
Interest Payable 3, 100
Total Current Liabilities $5, 500
Long-Term Liabilities
Bank Loan Payable $35, 000
Mortgage Payable 217, 000
Total Long-Term Liabilities 252, 000
K. Li, Capital
Equity, Jan. 1, 2017 $141, 500
Add: Net Income (Loss) $153, 000
Less: Drawings (72, 000)
Net Change in Owner’s Equity 81, 000
Equity, Dec. 1, 2017 222, 500
Total Liabilities and Owner’s Equity $480, 000
Figure 7.2.8: Sample balance sheet. Note how the accounts are indented and which values the columns
are listed under.

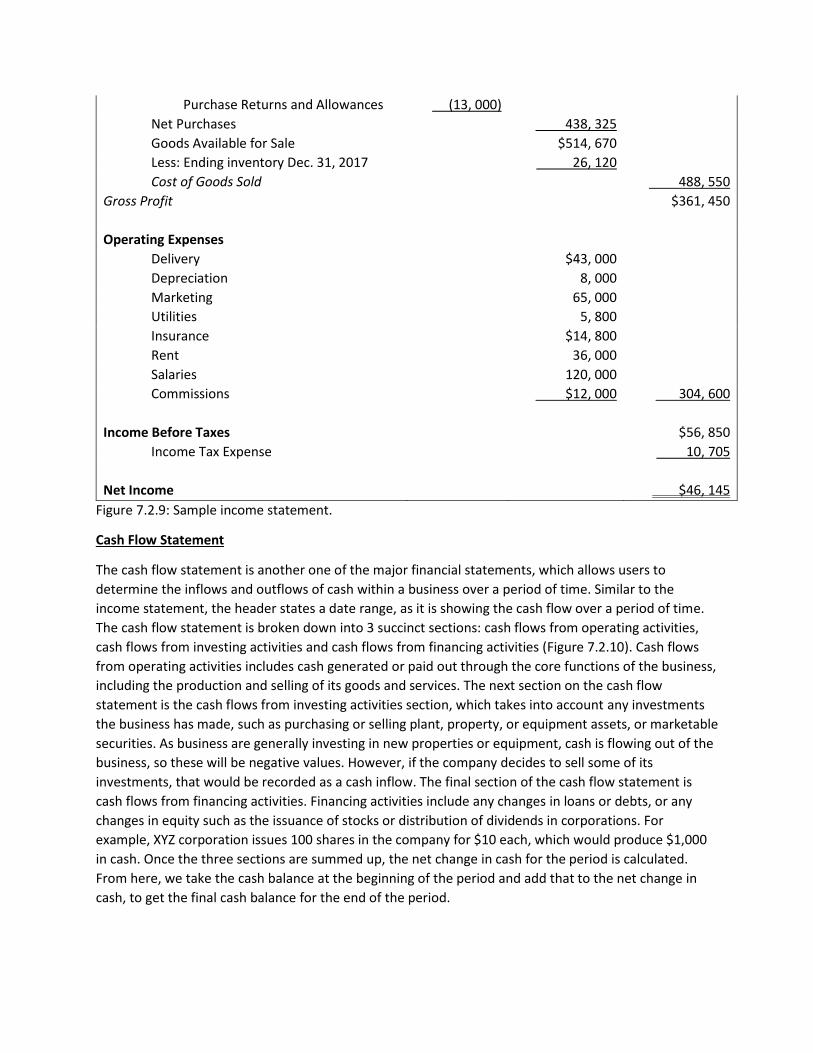
Income Statement
The income statement (Figure 7.2.9) is a financial statement used to measure how profitable a company
or business is. Also known as a profit and loss statement, the income statement measures the revenues
and expenses of a business over a period of time. The period of time may vary, for example it could be
quarterly or annually, so the date range is mentioned in the header of the income statement, stated as
“For the year ended” or “For the 3 months ended”. The first section on the income statement lists the
revenues. The total sales are listed first, then any discounts and sales returns and allowances (which are
recorded in a separate account and not directly subtracted from the sales account) are subtracted to get
net sales. In some cases, there may be additional sources of revenue, hence an additional line stating
“Net Revenues” would need to be added, but since there is only one source of revenues, we can leave it
at net sales. Next, the Cost of Goods Sold (COGS) are calculated. COGS are the direct costs incurred
while producing goods, and may not necessarily be present for businesses which only provide services.
These include the direct material costs for any products the company produces, as well as labour costs
to produce those products. To calculate these costs, the beginning inventory is taken into consideration,
as well as any additional purchases to the inventory over the period of time. The cost of shipping the
products from the supplier to us is included in inventory costs, and must be included under COGS. The
value of net purchases is then added to the beginning inventory value to determine the total amount of
inventory we have available to sell during this time period. From this, we subtract the ending inventory
value (what’s left at the end of the year), to determine how much our cost of goods sold was. From this,
we get our gross profit, which is revenues minus COGS.
In the lower portion of the income statement there are additional expenses categorized as operating
expenses. These are expenses, also known as administrative or overhead expenses, incurred by the
business throughout the year such as the ones listed on the income statement. These are subtracted
from the gross profit previously listed to get the income before taxes. This is the income amount the
government will tax (tax rates vary depending on region). And finally, once the income tax expense is
subtracted, the Net Income or Net Loss for the business is presented. The net income or loss shows the
total profitability of the business over the specified time period, indicated the total amount of profit
made or lost.
Wangster’s Art Supplies Shop
Income Statement
For the Year Ended December 31, 2017
Revenues
Sales $880, 000
Less: Sales Discounts $18, 000
Less: Sales Returns and Allowances 22, 000 30, 000
Net Sales $850, 000
Cost of Goods Sold
Beginning Inventory Jan. 1, 2017 $76, 345
Add: Purchases $443, 000
Add: Freight-In 37, 000
Less: Purchase Discounts (28, 675)
Less: Purchase Returns and Allowances (13, 000)
Net Purchases 438, 325
Goods Available for Sale $514, 670
Less: Ending inventory Dec. 31, 2017 26, 120
Cost of Goods Sold 488, 550
Gross Profit $361, 450
Operating Expenses
Delivery $43, 000
Depreciation 8, 000
Marketing 65, 000
Utilities 5, 800
Insurance $14, 800
Rent 36, 000
Salaries 120, 000
Commissions $12, 000 304, 600
Income Before Taxes $56, 850
Income Tax Expense 10, 705
Net Income $46, 145
Figure 7.2.9: Sample income statement.
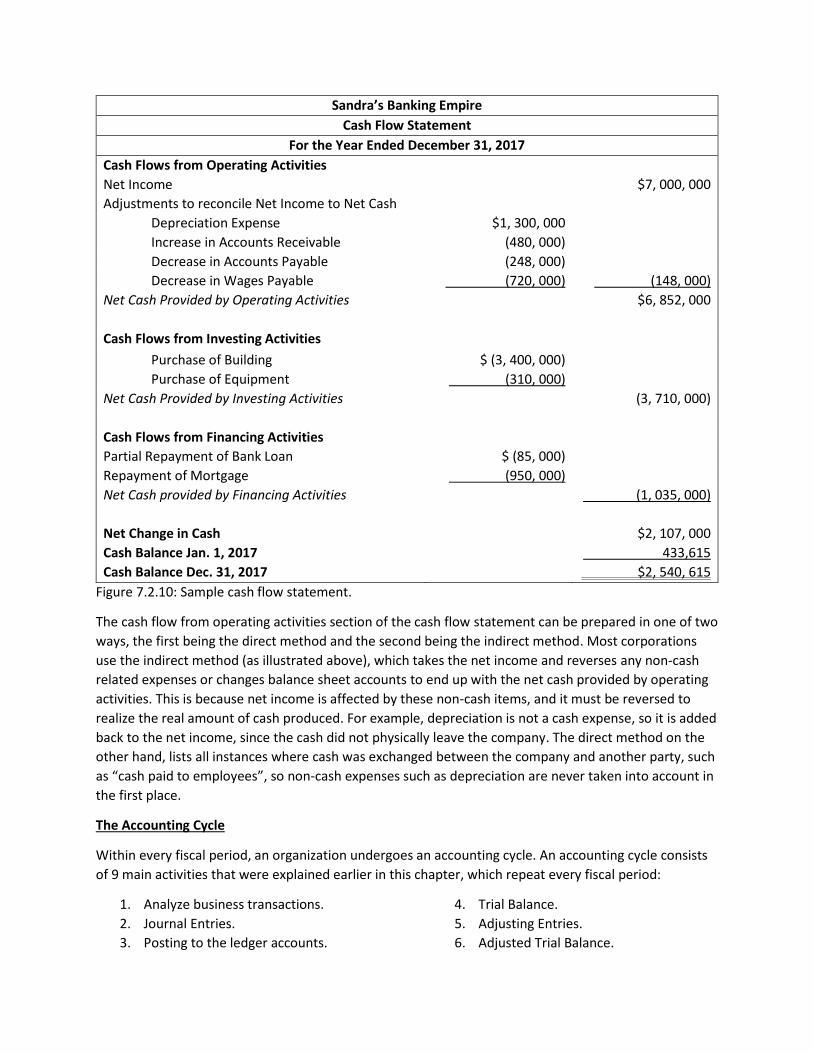
Cash Flow Statement
The cash flow statement is another one of the major financial statements, which allows users to
determine the inflows and outflows of cash within a business over a period of time. Similar to the
income statement, the header states a date range, as it is showing the cash flow over a period of time.
The cash flow statement is broken down into 3 succinct sections: cash flows from operating activities,
cash flows from investing activities and cash flows from financing activities (Figure 7.2.10). Cash flows
from operating activities includes cash generated or paid out through the core functions of the business,
including the production and selling of its goods and services. The next section on the cash flow
statement is the cash flows from investing activities section, which takes into account any investments
the business has made, such as purchasing or selling plant, property, or equipment assets, or marketable
securities. As business are generally investing in new properties or equipment, cash is flowing out of the
business, so these will be negative values. However, if the company decides to sell some of its
investments, that would be recorded as a cash inflow. The final section of the cash flow statement is
cash flows from financing activities. Financing activities include any changes in loans or debts, or any
changes in equity such as the issuance of stocks or distribution of dividends in corporations. For
example, XYZ corporation issues 100 shares in the company for $10 each, which would produce $1,000
in cash. Once the three sections are summed up, the net change in cash for the period is calculated.
From here, we take the cash balance at the beginning of the period and add that to the net change in
cash, to get the final cash balance for the end of the period.
Sandra’s Banking Empire
Cash Flow Statement
For the Year Ended December 31, 2017
Cash Flows from Operating Activities
Net Income $7, 000, 000
Adjustments to reconcile Net Income to Net Cash
Depreciation Expense $1, 300, 000
Increase in Accounts Receivable (480, 000)
Decrease in Accounts Payable (248, 000)
Decrease in Wages Payable (720, 000) (148, 000)
Net Cash Provided by Operating Activities $6, 852, 000
Cash Flows from Investing Activities
Purchase of Building $ (3, 400, 000)
Purchase of Equipment (310, 000)
Net Cash Provided by Investing Activities (3, 710, 000)
Cash Flows from Financing Activities
Partial Repayment of Bank Loan $ (85, 000)
Repayment of Mortgage (950, 000)
Net Cash provided by Financing Activities (1, 035, 000)
Net Change in Cash $2, 107, 000
Cash Balance Jan. 1, 2017 433,615
Cash Balance Dec. 31, 2017 $2, 540, 615
Figure 7.2.10: Sample cash flow statement.
The cash flow from operating activities section of the cash flow statement can be prepared in one of two
ways, the first being the direct method and the second being the indirect method. Most corporations
use the indirect method (as illustrated above), which takes the net income and reverses any non-cash
related expenses or changes balance sheet accounts to end up with the net cash provided by operating
activities. This is because net income is affected by these non-cash items, and it must be reversed to
realize the real amount of cash produced. For example, depreciation is not a cash expense, so it is added
back to the net income, since the cash did not physically leave the company. The direct method on the
other hand, lists all instances where cash was exchanged between the company and another party, such
as “cash paid to employees”, so non-cash expenses such as depreciation are never taken into account in
the first place.
The Accounting Cycle
Within every fiscal period, an organization undergoes an accounting cycle. An accounting cycle consists
of 9 main activities that were explained earlier in this chapter, which repeat every fiscal period:
1. Analyze business transactions.
2. Journal Entries.
3. Posting to the ledger accounts.
4. Trial Balance.
5. Adjusting Entries.
6. Adjusted Trial Balance.
7. Financial Statements.
8. Closing Entries.
9. Post-Closing Trial Balance.
7.3 Calculation of Financial Ratios
Financial ratios are a key component of fundamental analysis (which you will learn more about in
Chapter 10), which is one of the two main methods used to analyze an investment. Financial ratios use
figures from the financial statements issued by companies in order to achieve a better understanding of
how well the company is performing financially. A financial ratio provides a mathematical comparison
between two pieces of financial data. For example, the net profit margin ratio compares net income and
total revenues.
Ratios are useful as they can be used to compare different companies within the same industry, even if
the companies are of different sizes. Comparing the value of a ratio to an industry or sector average is
known as benchmarking. Ratios are also useful for comparing a company’s financial data to previous
years’ data. This is called horizontal analysis.
Financial ratios are classified into categories such as liquidity, profitability, and solvency. Liquidity ratios
measure how easily a business is able to meet its short-term debt obligations. Profitability ratios
measure how profitable a company is, or how efficient a company is at earnings profits given the
amount of resources they possess. Solvency ratios measure how well a business will be able to survive in
the long-term, which are useful to long term investors and creditors.
Liquidity Ratios
A) Current Ratio (Working Capital Ratio*) = 𝐶𝑢𝑟𝑟𝑒𝑛𝑡 𝐴𝑠𝑠𝑒𝑡𝑠
𝐶𝑢𝑟𝑟𝑒𝑛𝑡 𝐿𝑖𝑎𝑏𝑖𝑙𝑖𝑡𝑖𝑒𝑠
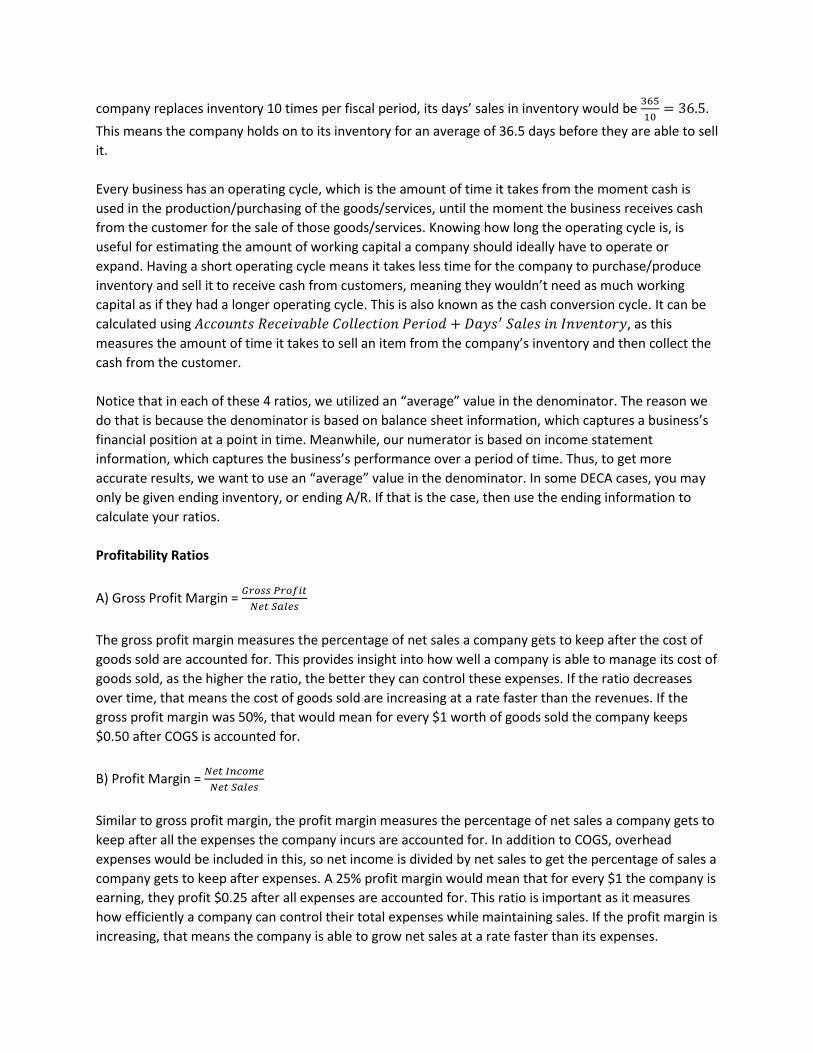
The current ratio measures a company’s ability to pay off its current debt obligations. The current ratio
divides the current assets by current liabilities, which measures how well a company can pay back
current liabilities utilizing its current assets. Generally, at least a ratio over 1 is ideal, as if it were below
1, the company has more current liabilities than it can pay back with its current assets. A ratio of 1,
would mean that for every $1 of current assets the company has, it also has $1 of current liabilities to
pay.
Note that if the Current Ratio is too high, it can be problematic. A current ratio that is too high indicates
that the company may not be effectively utilizing its cash.
*Not to be confused with “working capital”, which is equal to current assets – current liabilities.
B) Acid Test Ratio (Quick Ratio) = 𝐶𝑎𝑠ℎ+𝑀𝑎𝑟𝑘𝑒𝑡𝑎𝑏𝑙𝑒 𝑆𝑒𝑐𝑢𝑟𝑖𝑡𝑖𝑒𝑠+𝑅𝑒𝑐𝑒𝑖𝑣𝑎𝑏𝑙𝑒𝑠
𝐶𝑢𝑟𝑟𝑒𝑛𝑡 𝐿𝑖𝑎𝑏𝑖𝑙𝑖𝑡𝑖𝑒𝑠
Similar to the current ratio, the acid test ratio measures a company’s ability to pay off its current
obligations with only its most liquid assets. Inventories are excluded from current assets in this ratio, as

they can take some time to be converted into cash, whereas the other current assets as listed above in
the equation can be converted into cash relatively quickly. A ratio of 2 would mean that a company has
$2 of current liquid assets to cover every $1 of current liabilities it has.
Efficiency Ratios
A) Receivables Turnover = 𝑁𝑒𝑡 𝐶𝑟𝑒𝑑𝑖𝑡 𝑆𝑎𝑙𝑒𝑠
𝐴𝑣𝑒𝑟𝑎𝑔𝑒 𝑁𝑒𝑡 𝑅𝑒𝑐𝑖𝑒𝑣𝑎𝑏𝑙𝑒𝑠
To calculate the average amount of any account balance, the value from the beginning of the period of
the account and value from the end of the period of the account are summed up and divided by two.
For example, if there were net receivables of $50,000 on January 1st, 2017, and $100,000 on December
31st, 2017, then the average net receivables would be $75,000. The receivables turnover ratio measures
how well a company is able to extend credit and manage it. The company extends credit to customers
recorded under “accounts receivable”, and this ratio measures how efficiently the company are able to
collect on the interest-free credit they have extended to their customers. A ratio of 12 would mean the
company collects accounts receivables 12 times per fiscal period. It can be hard for investors to calculate
the receivables turnover ratio, as many companies do not disclose how much of their sales are on credit.
As a result, analysts will often assume that 100% of the company’s sales are on credit, and consistently
apply that assumption to all fiscal periods. They will then examine the trend in the Receivables Turnover
ratio over time, rather than comparing the value of the ratio to that of other companies.
B) Collection Period = 365
𝑅𝑒𝑐𝑒𝑖𝑣𝑎𝑏𝑙𝑒𝑠 𝑇𝑢𝑟𝑛𝑜𝑣𝑒𝑟
The collection period is related to the receivables turnover ratio, as it measures the average number of
days it takes the business to collect a debt. Like in the example above, if the company collects accounts
receivables 12 times per fiscal period, it would have a collection period of 365
12= 30.4 days, meaning it
takes on average 30.4 days for the business to recollect money from an accounts receivable account.
C) Inventory Turnover = 𝐶𝑜𝑠𝑡 𝑜𝑓 𝐺𝑜𝑜𝑑𝑠 𝑆𝑜𝑙𝑑
𝐴𝑣𝑒𝑟𝑎𝑔𝑒 𝐼𝑛𝑣𝑒𝑛𝑡𝑜𝑟𝑦
Similar to the receivables turnover ratio, the inventory ratio measures how well a company is able to sell
its inventory. Generally, the more often they sell their inventory the higher their revenues will be, hence
a higher inventory turnover is desired. However, high inventory turnover can also be caused because of
decreases in price, which wouldn’t necessarily lead to more profits. Inventory turnover ratio measures
how many times a company purchases and sells its inventory in a fiscal period, or how long it takes to
completely replace the inventory. An inventory turnover ratio of 10 would mean a company replaces its
inventory 10 times per fiscal period.
D) Days’ Sales in Inventory = 365
𝐼𝑛𝑣𝑒𝑛𝑡𝑜𝑟𝑦 𝑇𝑢𝑟𝑛𝑜𝑣𝑒𝑟
The days’ sales in inventory ratio is related to the inventory turnover ratio, similar to how the collection
period is related to the receivables turnover ratio. The days’ sales in inventory measures the average
number of days it takes the business to sell a unit from its inventory. Like in the example above, if the
company replaces inventory 10 times per fiscal period, its days’ sales in inventory would be 365
10= 36.5.
This means the company holds on to its inventory for an average of 36.5 days before they are able to sell
it.
Every business has an operating cycle, which is the amount of time it takes from the moment cash is
used in the production/purchasing of the goods/services, until the moment the business receives cash
from the customer for the sale of those goods/services. Knowing how long the operating cycle is, is
useful for estimating the amount of working capital a company should ideally have to operate or
expand. Having a short operating cycle means it takes less time for the company to purchase/produce
inventory and sell it to receive cash from customers, meaning they wouldn’t need as much working
capital as if they had a longer operating cycle. This is also known as the cash conversion cycle. It can be
calculated using 𝐴𝑐𝑐𝑜𝑢𝑛𝑡𝑠 𝑅𝑒𝑐𝑒𝑖𝑣𝑎𝑏𝑙𝑒 𝐶𝑜𝑙𝑙𝑒𝑐𝑡𝑖𝑜𝑛 𝑃𝑒𝑟𝑖𝑜𝑑 + 𝐷𝑎𝑦𝑠′ 𝑆𝑎𝑙𝑒𝑠 𝑖𝑛 𝐼𝑛𝑣𝑒𝑛𝑡𝑜𝑟𝑦, as this
measures the amount of time it takes to sell an item from the company’s inventory and then collect the
cash from the customer.
Notice that in each of these 4 ratios, we utilized an “average” value in the denominator. The reason we
do that is because the denominator is based on balance sheet information, which captures a business’s
financial position at a point in time. Meanwhile, our numerator is based on income statement
information, which captures the business’s performance over a period of time. Thus, to get more
accurate results, we want to use an “average” value in the denominator. In some DECA cases, you may
only be given ending inventory, or ending A/R. If that is the case, then use the ending information to
calculate your ratios.
Profitability Ratios
A) Gross Profit Margin = 𝐺𝑟𝑜𝑠𝑠 𝑃𝑟𝑜𝑓𝑖𝑡
𝑁𝑒𝑡 𝑆𝑎𝑙𝑒𝑠
The gross profit margin measures the percentage of net sales a company gets to keep after the cost of
goods sold are accounted for. This provides insight into how well a company is able to manage its cost of
goods sold, as the higher the ratio, the better they can control these expenses. If the ratio decreases
over time, that means the cost of goods sold are increasing at a rate faster than the revenues. If the
gross profit margin was 50%, that would mean for every $1 worth of goods sold the company keeps
$0.50 after COGS is accounted for.
B) Profit Margin = 𝑁𝑒𝑡 𝐼𝑛𝑐𝑜𝑚𝑒
𝑁𝑒𝑡 𝑆𝑎𝑙𝑒𝑠
Similar to gross profit margin, the profit margin measures the percentage of net sales a company gets to
keep after all the expenses the company incurs are accounted for. In addition to COGS, overhead
expenses would be included in this, so net income is divided by net sales to get the percentage of sales a
company gets to keep after expenses. A 25% profit margin would mean that for every $1 the company is
earning, they profit $0.25 after all expenses are accounted for. This ratio is important as it measures
how efficiently a company can control their total expenses while maintaining sales. If the profit margin is
increasing, that means the company is able to grow net sales at a rate faster than its expenses.
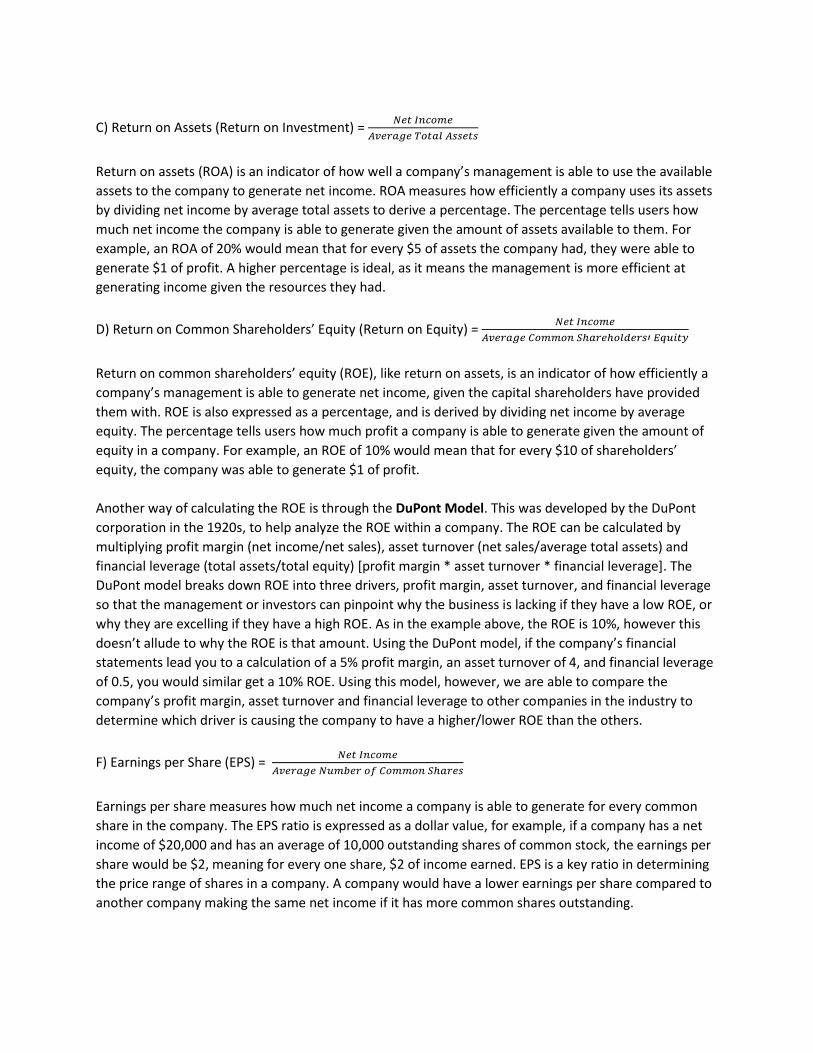
C) Return on Assets (Return on Investment) = 𝑁𝑒𝑡 𝐼𝑛𝑐𝑜𝑚𝑒
𝐴𝑣𝑒𝑟𝑎𝑔𝑒 𝑇𝑜𝑡𝑎𝑙 𝐴𝑠𝑠𝑒𝑡𝑠
Return on assets (ROA) is an indicator of how well a company’s management is able to use the available
assets to the company to generate net income. ROA measures how efficiently a company uses its assets
by dividing net income by average total assets to derive a percentage. The percentage tells users how
much net income the company is able to generate given the amount of assets available to them. For
example, an ROA of 20% would mean that for every $5 of assets the company had, they were able to
generate $1 of profit. A higher percentage is ideal, as it means the management is more efficient at
generating income given the resources they had.
D) Return on Common Shareholders’ Equity (Return on Equity) = 𝑁𝑒𝑡 𝐼𝑛𝑐𝑜𝑚𝑒
𝐴𝑣𝑒𝑟𝑎𝑔𝑒 𝐶𝑜𝑚𝑚𝑜𝑛 𝑆ℎ𝑎𝑟𝑒ℎ𝑜𝑙𝑑𝑒𝑟𝑠′ 𝐸𝑞𝑢𝑖𝑡𝑦
Return on common shareholders’ equity (ROE), like return on assets, is an indicator of how efficiently a
company’s management is able to generate net income, given the capital shareholders have provided
them with. ROE is also expressed as a percentage, and is derived by dividing net income by average
equity. The percentage tells users how much profit a company is able to generate given the amount of
equity in a company. For example, an ROE of 10% would mean that for every $10 of shareholders’
equity, the company was able to generate $1 of profit.
Another way of calculating the ROE is through the DuPont Model. This was developed by the DuPont
corporation in the 1920s, to help analyze the ROE within a company. The ROE can be calculated by
multiplying profit margin (net income/net sales), asset turnover (net sales/average total assets) and
financial leverage (total assets/total equity) [profit margin * asset turnover * financial leverage]. The
DuPont model breaks down ROE into three drivers, profit margin, asset turnover, and financial leverage
so that the management or investors can pinpoint why the business is lacking if they have a low ROE, or
why they are excelling if they have a high ROE. As in the example above, the ROE is 10%, however this
doesn’t allude to why the ROE is that amount. Using the DuPont model, if the company’s financial
statements lead you to a calculation of a 5% profit margin, an asset turnover of 4, and financial leverage
of 0.5, you would similar get a 10% ROE. Using this model, however, we are able to compare the
company’s profit margin, asset turnover and financial leverage to other companies in the industry to
determine which driver is causing the company to have a higher/lower ROE than the others.
F) Earnings per Share (EPS) = 𝑁𝑒𝑡 𝐼𝑛𝑐𝑜𝑚𝑒
𝐴𝑣𝑒𝑟𝑎𝑔𝑒 𝑁𝑢𝑚𝑏𝑒𝑟 𝑜𝑓 𝐶𝑜𝑚𝑚𝑜𝑛 𝑆ℎ𝑎𝑟𝑒𝑠
Earnings per share measures how much net income a company is able to generate for every common
share in the company. The EPS ratio is expressed as a dollar value, for example, if a company has a net
income of $20,000 and has an average of 10,000 outstanding shares of common stock, the earnings per
share would be $2, meaning for every one share, $2 of income earned. EPS is a key ratio in determining
the price range of shares in a company. A company would have a lower earnings per share compared to
another company making the same net income if it has more common shares outstanding.
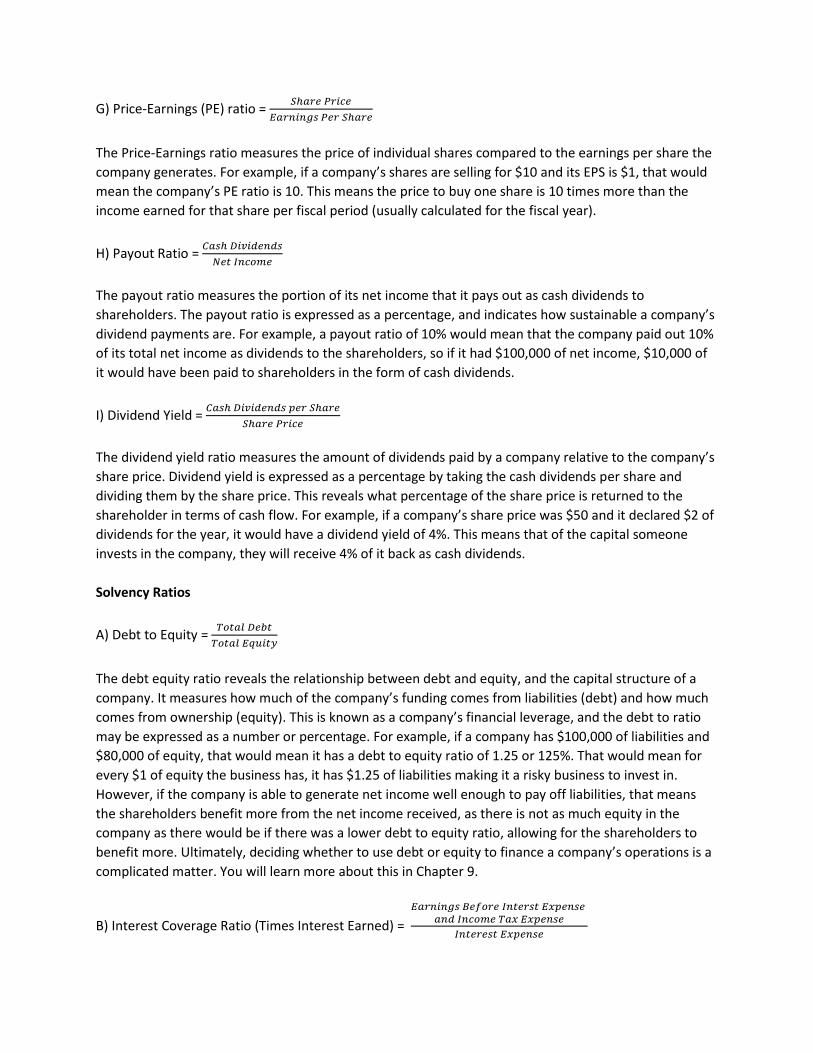
G) Price-Earnings (PE) ratio = 𝑆ℎ𝑎𝑟𝑒 𝑃𝑟𝑖𝑐𝑒
𝐸𝑎𝑟𝑛𝑖𝑛𝑔𝑠 𝑃𝑒𝑟 𝑆ℎ𝑎𝑟𝑒
The Price-Earnings ratio measures the price of individual shares compared to the earnings per share the
company generates. For example, if a company’s shares are selling for $10 and its EPS is $1, that would
mean the company’s PE ratio is 10. This means the price to buy one share is 10 times more than the
income earned for that share per fiscal period (usually calculated for the fiscal year).
H) Payout Ratio = 𝐶𝑎𝑠ℎ 𝐷𝑖𝑣𝑖𝑑𝑒𝑛𝑑𝑠
𝑁𝑒𝑡 𝐼𝑛𝑐𝑜𝑚𝑒
The payout ratio measures the portion of its net income that it pays out as cash dividends to
shareholders. The payout ratio is expressed as a percentage, and indicates how sustainable a company’s
dividend payments are. For example, a payout ratio of 10% would mean that the company paid out 10%
of its total net income as dividends to the shareholders, so if it had $100,000 of net income, $10,000 of
it would have been paid to shareholders in the form of cash dividends.
I) Dividend Yield = 𝐶𝑎𝑠ℎ 𝐷𝑖𝑣𝑖𝑑𝑒𝑛𝑑𝑠 𝑝𝑒𝑟 𝑆ℎ𝑎𝑟𝑒
𝑆ℎ𝑎𝑟𝑒 𝑃𝑟𝑖𝑐𝑒
The dividend yield ratio measures the amount of dividends paid by a company relative to the company’s
share price. Dividend yield is expressed as a percentage by taking the cash dividends per share and
dividing them by the share price. This reveals what percentage of the share price is returned to the
shareholder in terms of cash flow. For example, if a company’s share price was $50 and it declared $2 of
dividends for the year, it would have a dividend yield of 4%. This means that of the capital someone
invests in the company, they will receive 4% of it back as cash dividends.
Solvency Ratios
A) Debt to Equity = 𝑇𝑜𝑡𝑎𝑙 𝐷𝑒𝑏𝑡
𝑇𝑜𝑡𝑎𝑙 𝐸𝑞𝑢𝑖𝑡𝑦
The debt equity ratio reveals the relationship between debt and equity, and the capital structure of a
company. It measures how much of the company’s funding comes from liabilities (debt) and how much
comes from ownership (equity). This is known as a company’s financial leverage, and the debt to ratio
may be expressed as a number or percentage. For example, if a company has $100,000 of liabilities and
$80,000 of equity, that would mean it has a debt to equity ratio of 1.25 or 125%. That would mean for
every $1 of equity the business has, it has $1.25 of liabilities making it a risky business to invest in.
However, if the company is able to generate net income well enough to pay off liabilities, that means
the shareholders benefit more from the net income received, as there is not as much equity in the
company as there would be if there was a lower debt to equity ratio, allowing for the shareholders to
benefit more. Ultimately, deciding whether to use debt or equity to finance a company’s operations is a
complicated matter. You will learn more about this in Chapter 9.
B) Interest Coverage Ratio (Times Interest Earned) =
𝐸𝑎𝑟𝑛𝑖𝑛𝑔𝑠 𝐵𝑒𝑓𝑜𝑟𝑒 𝐼𝑛𝑡𝑒𝑟𝑠𝑡 𝐸𝑥𝑝𝑒𝑛𝑠𝑒 𝑎𝑛𝑑 𝐼𝑛𝑐𝑜𝑚𝑒 𝑇𝑎𝑥 𝐸𝑥𝑝𝑒𝑛𝑠𝑒
𝐼𝑛𝑡𝑒𝑟𝑒𝑠𝑡 𝐸𝑥𝑝𝑒𝑛𝑠𝑒
The interest coverage ratio measures how well a company is able to meet its interest obligations on
loans it has taken out. The is derived by taking earnings before interest and tax (EBIT) expenses, and
dividing it by the interest expense. This reveals how many times over the company is able to pay its
interest expense. For example, if a company had EBIT of $50,000 and $5,000 of interest expense, it
would have an interest coverage ratio of 10. This means the company would be able to pay off its
interest obligations 10 times and is in a relatively good solvency position and not likely to have to file
bankruptcy.
7.4 Managerial Accounting
Unlike financial accounting, which focuses on getting financial data and information to external users,
managerial accounting focuses on providing internal users with useful financial data to help
management make decisions. In managerial accounting, there are several techniques accountants use to
analyze different parts of the business.
One of the techniques used in managerial accounting is product costing, which assigns costs to each
input used in production to determine the total cost of making one unit of a good. For example, consider
the case of Gabriel’s Stationary, a business with multiple products. The management wants to find out
what price to set each of these products, such as one pencil, so they use product costing. Product
costing determines the cost of raw materials, labour, rent, machinery, utilities and any other costs that
are allocated to the production of a single pencil. Costs such as rent and utilities can be difficult to
measure for each product, however it can be divided up based on, for example, the number square feet
the production of pencils is taking. Let’s say there was $0.20 of raw materials, $0.25 of labour and $0.25
of all other costs. This would make a single pencil cost $0.70, so now management can accurately price it
based on the company’s goals and how much profit margin they would like.
In addition to product costing, managerial accounting uses cash flow analysis, inventory and raw
material turnover analysis, financial leverage metrics, and accounts receivable management. Cash flow
analysis analyzes the cash flow statements within a company, and tries to delay cash outlays and speed-
up cash inflows. Cash flow analysis also analyzes cash flow for areas of improvement and creates cash
flow budgets, which are projections of cash flow for future years. Inventory and raw material turnover
analysis takes a look at how often a company sells its inventory and has to replace it along with raw
materials required in the production of the inventory. Financial leverage metrics provide insight into a
company’s capital structure, and determines how much is financed through debt and how much is
financed through equity. Accounts receivable (A/R) management oversees accounts receivables, and
attempts to collect on ones nearing their due date. A/R management is responsible for estimating the
amount of bad debt (the amount of debt the company will not be able to re-collect from customers),
and write-off the debt as necessary.
On last technique managerial accountants use is budgeting, trend and variance analysis. Budgeting
analysis takes a look at capital expenditures in a business. Accountants will use managerial accounting to
determine whether a capital expenditure is beneficial to a business, how to finance it if they decide to
move ahead with the task and how long it will take to see income generated from that capital
expenditure. Trend analysis has to do with looking at the costs and prices of goods and services over a
period of time in an attempt to discover patterns and predict future trends. Trend analysis also takes a
look at the deviations between their projected budgets and what the company actually spent, otherwise
known as variances. Variance analysis is taking a look at what management had projected versus what
outcomes actually occurred. For example, if a company has $80,000 budgeted for purchasing their raw
materials for the year, however they spend $90,000, there is a variance of $10,000. Variance analysis
would further look into the reason behind this variance, which is may be purchase price variance
meaning the price at which the materials were purchased has increased at a rate greater than expected.
Another viable reason could be a variance in quantity of production, meaning that more goods were
produced than expected. There are a variety of causes for the variances, which may include a change in
labour rates, a change in selling price, changed efficiency of the workers or a change in overhead costs.
Variance analysis is useful in managerial accounting as it specifies why management’s projections
deviated so they can better project for the future. More importantly, it pinpoints why a business’
revenues or expenses were above or below the projected amount and how they can more efficiently
operate the business to increase revenues and decrease expenses.
It can be difficult to determine how much of something to purchase or produce, but that’s where marginal analysis comes in. Marginal analysis is taking a look at an activity, and seeing how the benefits and costs would change if more or less of the activity were done. For example, a company currently produces 100,000 units of radios, but they wish to expand their business. They would do a marginal analysis to determine how much costs would increase due to the increased amount of rental space and machinery they would require, as well as an increase in utilities and raw materials, and any additional costs. Taking all the costs into consideration, they would then determine how much they stand to benefit from the expansion and increased production of radios. If an additional 100,000 units could be produced with an additional $10 of revenue each, the revenues would have to provide added benefits of at least $1 million for the company to break even on the expansion. Marginal analysis can be useful when deciding between multiple projects to choose between, such as producing the addition 100,000 units of radios or beginning an mp3 production segment of the business. Marginal analysis would analyze the additional costs and revenues, and lead management towards the one with higher profits. Costs play a big role in managerial accounting and there are a variety of types of costs. Managing costs and expenses is a crucial part of increasing the net income of a business. Costs can be analyzed on different levels such as costs per product or cost per project, which is important to report accurate information on financial statements. Some of the types of costs are as follows: Variable Cost – Variable costs vary depending on the level of output a company has. For example, a pizzeria’s electricity usage is a variable expense, as the more pizza they produce using their electric ovens, the higher the costs of electricity will be. Fixed Cost – Fixed costs are costs that do not change, regardless of the amount of production. For example, the pizzeria has to pay rent for the space they use, which is a fixed amount they have to pay whether they sell one pizza or one hundred pizzas. Note that costs are fixed only over a relevant range. If the pizzeria had to expand its operations and rent a second building, then they would have to incur more rent costs. However, the rent is still fixed per building. In this case, our relevant range is one building.
Direct Cost – Direct costs are the costs directly associated with the production of a good or service, including materials and any direct labour used to produce it. For example, a person can make 6 radios an hour, so that person’s wages and the raw materials of the radio would be the direct costs. Direct costs are a type of variable costs as they increase and decrease depending on the volume production. Indirect cost – Indirect costs are costs associated with operating the business but cannot be specifically allocated to the production of goods or services. For example, a small business uses a small amount of rental space for both their head offices and production, hence the amount electricity used only for production cannot be determined and is an indirect cost to the business. Sunk Cost – Sunk costs are costs businesses incur, usually when the business is starting up new, that have already been invested in the business and cannot be recovered. For example, a t-shirt production company needs to purchase $200,000 worth of sewing machinery to start up their business. The machinery would be a sunk cost once it is purchased, as the amount spent on machinery is an expense the business has incurred to start up and cannot be recovered. Differential Cost – Differential cost can be described as the price difference between two alternatives. For example, a business is deciding whether they should advertise in a Super Bowl commercial for $1 billion or create a different ad campaign for $750 million. The differential cost would be $250 million. Cost accounting has its own subset within managerial accounting as costs play an important role in making decisions internally. One thing cost accounting delves further into is cost drivers. A cost driver is any activity or event that causes costs to be incurred, or changes the amount of costs incurred. There are a multitude of cost drivers that a business has, such as direct labour or inventory storage costs, all which help drive up the cost of production. Cost accounting budgets are created to help with future projections of financial information within a company, such as revenues and expenses. Anticipating the amount of sales and spending of a company can be extremely useful so a company can make arrangements ahead of time, such as hiring extra labour or ordering materials needed for production ahead of time. Budgeting also limits the amount each department of a company has to spend over a period of time such as a year, which helps them maintain control over their expenses and stay on track with their financial goals as a whole. Management can also implement what is known as a rolling budget, which incrementally adds to the budget in place, every month for example, so that there is always a yearlong budget in place. For example, if a budget is for the time period of March 2017-February 2018, once April 2017 arrives, a budget for the month of March 2018 will be added into the existing budget so there will again be a one-year budget, from April 2017 – March 2018, in place. Within cost accounting, there are five types of budgets including the master, operating, cash flow, financial and static budgets. The master budget oversees the business’ finances as a whole, whereas the cash flow budget look at only the cash inflows and outflows within the business. The operating budget looks at the revenues and expenses related to the core functions of the business and makes projections for sales and costs to predict a net income. The financial budget is the management’s strategy for how they go upon managing the financial state of their company, such as how they will make use of assets or manage expenses. Finally, the static budget does not get altered throughout the year. The static budget is created at the beginning of a fiscal period and management is forced to match the budget as closely as possible to achieve a wanted outcome, which can be difficult as the budget is not flexible.

There are costing techniques management accountants use, which are different ways to allocate costs to different cost objects. Cost allocation is the assigning of costs to cost objects that are creating those costs, such as a specific product, department or project. Broadly speaking, we can classify a costing system as being either Variable Costing or Full Absorption costing. Under Variable Costing, we only allocate the direct costs to our cost object. Meanwhile, under Full Absorption costing, we assign both direct and indirect costs to our cost object. Worked Example Gupta Enterprises manufactures stethoscopes, a commonly used tool in doctor’s offices. In the month of March, Gupta paid its workers $15/hour for direct labor. Total direct labor hours were 500,000. Gupta also incurred $200,000 in direct costs related to the manufacturing of the stethoscopes. Gupta also incurred overhead of $275,000. Assuming that the stethoscopes are the only product that Gupta manufactures, determine the cost that would be assigned to the stethoscopes under:
(a) Direct costing Under this method, we only consider direct costs. Thus, the cost we would assign to the stethoscopes would be $15/hour* 500,000 hours + $200,000 = $7,700,000
(b) Full Absorption costing Under this method, we have to consider both our direct and indirect costs. Thus, the cost we would assign to the stethoscopes would be $15/hour* 500,000 hours + $200,000+$275,000 = $7,975,000
Your Time to Shine
Gupta Enterprises manufactures stethoscopes, a commonly used tool in doctor’s offices. In the month of April, labor costs fell to $10/hour for direct labor. Total direct labor hours increased to 600,000. Gupta also incurred $250,000 in direct costs related to the manufacturing of the stethoscopes. Gupta also incurred overhead of $150,000. Assuming that the stethoscopes are the only product that Gupta manufactures, determine the cost that would be assigned to the stethoscopes under:
(a) Direct costing
(b) Full Absorption costing
As you can see, using Full Absorption costing is more accurate because it takes into account indirect costs. In reality, companies have multiple products. How do we allocate the costs among different products? Here, we introduce two types of allocation methods: traditional costing and Activity-Based Costing (ABC). Traditional costing groups on the indirect expenses together into a single cost pool. These costs are then allocated using a single cost driver. For example, the company may choose to allocate costs using direct labor hours, or machine hours, or direct labor dollars, or machine dollars. Regardless of which cost driver is chosen, we can generalize that under traditional costing, the amount of overhead allocated to a product is proportional to the amount of use of the cost driver in the production of that good.
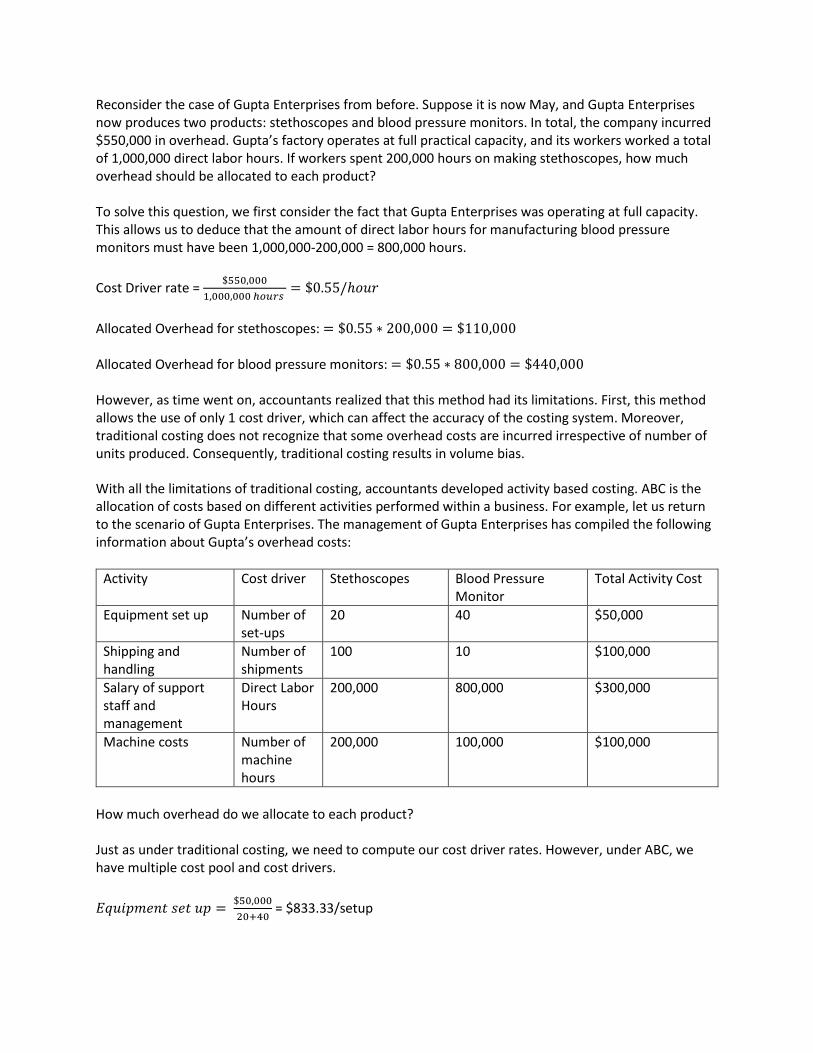
Reconsider the case of Gupta Enterprises from before. Suppose it is now May, and Gupta Enterprises now produces two products: stethoscopes and blood pressure monitors. In total, the company incurred $550,000 in overhead. Gupta’s factory operates at full practical capacity, and its workers worked a total of 1,000,000 direct labor hours. If workers spent 200,000 hours on making stethoscopes, how much overhead should be allocated to each product? To solve this question, we first consider the fact that Gupta Enterprises was operating at full capacity. This allows us to deduce that the amount of direct labor hours for manufacturing blood pressure monitors must have been 1,000,000-200,000 = 800,000 hours.
Cost Driver rate = $550,000
1,000,000 ℎ𝑜𝑢𝑟𝑠 = $0.55/ℎ𝑜𝑢𝑟
Allocated Overhead for stethoscopes: = $0.55 ∗ 200,000 = $110,000 Allocated Overhead for blood pressure monitors: = $0.55 ∗ 800,000 = $440,000 However, as time went on, accountants realized that this method had its limitations. First, this method allows the use of only 1 cost driver, which can affect the accuracy of the costing system. Moreover, traditional costing does not recognize that some overhead costs are incurred irrespective of number of units produced. Consequently, traditional costing results in volume bias. With all the limitations of traditional costing, accountants developed activity based costing. ABC is the allocation of costs based on different activities performed within a business. For example, let us return to the scenario of Gupta Enterprises. The management of Gupta Enterprises has compiled the following information about Gupta’s overhead costs:
Activity Cost driver Stethoscopes Blood Pressure Monitor
Total Activity Cost
Equipment set up Number of set-ups
20 40 $50,000
Shipping and handling
Number of shipments
100 10 $100,000
Salary of support staff and management
Direct Labor Hours
200,000 800,000 $300,000
Machine costs Number of machine hours
200,000 100,000 $100,000
How much overhead do we allocate to each product? Just as under traditional costing, we need to compute our cost driver rates. However, under ABC, we have multiple cost pool and cost drivers.
𝐸𝑞𝑢𝑖𝑝𝑚𝑒𝑛𝑡 𝑠𝑒𝑡 𝑢𝑝 = $50,000
20+40 = $833.33/setup
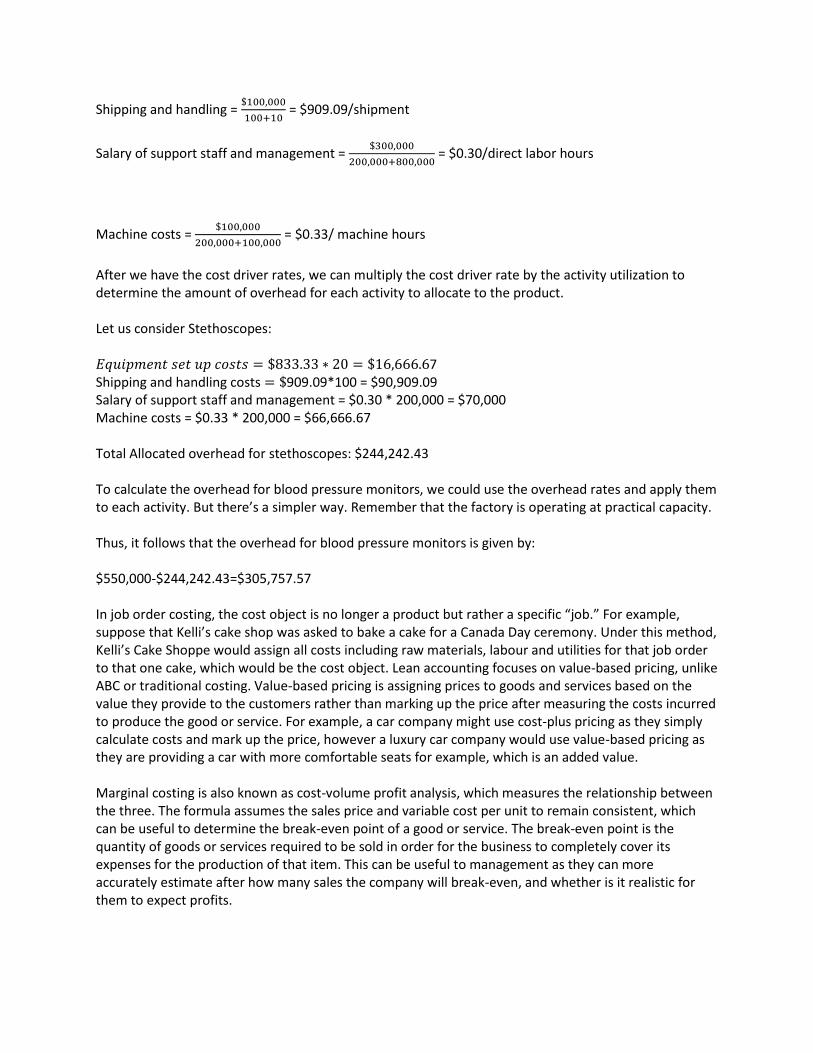
Shipping and handling = $100,000
100+10 = $909.09/shipment
Salary of support staff and management = $300,000
200,000+800,000 = $0.30/direct labor hours
Machine costs = $100,000
200,000+100,000 = $0.33/ machine hours
After we have the cost driver rates, we can multiply the cost driver rate by the activity utilization to determine the amount of overhead for each activity to allocate to the product. Let us consider Stethoscopes: 𝐸𝑞𝑢𝑖𝑝𝑚𝑒𝑛𝑡 𝑠𝑒𝑡 𝑢𝑝 𝑐𝑜𝑠𝑡𝑠 = $833.33 ∗ 20 = $16,666.67 Shipping and handling costs = $909.09*100 = $90,909.09 Salary of support staff and management = $0.30 * 200,000 = $70,000 Machine costs = $0.33 * 200,000 = $66,666.67 Total Allocated overhead for stethoscopes: $244,242.43 To calculate the overhead for blood pressure monitors, we could use the overhead rates and apply them to each activity. But there’s a simpler way. Remember that the factory is operating at practical capacity. Thus, it follows that the overhead for blood pressure monitors is given by: $550,000-$244,242.43=$305,757.57 In job order costing, the cost object is no longer a product but rather a specific “job.” For example, suppose that Kelli’s cake shop was asked to bake a cake for a Canada Day ceremony. Under this method, Kelli’s Cake Shoppe would assign all costs including raw materials, labour and utilities for that job order to that one cake, which would be the cost object. Lean accounting focuses on value-based pricing, unlike ABC or traditional costing. Value-based pricing is assigning prices to goods and services based on the value they provide to the customers rather than marking up the price after measuring the costs incurred to produce the good or service. For example, a car company might use cost-plus pricing as they simply calculate costs and mark up the price, however a luxury car company would use value-based pricing as they are providing a car with more comfortable seats for example, which is an added value. Marginal costing is also known as cost-volume profit analysis, which measures the relationship between the three. The formula assumes the sales price and variable cost per unit to remain consistent, which can be useful to determine the break-even point of a good or service. The break-even point is the quantity of goods or services required to be sold in order for the business to completely cover its expenses for the production of that item. This can be useful to management as they can more accurately estimate after how many sales the company will break-even, and whether is it realistic for them to expect profits.

The formula is written as 𝑝𝑥 = 𝑣𝑥 + 𝐹𝐶 + 𝑝𝑟𝑜𝑓𝑖𝑡, where 𝑝 represents the price per unit, 𝑣 represents the variable cost per unit, 𝐹𝐶 represents the fixed costs allocated to this good or service, and 𝑥 represents the quantity sold. To determine the break-even point using the formula, 𝑝𝑟𝑜𝑓𝑖𝑡 must be set to $0, which is when the company makes $0 in profit but also sells enough to cover all its expenses. For example, a sofa costs $100 in variable costs and sells it for $450, and there are $7,500 of fixed expenses the company faces, how many sofas would the company have to sell to break even? The formula can be rearranged to
isolate the quantity 𝑋 =𝑝𝑟𝑜𝑓𝑖𝑡+𝐹𝐶
(𝑃−𝑉). Plugging in the values, 𝑋 =
0+7500
(450−100), the company would have to
sell 21.42 sofas, but since a half a sofa cannot be manufactured, 22 sofas would need to be sold to break even and earn a bit of profit. Cost-volume profit analysis can also be used to see how changes in variable or fixed costs, the quantity of goods sold, or profit affect each other. Management can realistically manipulate these numbers to determine sales goals, or determine how much they need to increase their profit margin by to reach the desired levels of profit. Operating leverage refers to the relationship between fixed and variable costs within a business. If a company has a high degree of operating leverage, that means their fixed costs are relatively greater than their variable costs, whereas a low degree of operating leverage means the opposite. A company with a high degree of operational leverage will see their profits increase significantly with added sales, as their variable costs are low, however they will also suffer more losses if sales are not made as fixed costs must be paid regardless of quantity of sales. The degree of operating leverage (DOL) can be calculated as 𝐷𝑂𝐿 = (𝑠𝑎𝑙𝑒𝑠 − 𝑣𝑎𝑟𝑖𝑎𝑏𝑙𝑒 𝑐𝑜𝑠𝑡𝑠)/𝑝𝑟𝑜𝑓𝑖𝑡. For example, Bidhur’s Trap House has a profit of $10,000, variable costs of $3,000 and $30,000 of sales, it would equate to 𝐷𝑂𝐿 = ($30,000 −$3,000)/$10,000. This would have a DOL of 2.7, meaning if sales increased by 100% (doubled), the profit would increase by 270%.
In businesses with many products being sold, it can get hard to maintain a record of what has been sold.
The cost of goods sold can be calculated through one of four ways: The First-In, First-Out (FIFO) method,
Last-In, Last-Out method (LIFO), weighted average method and specific cost method. For example, a
company made the following purchases (figure 6.4.1) over the course of 2017.
Figure 6.4.1: Purchases Made
Under the FIFO method, we assume what was purchased first is what is sold first. For example, if 625
units of the product were sold, we would take the cost of 100 units from January 1st, 500 units from
Date Quantity of
Product
Per item
Cost
Total Cost
2017
Jan. 1 100 $8 $800
Mar. 8 500 $10 $5,000
Jun. 10 50 $12 $600
Dec. 1 100 $15 $1,500
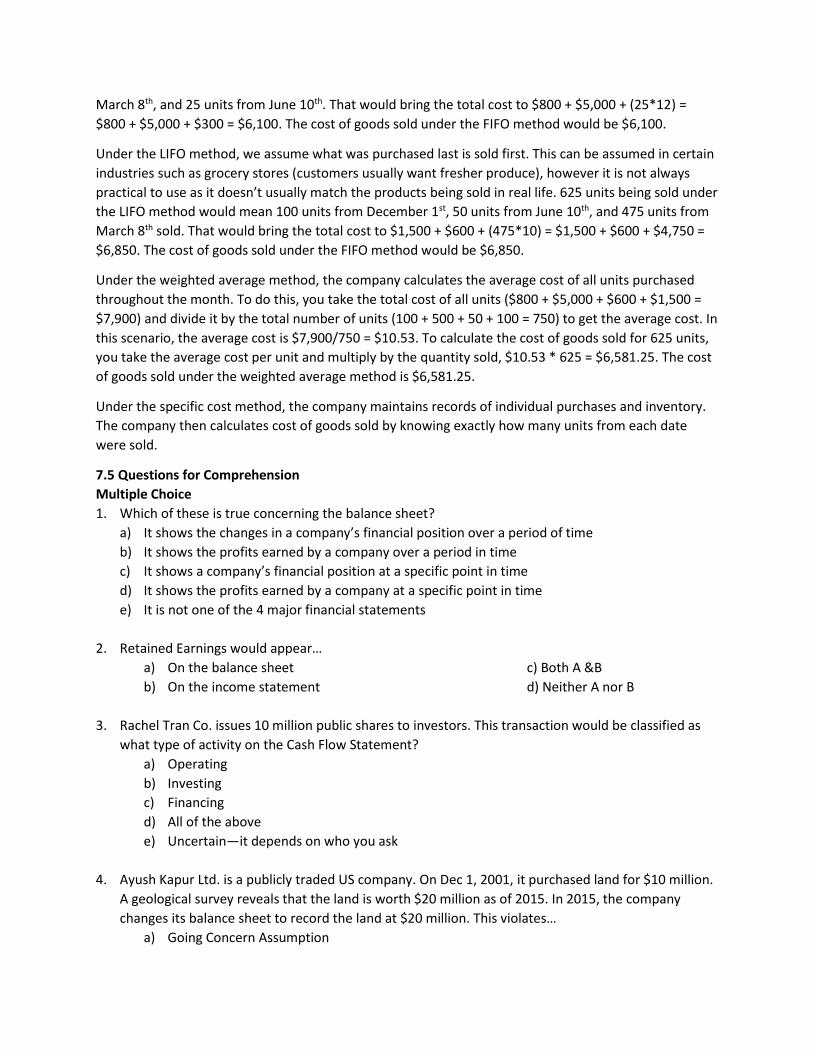
March 8th, and 25 units from June 10th. That would bring the total cost to $800 + $5,000 + (25*12) =
$800 + $5,000 + $300 = $6,100. The cost of goods sold under the FIFO method would be $6,100.
Under the LIFO method, we assume what was purchased last is sold first. This can be assumed in certain
industries such as grocery stores (customers usually want fresher produce), however it is not always
practical to use as it doesn’t usually match the products being sold in real life. 625 units being sold under
the LIFO method would mean 100 units from December 1st, 50 units from June 10th, and 475 units from
March 8th sold. That would bring the total cost to $1,500 + $600 + (475*10) = $1,500 + $600 + $4,750 =
$6,850. The cost of goods sold under the FIFO method would be $6,850.
Under the weighted average method, the company calculates the average cost of all units purchased
throughout the month. To do this, you take the total cost of all units ($800 + $5,000 + $600 + $1,500 =
$7,900) and divide it by the total number of units (100 + 500 + 50 + 100 = 750) to get the average cost. In
this scenario, the average cost is $7,900/750 = $10.53. To calculate the cost of goods sold for 625 units,
you take the average cost per unit and multiply by the quantity sold, $10.53 * 625 = $6,581.25. The cost
of goods sold under the weighted average method is $6,581.25.
Under the specific cost method, the company maintains records of individual purchases and inventory.
The company then calculates cost of goods sold by knowing exactly how many units from each date
were sold.
7.5 Questions for Comprehension
Multiple Choice
1. Which of these is true concerning the balance sheet?
a) It shows the changes in a company’s financial position over a period of time
b) It shows the profits earned by a company over a period in time
c) It shows a company’s financial position at a specific point in time
d) It shows the profits earned by a company at a specific point in time
e) It is not one of the 4 major financial statements
2. Retained Earnings would appear…
a) On the balance sheet c) Both A &B
b) On the income statement d) Neither A nor B
3. Rachel Tran Co. issues 10 million public shares to investors. This transaction would be classified as
what type of activity on the Cash Flow Statement?
a) Operating
b) Investing
c) Financing
d) All of the above
e) Uncertain—it depends on who you ask
4. Ayush Kapur Ltd. is a publicly traded US company. On Dec 1, 2001, it purchased land for $10 million.
A geological survey reveals that the land is worth $20 million as of 2015. In 2015, the company
changes its balance sheet to record the land at $20 million. This violates…
a) Going Concern Assumption
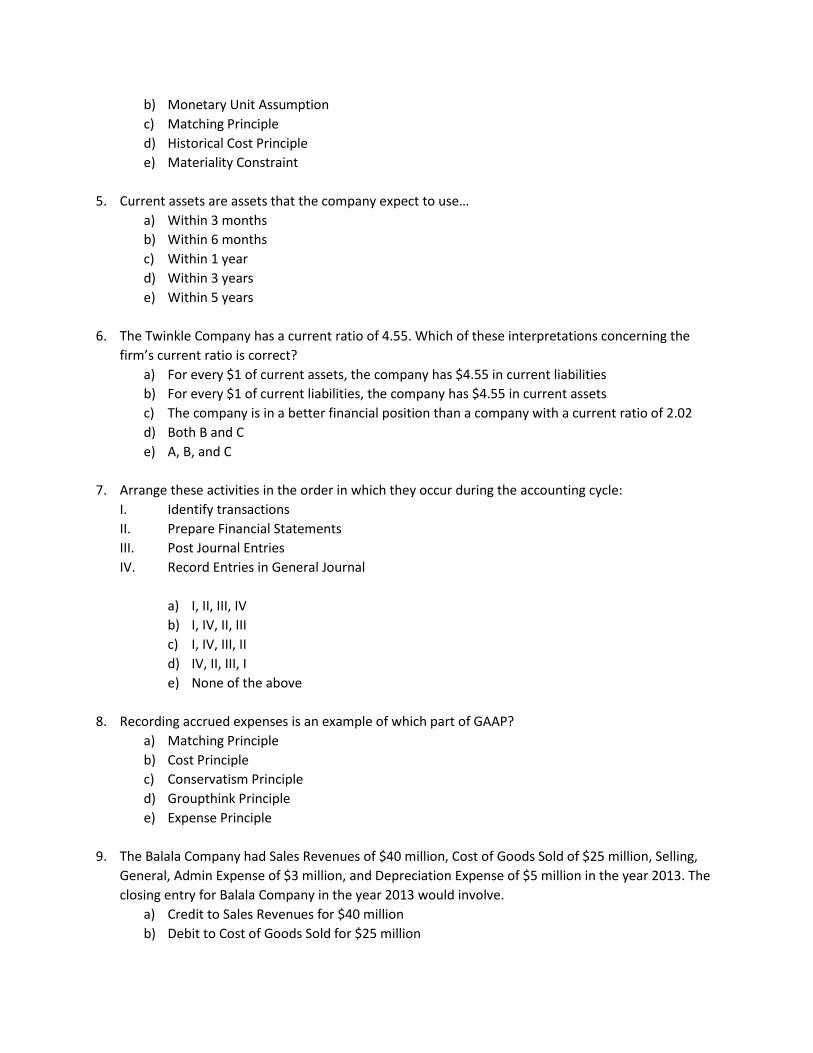
b) Monetary Unit Assumption
c) Matching Principle
d) Historical Cost Principle
e) Materiality Constraint
5. Current assets are assets that the company expect to use…
a) Within 3 months
b) Within 6 months
c) Within 1 year
d) Within 3 years
e) Within 5 years
6. The Twinkle Company has a current ratio of 4.55. Which of these interpretations concerning the
firm’s current ratio is correct?
a) For every $1 of current assets, the company has $4.55 in current liabilities
b) For every $1 of current liabilities, the company has $4.55 in current assets
c) The company is in a better financial position than a company with a current ratio of 2.02
d) Both B and C
e) A, B, and C
7. Arrange these activities in the order in which they occur during the accounting cycle:
I. Identify transactions
II. Prepare Financial Statements
III. Post Journal Entries
IV. Record Entries in General Journal
a) I, II, III, IV
b) I, IV, II, III
c) I, IV, III, II
d) IV, II, III, I
e) None of the above
8. Recording accrued expenses is an example of which part of GAAP?
a) Matching Principle
b) Cost Principle
c) Conservatism Principle
d) Groupthink Principle
e) Expense Principle
9. The Balala Company had Sales Revenues of $40 million, Cost of Goods Sold of $25 million, Selling,
General, Admin Expense of $3 million, and Depreciation Expense of $5 million in the year 2013. The
closing entry for Balala Company in the year 2013 would involve.
a) Credit to Sales Revenues for $40 million
b) Debit to Cost of Goods Sold for $25 million

c) Credit to Depreciation Expense for $5 million
d) Debit to Selling, General, Admin Expense for $3 million
10. Which of these statements is true about Accounting?
a) Accounting focuses only on cash flows
b) Accounting standards are consistent across all countries
c) Accounting aims to provide meaningful information to decision makers
d) Accounting scandals have never occurred
e) All of the above
11. The Nifemi Company provides snow shovelling services for a year. On April 1, the company receives
$6,000 cash from a customer, and in exchange will provide snow shovelling services for a year. If the
company records the transaction by debiting cash for $6,000 and crediting Revenue for $6,000,
then…
a) Assets will be overstated by $6,000.
b) Liabilities will be understated by $6,000
c) Expenses will be overstated by $6,000
d) Revenues will be understated by $6,000.
e) The company has not made an error in recording this transaction.
12. Blagojević Inc. decides buys a new factory for $35 million, paying with cash. Because of this
transaction…
a) The Company’s Current Ratio will increase
b) The Company’s Current Ratio will decrease
c) The Company’s Current Ratio will remain unchanged
d) More information is needed to determine the effect of this transaction on the Current Ratio
13. Spolia’s company takes 17 days to sell its inventory, and generally collects its receivables within 32
days of the sale. How long is the operating cycle for this company?
a) 17 days
b) 32 days
c) 49 days
d) 1 month
e) 1 year
14. Which of these accounts would appear on a post-closing trial balance?
a) Accounts Receivable c) Sales Revenue
b) Selling, General and Administrative Expense d) Goodwill Expense
15. Bank Loan Payable decreases by $5,000, what is the effect on the Cash Flow Statement
a) Cash from Operating Activities decreases by $5,000
b) Cash from Investing Activities decreases by $5,000
c) Cash from Financing Activities decreases by $5,000
d) Cash from Operating Activities increases by $5,000
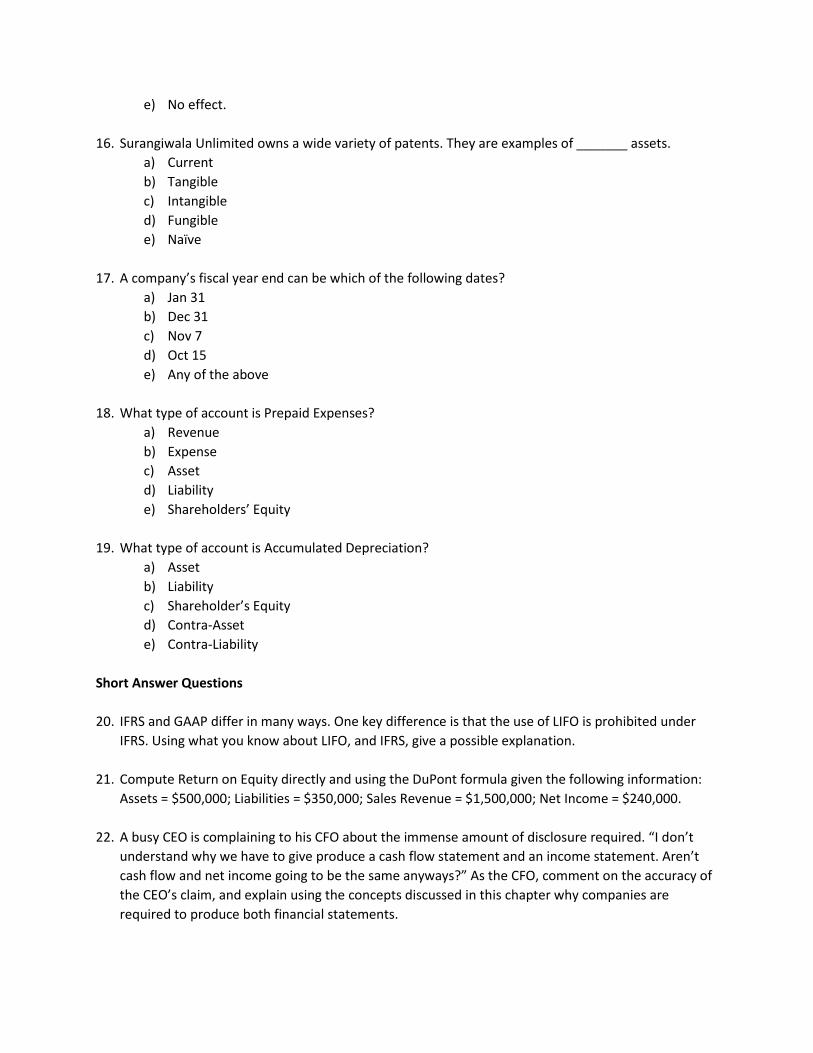
e) No effect.
16. Surangiwala Unlimited owns a wide variety of patents. They are examples of _______ assets.
a) Current
b) Tangible
c) Intangible
d) Fungible
e) Naïve
17. A company’s fiscal year end can be which of the following dates?
a) Jan 31
b) Dec 31
c) Nov 7
d) Oct 15
e) Any of the above
18. What type of account is Prepaid Expenses?
a) Revenue
b) Expense
c) Asset
d) Liability
e) Shareholders’ Equity
19. What type of account is Accumulated Depreciation?
a) Asset
b) Liability
c) Shareholder’s Equity
d) Contra-Asset
e) Contra-Liability
Short Answer Questions
20. IFRS and GAAP differ in many ways. One key difference is that the use of LIFO is prohibited under
IFRS. Using what you know about LIFO, and IFRS, give a possible explanation.
21. Compute Return on Equity directly and using the DuPont formula given the following information:
Assets = $500,000; Liabilities = $350,000; Sales Revenue = $1,500,000; Net Income = $240,000.
22. A busy CEO is complaining to his CFO about the immense amount of disclosure required. “I don’t
understand why we have to give produce a cash flow statement and an income statement. Aren’t
cash flow and net income going to be the same anyways?” As the CFO, comment on the accuracy of
the CEO’s claim, and explain using the concepts discussed in this chapter why companies are
required to produce both financial statements.
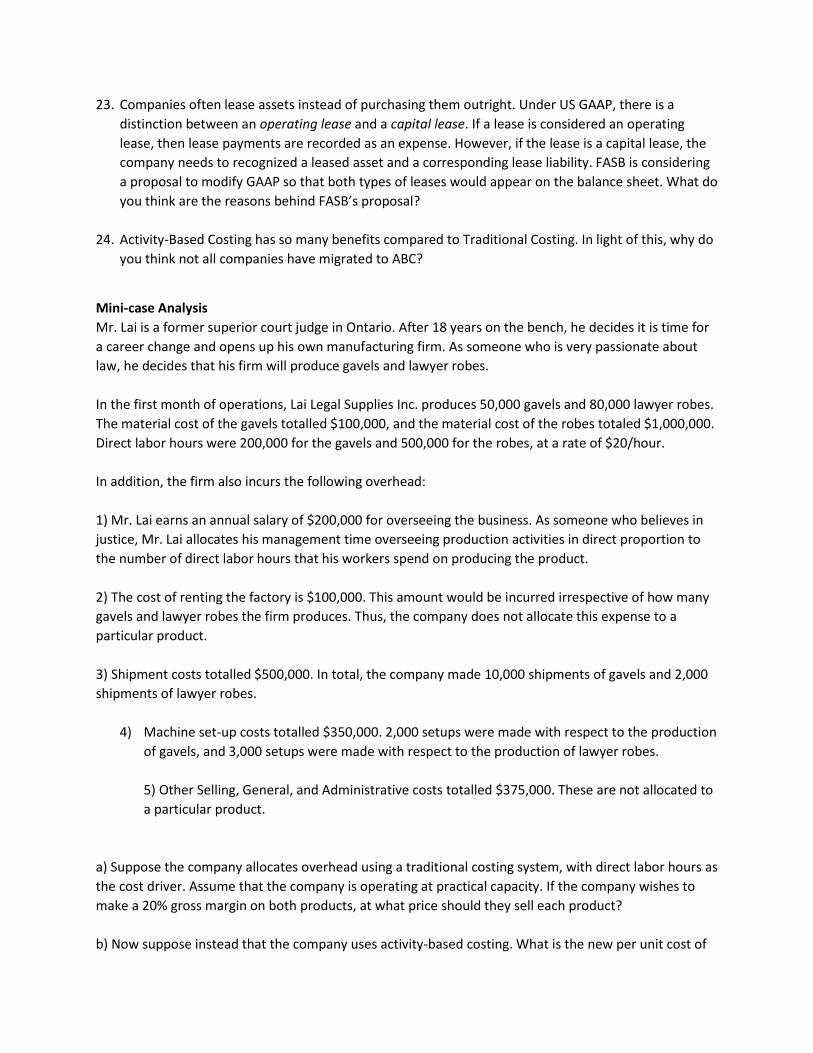
23. Companies often lease assets instead of purchasing them outright. Under US GAAP, there is a
distinction between an operating lease and a capital lease. If a lease is considered an operating
lease, then lease payments are recorded as an expense. However, if the lease is a capital lease, the
company needs to recognized a leased asset and a corresponding lease liability. FASB is considering
a proposal to modify GAAP so that both types of leases would appear on the balance sheet. What do
you think are the reasons behind FASB’s proposal?
24. Activity-Based Costing has so many benefits compared to Traditional Costing. In light of this, why do
you think not all companies have migrated to ABC?
Mini-case Analysis
Mr. Lai is a former superior court judge in Ontario. After 18 years on the bench, he decides it is time for
a career change and opens up his own manufacturing firm. As someone who is very passionate about
law, he decides that his firm will produce gavels and lawyer robes.
In the first month of operations, Lai Legal Supplies Inc. produces 50,000 gavels and 80,000 lawyer robes.
The material cost of the gavels totalled $100,000, and the material cost of the robes totaled $1,000,000.
Direct labor hours were 200,000 for the gavels and 500,000 for the robes, at a rate of $20/hour.
In addition, the firm also incurs the following overhead:
1) Mr. Lai earns an annual salary of $200,000 for overseeing the business. As someone who believes in
justice, Mr. Lai allocates his management time overseeing production activities in direct proportion to
the number of direct labor hours that his workers spend on producing the product.
2) The cost of renting the factory is $100,000. This amount would be incurred irrespective of how many
gavels and lawyer robes the firm produces. Thus, the company does not allocate this expense to a
particular product.
3) Shipment costs totalled $500,000. In total, the company made 10,000 shipments of gavels and 2,000
shipments of lawyer robes.
4) Machine set-up costs totalled $350,000. 2,000 setups were made with respect to the production
of gavels, and 3,000 setups were made with respect to the production of lawyer robes.
5) Other Selling, General, and Administrative costs totalled $375,000. These are not allocated to
a particular product.
a) Suppose the company allocates overhead using a traditional costing system, with direct labor hours as
the cost driver. Assume that the company is operating at practical capacity. If the company wishes to
make a 20% gross margin on both products, at what price should they sell each product?
b) Now suppose instead that the company uses activity-based costing. What is the new per unit cost of
each product?
c) Suppose the company had revenues of $20,000,000, no interest expenses, and a tax rate of 35%.
Prepare an income statement for the company for August 2015, the first month of operations.
d) Based on your income statement from part c), compute the net profit margin.
Glossary of Terms
Accounting - Accounting provides insight into the financial state of organizations through identifying,
recording, analyzing, summarizing and communicating the financial information.
General Journal – The general journal is known as the book of original entry, where all economic
transactions are recorded as they occur within a business.
Balance Sheet – The balance sheet is a financial statement that snapshot of a company’s overall
financial position at any given point in time, highlighting the amount of assets, liabilities and equity a
company has.
Income Statement – The income statement is a financial statement that shows the profitability of a
company over time, highlighting its revenues and expenses over fiscal periods.
Cash Flow Statement – The cash flow statement is a financial statement that reveals the inflows and
outflows of cash from operating, investing, and financing activities within a company.
Statement of Owners’ Equity – The statement of owners’ equity is a financial statement that shows the
changes in owners’ equity over a period of time.
Accrual Based Accounting - Accrual based accounting means that revenues and expenses are recorded
when they occur, and not when the cash is exchanged between the parties involved.
Cash Based Accounting - Cash based accounting records sales and expenses when the money is
exchanged in cash, not when they are actually incurred.
Internal Users – Internal users of financial information within the company, such as managers and
employees.
External Users – External users of financial information are from outside the company, such as the
government, investors or creditors.
Debtors - Debtors are people whom owe you money.
Creditors - Creditors are people you owe money to.
Ethics – The moral principles of a company or person, to help decide between the right and wrong thing
to do.
Generally Accepted Accounting Principles (GAAPs) – Generally accepted accounting principles are rules
and principles a company must follow when preparing their financial statements.
Assets – An asset is anything with monetary value a business owns (e.g. a car), and is expected to
generate future economic benefits for the company.

Liabilities – Liabilities are monies the business owes to creditors; a debt (e.g. a bank loan).
Equity – Equity is the value of owner’s shares in the organization (assets-liabilities= equity).
Revenue – Revenues are monies earned through operation of the business (e.g. sales).
Expenses – Expenses are monies paid to operate the business (e.g. rent, supplies, advertising).
Fiscal Period – A fiscal period is the duration of time financial statements reflect. Common fiscal periods
include quarters (3 months) or a year.
Fiscal Year – A fiscal year is a year during which an accounting cycle takes place, which does not
necessarily have to match up with a calendar year.
Historical Cost – Historical cost is the cost at which an item was purchased.
Market Value – Market value is the price of an item if it were to be sold at the market today.
Liquidity – How quickly an item can be converted to cash.
Maturity – Maturity is when a liability’s due date matures, otherwise known as when it is due.
Depreciation – Depreciation is the value of an asset reducing caused by wear and tear over time of the
asset.
Amortization – Amortization is the spreading out of payments over multiple fiscal periods, in order to
properly allocate the costs of that intangible item over a period of time (if it will be used for multiple
periods).
Write-Off – A write-off is cancelling or getting rid of the value of an account, or part of an account.
General Ledger – The general ledger maintains track of individual account balances, recording
transactions relevant to a specific account from the general journal.
On Account – On account means a transaction is completed using accounts receivable or accounts
payable, depending on the scenario present.
Adjusting Entries – Adjusting entries are journal entries made to update the balance of accounts at the
end of fiscal periods.
Closing Entries – Closing entries are made to reset the balance of nominal accounts, such as revenues,
expenses, and drawings/dividends to $0.
Nominal Accounts – Nominal accounts are temporary accounts which must be reset at the end of fiscal
periods through closing entries.
Retained Earnings – Retained earnings is the net income after any dividends have been paid (if any),
which is available to be used by the business in future years.
Dividends – Dividends are monies paid to shareholders from retained earnings, as an incentive for
investors to purchase or stay invested in the company.
Drawings – Drawings are monies withdrawn from the business, for personal use, by owners.
Fundamental Accounting Equation– The fundamental accounting equation is assets = liabilities +
owners’ equity, which shows that all assets must be paid for through borrowing capital or shareholders’
capital.