chapter 7 agriculture. fleeing the farm income growth and ag labor shares source: taylor and...
TRANSCRIPT

Chapter 7Agriculture

Fleeing the FarmIncome Growth and Ag Labor Shares
Source: Taylor and Lybbert, RebelText: Essentials of Development Economics, 2012

Countries Where Agriculture Does Not Grow Quickly Do Not Grow Quickly...
Agricultural Growth
Low Medium High
Per-capita Income Growth
Low 17 5 3
Medium 0 10 3
High 2 1 11
Source: Peter Timer, Handbook of Development Economics
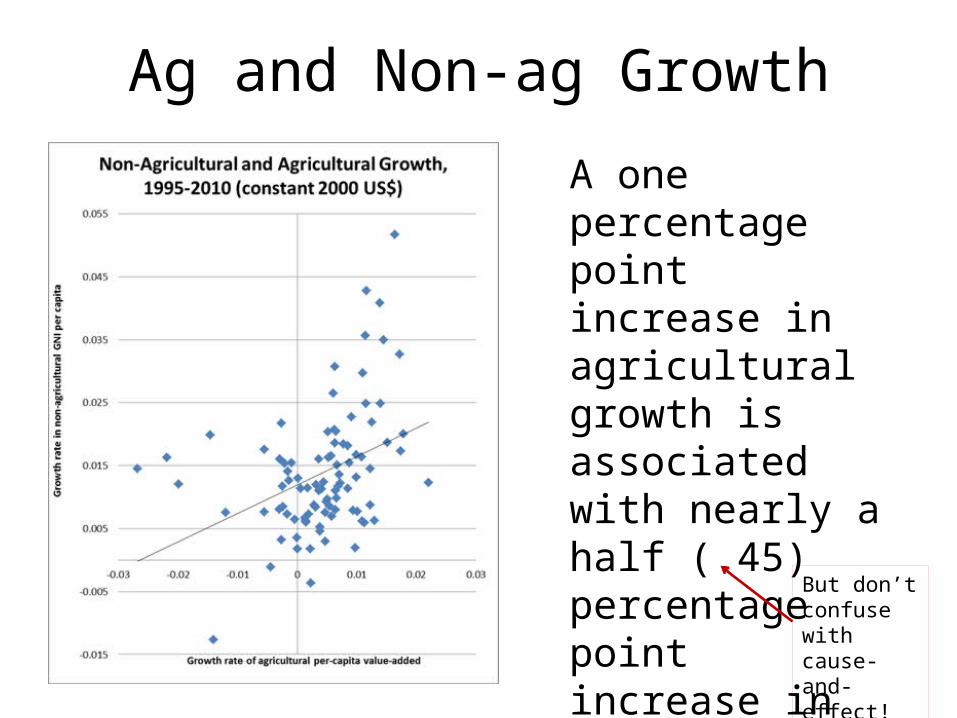
Ag and Non-ag Growth
A one percentage point increase in agricultural growth is associated with nearly a half (.45) percentage point increase in non-agricultural growth
But don’t confuse with cause-and-effect!

Agriculture’s Contributions
• 1. Source of labor for modern sector• 2. Source of savings for investments• 3. Source of foreign exchange through
exports• 4. Source of tax revenue• 5. Market for manufactured goods

Three Kinds of Policies that Have Hurt Agriculture
• Cheap food policies, taxation– Government pays farmers below-market price
• Good for consumers, keeps wages low• Results in too little food production, more imports
– High taxes on farmers do same
• Sectoral Policies: Subsidies for industry– Direct subsidies, cheap credit, infrastructure investment– Make agriculture less profitable relative to industry, draw resources out of
agriculture
• Trade policies – Overvalued exchange rate makes imported inputs, technology, and food cheaper
• Hurts producers of exports and importable goods (tradables)– Import substitution (quotas, import tariffs) for manufactures makes industry more
profitable relative to agriculture– A few low-middle income (e.g., CAFTA) countries protect agriculture
• Good for commercial farmers, bad for consumers
• Any of these policies can create distortions, welfare losses
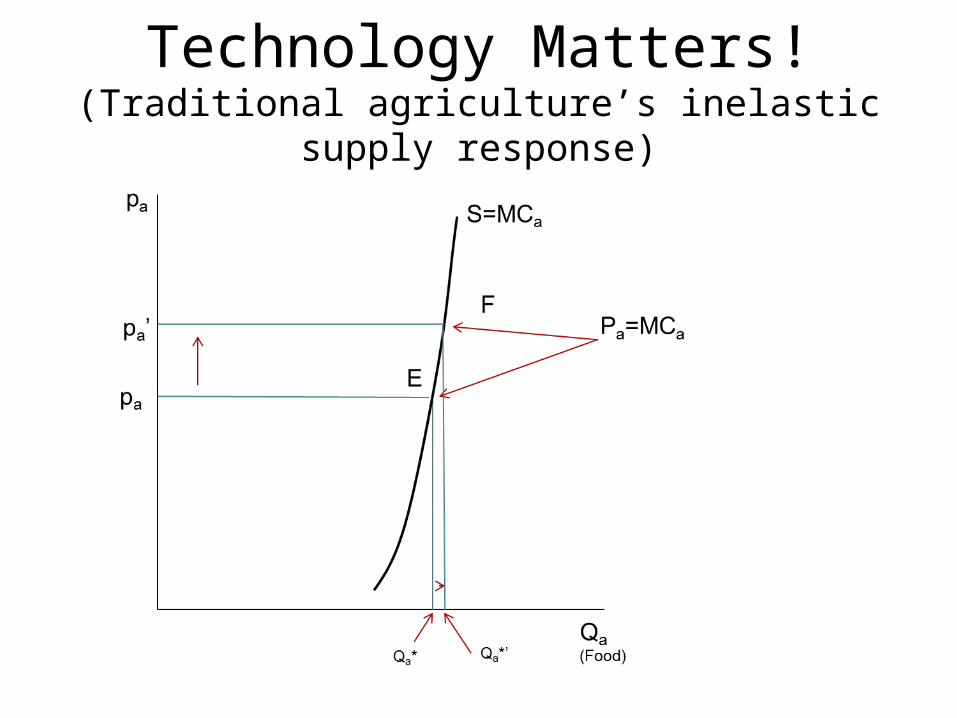
Technology Matters!(Traditional agriculture’s inelastic supply response)
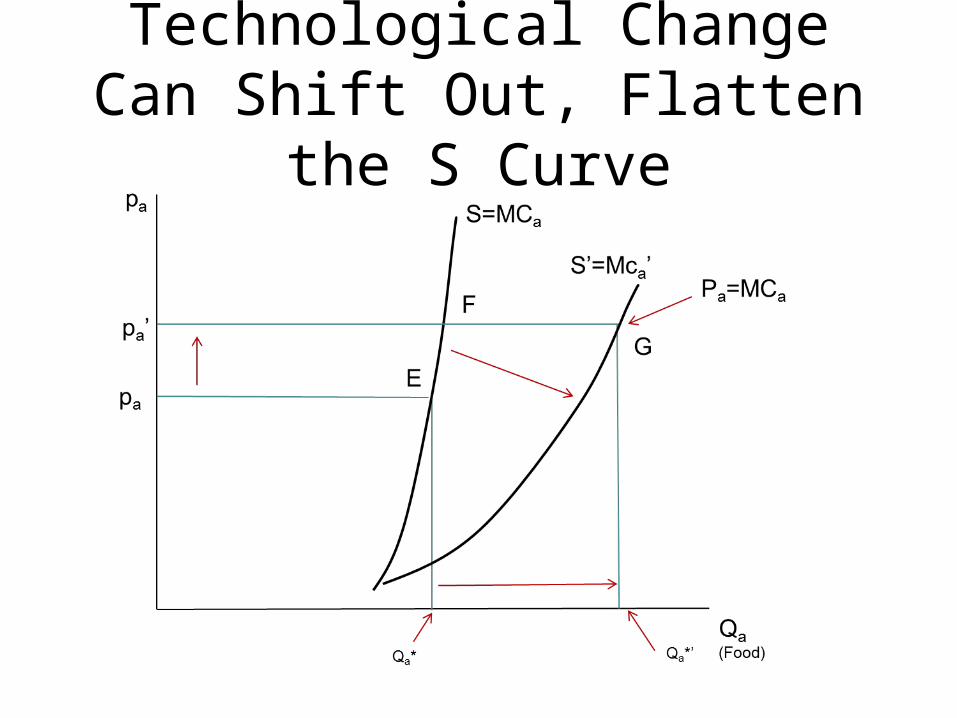
Technological Change Can Shift Out, Flatten the S Curve

Increasing the Supply Response
• Requires technological change– Focus on the constraints
– Mechanical packages (labor-saving)
– Biological package (land-saving)
• Benefits: Raise farm incomes, make food cheaper
• How? R&D, extension, credit, market development
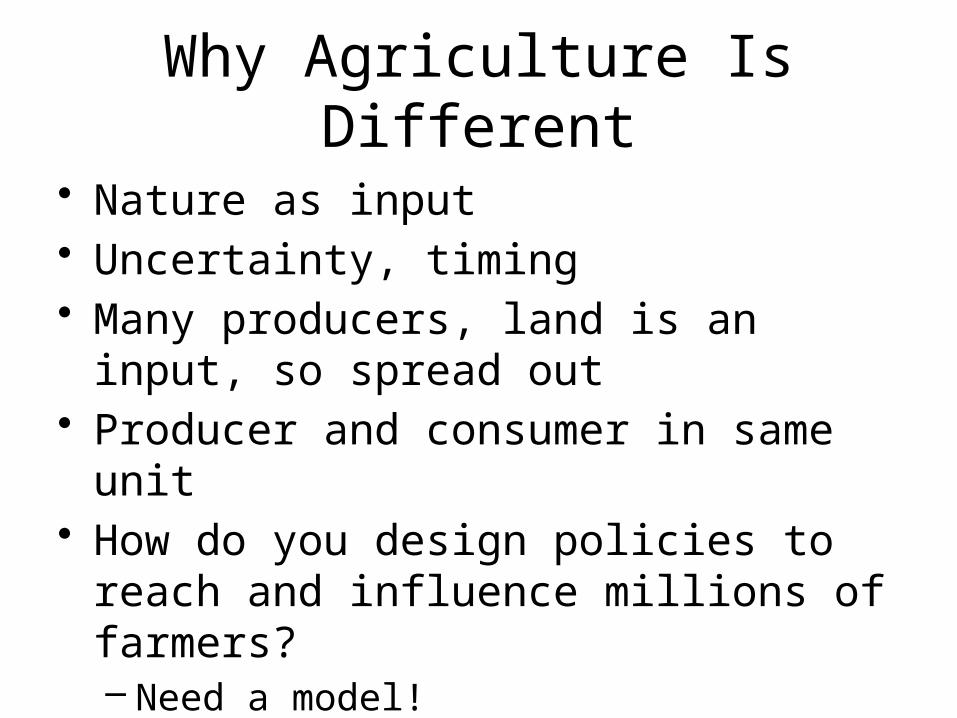
Why Agriculture Is Different
• Nature as input• Uncertainty, timing• Many producers, land is an input, so
spread out• Producer and consumer in same unit• How do you design policies to reach and
influence millions of farmers?– Need a model!

The Agricultural Household Model
• Staple of agricultural policy analysis in LDCs
• Producer and consumer in same model– Household provides many of its own inputs– It consumes part or (more often than not) all
of its output• How do we model such an animal?

It’s a Household, So Start with Consumer Theory

What Happens When the Price of Food Goes Up?

But the Farm Household is a Producer, too!
Farm Profits Go Up!

The Profit Effect Shifts the Budget Constraint Outward
Is the Agricultural Household Better Off When Food Prices
Rise?
• It depends…– The household gains as a producer– …but it loses as a consumer
• A big surplus-producer benefits most• A net buyer loses

The Big Lessons from Agricultural Household Models
• If a government wants to increase the supply of food for its urban consumers, raising the price of food will not necessarily help
– It depends on the marketed surplus effect
• If the price of food goes up, it can be bad news not only for urban consumers but also small farmers– Chris Barrett found most small farm
households are net buyers of food

How Do We Know Whether Higher Food Prices Help Rural Households?
• The Net Benefit Ratio (Amartya Sen):
E
MSNBR
Household Group
Country
El Salvador
Guate-mala
Hon-duras
Nica-ragua
Landless (LL) -0.16 -0.36 -0.63 -0.49 Subsistence (BG) -0.01 -0.32 -0.78 0.00 Small Commercial (SC) 0.31 -0.12 -0.13 0.39 Medium Commercial (MC) 1.20 0.07 1.01 0.62
Large Commercial (LC) 3.88 0.64 1.71 1.79

Measuring Welfare Effects:The Net Benefit Ratio (NBR)
• Ratio of net agricultural sales to total income (or expenditures)
• E.g.: A household produces $250 and consumes $50. Its total income is $500. The NBR = (250-50)/500=.4
• A 1% increase in output price raises welfare by 0.4%
• A negative NBR tells us the household is worse off if the crop price goes up (true for all non-agricultural and most agricultural households)
Angus Deaton

Everything Depends on the Supply Response
• Many things can constrain the supply response (i.e., make the supply curve vertical), especially on small farms– Limited access to land, and especially irrigated land– Poor land quality– Technological limitations, including lack of access to high-
productivity seeds– Limited access to modern inputs, like fertilizer– A lack of cash to purchase inputs, and limited or no access to
credit– Limited or no access to insurance to protect against crop failure– Labor constraints

How Constraints can “Kink” the Supply Curve
• Constraints “bind” at Qac

The Subsistence Household
Notice the household’s budget constraint is now the PPF!
PPF: Production Possibility Frontier (why not a straight line?)
Where are the prices? (Answer: they’re “shadow prices,” not market prices.)

Most Staple Producers in Eastern and Southern Africa Aren’t in the Market
Source: Barrett, Food Policy, 2008

…Gains from Trade

Food Security vs. Self-sufficiency
• Food security: securing year-round access to an adequate supply of nutritious and safe food to meet the dietary needs of all members of the household– Can be either through own production or
purchases (Callens and Seifert, 2003)
– I’m food secure but certainly not self-sufficient!
Conflict within the Household?
• Does it make sense to have a household utility function?– Or is the household a collection of individuals
each with his/her own preferences and resources?
– Are the interests of different household members compatible?
– In a cash transfer program, does it matter whom you hand the money to?

Nash-bargained Households(John Nash, as in The Beautiful Mind)
• Consider two people, persons m and f• Let:
– vm be m’s utility or welfare if they do not form a household, and let vf be person f’s.
– If they form a household, they’ll combine their income and spend it on things either or both care about. • Person m’s welfare will be Um and f’s will be Uf

Marriage and Threat Points
• Neither one will want to form a household unless there’s a positive welfare gain in it
• So both Um - vm and Uf – vf must be positive
• Once the household gets formed:– The hh utility funciton is: U=(Um - vm)(Uf – vf )
– vm and vf are “threat points”• The utilities the two people would have in the
“game” of being single. • The higher a person’s threat point, the more
bargaining power s/he has in the Nash-bargained household.

Income and Assets Raise the Threat Point
• Who controls the cash significantly explains household expenditures (boxes) – A rupee is not a rupee– If you want more spending on nutrition,
health, education, give cash to women– Chris Udry: Female plots get less fertilizer
than male plots• Households could be better off by shifting inputs
from male to female plots—but they don’t

Beyond Households
• Linkages among households shape impacts of development projects and other shocks– Like ripples in a pond
• General-equilibrium (GE) effects• Box: subsistence households aren’t
isolated from food price shocks!

Policy or Market Change

Policy or Market Change
They adjust…

Policy or Market Change Farm-nonfarm
linkages
They affect others…
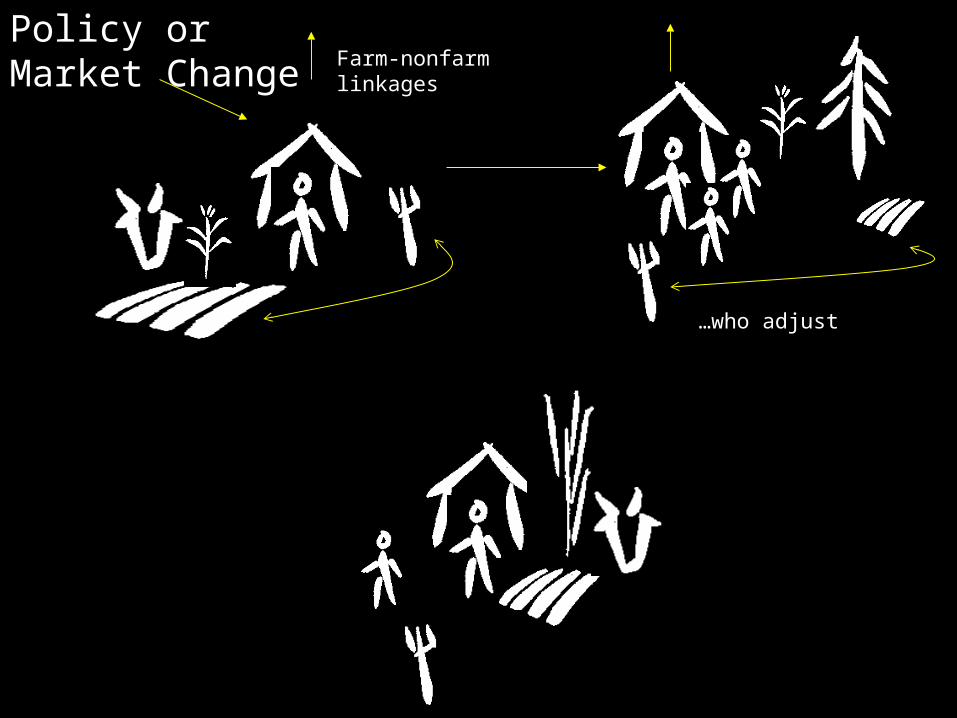
Policy or Market Change
Farm-nonfarm linkages
…who adjust

Policy or Market Change
Farm-nonfarm linkages
…and affect still others