chapter 7 engineering economic analysis time value of money
Post on 21-Dec-2015
238 views
TRANSCRIPT

Chapter 7
Engineering Economic AnalysisTime Value of Money

Definitions
P – Principal or Present Value (of an investment)
Fn – Future Value (of an investment)
n – Years ( or other time unit) between P and F i – Interest Rate (based on time interval for n) per anum
Basis premise: Money when invested earns money
$1 today is worth more than $1 in the Future

Interest
Simple Interest – Annual Basis Simple Interest – Annual Basis Interest paid in any year = Interest paid in any year = PiPis s
PiPiss – Fraction of investment paid as – Fraction of investment paid as
interest per year interest per year
After After nn years total interest paid = years total interest paid = PiPissn n Total investment is worth = Total investment is worth = PP + + PiPissnn
Could earn interest on earned interest Could earn interest on earned interest

Interest
Compound Interest Compound Interest At time 0 we have P At time 0 we have P
At the end of Year 1, we have At the end of Year 1, we have FF11 = = PP (1 + (1 + ii) )
At the end of Year 2, we have At the end of Year 2, we have FF22 = = PP (1 + (1 + ii))2 2
At the end of Year n, we have At the end of Year n, we have FFnn = = PP (1 + (1 + ii))n n
or or PP = = FFnn / (1 + / (1 + ii))n n

Example
How much would i need to invest at 8 % How much would i need to invest at 8 % p.a. to yield $5000 in 10 years p.a. to yield $5000 in 10 years
97.2315$
08.01
5000
5000
10
08.0
10
10
P
F
n
i
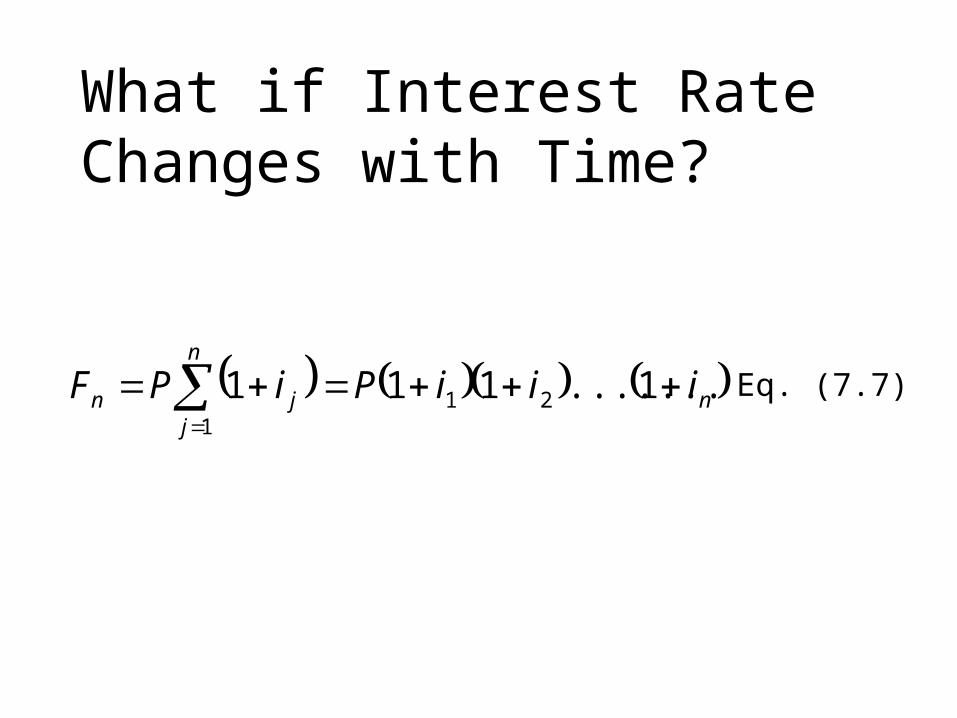
What if Interest Rate Changes with Time?
n
n
jjn iiiPiPF
1.......111 211
Eq. (7.7)
Different Time Basis for Interest Calculations Relates to statement “ Your loan is 6 % p.a. Relates to statement “ Your loan is 6 % p.a.
compounded monthly” compounded monthly” Define actual interest rate per compounding Define actual interest rate per compounding
period as period as rriinomnom = Nominal annual interest rate = Nominal annual interest rate mm = Number of compounding periods = Number of compounding periods
per year (12)per year (12)

Different Time Basis for Interest Calculations cont.
iieffeff = Effective annual interest rate = Effective annual interest rate
Look at condition after 1 yearLook at condition after 1 year
m
ir nom
effiPF 11
11
mnom
eff m
ii

Example
Invest $1000 at 10 % p.a. compounded Invest $1000 at 10 % p.a. compounded monthly. How much do I have in 1 year, 10 monthly. How much do I have in 1 year, 10 years?years?
04.2707$1
1047.0112
10.01
71.1104$12
10.0110001
1010
12
12
1
eff
eff
m
nom
iPF
i
m
iPF

Example cont.
As m decreases As m decreases iieffeff increases increases
Is there a limit as Is there a limit as mm goes to infinity goes to infinity Yes – continuously compounded Yes – continuously compounded
interest interest Derivation – pp. 229-230 Derivation – pp. 229-230 iieffeff (continuous) = e (continuous) = eiinom nom – 1– 1

Cash Flow Diagrams
Represent timings and approximate Represent timings and approximate magnitude of investment on a cfd magnitude of investment on a cfd xx-axis is time and -axis is time and yy-axis is magnitude -axis is magnitude both positive and negative investments both positive and negative investments
are possible. are possible. In order to determine direction (sign) of In order to determine direction (sign) of
cash flows, we must define what system is cash flows, we must define what system is being considered. being considered.

Consider a Discrete Cash Flow Diagram
Discrete refers to individual cfds that are Discrete refers to individual cfds that are plottedplotted

Example
I borrow $20 K for a car and repay as a I borrow $20 K for a car and repay as a $400 monthly payment for 5 years.$400 monthly payment for 5 years.
For Bank For Me
1 2 3
$400
60321
$2000
60
$400
$2000
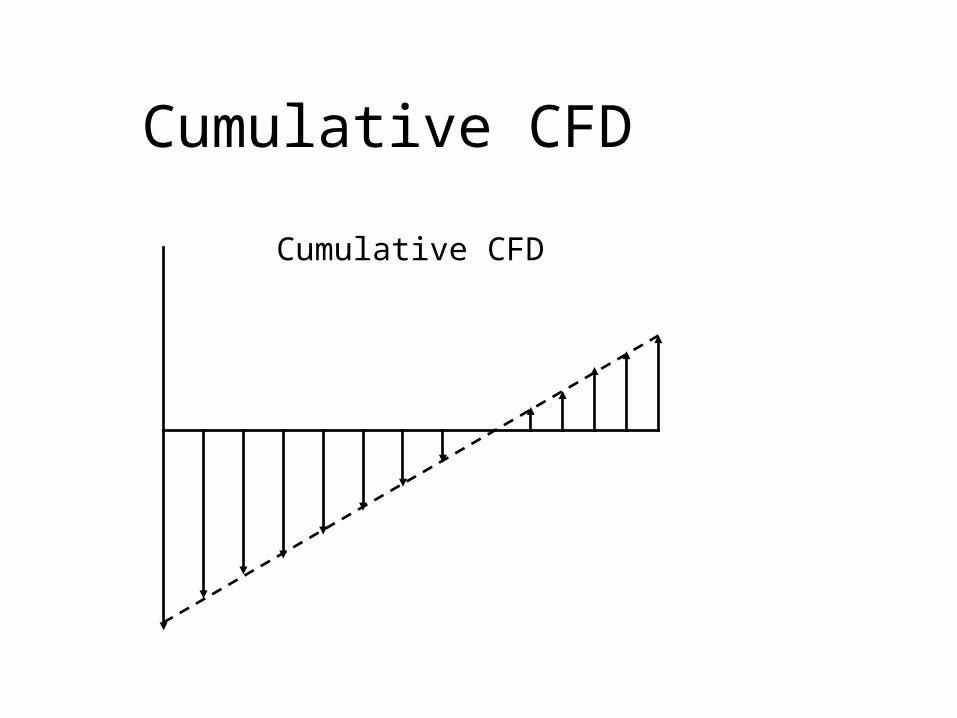
Cumulative CFD
Cumulative CFD

Annuities
1 2 3 n
Uniform series of equally spaced – equal value cash flows

Annuities
What is future value What is future value FFnn = ? = ?
Geometric progressionGeometric progression
AiAiAF nnn .....11 21
i
iASF
n
nn
11

Calculations with Cash Flow Diagrams
Invest 5K, 1K, 2K at End of Years 0, 1, 3, Invest 5K, 1K, 2K at End of Years 0, 1, 3,
and take 3K at End of Year 4and take 3K at End of Year 4
0
$3000
$2000$1000
$5000
3
74
1

Example 1
How much in account at end of Year 7 if i = How much in account at end of Year 7 if i = 8% p.a. 8% p.a.
What would investment be at Year 0 be to get What would investment be at Year 0 be to get
this amount at Year 7 this amount at Year 7
84.9097$
08.013000
08.01200008.01100008.01000,5
7
3
4677
F
F
50.5308
08.1
84.90977
P

Example 2
What should my annual monthly car What should my annual monthly car payment be if interest rate is 8% p.a. payment be if interest rate is 8% p.a. compounded monthly?compounded monthly?
$20,000
A

Example 2 cont. Compare at Compare at nn = 60 = 60
53.405$
090.2979647.73
90.2979612
08.01000,20
47.73
1208.0
11208.0
1
60
60
60
60
A
A
F
AAF

Discount Factors
Just a shorthand symbol for a formula in Just a shorthand symbol for a formula in ii and and nn
n
n
n
nn
ii
ini
F
PPA
iFni
F
PFP
ini
F
P
i
FP
1
11,,
1
1,,
1
1,,
1
Table 7.1

Depreciation
Total Capital Investment = Fixed Capital + Total Capital Investment = Fixed Capital + Working Capital Working Capital Fixed Capital – All costs associated with Fixed Capital – All costs associated with
new construction, but new construction, but LandLand cannot be cannot be depreciated depreciated
Working Capital – Float of material to Working Capital – Float of material to start operations cannot depreciatestart operations cannot depreciate
WCLandFCITCI L
Definitions
Salvage Value Salvage Value Valve of Valve of FCIFCILL at end of project at end of project Often = 0 Often = 0
Life of Equipment Life of Equipment nn – Set by IRS – Set by IRS
Not related to actual equipment life Not related to actual equipment life Total Capital for Depreciation Total Capital for Depreciation
FCIFCILL - - SS

3 Basic Methods for Depreciation
Straight Line Straight Line Sum of Years Digits (SOYD) Sum of Years Digits (SOYD) Double Deruning Balance (DDB)Double Deruning Balance (DDB)

Straight Line
n
SFCId LSL
k
n = # of years

Sum of Years Digits (SOYD)
1
2
11
nn
SFCIknd LSOYD
k
SOYD

Double Declining Balance (DDB)
1
0
2 k
jjL
DDBk dFCI
nd

Example 7.21
207
10150
1
7
1010$
10150$6
6
SL
st
L
d
Year
n
S
FCI
Same for Years 1-7

Example 7.21 (cont’d)
6.309.421507
2
9.421507
2
301015028
610150
872
1217
351015028
710150
872
1117
2
1
2
1
DDB
DDB
SOYD
SOYD
d
d
d
d

Taxation, Cash Flow, and Profit
Tables 7.3 – 7.4 Tables 7.3 – 7.4 Expenses = Expenses = COMCOMdd + + ddk k
Income Tax = (Income Tax = (RR – – COMCOMdd - - ddkk))t t After Tax (net)Profit = After Tax (net)Profit =
((RR – – COMCOMdd – –ddkk)(1 – )(1 – tt) ) After Tax Cash Flow = After Tax Cash Flow =
((RR – – COMCOMdd – – ddkk)(1 – )(1 – tt) + ) + ddk k

Inflation
$ Now Net Worth vs. $ Next Year $ Now Net Worth vs. $ Next Year
jCEPCIfnjCEPCI n 1

Inflation
Purchasing Power vs time Purchasing Power vs time
ff = Average inflation rate between Years = Average inflation rate between Years jj and and nn
fi
fifii
'
1
' 1 '1
nn
n
F iF P P i
fi f

Homework
• Problems 7.1- 7.8 – 7.9 – 7.19 – 7.20 – 7.21 – 7.22