chapter 7 export diversification at the time of … · modity-dependent countries, expanding the...
TRANSCRIPT

195
CHAPTER 7EXPORT DIVERSIFICATION AT THE TIME OF SLOWBALISATION Contributed by the United Nations Conference on Trade and Development
Abstract: Export diversification remains an important development objective of many commodity-dependent developing countries. Today’s global economic trends, however, suggest that the world may be entering a period of “slowbalisation”, signified by slower growth of trade, foreign direct investment and capital flows. Growing environmental concerns also raise questions over the viability of repeating the pattern of massive export growth enjoyed by some developing countries in the past several decades. Shifting patterns of economic growth call for a new focus in developing countries’ export diversification strategies. This chapter discusses that two areas - services trade and South-South trade – can provide developing countries with untapped potential for continuing export diversification. The chapter then discusses how South-South regional regulatory cooperation could enhance services trade and reduce the trade-distorting impact of non-tariff measures. To conclude, the chapter explores the role of Aid for Trade in enhancing export diversification through regional cooperation.
AID FOR TRADE AT A GLANCE 2019: ECONOMIC DIVERSIFICATION AND EMPOWERMENT - © OECD, WTO 2019

196
CHAPTER 7. EXPORT DIVERSIFICATION AT THE TIME OF SLOWBALISATION
EXPORT DIVERSIFICATION STRATEGIES – THEN AND NOW
Export diversification is part of a dynamic process of economic growth and economic diversification. To many com-modity-dependent countries, expanding the content of their export basket with more manufactured products or services is a sign of value addition and successful structural transformation. Between 1995 and 2017, developing countries’ exports of manufacturing products increased from 65% to 74% of total exports.
Figure 7.1. Share of Manufacturing in exports, 1995-2017
40
50
60
70
80
90
100
20172016201520142013201220112010200920082007200620052004200320022001200019991998199719961995
China to World Developing economies to WorldDeveloping ec. excl. China-World
SHARE OF MANUFACTURING, PERCENT
Source: UNCTAD Intrastat.
Figure 7.2. Herfindahl Hirschman index of product concentration of exports, 1995-2017
0.00
0.05
0.10
0.15
0.20
0.25
0.30
0.35
0.40
0.45
0.50
20172016201520142013201220112010200920082007200620052004200320022001200019991998199719961995
Africa Asia WorldLatin America & Caribbean
HERFINDAHL HIRSCHMAN CONCENTRATION INDEX
Source: UNCTAD Intrastat.
12http://dx.doi.org/10.1787/888933953679
12http://dx.doi.org/10.1787/888933953698
AID FOR TRADE AT A GLANCE 2019: ECONOMIC DIVERSIFICATION AND EMPOWERMENT - © OECD, WTO 2019
197
CHAPTER 7. EXPORT DIVERSIFICATION AT THE TIME OF SLOWBALISATION
However, this increase mostly reflected the growth acceleration and structural transformation of a handful of emerging economies in Asia, particularly China (Figure 7.1). In 2017, Asia accounted for 88% of the manufacturing exports from developing countries, and for 94% of “South-South” manufacturing exports, where East Asia alone accounted for 65 and 69% respectively. In contrast, African exports became more concentrated, rather than more diversified, particularly in the years of the commodities super cycle (2000-2008), which was largely driven by China’s increased demand for primary products (Figure 7.2).
Export concentration in a few primary commodities makes a country more vulnerable to external shocks and can nega-tively influence job opportunities in the exporting countries. A strong link can exist between the poor state of export diversification and the dismal nature of employment creation (UNCTAD, 2018a). For example, Africa’s weak diversifi-cation is a major factor behind unemployment in the region. Africa has the youngest population structure in the world. It is estimated that of the 420 million African youth (i.e. aged between 15 and 35 years), about 31% are unemployed, and over 70 percent are underemployed (Betcherman and Khan 2015). The African Development Bank projects that 18 million jobs need to be created annually between 2015 and 2035 in order to absorb youth entering the labour market for the first time (African Development Bank, 2016).
Export diversification thus remains an important developmental objective of developing countries, particularly in Africa with predominantly commodity dependent countries. In recent years, many developing countries placed measures to increase their participation in global value chains (GVCs), often through export processing zone (EPZ) schemes, at the core of their export diversification strategies. This was a logical choice particularly in the years between 1995 and 2008 when GVCs proliferated and there was a rapid expansion of trade in intermediate goods.
Today’s global economic trends, however, suggest that the world may be entering a period of “slowbalisation” charac-terised by slower growth, or contraction, of trade, foreign direct investment (FDI) and capital flows.1 Since the latter part of 2018, international organisations have repeatedly adjusted their global economic prospect downwards.2 The World Bank reported in its monthly highlight of March 2019 that global merchandise trade has lost the growth momentum of 2017. The year-on-year growth of the volume of container shipping was 5% in February 2018 but fell to 2% in February 2019. Likewise, the annual growth of new export orders turned negative in February 2019.3 As regards FDI flows, the total value fell by almost 20%, from USD1.47 trillion in 2017 to an estimated USD1.2 trillion in 2018, a level equivalent to the value of FDI just after the global financial crisis in 2009 (UNCTAD, 2019a).
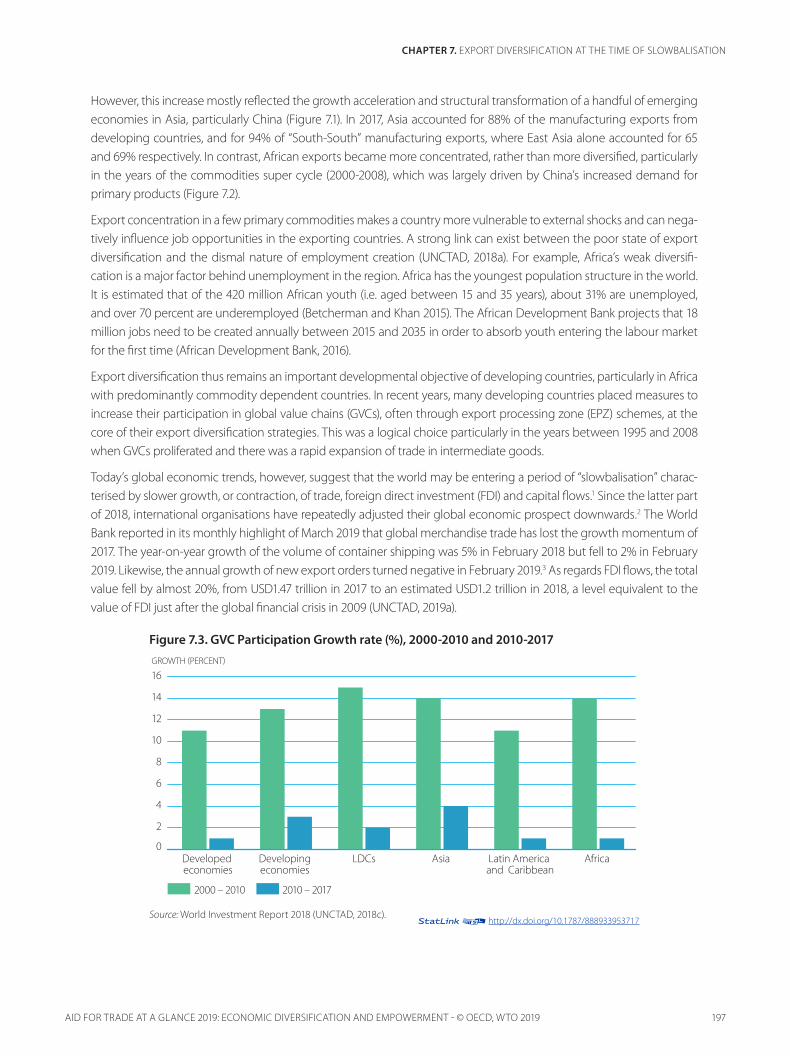
Figure 7.3. GVC Participation Growth rate (%), 2000-2010 and 2010-2017
0
2
4
6
8
10
12
14
16
Africa Latin America and Caribbean
Asia LDCsDeveloping economies
Developed economies
GROWTH (PERCENT)
2010 – 20172000 – 2010
Source: World Investment Report 2018 (UNCTAD, 2018c). 12http://dx.doi.org/10.1787/888933953717
AID FOR TRADE AT A GLANCE 2019: ECONOMIC DIVERSIFICATION AND EMPOWERMENT - © OECD, WTO 2019

198
CHAPTER 7. EXPORT DIVERSIFICATION AT THE TIME OF SLOWBALISATION
The sluggishness in trade and FDI are closely related to the deceleration of GVCs (Constantinescu et al., 2018). The growth of GVCs has come to a halt. The share of foreign value added (FVA), i.e. the value of imported goods and services incorporated in exports, declined from 31% in 2010 to 30% of world exports in 2017 (UNCTAD, 2018c). The growth in developing countries’ participation in GVCs has slowed down considerably in the past decade (Figure 7.3).4 In the first decade of the 21st century, developing countries increased their participation in GVCs on average by 13% annually. In the years between 2010 and 2017, this has come down to 3%. The fall in GVC participation growth was particularly sig-nificant in Africa and in LDCs. Heightened uncertainty over a potential trade war between the US and China may further exacerbate these trends. UNCTAD estimates that the high volume of Chinese exports affected by US tariffs is likely to contract East Asian value chains by about USD160 billion.5
The prospect of rapid trade growth in coming years is seemingly low, not only because of growing uncertainty over a trade war but also because the significant trade liberalisation in tariffs that the world experienced in the post-Uruguay Round years seems to have come to an end point. The simple average of world most-favoured nation (MFN) tariffs on manufac-turing products in 2017 was only marginally lower than the level 10 years ago, while there was absolutely no change when measured as a trade-weighted average. The same pattern applies to the average of preferential tariffs, i.e. those set under preferential trade agreements including bilateral and regional trade agreements (RTAs) (UNCTAD, 2019c).
Growing environmental concerns also raise questions over the viability of economic policy that focuses on repeating the explosive exports growth – in primary commodities, agriculture or manufacturing – that some developing countries experienced in the past several decades. Unchecked globalisation in past decades has radically reshaped the environ-mental conditions that are faced today, which include climate change and “the sixth extinction” in terms of losing bio-diversity, among others. In 2012, it was suggested that if the world’s 7 billion citizens consumed as much as the average US citizen, 4 Earths would be needed to sustain consumption.6
In December 2018, the member states of the United Nations Framework Convention on Climate Change (UNFCCC) agreed at the 24th Conference of the Parties (COP24) on a “rulebook” for implementing the Paris Agreement, i.e. to keep global temperature rise in this century to below 2 degrees Celsius above pre-industrial levels by significantly reducing greenhouse gas (GHG) emissions. International trade is considered one of the major drivers of GHG emissions because of the need to transport goods by land, sea, or air (with transport still mostly dependent on fossil energy), and the fact that it provides economic incentives for large-scale agricultural and industrial production. On the other hand, through international trade, countries export goods and services produced based on their comparative or competitive advantage and buy those that they do not produce, which results in an efficient reallocation of resources across sectors.
In the current sustainable development paradigm, elaborated by the 2030 Agenda for Sustainable Development and the Sustainable Development Goals (SDGs), trade and export diversification strategies should be designed as an integral element of a broader sustainable development policy. This suggests that developing countries, particularly commodity dependent countries, African countries and LDCs, may need to shift the focus of their export diversification strategies away from GVC participation to other strategies that could help them achieve trade and economic growth not only quantitatively, but also structurally, in a manner that is environmentally sustainable and inclusive to all groups of people.7
The following section discusses the viability of services trade and South-South intraregional trade as two areas that are likely to provide continuing if not greater market opportunities for export diversification and sustainable development.
AID FOR TRADE AT A GLANCE 2019: ECONOMIC DIVERSIFICATION AND EMPOWERMENT - © OECD, WTO 2019

199
CHAPTER 7. EXPORT DIVERSIFICATION AT THE TIME OF SLOWBALISATION
SERVICES TRADE AND SOUTH-SOUTH INTERREGIONAL TRADE
Services trade
The services sector has emerged as the largest segment of most national economies, contributing a growing share to GDP, trade and employment, and becoming a major driving force of the world economy. Trade in services presents continued growth potential even in light of the global economic slowdown. UNCTAD and WTO estimated that world trade in services achieved an annual growth of 8% in 2018 (compared to 3% for the volume of world merchandise trade), to reach almost USD 6 trillion (USD 19.5 trillion for the value of merchandise trade) (Figure 7.4).8 Several developing countries have gained substantial benefits by exploiting trading opportunities in services, including modern exportable business services and temporary movement of natural persons that provide services. Lower-income developing countries, however, are yet to acquire the critical capacity to follow suit, relying heavily on traditional, non-tradable and low-productivity services, including the informal economy (UNCTAD, 2018f).
Figure 7.4. Services exports by main groups of economies, 2010-2018
Developed economies Transition economies Developing economies
0
1 000
2 000
3 000
4 000
5 000
6 000
7 000
201820172016201520142013201220112010
BILLIONS, CURRENT USD
Source: UNCTADStats.
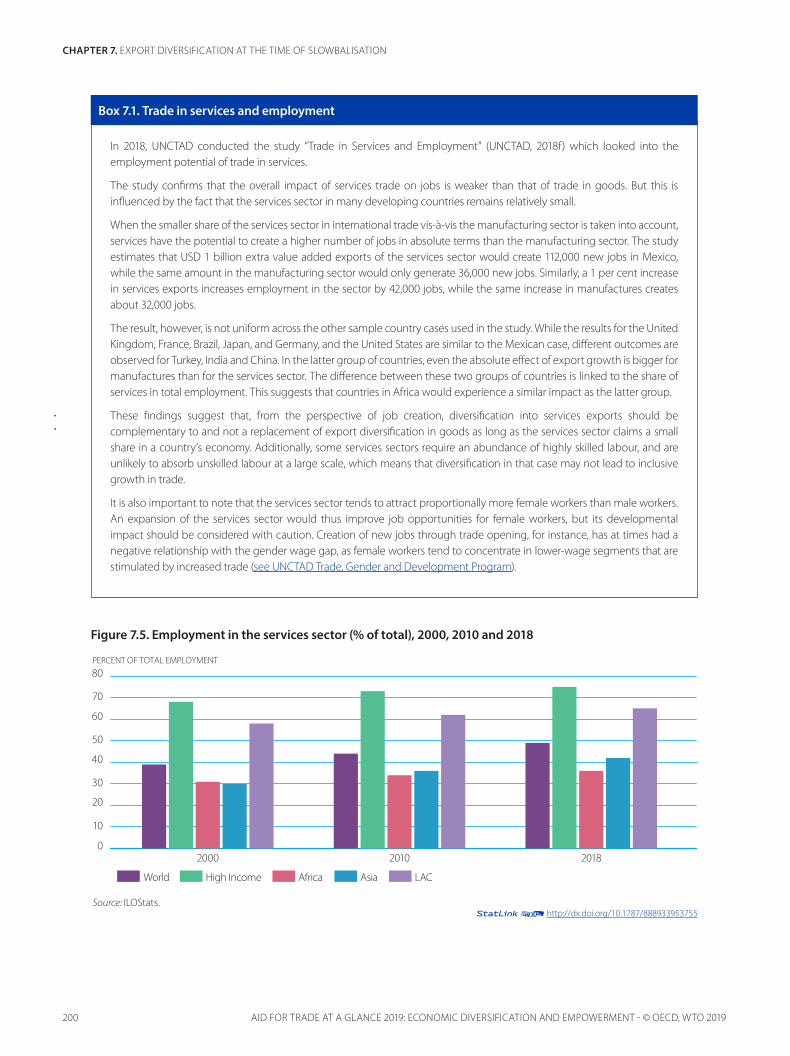
The services sector has become the largest provider of jobs in many developing countries, as manufacturing value chains are outsourced to services suppliers and as the final consumer demand for services increases with rising income levels. Today, the services sector absorbs almost half of the employment worldwide. In all developing regions the share of services employment has increased during the last decade. But the contribution of the services sector to employment varies significantly among different developing regions (Figure 7.5).
With more than 60% of total employment, the services sector is particularly important for Latin America and the Caribbean (LAC). In Africa, the services sector gradually increased its absorption of employment, but it is still at a lower level than in other developing regions. This is indicative of the small share that services claim in the overall economy in Africa.9 An UNCTAD study confirms that the impact of services trade on jobs in services has the potential to create a higher number of jobs in absolute terms than trade in the manufacturing sector (Box 7. 1).
12http://dx.doi.org/10.1787/888933953736
AID FOR TRADE AT A GLANCE 2019: ECONOMIC DIVERSIFICATION AND EMPOWERMENT - © OECD, WTO 2019
200
CHAPTER 7. EXPORT DIVERSIFICATION AT THE TIME OF SLOWBALISATION
Figure 7.5. Employment in the services sector (% of total), 2000, 2010 and 2018
In 2018, UNCTAD conducted the study “Trade in Services and Employment” (UNCTAD, 2018f) which looked into the employment potential of trade in services.
The study confirms that the overall impact of services trade on jobs is weaker than that of trade in goods. But this is influenced by the fact that the services sector in many developing countries remains relatively small.
When the smaller share of the services sector in international trade vis-à-vis the manufacturing sector is taken into account, services have the potential to create a higher number of jobs in absolute terms than the manufacturing sector. The study estimates that USD 1 billion extra value added exports of the services sector would create 112,000 new jobs in Mexico, while the same amount in the manufacturing sector would only generate 36,000 new jobs. Similarly, a 1 per cent increase in services exports increases employment in the sector by 42,000 jobs, while the same increase in manufactures creates about 32,000 jobs.
The result, however, is not uniform across the other sample country cases used in the study. While the results for the United Kingdom, France, Brazil, Japan, and Germany, and the United States are similar to the Mexican case, different outcomes are observed for Turkey, India and China. In the latter group of countries, even the absolute effect of export growth is bigger for manufactures than for the services sector. The difference between these two groups of countries is linked to the share of services in total employment. This suggests that countries in Africa would experience a similar impact as the latter group.
These findings suggest that, from the perspective of job creation, diversification into services exports should be complementary to and not a replacement of export diversification in goods as long as the services sector claims a small share in a country’s economy. Additionally, some services sectors require an abundance of highly skilled labour, and are unlikely to absorb unskilled labour at a large scale, which means that diversification in that case may not lead to inclusive growth in trade.
It is also important to note that the services sector tends to attract proportionally more female workers than male workers. An expansion of the services sector would thus improve job opportunities for female workers, but its developmental impact should be considered with caution. Creation of new jobs through trade opening, for instance, has at times had a negative relationship with the gender wage gap, as female workers tend to concentrate in lower-wage segments that are stimulated by increased trade (see UNCTAD Trade, Gender and Development Program).
Box 7.1. Trade in services and employment
0
10
20
30
40
50
60
70
80
201820102000
PERCENT OF TOTAL EMPLOYMENT
High Income Africa Asia LACWorld
Source: ILOStats. 12http://dx.doi.org/10.1787/888933953755
AID FOR TRADE AT A GLANCE 2019: ECONOMIC DIVERSIFICATION AND EMPOWERMENT - © OECD, WTO 2019

201
CHAPTER 7. EXPORT DIVERSIFICATION AT THE TIME OF SLOWBALISATION
Figure 7.6. Services Trade Restrictions Index by sector, regional averages
Developing Africa
Developing America Developed economies
Developing Asia
0 10 20 30 40 50 60 70
Transportation services
Telecommunications services
Retail services
Professional services
Financial services
Overall index
Note: this figure compares the restrictiveness of services trade policy across regions based on simple averages across countries of the World Bank Services Trade Restrictions Index, which ranges from 0 to 100. The World Bank Services Trade Restrictions Database covers 103 countries (79 developing) and financial, basic telecommunications, transport, distribution and selected professional services. The information for the database was collected between 2008 and 2010.
Source: World Bank Services Trade Restrictions Database. 12http://dx.doi.org/10.1787/888933953774
AID FOR TRADE AT A GLANCE 2019: ECONOMIC DIVERSIFICATION AND EMPOWERMENT - © OECD, WTO 2019

202
CHAPTER 7. EXPORT DIVERSIFICATION AT THE TIME OF SLOWBALISATION
Services trade has the potential to contribute to export diversification through two different channels: the role of services as exports, and their role as embedded inputs to economic activities. As exports, services trade can directly contribute to vertical export diversification, by shifting exports away from primary products. In this way, countries would be able to diversify their exports without going through an industrialisation phase (Ghani and O’Connell 2014). The tradability of services is also increasing with the advancement of information and communication technology (ICT) (Ghani and Kharas 2010) as innovations in ICT continue to decrease the costs associated with services trade (Ghani and O’Connell 2014). Initially the progress in ICT only influenced the financial services (e.g. via online transactions), but it now con-tributes to development of trade in a variety of services, including education and health services.10
In their role as embedded inputs, services are vital not only as linkages between different steps in value chains, such as transportation services, but also as direct inputs in the production of goods (e.g. research, financial services, etc). The increasing “servicification” of manufacturing, i.e. increased reliance of the manufacturing sector on services, in past decades has made the role of services as embedded inputs all the more relevant.11 Services reform that facilitated access to competitive services inputs has increased the productivity and the competitiveness of the manufacturing sector, for example in the cases of India, (Arnold et al. 2016), and Chile (Fernandes and Paunov 2012).
To further enhance services trade, trade policy matters. This is because services trade still faces substantial policy barriers, though at varying degrees across countries and sectors. According to the Services Trade Restrictions Index, some fast-growing developing countries in Asia have some of the most restrictive services trade policies, while other developing countries are very open. Trade in professional and transportation services has remained restricted across the board, while financial and retail services are usually more open (Figure 7.6). Additionally, restrictiveness can vary considerably by mode across countries and sectors, which further complicates trade in services (Borchert, Gootiiz, and Mattoo 2012).12
South-South Intraregional Trade
The second area that can nurture export diversification of developing countries in the coming years is South-South intraregional trade. Developing countries have already been exporting more diverse products, including processed products, to neighbouring countries than to their traditional developed-country trade partners.
Figure 7.7 provides a detailed picture of the changes in the composition of exports experienced by different developing country groups in the years between 1995-2017. Exported products are grouped into five categories: high-technology, medium technology, resource-based and low technology, primary products and other, using the definition provided by Lall (Lall, 2000).13 The right side axis reflects the share of exports to each respective market. In the years since 1995, Africa’s exports to the South have increased significantly, from just over 20% of the total in 1995 to almost 50% in 2017. Africa’s exports to the South include more low- and medium-technology products than their exports to the North, but the main component remains primary products. This may be influenced by the high concentration in the primary sector of Africa’s exports to China, which accounts for around 10% of Africa’s total exports.
Looking at intra-Africa trade, the breakdown of traded products is very different from the above. Intraregional trade as a share of total exports has been gradually but steadily increasing in Africa and reached 20% in 2017. It is also more diver-sified and contains much greater shares of low- and high-technology based products. Figure 7.8 provides the changes in the share of medium and high technology products in Africa’s total exports in the years 2005, 2010 and 2017, grouped according to the destination. The share of medium and high technology exports to the world increased from 9% in 2005 to 15% in 2017. But medium and high technology exports claimed almost a quarter of Africa’s intraregional trade in 2017, having increased by over 7 percentage point since 2005. This trend, i.e. a higher degree of export diversification in intraregional trade, is consistent across different developing regions throughout the years. Intraregional trade appears to encourage intra-industry export diversification, and exports with higher technology content than exports to the world, as confirmed for the case of East Africa in (Na, 2019).
AID FOR TRADE AT A GLANCE 2019: ECONOMIC DIVERSIFICATION AND EMPOWERMENT - © OECD, WTO 2019

203
CHAPTER 7. EXPORT DIVERSIFICATION AT THE TIME OF SLOWBALISATION
Figure 7.7. Exports by technological category and partner, selected regions, 1995-2017
Source: UN COMTRADE. Note: East, South and South East Asia excludes China. Product categories are based on the classification developed by Lall (Lall, 2000).
SHARE IN TOTAL EXPORTS, PERCENT
1995 2000 2005 20152010
EXPORTS, PERCENT
100100
5050
00
SHARE IN TOTAL EXPORTS, PERCENT
1995 2000 2005 20152010
EXPORTS, PERCENT
100100
5050
00
SHARE IN TOTAL EXPORTS, PERCENT
1995 2000 2005 20152010
EXPORTS, PERCENT
100100
5050
00
SHARE IN TOTAL EXPORTS, PERCENT
1995 2000 2005 20152010
EXPORTS, PERCENT
100100
5050
00
SHARE IN TOTAL EXPORTS, PERCENT
1995 2000 2005 20152010
EXPORTS, PERCENT
100100
5050
00
SHARE IN TOTAL EXPORTS, PERCENT
1995 2000 2005 20152010
EXPORTS, PERCENT
100100
5050
00
SHARE IN TOTAL EXPORTS, PERCENT
1995 2000 2005 20152010
EXPORTS, PERCENT
100100
5050
00
SHARE IN TOTAL EXPORTS, PERCENT
1995 2000 2005 20152010
EXPORTS, PERCENT
100100
5050
00
SHARE IN TOTAL EXPORTS, PERCENT
1995 2000 2005 20152010
EXPORTS, PERCENT
100100
5050
00
SHARE IN TOTAL EXPORTS, PERCENT
1995 2000 2005 20152010
EXPORTS, PERCENT
100100
5050
00
SHARE IN TOTAL EXPORTS, PERCENT
1995 2000 2005 20152010
EXPORTS, PERCENT
100100
5050
00
SHARE IN TOTAL EXPORTS, PERCENT
1995 2000 2005 20152010
EXPORTS, PERCENT
100100
5050
00
SHARE IN TOTAL EXPORTS, PERCENT
1995 2000 2005 20152010
EXPORTS, PERCENT
100100
5050
00
SHARE IN TOTAL EXPORTS, PERCENT
1995 2000 2005 20152010
EXPORTS, PERCENT
100100
5050
00
Developed countries
Developing countries
Intra-Regional
China
AFRICA LATIN AMERICA AND THE CARIBBEAN
EAST, SOUTH AND SOUTHEAST ASIA
(EXCLUDING CHINA)
CHINA
High technology
Medium-technology
Resource-based and low-technology
Primary products
Others
Share of this partner in total exports, percent
12http://dx.doi.org/10.1787/888933953793
AID FOR TRADE AT A GLANCE 2019: ECONOMIC DIVERSIFICATION AND EMPOWERMENT - © OECD, WTO 2019

204
CHAPTER 7. EXPORT DIVERSIFICATION AT THE TIME OF SLOWBALISATION
Figure 7.8. Share of medium and high technology goods in African exports by destination
0
5
10
15
20
25
30
AfricaDeveloping economiesDeveloped economiesWorld
PERCENT
2010 20172005
Source: UNCTADStat. Key Statistics and Trends in Regional Trade in Africa (UNCTAD, 2019b).
Greater export diversification in South-South intraregional trade has happened despite the fact that market access con-ditions or trade facilitation within intraregional trade are not always favourable to trade. ESCAP, for example, estimates that the intraregional trade potential in South Asia is around USD 81 billion, of which only a third is realised due to the high cost of trade, among other barriers.14 There appears to be significant space for further reduction in trade costs in South-South regional settings (WTO, 2018b).
As regards market access conditions, a significant impact upon trade costs increase is generated by technical regulatory measures applied by importing countries, such as technical barriers to trade (TBT) and sanitary and phytosanitary (SPS) measures. TBT and SPS measures are domestic technical measures with legitimate policy objectives such as protection of human and animal health, safety and environment. TBT and SPS measures stem from policy objectives that are not related to trade, but because of their significant impact upon trade flows, such technical measures can constitute non-tariff measures (NTMs) that increase trade costs via, inter alia, high cost of compliance (e.g. laboratory testing and certification).
Various studies have found that NTMs have a greater impact upon trade cost increase than tariffs.15 The trade-distorting impact of NTMs can be measured by estimating the ad valorem equivalent (AVE) of the cost of meeting NTMs, i.e. as a percent of an import price. A study finds that NTMs applied in the food and agriculture sectors in Africa could raise unit values of products traded intra-regionally by 15-30% compared to the average intraregional tariff in the same sector of around 7% (UNCTAD, 2019b). The average AVE of NTMs in the manufacturing sector is estimated to be around 5% to 20%, compared to the average intra-Africa tariff of 5.4%.16
Technical measures tend to be costlier and more burdensome for smaller producers and businesses than for bigger firms. According to the International Trade Centre (ITC), small and medium enterprises (SMEs) in developing countries are disproportionally affected by procedural obstacles and NTMs, as they often lack the appropriate resources to deal with these barriers (Rollo, 2016).
12http://dx.doi.org/10.1787/888933953812
AID FOR TRADE AT A GLANCE 2019: ECONOMIC DIVERSIFICATION AND EMPOWERMENT - © OECD, WTO 2019

205
CHAPTER 7. EXPORT DIVERSIFICATION AT THE TIME OF SLOWBALISATION
SOUTH-SOUTH REGIONAL REGULATORY COOPERATION
Services restrictions, technical NTMs and, more generally, regulatory differences between countries can prevent economies of scale in international markets for goods and services. For example, the costs attached to supplying professional services (e.g. licenses or degrees for accountants, doctors, etc.) must be paid separately in each market, instead of being spread out across destinations. However, neither services restrictions nor technical NTMs can be simply eliminated, as they are usually legitimate domestic measures serving a country’s socio-economic and environ-mental objectives. Since economic, social and environmental standards that are unilaterally incorporated to a country’s domestic regulation may inadvertently affect local and foreign producers, consumers and competition, there are gains to be made from regulatory convergence or regulatory cooperation.
Regional (and global) regulatory cooperation can boost trade in services and intraregional trade, reducing the risk of unintentional effects of regulation on local markets and trading partners. In this sense, regulatory cooperation can encourage export diversification by reducing transaction costs associated with services trade and intraregional trade.17 Regulatory cooperation on services trade, for example promoting joint communication infrastructure and network development, can create a more facilitative policy environment.
Developing regions already have multiple regional trade agreements (RTAs) in place, many of which include some pro-visions on services trade restrictions and technical NTMs. Existing RTAs and emerging ones such as the African Continental Free Trade Area (AfCFTA) can provide a platform for further regulatory cooperation, which in turn can improve regional market access conditions, and with them increased likelihood for export diversification.18 Regulatory and institutional frameworks that are best fit to local conditions and priorities are critical for a good functioning of services sectors, par-ticularly infrastructure services, as their performance is highly dependent on the quality of regulations.
Regulatory cooperation beyond existing RTA provisions can take the form of mutual recognition of regulatory measures or harmonisation, among others. Regulatory cooperation takes different forms depending on a number of factors: existing regulation, financial and technical resources, the countries’ priorities in the trade-off between social goals and competition in services, and the services or goods sector in question. For instance, cooperation in financial services is more likely to take the form of harmonisation efforts of prudential regulation, perhaps through the adoption of interna-tional standards such as Basel III, whereas for professional services mutual recognition may be more suitable. In the case of goods, evidence shows that mutual recognition agreements (MRAs) for technical NTMs have a larger positive effect on trade for technology intensive industries (Jang, 2018).19
Multiple efforts in the direction of mutual recognition and harmonisation of regional regulation are underway. For example, between 2003 and 2014 countries of the Association of Southeast Asian Nations (ASEAN) signed Mutual Recognition Arrangements (MRAs) for tourism, accountancy, architecture, dentistry, engineering, medicine and nursing. Although it is too early to determine the effect of these MRAs on trade with any certainty, they have already led to a capacity building effort in member States to upgrade national regulation and training standards (Mendoza et al, 2016). In the case of NTMs on goods, a number of Standards and Trade Development Facility (STDF) projects that seek to use Good Regulatory Practices (GRPs) in the development or review of SPS measures have encouraged regional con-vergence in regulation. For example, the Regional Feed and Food Safety Programme sought to advance regulatory harmonisation with regard to trade in animal feed in ten countries in Latin America and the Caribbean. To that effect, a number of specific tools were developed, such as common glossaries and comparative analyses of national and regional regulation, among other activities, such as capacity building.20
AID FOR TRADE AT A GLANCE 2019: ECONOMIC DIVERSIFICATION AND EMPOWERMENT - © OECD, WTO 2019
206
CHAPTER 7. EXPORT DIVERSIFICATION AT THE TIME OF SLOWBALISATION
In cases where mutual recognition or harmonisation of regional regulation is too challenging, even increasing regu-latory transparency among countries may already be an important step forward for regional regulatory cooperation. Some innovative approaches for increasing regulatory transparency have started in South-South RTAs, such as the African Regional Economic Communities (RECs) establishing the Tripartite Free Trade Area by bringing together three African RECs, namely the Common Market for Eastern and Southern Africa (COMESA), the East African Community (EAC) and the Southern African Development Community (SADC). Using the international classification of NTMs, developed by UNCTAD and the Multi-Agency Support Team (MAST), the Tripartite Free Trade Area has developed a web-based reporting mechanism (www.tradebarriers.org) that enables the private sector to directly report NTBs or NTM-related trade obstacles they face when exporting to member countries.21
The potential economic benefits from regional regulatory cooperation can be huge. An UNCTAD study on the Economic Community of West African States (ECOWAS) suggests that regulatory cooperation on NTMs can reduce trade restrictions by more than 25%, which can result in an increase in intra-ECOWAS trade of 15% and total income of USD 300 million per year (UNCTAD, 2018d). Another study estimated that regulatory cooperation can increase welfare by USD 21 billion in the AfCFTA and by USD 23 billion in the African, Caribbean and Pacific (ACP) Group of States. This is more than five times the possible gain from total tariff elimination (Vanzetti, Peters and Knebel, 2017).
Regional regulatory cooperation can also prompt other benefits, such as income and employment generation, cost-effective inputs and services within the region, and enhanced competitiveness due to higher competition within the region, made possible through deeper regional market integration. This can, in turn, enhance progress in African countries towards meeting the SDGs. The regional sphere is a particularly appropriate arena for incorporating environmental and social dimensions into trade policy. Developmental challenges such as income inequality, gender inequality, water scarcity, and environmental degradation, can be addressed more effectively and more efficiently via regional regulatory cooperation than attempted individually. This is why the Addis Ababa Action Agenda recognises “(..) the significant potential of regional economic integration and interconnectivity to promote inclusive growth and sustainable development and commit to strengthening regional cooperation and regional trade agreements”.22
THE ROLE OF AID FOR TRADE
The regional regulatory cooperation, mutual recognition and harmonisation efforts described in the previous section can become the vehicle that leads to export diversification associated with the achievement of multiple SDGs. While these are, beyond any doubt, desirable outcomes, the deep integration process leading up to them is riddled with political complexity, as well as being time- and resource-intensive. Additionally, as pointed out in (OECD, 2014), for regional economic integration to materialise, trade-related infrastructure and processes need to be efficient.
As highlighted in (Lamersen, Muoio, & Roberts, 2019), the time, resources and preconditions required for a successful process of regional integration provide a rationale for aid for trade under a number of the themes in the initiative: improving trade-related infrastructure, facilitating trade, creating a trade-enabling environment and building pro-ductive capacities. This means that even though in the period 2006-2017 only between 11% and 19% of aid-for-trade disbursements were specifically dedicated to regional or global programs, many disbursements for national programs contributed to the necessary preconditions for regional integration.23
Although aid-for-trade programmes with a specific global or regional focus represent a small share of total aid-for-trade flows, the absolute amount of funds devoted to them increased threefold between 2006 and 2017, from USD 2.2 to USD 6.6 billion.24 These funds have mostly been devoted to building productive capacity (60-80%) and economic infra-structure (12-29%).
AID FOR TRADE AT A GLANCE 2019: ECONOMIC DIVERSIFICATION AND EMPOWERMENT - © OECD, WTO 2019

207
CHAPTER 7. EXPORT DIVERSIFICATION AT THE TIME OF SLOWBALISATION
Funds aimed at supporting regional regulatory cooperation, mutual recognition and harmonisation efforts would most likely be classified under global or regional funds destined for trade policy and regulation. This aid-for-trade category increased from 248 million in 2006 to 565 million in 2017 but has remained fairly stable since 2011. In particular, the RTAs item of this category (CRS code 33130), which contains work on TBT and SPS measures at a regional level, ranged between 49 and 125 million since 2006. Even if the entire RTA category was dedicated to regional work on technical NTMs, the funds assigned to that purpose would seem low, considering the potential economic benefits from regional regulatory cooperation.25
There are a number of reasons why most aid-for-trade funds remain destined for the national level despite the large potential benefits of some regional programmes, as explained in detail in (Lamersen, Muoio, & Roberts, 2019). In some cases, regional externalities may be hard to appropriate, leading to the oversight of potential beneficial programmes. Additionally, a number of characteristics of regional programmes makes their implementation more challenging. Countries at different levels of development and with different political environments will find additional difficulties in coordinating regional implementations. Similarly, differences in the real or perceived costs and benefits of implemen-tation for each country can lead to complications in the implementation of a regional agenda. Moreover, countries are usually involved in multiple integration processes simultaneously, making alignment of national and regional actions more difficult. Also, it is commonly the case that the coordination of multiple donors, the private sector and civil society are required for a successful implementation of a regional program.
It is also important to highlight that partner countries responding to the 2017 Aid for Trade Monitoring and evaluation exercise consistently stated export diversification and regional integration among their top aid-for-trade priorities.26
The priorities of partner countries, together with the potential benefits of regional regulatory integration suggest that this needs to be a priority area despite its implementation challenges. There is a continued role for aid for trade in supporting efforts to develop institutional mechanisms and capacity building that facilitate local coordination of regional programmes.
AID FOR TRADE AT A GLANCE 2019: ECONOMIC DIVERSIFICATION AND EMPOWERMENT - © OECD, WTO 2019

208
CHAPTER 7. EXPORT DIVERSIFICATION AT THE TIME OF SLOWBALISATION
NOTES
1. Even though it was first coined by Adjiedj Bakas, a Dutch trend-watcher, in 2015, the term “slowbalisation” has only been increasingly used since its recent appearance in The Economist, “Globalisation has faltered”, January 24th 2019. But the underlying trends in trade and FDI that this term describes have long been studied as detailed below.
2. The World Economic Situation and Prospects 2019 estimates that global economic activity will expand by 3 per cent in 2019 but considers that growth may have peaked amid escalating trade disputes, risks of financial stress and volatility, and an undercurrent of geopolitical tensions (UN, 2019).
3. The World Bank Group, Global Monthly, March 2019.
4. GVC participation is defined as in (Koopman et al., 2014).
5. UNCTAD Press Release, Trade Wars: The Pain and the Gain, 4 February 2019.
6. Tim De Chante, “If the world population lived like…”, August 8, 2012. De Chante used a subset of the data produced by the Global Footprint Network (GFN).
7. Paragraph 9, Transforming our world: the 2030 Agenda for Sustainable Development.
8. UNCTAD, Trade in Services, 2018: First Annual Estimate, 2 April 2019.
9. In Africa, agriculture still accounts for a significant share – around 58 per cent – of total employment.
10. For example, specific telemedicine services enabled by broadband technology are increasingly used in Afghanistan (Rocha 2017).
11. We follow here the definition of “servicification” used in (Miroudot 2017), which refers to the increased reliance of the manufacturing sector on services, whether embedded as inputs or bundled with outputs.
12. Services trade is defined by mode of supply: mode 1 corresponds to cross-border supply, mode 2 to consumption abroad, mode 3 to commercial presence and mode 4 to presence of natural persons.
13. Exported products are classified according to the 3-digit SITC, revision 2 classification. See Lall (2000) for more details on the classification of exports according to technological content.
14. ESCAP (2018), Press Release, “Regional Cooperation Critical for Sustainable Trade”, 16 October 2018.
15. For instance, see Kee, Nicita and Olarreaga (2008).
16. Cadot et al (2015) estimated that the average AVE of all NTMs existing in the animal and vegetable sectors is in the range of 26-27 per cent. That is, complying with NTMs imposed by importing countries when exporting animal or vegetable products would cost on average around 26-27 per cent of the product price. This is significantly higher than the average tariff barrier in the same sector, which is in the range of 7-8 per cent.
17. Regulatory cooperation is in fact an important component of trade facilitation. Improved trade facilitation is associated with an expansion in the range of products exported (Dennis and Shepherd, 2011; Beverelli et al., 2015).
18. Research on preferential trade agreements (PTAs) suggests that regulatory cooperation can benefit small firms in terms of market gains relatively more than large firms (Baccini, Pinto, and Weymouth, 2017). Additionally, a growing number of PTAs incorporate provisions explicitly mentioning MSMEs, either promoting cooperation on MSMEs or exempting them from PTA obligations (WTO, 2016). With regards to women empowerment, new PTAs increasingly contain explicit gender considerations, generally included in labour provisions. Evidence shows that agreements with labour provisions contribute to narrowing the gender gap in participation in the workforce, and at least for some countries, the gender gap in wages as well (ILO, 2017).
AID FOR TRADE AT A GLANCE 2019: ECONOMIC DIVERSIFICATION AND EMPOWERMENT - © OECD, WTO 2019

209
CHAPTER 7. EXPORT DIVERSIFICATION AT THE TIME OF SLOWBALISATION
19. Interestingly, the effect is also larger for trade between non-OECD countries.
20. http://www.feedfoodseguro.org/el-proyecto
21. The MAST group is composed of the following international organisations: Food and Agriculture Organization (FAO), International Monetary Fund (IMF), International Trade Centre (ITC), Organisation for Economic Co-operation and Development (OECD), United Nations Conference on Trade and Development (UNCTAD), United Nations Industrial Development Organization (UNIDO), World Bank, and World Trade Organization.
22. Paragraph 87 of the Addis Ababa Action Agenda of the Third International Conference on Financing for Development (July 2015).
23. The lion’s share of bilateral aid-for-trade funds targeted economic infrastructure and building productive capacities, with 51-62 and 36-47 per cent of total disbursements each between 2005 and 2017.
24. These values are expressed in 2017 prices.
25. The examples to that effect mentioned earlier are an additional USD300 million per year of trade in ECOWAS (UNCTAD, 2018d), and a USD 23 billion increase in welfare in the African, Caribbean and Pacific (ACP) Group of States (Vanzetti, Peters and Knebel, 2017).
26. When asked to list their top 5 aid-for-trade priorities, 65 out of 86 respondents included export diversification, and 35 also mentioned regional integration (the first and fourth most frequently listed priorities respectively).
AID FOR TRADE AT A GLANCE 2019: ECONOMIC DIVERSIFICATION AND EMPOWERMENT - © OECD, WTO 2019

210
CHAPTER 7. EXPORT DIVERSIFICATION AT THE TIME OF SLOWBALISATION
REFERENCES
African Development Bank (2016), Jobs for Youth in Africa: Strategy for Creating 25 Million Jobs and Equipping 50 Million Youth 2016-2025. African Development Bank, Abidjan.
Arnold, J. M., Javorcik, B., Lipscomb, M. and A. Mattoo (2016). ‘Services Reform and Manufacturing Performance: Evidence from India’. The Economic Journal, 126 (590): 1–39.
Baccini, L., Pinto, P. M., and S. Weymouth (2017). ‘The distributional consequences of preferential trade liberalization: firm-level evidence’, International Organization, 71(2), 373–395.
Betcherman, G. and Khan, T (2015), Youth Employment in Sub-Sahara Africa.
Beverelli C., Neumueller, S. and R. Teh (2015). ‘Export diversification effects of the WTO Trade Facilitation Agreement’. World Development, 76(C):293–310.
Borchert, I., Gootiiz, B. and A. Mattoo (2012). ‘Policy Barriers to International Trade in Services: Evidence from a New Database’. Policy Research Working Paper, No. 6109. World Bank, Washington, D.C.
Cadot, O., Asprilla, A., Gourdon, J., Knebel, C. and R. Peters (2015). ‘Deep Regional Integration and Non-Tariff Measures: A Methodology for Data Analysis’. UNCTAD/ITCD/TAB/71, UNCTAD, Geneva.
Constantinescu, C., Mattoo, A., and M. Ruta (2018). ‘The Global Trade Slowdown: Cyclical or Structural?’. The World Bank Economic Review, lhx027, https://doi.org/10.1093/wber/lhx027.
Dennis, A. and B. Shepherd (2011). ‘Trade facilitation and export diversification’. The World Economy, 34(1):101–122.
ESCAP (2018). ‘Policy development and potential impacts of trade tensions in Asia and the Pacific’, in Asia-Pacific Trade and Investment Report 2018: Recent trends and developments, ESCAP, Bangkok.
Fernandes, A.M., and C. Paunov (2012). ‘Foreign Direct Investment in Services and Manufacturing Productivity: Evidence for Chile’. Journal of Development Economics 97 (2): 305–321.
Ghani, E. and H. Kharas (2010). ‘The Service Revolution’. Economic Premise, No. 14. World Bank, Washington, D.C.
Ghani, E. and S. D. O’Connell (2014). ‘Can Service Be a Growth Escalator in Low-Income Countries?’ Policy Research Working Paper, No. 6971. World Bank, Washington, D.C.
ILO (2017). Handbook on Assessment of Labour Provisions in Trade and Investment Arrangements. International Labour Organization, Geneva.
Jang, Y. J. (2018). ‘How do mutual recognition agreements influence trade?’. Review of Development Economics, 22(3), e95-e114.
Kee, H.L., Nicita, A. and M. Olarreaga (2008). ‘Estimating trade restrictiveness indices’. The Economic Journal 119.534 (2008): 172-199.
Lall, S. (2000). ‘The Technological Structure and Performance of Developing Country Manufactured Exports, 1985-1998’. QEH Working Paper Series, No. 44, Queen Elizabeth House, University of Oxford, Oxford.
Lamersen, F., Muoio, R., and Roberts, M. (2019). ‘Regional Aid for Trade in Africa: a catalyst for economic integration and devel-opment’ in Luke, D. and J. Macleod (Eds.) (2019). Inclusive Trade in Africa. Routledge, New York, 2019.
Mendoza, D. R., Desiderio, M. V., Sugiyarto, G., and B. Salant (2016). Open Windows, Closed Doors: Mutual Recognition Arrangements on Professional Services in the ASEAN Region. Asian Development Bank, Manila, Philippines.
Miroudot, S. (2017). ‘The Servicification of Global Value Chains’, Multi-year Expert Meeting on Trade, Services and Development, UNCTAD, Geneva.
Na, H. (2019). ‘Is intraregional trade an opportunity for industrial upgrading in East Africa? ’. Oxford Development Studies, 1-15.
AID FOR TRADE AT A GLANCE 2019: ECONOMIC DIVERSIFICATION AND EMPOWERMENT - © OECD, WTO 2019

211
CHAPTER 7. EXPORT DIVERSIFICATION AT THE TIME OF SLOWBALISATION
OECD (2014). Regional Perspectives on Aid for Trade. OECD Publishing, Paris.
OECD (2018). ‘International Regulatory Cooperation’, Policy Brief, October 2018.
OECD/WTO (2017). Aid for Trade at a Glance 2017: Promoting Trade, Inclusiveness and Connectivity for Sustainable Development. WTO, Geneva/OECD Publishing, Paris.
Rocha, Nadia (2017). ‘Trade as a Vehicle for Growth in Afghanistan: Challenges and Opportunities’. Working Paper. World Bank, Washington, D.C.
Rollo, V. (2016). ‘Technical regulations affect exporters’ performance: firm-level evidence from developing countries’. ITC Working Paper Series, WP-02-2016.E. International Trade Centre, Geneva.
UN (2015). Transforming our world: the 2030 Agenda for Sustainable Development, Resolution adopted by the General Assembly on 25 September 2015 (A/RES/70/1), United Nations, New York.
UN (2019). World Economic Situation and Prospects 2019. United Nations, New York.
UNCTAD (2018a). Export Diversification and Employment in Africa. (UNCTAD/ALDC/2018/3), UNCATD, Geneva.
UNCTAD (2018c). World Investment Report 2018. UNCTAD, Geneva.
UNCTAD (2018d). ‘Regional Integration and Non-Tariff Measures in the Economic Community of West African States (ECOWAS)’. (UNCTAD/DITC/TAB/2018/1), UNCTAD, Geneva.
UNCTAD (2018e). Trade and Development Report 2018: Power, PLatforms and the Free Trade Delusion. (UNCTAD/TDR/2018), UNCTAD, Geneva.
UNCTAD (2018f). ‘Trade in Services and Employment’. (UNCTAD/DITC/TNCD/2018/1), Geneva.
UNCTAD (2019a). Global Investment Trends Monitor, Issue 31, January 2019, Geneva.
UNCTAD (2019b). ‘Key Statistics and Trends in Regional Trade in Africa’. (UNCTAD/DITC/TAB/2019/3), UNCTAD, Geneva.
UNCTAD (2019c). Key Statistics and Trends in Trade Policy 2018: Trade Tensions, Implications for Developing Countries. (UNCTAD/DITC/TAB/2019/1), UNCTAD, Geneva.
Vanzetti, D., Peters, R. and C. Knebel (2017). ‘Non-tariff measures: lifting CFTA and ACP trade to the next level’. (UNCTAD/SER.RP/2017/14), Geneva.
WTO (2016). World Trade Report 2016: Levelling the trading field for SMEs. World Trade Organization, Geneva.
WTO (2018a). Annual Overview Report of the Director-General on trade-related developments (WT/TPR/OV/21), December 2018, Geneva.
WTO (2018b). World Trade Statistical Review 2018. World Trade Organization, Geneva.
World Bank, Global Economic Prospects: Darkening Skies, January 2019, Washington DC.
AID FOR TRADE AT A GLANCE 2019: ECONOMIC DIVERSIFICATION AND EMPOWERMENT - © OECD, WTO 2019