chapter 7 vulnerability to informal sources of finance...
TRANSCRIPT

Vulnerability to Informal Sources of Finance and Role of Microcredit
Department of Applied Economics, CUSAT 195195
Chapter 7 VULNERABILITY TO INFORMAL SOURCES OF
FINANCE AND ROLE OF MICROCREDIT
7.1 Indebtedness of households
7.2 Long term sources of finance
7.3 Emergency sources of finance
7.4 Incidence of Informal Borrowings: Influence of microcredit
7.5 Model Fitting
7.6 Role of SHGs - A critique
7.7 Analysis of borrower preferences Co
nt
en
ts
7.8 References
7.1 Indebtedness of households
As easy and low cost credit is the single most important element of
financial inclusion, indebtedness of households need close examination. The
financial inclusion drive in the country has insisted upon opening of ‘no frills’
savings account by banks with the impetus on provision of low cost and easier
access to credit. However this has been crippled by various factors including
procedural formalities, time lag in sanction and disbursal of loan, terms of loan
like collateral security requirements etc. Thus ‘no frills’ account opened by the
poor remains inoperative, serving to add to the country’s macro scan of number
of accounts opened by the population. It was considered worthwhile to look into
the pattern of indebtedness to understand the demand for credit and
proportionate contribution of sources of finance before looking into household
preferences for sources of finance. The study broadly divides sources of
finance into formal, semi formal and non formal sources. The formal financial
institutions include Commercial banks, RRBs, Cooperative banks, Primary

Vulnerability to Informal Sources of Finance and Role of Microcredit
Department of Applied Economics, CUSAT 196196
Agricultural Credit Societies, and State Government Agencies. Microfinance
Institutions are considered to be semi formal institutions as they act as
mediator between formal agencies and the public. Inorder to find the
dependence on non formal sources and to estimate credit gap, purpose wise
borrowings of households were enquired. Another demarcation made was in
case of period of loans; the emergency requirements of finance and long term
borrowings were estimated separately to understand the dependence on non
formal borrowings.
7.2 Long Term Sources of Finance
Long term borrowings in the current study encompass borrowings made
by households for a time period of more than one year. Number of households
indebted for various purposes is given in Table 7.1. It can be observed that
majority of the households availed loans for purchasing of fishing related
assets and for the requirement of life cycle events. This can be attributed to the
role of SHG bank linkage which links SHG group to banks for a loan on the
basis of the savings corpus mobilized and deposited with the bank. Loan for
obtaining fishing related assets and for life cycle events was obtained by 183
and 179 households respectively, specifying its importance as two of the most
important purposes of borrowing. Loans were also taken for miscellaneous
activities including educational needs, purchase of household articles etc. Per
capita loan per borrower was the highest for the purpose of borrowing for life
cycle events followed by loan for fishing related assets. The sample included
households of which at least one member was involved in fishing and notably
non-operating owners of fishing vessels did not form part of the survey.
Borrowings for purchase of fishing crafts is limited to non mechanized and
motorised crafts which has a lesser market value compared to mechanized
ones and hence the result. It is notable that the average amount per borrower
is very meager (Rs 4995.44) for an IG (Income Generating) loan.

Vulnerability to Informal Sources of Finance and Role of Microcredit
Department of Applied Economics, CUSAT 197197
Table 7.1. Long term borrowings of households according to purpose
Particulars Housing Life cycle events
Fishing related assets
Other purposes IG loan Total
Number of households borrowed 55 179 183 210 106 733
Percentage of households 10.83 35.24 36.02 41.34 20.87 --
Per capita availability of loans per borrower 14572.7 67108.94 49934.4 5020 4995.44 32108.8
Per capita loan (all households, N=508) 1577.76 23646.65 17988.2 2075.20 1042.36 46330.2
Sum 801500 12012500 9138000 1054200 529517 23535717Source: Survey, 2010
Household’s long term borrowing from formal sources was for purchase of
fishing related assets followed by loans for life cycle events (Table 7.2). Long term
loans from SHGs, from groups linked to banks were for the purpose of income
generating activities (IGA). All other loans supplied by SHGs are short term,
usable for consumption purposes. Friends and relatives were depended upon by
31 households for life cycle events, while loans for other purposes topped the
priority. Informal borrowings from money lenders and traders were taken by a
majority of 84 households for purchase of fishing related assets while 70
households used this source for borrowing for life cycle events.
Table 7.2. Source wise long term borrowings of households
Purpose of borrowing Formal sources SHG Friends &
Relatives Moneylender
& Traders Housing 39 -- 5 11 Life cycle events 78 -- 31 70 Fishing related assets 96 -- 3 84 Other purposes 74 4 72 60 IGA loan -- 102 4 -- 287 106 115 225
Borrowings from formal sources were mainly for life cycle events, 44.47 per
cent of the loans for life cycle events and 44.60 per cent for purchase of fishing
assets (Table 7.3).

Vulnerability to Informal Sources of Finance and Role of Microcredit
Department of Applied Economics, CUSAT 198198
Table 7.3. Source wise percentage share of amount of borrowings for different purposes
Purpose of borrowing
Formal sources SHG Friends &
Relatives Moneylender
& Traders Total
Housing 6.55 -- 4.31 1.28 3.41 Life cycle events 44.47 -- 70.08 55.46 51.04 Fishing related assets 44.60 -- 2.22 40.75 38.83 Other purposes 4.38 2.62 22.71 2.50 4.48 IGA loan 0.00 97.38 0.67 -- 2.25 Total 100 100 100 100 100
Similar pattern was observed for moneylenders, where 96 per cent of the
loans were availed for life cycle events and purchase of fishing assets. Long term
borrowing from SHGs was for income generating activities (97.38 per cent) and
borrowing from friends and relatives was mainly for life cycle events (70.08 per
cent). Out of the total borrowings, almost 90 per cent was availed for life cycle
events and fishing related assets.
Cross sectional analysis of purpose wise loans was done to analyse sources
from which loans were availed by households. Out of the loans availed for housing
related purposes, highest contribution (71.55 per cent) was from formal sources
(Table 7.4). Borrowing from non formal sources was highest for life cycle events
and fishing related assets. IGA loans were almost exclusively distributed by SHGs.
Table.7.4. Purpose wise percentage share of amount of loans from different sources
Purpose of borrowing
Formal sources SHG Friends &
Relatives Moneylender & Traders Total
Housing 71.55 -- 7.99 20.46 100
Life cycle events 32.41 -- 8.66 58.93 100
Fishing related assets 42.72 -- 0.36 56.92 100
Other purposes 36.38 1.33 31.97 30.33 100
IGA loan -- 98.11 1.89 -- 100
Total 37.19 2.27 6.31 54.23 100

Vulnerability to Informal Sources of Finance and Role of Microcredit
Department of Applied Economics, CUSAT 199199
From the above analysis, inferences were drawn about the total amount
demanded by sample households and the contribution of formal and non formal
sources. It was found worthwhile to estimate the total credit gap experienced by
sample households and draw valid conclusions for the population. Out of the total
credit demanded, 39.5 per cent has been supplied by formal and semiformal
sources (Table 7.5). The credit gap thus identified is 60.5 per cent. Credit gap was
found the highest for the purpose of life cycle events (67.59 per cent) while it
remained high for purpose of acquiring fishing related purposes (57.28 per cent).
This result was reiterated by the finding of the FAO/UNTARS study on enhancing
financial services flow to small scale marine fisheries sector (Arunachalam, 2008).
The study found that traditional microfinance interventions appear unsuitable for
addressing the demand of finance for fish harvesting activities. This is important
from the perspective of financial inclusion of men in fisheries. The traditional
microfinance approaches are applicable more to the post harvest fishery where
women play an active role. Institutional sources of finance should prioritise their
credit polices to supply this portion of underserved population to serve the
objectives of financial inclusion in addition to looking into the needs of the
unbanked. From a detailed overview of purpose wise credit gap, loans for
purposes of servicing life cycle events, fishing related assets and other purposes
were to be concentrated by the formal financing agencies.
Table 7.5. Estimated long term demand for finance and credit gap
In Rs. ‘000
Demand for loan Formal and
Semi Formal financing
% of Total
demand
Estimated credit gap
% of Total demand
Housing 573.50 71.55 228.00 28.45
Life cycle events 3893.00 32.41 8119.50 67.59
Fishing related assets 3134.00 42.72 5234.00 57.28
Other purposes 397.50 37.71 656.70 62.29
IGA loan 519.52 98.11 10.00 1.89
Total 8517.52 39.46 14248.20 60.54

Vulnerability to Informal Sources of Finance and Role of Microcredit
Department of Applied Economics, CUSAT 200200
Interest rates and security requirements of loan products of financing
agencies are of concern as they tend to be a factor determining the choice of
source of loan. Though the interest rates charged by formal sources range from 7
per cent for the agricultural gold loan to a higher level of 15 per cent for a personal
loan, the lowest compared to other sources, the security requirements are
stringent that they insist for collateral like gold or land which cannot be supplied by
the poor in fisheries sector (Table 7.6). Contrasting observation was noted in case
of moneylenders and traders where there is no insistence on collateral security but
for a written agreement or right to sell, but the interest rate prevailing ranges from
60 per cent to 120 per cent.
Table 7.6. Interest rate charged by different sources and security requirements
Source Interest Rate Security furnished
Formal sources 7% to 15% Gold, Land, mortgaging Fishing assets, other collaterals and/or personal surety
SHGs 24% to 36% No security
SHGs with bank/MFI linkage 24% Savings corpus
Moneylenders 60% to 120% Written agreement
Traders 60% to 96% Sale agreement
However, the SHG loans are free of security, apart from the terms of being a
member of the group and abiding by its bye laws with an affordable interest rate
though higher when compared to the main stream formal financial institutions.
SHG with bank/MFI-bank linkage are supplied loans from the formal finance
providers on the basis of savings corpus mobilized by the group and deposited
with the financial institution. Repeat loans are provided only if the group succeeds
in paying off the loans.
7.3 Emergency borrowings of households
Emergency borrowings of household often determine the dependence on
informal lending. It is quite evident that none of the formal sources provide

Vulnerability to Informal Sources of Finance and Role of Microcredit
Department of Applied Economics, CUSAT 201201
immediate provision of finances as the informal lender does, even if the cost of
such finance is exorbitant. To identify the demand for such immediate finances
it is required to map the household’s emergency expenditure for one year recall
period. The limitation of under reporting some of the emergencies due to non
recording of such finances as also over reporting to attract funds for assistance
holds well in this situation. Keeping in view the above said reporting bias,
analysis of purpose wise emergency requirements of finance along with the
sources utilised has been discussed below. Three major items under which
short term borrowings was observed was in the events of medical, consumption
needs and other requirements which include working capital financing for
fishing, associated expenses with life cycle events etc.
Table 7.7. Source wise emergency demand for borrowings of households
Particulars Medical Consum
ption loan
Other purposes Total
Number of households borrowed 291 341 168 800
Percentage of households 57.28 67.13 33.07 **
Per capita availability of loans per borrower 2449.83 3441.06 7056.85 3839.81
Per capita loan (all respondents, N=508)
1403.35 2309.84 2333.76 6046.95
Total amount borrowed 712900 1173400 1185550 3071850
It was observed that consumption loan tops the list of emergency
requirements of finance of fisher households (67.13 per cent) followed by medical
expenses (Table.7.7). Per capita availability of loans per borrower was the highest
in case of other loans for working capital and socialization and life cycle events.
Total amount borrowed was highest for other purposes and the least in case of
medical expenses.
Vulnerability to Informal Sources of Finance and Role of Microcredit
Department of Applied Economics, CUSAT 202202
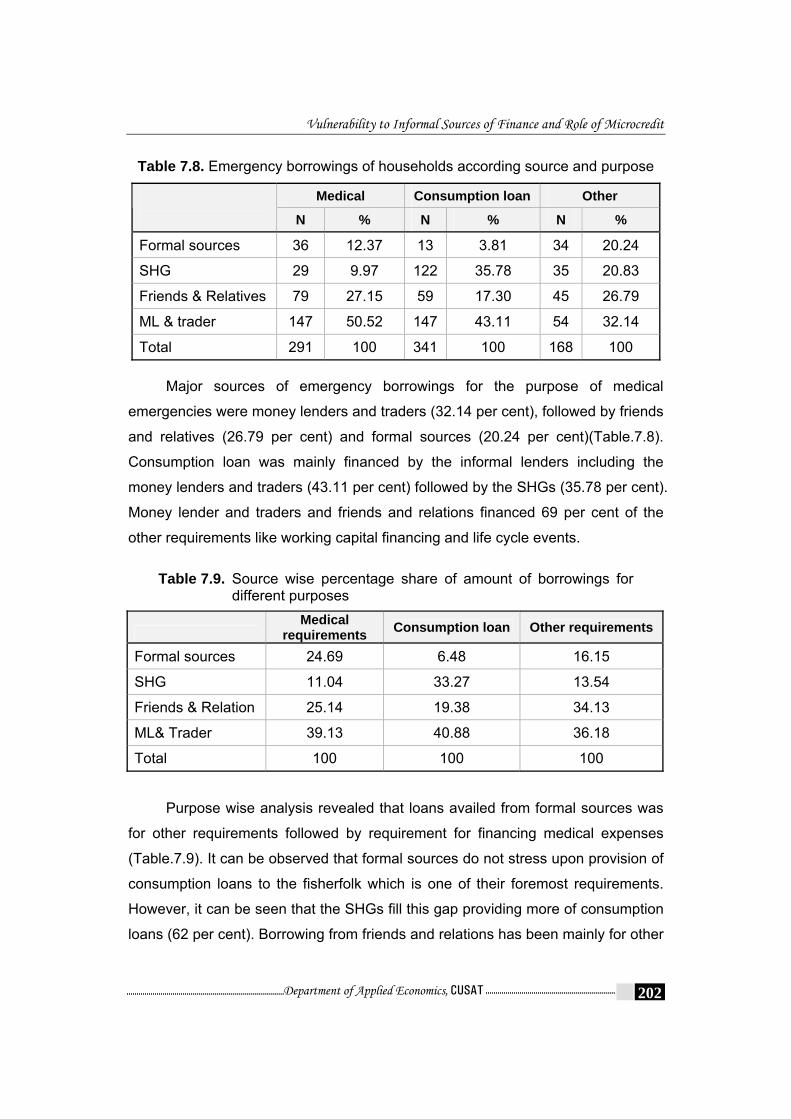
Table 7.8. Emergency borrowings of households according source and purpose
Medical Consumption loan Other N % N % N %
Formal sources 36 12.37 13 3.81 34 20.24
SHG 29 9.97 122 35.78 35 20.83
Friends & Relatives 79 27.15 59 17.30 45 26.79
ML & trader 147 50.52 147 43.11 54 32.14
Total 291 100 341 100 168 100
Major sources of emergency borrowings for the purpose of medical
emergencies were money lenders and traders (32.14 per cent), followed by friends
and relatives (26.79 per cent) and formal sources (20.24 per cent)(Table.7.8).
Consumption loan was mainly financed by the informal lenders including the
money lenders and traders (43.11 per cent) followed by the SHGs (35.78 per cent).
Money lender and traders and friends and relations financed 69 per cent of the
other requirements like working capital financing and life cycle events.
Table 7.9. Source wise percentage share of amount of borrowings for different purposes
Medical
requirements Consumption loan Other requirements
Formal sources 24.69 6.48 16.15
SHG 11.04 33.27 13.54
Friends & Relation 25.14 19.38 34.13
ML& Trader 39.13 40.88 36.18
Total 100 100 100
Purpose wise analysis revealed that loans availed from formal sources was
for other requirements followed by requirement for financing medical expenses
(Table.7.9). It can be observed that formal sources do not stress upon provision of
consumption loans to the fisherfolk which is one of their foremost requirements.
However, it can be seen that the SHGs fill this gap providing more of consumption
loans (62 per cent). Borrowing from friends and relations has been mainly for other

Vulnerability to Informal Sources of Finance and Role of Microcredit
Department of Applied Economics, CUSAT 203203
requirements (49.87 per cent) and moneylender and trader were mainly depended
upon for the fisherfolk’s requirement for consumption loan.
Table.7.10. Purpose wise percentage share of amount of loans from different sources
Medical
requirements Consumption
loan Other
requirements Total
Formal sources 39.68 17.14 43.18 100 SHG 12.50 62.00 25.49 100 Friends & Relation 22.10 28.03 49.87 100 Money lender & Trader 23.49 40.39 36.12 100 Total 23.21 38.20 38.59 100
After analysing the emergency requirements of finance and the sources
utilised by the fisher households, it was considered appropriate to assess the
existing credit gap left out by the institutional agencies of finance. From the
analysis it was estimated that majority of the emergency finance requirements
were financed by the informal financing agencies (65.92 per cent) (Table.7.11).
This finding was reiterated by the study by FAO/UNTRS on enhancing financial
services flow to small scale marine fisheries sector (Arunachalam, 2008) in the
Southern States in India including Tamilnadu and Kerala. The study found that
small scale fish workers who cannot access formal institutional credit except
through intermediary peoples organizations like SIFFS, Cooperatives, NGOs,
MFIs and SHGs and are forced to rely upon moneylenders, financiers, chit funds
and borrowings from friends and relatives. In many cases it was found that they
depended upon traders, merchants and moneylenders for financing production
purposes.
The credit gap was found the highest in case of medical finance
requirements and the least in case of consumption loans. Lesser credit gap with
consumption loans can be associated with the upcoming of SHGs as an
intermediate semi formal financing agency. A study on linkage banking by SHGs
by Kropp and Suran, (2002) found that SHG system worked like an informal

Vulnerability to Informal Sources of Finance and Role of Microcredit
Department of Applied Economics, CUSAT 204204
insurance that allows managing risks and income gaps effectively. They also
found that with SHG banking, a highly flexible financial service has been made
available to poor households, which allowed them to stabilize their income in most
cases. The SHG system allows members to maintain a more regular flow in
support of the family and of the microenterprise operated by the family.
Table 7.11. Estimated demand for finance and credit gap
Emergency finance
requirements
Formal + semi
formal finance
% of [2 w.r.to 1]
Estimated credit gap
% of [4 w.r.to 1]Purpose of loans
[1] [2] [3] [4] [5]
Medical requirements 712.9 254.7 32.80 458.2 67.20
Consumption loan 1173.4 466.35 39.74 707.05 60.26
Other requirements 1185.55 352 29.69 859.75 70.31
Total 3071.85 1073.05 34.08 2025 65.92 7.4 Incidence of Informal Borrowings: Influence of microcredit
Borrowing from informal sources, namely the moneylenders and traders
has been always observed as an imperfection in the rural credit markets, where
such borrowing indulges the poor borrower into the perpetual ‘debt bondage’
due to servicing of debt for long periods of time (Ramachandran and
Swaminathan, 2004; Rajashekhar and Suchitra, 2009). Though it is accepted
that in the absence of formal financial institutions to cater to the needs of the
poor, ultimate source of funds are the so called exploitative money lenders or
traders who provide ‘easy’ finance, the poor are not left with an alternative to
fall back in an emergency. In such situation, an alternative agency which would
combine the traits of lending of both formal and informal financing has been
envisaged by the policy makers. Microfinance is one such option that would
combine the advantages of formal and informal lending. People, who are
members of joint liability groups, start compulsory savings on weekly basis to
form a corpus, which is used for internal lending for consumption and short
term production needs. Access to consumption credit is expected to reduce the

Vulnerability to Informal Sources of Finance and Role of Microcredit
Department of Applied Economics, CUSAT 205205
dependence on informal borrowings. Further finances for IGAs are expected to
increase the income levels that would reduce vulnerability to informal
borrowings (Rajasekhar, 2004).
The informal borrowings by the households with or without membership in
SHG groups have been closely examined to understand the influence of
microfinance in reducing informal borrowing (Table.7.12). Surprisingly, it was seen
that though there was a marginal reduction in informal borrowings by the
households who are members of SHG/SHG bank/MFP linkage, majority of the
households tend to borrow from the informal lenders due to some or other reasons.
While a marginal two per cent reduction was noted with the SHG members
compared to non members, there was 15 per cent reduction in informal borrowings
in case of members of SHGs with MFP linkage. This can be attributed to the
inflexibility of SHGs in responding to emergency needs of the fisher households.
SHGs operate revolving credit which is extended to the members on the basis of
turns. Repeat loan is not sanctioned unless the current loan is repaid. Emergency
needs of finance cannot be serviced in such situations. This entails the households
to borrow from the informal sources for coping with the emergency hopeful to
service the debt once his/ her turn for loan in the SHG has arisen.
Table 7.12. Incidence of informal borrowings of households
No borrowings from informal sources
Borrowings from informal sources Status of households
Number % Number %
Non member 32 27.8 83 72.2
SHG member 51 36.7 88 63.3
SHG-MFP linkage 136 53.5 118 46.5
Total 219 43.1 289 56.9 Hypothesis testing
To test whether there is any difference between the households who are non
members of SHGs and members of SHGs/SHG-MFP linkage; chi square test has

Vulnerability to Informal Sources of Finance and Role of Microcredit
Department of Applied Economics, CUSAT 206206
been employed. Result of Chi square test was found to be significant at 1 per cent
level of significance (Table 7.13). Hence the hypothesis that there is no difference
between members and non members in informal borrowings is rejected.
Alternative hypothesis which assumes lesser informal borrowings for SHG
members compared to non members holds good.
Table 7.13. Chi-Square Test of significance
H0: Informal borrowings is the same for SHG member households and non-member households
H1: Lesser informal borrowings is resorted to by SHG member households compared to non-members
Value df Asymp. Sig. (2-sided)
Pearson Chi-Square 24.563a 2 .000
Likelihood Ratio 24.993 2 .000
Linear-by-Linear Association 23.887 1 .000
Having found that there is reduction in borrowal from informal lenders by
member households, it was considered appropriate to find the quantitative relation
between these two variables in conjunction with other factors. Here dependent
variable is incidence of borrowing from informal sources. The detail of model fitting
is described below.
7.5 Model Fitting
The major contributing factors that determine the incidence of informal
borrowings among households include the following factors.
Emergency needs of households
Emergency finance requirements of households, the sources utilized
and amount availed has been collected through the survey. This is
subject to the reporting bias of the respondent, where they tend to
over report (for assuming write offs or subsidies) and under report
(failure to recall the number of finances during past one year).

Vulnerability to Informal Sources of Finance and Role of Microcredit
Department of Applied Economics, CUSAT 207207
Income level of households: Income level of the households has
been estimated using proxy variable, the expenditure level of
households. However this is subjected to severe limitation that
expenditure of a household reflect only the consuming part without
due regard to savings.
Occupational diversification: occupational diversification was
accounted by taking into consideration the dependence of the
household on fishing activity. The household being exclusively
dependent on fishing was assigned value of zero, and diversification
would be assigned one.
Membership in an SHG/SHG-bank/MFP linkage
The response variable of incidence of informal borrowings among
households is dichotomous. With the above identified variables, the best fitting
model in this situation is the binary logistic regression model. According to Hair et
al, 1998 logit analysis is an ideal complement to multiple regression due to its
ability to utilize a binary independent variable. As all the variables in the model are
categorical variables, they were modeled using the first mentioned category in
each case as the reference category. This model basically looks into the
probability of responding to the explanatory variables. The probability could be
modeled using a linear function of explanatory variables using the logit
transformation, leading to the logistic regression model
Log (p/1-p) = β0+β1X1+ β2X2+ ………….+ βnXn
Where ‘p’ is the expected value of the response variable, which in this model is
coded as ‘1’ for borrowing from informal sources and ‘0’ for borrowing from
informal sources. In other words, ‘p’ is the probability of responding to the
explanatory variables. The regression coefficients can be estimated using the
method of maximum likelihood.

Vulnerability to Informal Sources of Finance and Role of Microcredit
Department of Applied Economics, CUSAT 208208
The risk of the household being poor may therefore be said to be
dependent on these characteristics and this is specified in the following logistic
model.
Log (p/1-p) = β0+β1D1+ β2D2+ β3D3+ β4D4+ β5X5,
where β represents the estimated parameters.
The model was found to be significant in explaining the influence of the
independent variables. The Nagelkerke R square is considered to be
equivalent with the R square in linear regression. A value of 20 per cent to 40
per cent is usually acceptable in binary logistic regression. As the model
quantifies cross sectional data, value of R square is likely to be low. Further R
square values are seldom considered important for analysis of qualitative
variables. The model correctly classified 67.3 per cent of the cases. Correlation
between the explanatory variables was examined to check for multicollinearity.
Higher correlation between independent variables is an indicator of
multicollinearity. The statistical significance of the estimated coefficients for
each explanatory variable was tested using Wald statistic, the standard for a
logistic regression.
Omnibus Tests of Model Coefficients
Chi-square df Sig.
Step 85.500 11 .000
Block 85.500 11 .000
Step 1
Model 85.500 11 .000
Model Summary
Step -2 Log likelihood Cox & Snell R Square
Nagelkerke R Square
1 609.061a .155 .208

Vulnerability to Informal Sources of Finance and Role of Microcredit
Department of Applied Economics, CUSAT 209209
Table. 7.14. Coefficients and odds ratio: result of binary logistic regression
B S.E. Wald df Sig. Exp(B) Odds Ratio
Constant 1.592 .276 33.304 1 .000 4.914
Membership in SHG/SHG-Bank/MFP linkage -1.059 .251 17.820 1 .000 .347
Occupational diversification -.677 .222 9.300 1 .002 .508
Number of emergencies 1 48.984 2 .000
2 1.115 .217 26.441 1 .000 3.048
3 or more 1.758 .279 39.753 1 .000 5.801
Proxy for household Income .842 3 .840
-.304 .623 .238 1 .625 .738
-.425 .611 .484 1 .486 .654
-.269 .634 .180 1 .672 .764 The results of the logistic regression reveal the following. Members of SHGs
or SHG-bank/MFP linkage are found to have lesser probability of incidence of
informal borrowings (by 2.9 times) compared to the reference category of non
members (Table 7.14). Occupational diversification was found significant and the
probability of borrowing from informal sources was lesser by 2 times compared to
reference category. Number of emergency finance requirements was significant in
determining the incidence of informal borrowings. Two emergencies could
increase the probability of informal borrowings by 3 times and more than two
emergencies would increase the probability of informal borrowings by 5.8 times.
The household income that could have effect on the borrowing pattern of
households failed to have significant influence. One reason could be that income
of households has been accounted by taking the proxy variable of expenditure.
7.6 Role of SHGs: A Critique
To exactly chalk out the role of microfinance in serving the credit needs of
the poor, it is worthwhile to examine the extent of financing and its share in
existing demand for finance. It was found that in the existing long term demand for

Vulnerability to Informal Sources of Finance and Role of Microcredit
Department of Applied Economics, CUSAT 210210
finance, share of SHG in total number of loans financed was 28.44 per cent while
the share in total amount of loan demanded was only 2.34 per cent (Table 7.15).
Similarly, share of SHG in total formal and semi formal loans was 46 per cent
while it was 6.26 per cent in total amount of loan supplied by formal and
semiformal agencies. This is a clear indication of spread of microfinance
promoting financial inclusion, but failing to provide financial deepening.
Table 7.15. Demand for finance and share of microcredit
Share (%) of SHG in
Demand for finance Total
number of loans
demanded
Number of formal and semi-formal
loans
Total amount of
loans demanded
Amount of formal and semi-
formal loans
Housing 0 0 0 0
Life cycle events 0 0 0 0
Fishing related assets 0 0 0 0
Other purposes 1.92 5.13 1.33 3.52
IGA loan 98.39 100 98.11 100
Total long term requirements 28.44 46.00 2.34 6.26
Medical requirements 8.19 34.12 11.04 30.90
Consumption loan 35.78 90.37 33.27 83.70
Other requirements 20.83 50.72 13.54 45.60
Total emergency requirements 21.55 64.36 20.49 58.67
Regarding emergency/short term requirements of finance, 21.55 per cent of
the total existing emergency requirements were financed by the SHGs, while this
formed 20.49 per cent of the total amount. Share of SHGs in the number of
emergency formal and semiformal loans was 64.36 per cent, and its
corresponding share in amount was 58.67 per cent. Hence it can be inferred that
SHGs could not make significant impact in servicing long term demand for finance
among fisher households, while there is considerable impact on short
term/emergency finances. This finding has been corroborated by several research
and policy papers dealing with the issues involved in microfinance. The total

Vulnerability to Informal Sources of Finance and Role of Microcredit
Department of Applied Economics, CUSAT 211211
disbursement of credit through SHGs is limited. For 2005-06, the average loan per
member was less than Rs. 4000. It is argued that SHGs need to graduate into
promoting enterprises and factor in livelihood diversification. They also need to
increase their access to the supply chain and to the capital market and to
appropriate production and processing technologies (Rangarajan, 2006, Thorat,
2006, Jones et al, 2007)
Pattern of usage of SHG loans
Pattern of usage of micro credit provides an idea of actual utilisation of the
borrowal from SHGs. While consumption credit is granted to SHGs, usage of loans
is spread among a number of reasons including repayment of debts, consumption,
gold purchase and medical expenses (Table 7.16). Repayment of debts assumes
importance because of the inbuilt inflexibility of SHG lending, where the savings
corpus limits the number of borrowers at a particular time. Micro credit serves
limited members credit needs at a point of time and repeat borrowings are allowed
only when the first loan is being repaid. This inflexibility causes members to
depend on informal sources at the point of need in view of repaying it when his/her
turn appears to be eligible for credit from the group.
Table 7.16 Usage of micro credit
Purposes for which loans are used Number of households Per cent
Consumption 56 14.31
For servicing life cycle events 29 7.32
Purchase of gold 43 11.06
To repay debts 77 19.59
Maintenance of house 47 11.95
Education 21 5.37
Medical 52 13.25
Social expenditure 12 3.09
Other purposes 55 14.07
Total 393 100

Vulnerability to Informal Sources of Finance and Role of Microcredit
Department of Applied Economics, CUSAT 212212
7.7 Analysis of borrower preferences
Given the role of formal, semi formal and informal financing in serving as
sources of finance for the coastal settlements, there exist reasons that promote
preference of particular source of finance. Given the attributes of each source of
lending, there are positive and negative traits that attract/keep away borrowers.
Apart from the socio economic factors, these supply side traits are equally
influential in determining the borrowing pattern of households. It goes without
saying that socio economic factors decide the suitability of borrower to terms and
conditions of the supplier of finance. For example, the household with lesser
assets seldom approaches a formal source of finance for getting the loan. Informal
lenders fill this gap. Similarly, microcredit bridges the gap between demand for
credit and formal finances giving the households advantage of not having to own
assets to serve as security for the loan. However micro credit is crippled by
insufficiency of loan amount.
Different sources of finance were evaluated by household’s to identify their
preferences. Ten variables characterizing each of the sources of finance, namely
formal, informal and semi-formal sources of finance were evaluated on a five point
scale. These variables were subject to factor analysis to identify the underlying
commonality behind the preference for sources of finance. Even though when
formal finance is more desirable, not everybody can borrow as also there are
people who could not borrow to satisfy their demands in full. As there is
considerable difference between the mode of operation and terms and conditions
of loans supplied by formal, semi formal and non formal sources of finance, it was
decided to undertake factor analysis separately for each. Before attempting factor
analysis, respondent’s scores assigned to each of the variables for the sources of
finance has been analysed below.

Vulnerability to Informal Sources of Finance and Role of Microcredit
Department of Applied Economics, CUSAT 213213
Table 7.17. Households evaluation of sources of formal finance (Percentage)
Formal financing SD D NO A SA Mean score
Std. Deviation
Timeliness 33.66 37.20 25.20 2.76 1.18 2.01 .898
Adequacy 14.96 34.06 38.58 11.42 0.98 2.49 .916
Procedural hassles 24.61 48.03 21.85 4.33 1.18 2.09 .858
Suitability to needs 18.90 28.35 37.80 10.04 4.92 2.54 1.061
Supply of consumption loans 40.55 34.84 19.88 4.33 0.39 1.89 .896
Need for collateral 44.09 32.68 21.85 1.38 0.00 1.81 .823
Proximity 11.81 39.96 44.69 3.15 0.39 2.40 .751
Terms of repayment 3.94 28.35 36.81 26.77 4.13 2.99 .936
Penalty for non payment 19.49 41.73 34.25 3.35 1.18 2.25 .846
Rate of interest 2.17 4.13 24.21 26.18 43.31 4.04 1.018
SD: Strongly disagree, D:Disagree, NO: No Opinion, A: Agree, SA; Strongly Agree
Features like interest rate and terms of repayment of credit from formal
sources of finance were preferred by majority of the households while all other
variables including timeliness in providing loan, adequacy, procedural hassles,
suitability to needs, supply of consumption loans, need for collateral security,
proximity, suitability to needs and supply of consumption loans were under rated
by majority of the respondents (Table.7.17). This implies that even though the
terms of loan like interest and repayment mode are suitable to borrowers, the
procedural formalities and other quality indicators associated with formal credit is
not suitable to the households. A study by Ngunen (2007) revealed that most
people had chosen formal financial sources as their first priority for getting loans
and when such attempt becomes unsuccessful they approach other informal
sources of finance.

Vulnerability to Informal Sources of Finance and Role of Microcredit
Department of Applied Economics, CUSAT 214214
Table 7.18. Households evaluation of sources of semiformal finance (Percentage)
Semi formal financing SD D NO A SA Mean score
Std. Deviation
Timeliness 1.18 11.42 32.28 44.49 10.63 3.52 .873 Adequacy 3.74 14.96 32.68 39.76 8.86 3.35 .964 Procedural hassles 0.59 5.12 21.26 37.01 36.02 4.03 .912 Suitability to needs 7.48 9.84 31.69 32.68 18.31 3.44 1.123 Supply of consumption loans 10.24 10.04 33.66 28.74 17.32 3.33 1.177 Need for collateral 2.17 8.86 21.65 40.16 27.17 3.81 1.002 Proximity 0.98 3.54 25.98 38.78 30.71 3.95 .892 Terms of repayment 2.56 7.87 33.66 22.64 33.27 3.76 1.077 Penalty for non payment 6.89 29.53 33.27 25.20 5.12 2.92 1.012 Rate of interest 2.56 3.15 50.00 28.35 15.94 3.52 .887
SD: Strongly disagree, D:Disagree, NO: No Opinion, A: Agree, SA; Strongly Agree
Semiformal financing by SHGs were preferred by majority of the borrowers
due to timeliness in supply of loan with no procedural hassles, the suitability to
their needs, supply of consumption loans, no collateral security required, proximity,
terms of repayment and interest rates (Table.7.18). However the penalty for non
payment and inadequacy of loan was found unsuitable by some of the
respondents.
Table 7.19. Households evaluation of sources of informal finance (Percentage)
Informal sources SD D NO A SA Mean Std. Deviation
Timeliness 3.35 5.91 11.02 40.55 39.17 4.06 1.019 Adequacy 4.33 11.02 19.88 30.12 34.65 3.80 1.157 Procedural hassles 4.53 7.28 17.32 16.34 54.53 4.09 1.188 Suitability to needs 10.83 13.39 20.28 29.33 26.18 3.47 1.301 Supply of consumption loans 8.27 8.66 28.94 33.07 21.06 3.50 1.159 Need for collateral 0.98 6.89 13.58 31.89 46.65 4.16 .970 Proximity 6.89 9.84 21.26 26.57 35.43 3.74 1.231 Terms of repayment 8.46 35.43 29.92 17.52 8.66 2.82 1.089 Penalty for non payment 25.20 33.46 25.59 12.80 2.95 2.35 1.080 Rate of interest 39.37 25.39 12.40 13.39 9.45 2.28 1.352 SD: Strongly disagree, D:Disagree, NO: No Opinion, A: Agree, SA; Strongly Agree
Vulnerability to Informal Sources of Finance and Role of Microcredit
Department of Applied Economics, CUSAT 215215
Evaluation of credit from informal borrowers revealed that preference factors
behind utilizing this source of finance is timeliness, adequacy, procedural hassles,
suitability to needs, supply of consumption loans and need for collateral and
proximity(Table 7.19). Rate of interest and terms of repayment and penalty for
payment are seen as shortcomings of the informal lenders.
What if the money lenders are abolished?
Given that moneylenders are a group with vested interests that they
advance money at exorbitant rates of interest naturally puts the question “Is there
a possibility to totally ban or illegalize money lending business that would save the
poor from their trap”. However a detailed investigation into such possibilities leads
to a negative opinion. In the absence of the moneylender who will serve the small
needs of finance of the poor? In the existing scenario, the moneylender cannot be
completely abolished as the alternatives to supply finance to the poor are not
sufficient. Though microfinance revolution has taken over all the nook and corners
of the villages, it can be observed that the moneylender’s role has not been
replaced. SHG borrowings incidentally involve some formality, compared to the
nextdoor private financiers, such as waiting for the turn to get the loan. This can be
substantiated by assessing the pattern of usage of loans availed from the SHGs.
Interestingly, it was observed that the loans availed from SHGs, whatsoever was
used primarily for releasing the debt bondage with informal lenders. However,
repayment of loans of SHGs are often stringent and inflexible that they again tend
to borrow from moneylenders or alternative sources of finance indicating perpetual
debt.
Fig. 7.1 presents the comparative assessment of sources of finance by fisher
households. As regards rate of interest, formal sources of finance were preferred
by the borrowers as they charge the lowest rate of interest. Penalty for non
payment was seen as problematic for all sources, including that of semi formal
agencies. Terms of repayment were preferable in case of semiformal sources.
Proximity criterion was served mostly by the informal and semi formal lenders.
Need for serving collateral security declined the households access to formal
financing agencies, while the same attracted them to informal and semi formal

Vulnerability to Informal Sources of Finance and Role of Microcredit
Department of Applied Economics, CUSAT 216216
sources of finance. Similar result was observed in case of supply of consumption
loans. Adequate, timely loans devoid of procedural hassles were supplied by the
informal lenders followed by semi formal sources. All these factors were weakened
in case of formal sources of finance. Tailor made loan products suitable to
borrowers needs are the specialty of the informal lenders.
Fig. 7.1. Preference for sources of finance
Vulnerability to Informal Sources of Finance and Role of Microcredit
Department of Applied Economics, CUSAT 217217
Fishing families all along the coast are indebted and they seem to be locked
in the state of indebtedness mainly to informal sources as they do not value this as
an unhealthy indicator. This occurs mainly due to the following reasons.
Attitude: The fisherfolk do not have the attitude to save. They are spendthrift
people who eventually concentrate on consumption with available resources
without having any concern for tomorrow. This can be also attributed to spending
of Government and other agencies concentrating the coastal belt.
Lethargy waiting for donor’s funds: Tsunami has been a blessing in disguise
with these marginalized segments benefited by grants from different sources
which otherwise would not have reached them. The grants include housing with all
amenities, fishing equipments and number of outreach programmes by various
agencies to ensure livelihoods of this marginalized section. One effect of these
programmes is that; people have turned lethargic waiting for agencies to provide
grant for their development than for eking out living for themselves. In line with
their expectation, the Fisheries department of the State has come up with large
number of development projects which would subsidise their participative
endeavours. There are even 100 per cent subsidised programmes offered by
agencies, which cost nothing to the fishing families but transfers all benefits.
However, these programmes are found to be non sustainable, that people tend to
back once the agency has withdrawn from the scene.
Consumption culture: One important aspect that needs to be studied is their
consumption culture. Compared to their earlier generation they live in a better
position supported by a host of agencies targeted at their development. However,
their pattern of consumption is very careless, that they follow a happy go lucky
way of life. Example may be sited from experiences associated with an SHG group
receiving assistance from the State agency. The group was involved in an activity
of aquaculture of mussel/oyster in the brackish water sites. The initial expenses
had to be borne by the groups which would be subsidised at a later stage. The
members found the seed capital by pledging their ornaments with a local
moneylender. Official in charge provided them with their eligible finance at a later

Vulnerability to Informal Sources of Finance and Role of Microcredit
Department of Applied Economics, CUSAT 218218
stage so that they could release their assets under pledge. However they did not
bother to take the gold instead purchased new dresses for the family.
Expense for lifecycle events: Marriages in fishing families are an extravaganza
which is a major reason for their indebtedness. A marriage is conducted with a lot
of pomp and show without bothering on their status of living. This turns out to be a
wasteful expenditure on life cycle events.
Social Cohesion: social cohesion is very high among the fisherfolk. If the fishing
family faces any trouble, no matter how distant the relation could be, they are
willing to offer financial as well as physical help. This is a plus point which helps
the fisher families; however, the financial help is often mobilized out of an informal
borrowing on the part of donor.
The new class of money lenders: The new class of money lenders is quite
different from the old professional moneylender who is a villager, having
knowledge of the whereabouts of the borrower. The new moneylender is often one
among themselves, not necessarily professional, often a trader or commission
agent involved in the fish trade. Otherwise there are groups particularly the Non
Banking Financial Companies (NBFCs)which have a network of branches all over
the area, operated through the disbursement and collection agents. The interest
rates of such borrowing are often high ranging from about 60 to 180 per cent. The
penalty for delinquency is not easy to comply with and often the collection agents
unravel reign of terror for the borrowing parties.
Factor Analysis
Factor analysis of household preference factors for formal, semi formal and
informal sources of finance were done using ten identified variables. These
variables describe the different aspects involved in sanctioning of the loan and
suitability to the borrower. It was found that there was a high correlation between
the variables and this was found to be statistically significant. Bartlett’s Test of
Sphericity and Kaiser-Meyer-Olkin measure of sampling adequacy was conducted
to analyse the applicability of factor analysis to the 10 variables (Hair et al, 1998).

Vulnerability to Informal Sources of Finance and Role of Microcredit
Department of Applied Economics, CUSAT 219219
The Bartlett’s statistics tests the hypothesis that the correlation matrix of chosen
variables is an identity matrix. This hypothesis may be rejected if the chi square
values are high. Similarly MSA value of KMO test indicates the proportion of
variance in the variables which is common variance that might be caused by
underlying factors. Value less than 0.50 indicates that factor analysis cannot make
any valid conclusions. Rules of thumb were only those factors were to be
retained, which when sorted in descending order in terms of variation explained,
cover cumulative 60 per cent of the total variation in the original variables. Second,
only those factors to be retained which have eigen values greater than 1. Once the
number of factors is known, the variables could be grouped into any of these
factors so that the characteristic of the underlying factor may be determined.
Towards this, rotated component matrices were calculated that gave factor
loadings for each of the variables. Factor loadings show the correlation between
factors and the variables. Large absolute values indicate that a variable and a
factor are closely related. On the basis of commonality among the variables that
have large loadings for a particular factor, the underlying dimensions were
identified.
Factor Analysis of household preference for formal sources of finance
The result of factor analysis was found significant at 1 per cent level and
KMO Measure of sampling adequacy exceeded 0.5 which is considered as
acceptable.
KMO and Bartlett's Test
Kaiser-Meyer-Olkin Measure of Sampling Adequacy. .647
Approx. Chi-Square 516.585
df 45
Bartlett's Test of Sphericity
Sig. .000
Results show that eigen values exceeded one in case of four
components. Component 1 explains 21.43 per cent of the variance, component
2 accounts for 15.16 per cent, component 3 explains 13.17 per cent and

Vulnerability to Informal Sources of Finance and Role of Microcredit
Department of Applied Economics, CUSAT 220220
component 4 explains 10.43 per cent. On this basis, the factors behind
preference of formal sources of finance were identified as loan quality
indicators, security requirement, loan product suitability and cost, ease of
access and repayment terms. The loan quality indicators include variables of
timeliness in providing the loan, adequacy of loan amount, procedural hassles
in applying for the loan and penalty at times of non payment of dues. Security
requirement for sanction of loans is a single important factor that affects
preferences which accounts for 15.16 per cent of the variance. Rest of the
variables was identified under the loan product suitability and cost of credit and
ease of access and repayment terms.
Table 7.20. Results of Factor analysis of formal sources of finance
Rotated Component Matrixa Component
Underlying factors Variables 1 2 3 4
Timeliness .700 -.075 -.039 .231
Adequacy .558 -.086 .263 .004
Procedural hassles .643 .230 -.117 .370
Loan Quality indicators
Penalty for non payment .677 .053 .139 -.255
Security requirement Need for collateral security .084 -.032 -.003 .797
Suitability of loan product -.083 .663 .181 .416
Supply of cons loans .226 .770 -.151 -.084
Loan product suitability and cost of credit
Rate of interest -.351 .559 .181 -.287
Proximity .219 -.084 .753 .287 Ease of access and repayment terms
Terms of repayment -.004 .140 .785 -.243
Factor Analysis of household preference for semi formal sources of finance
The result of factor analysis was found significant at 1 per cent level and
KMO Measure of sampling adequacy was 0.820 which is considered as
acceptable.

Vulnerability to Informal Sources of Finance and Role of Microcredit
Department of Applied Economics, CUSAT 221221
KMO and Bartlett's Test
Kaiser-Meyer-Olkin Measure of Sampling Adequacy. .820
df 45
Sig. .000
Results show that eigen values exceeded one in case of two components.
Component one explains 37.15 per cent and component two explains 14.66 per
cent of the variances. On this basis, the factors behind preference of semi formal
sources of finance were identified as conditionalities for loan and other loan
product features. Component one was found to have significant influence on
preference for source of finance which can be collectively termed as the
conditionalities of the availing the loan. This includes terms and conditions of
availing loans, mainly procedural hassles, security requirements, rate of interest,
terms of repayment, supply of consumption loans and proximity to the lender.
Semi formal loans are loans from SHG groups which provide loans to consumers
keeping in mind the above mentioned factors. The second component could be
termed as loan product features where the variables are adequacy, suitability,
timeliness and penalty for repayment.
Table 7.21. Results of Factor analysis of semi formal sources of finance
Factor loadings of Rotated Component Matrixa Component Variables 1 2
Terms of repayment .843 Proximity to lender .835 Security requirements .821 Procedural hassles .783 Supply of consumption loans .665 .361
Conditionalities of the loan
Rate of interest .578 .452 Adequacy .707 Suitability of the product .657 Timeliness in supplying loan -.406
Loan product features
Penalty for non repayment .388

Vulnerability to Informal Sources of Finance and Role of Microcredit
Department of Applied Economics, CUSAT 222222
Factor Analysis of household preference for informal sources of finance
The result of factor analysis showed significance at 1 per cent level.
Measure of sampling adequacy resulted in value of 0.824 which was also found to
be highly acceptable.
KMO and Bartlett's Test
Kaiser-Meyer-Olkin Measure of Sampling Adequacy. .824
df 45
Sig. .000
Results show that eigen values exceeded one in case of three components.
Component one explains 42.71 per cent of the variances while component two
explains 14.44 per cent of the variations and component three explains 12.86 per
cent of the variations. On this basis, the factors behind preference of informal
sources of finance were identified as loan product quality indicators, terms of the
loan and proximity to source and conditions of the loan.
Table 7.22. Results of Factor analysis of informal sources of finance
Rotated Component Matrixa Component 1 2 3
Timeliness .549 .278 .082
Adequacy .866 .084 .026
Procedural hassles .648 .553 .129
Suitability of the loan product .865 .155 .008
Loan Product quality indicators
Supply of consumption loans .780 .050 .259
Rate of interest -.094 -.871 -.033 Terms of the loan
Need to furnish collateral security .305 .789 .092
Proximity .435 .462 .618
Terms of repayment -.069 .299 .765 Proximity to source and Conditions of loan
Penalty for non payment .213 -.365 .727

Vulnerability to Informal Sources of Finance and Role of Microcredit
Department of Applied Economics, CUSAT 223223
Results indicate significant influence of component one, namely the loan
product quality indicators in borrower preference for informal sources of finance.
This factor includes variables like timeliness of loan, adequacy, procedural
hassles, suitability of the loan product and supply of consumption loans. It is very
clear that informal sources provide timely and adequate loan according to the
demand of the borrowers. Further there is no insistence for furnishing collateral for
availing loan. Another attraction to informal sources is that they are able to provide
tailor made products including consumption loans suitable to borrower’s
requirements. Component two and three are not that influential in determining
preferences as their combined effect is almost equal to half the influence of
component one. While component two includes variables specifying the terms of
loan, component three specifies proximity to source and conditions of the loan. 7.8 References
[1] Rajashekhar, D and Suchitra J.Y. (2009): “Microfinance Programmes and
Vulnerability to Debt Bondage”. Gopal K Kadekkodi and Brinda Viswanathan
(Eds.), Agricultural Development, Rural Institutions and Economic Policy,
Oxford University Press, New Delhi.
[2] Arunachalam, Ramesh. S, Kurien Katticaren, V.Swarup and Kalpana Iyer.
(2008): Enhancing Financial Service Flow to Small Scale Marine Fisheries
Sector, Chennai, United Nations Team for Tsunami Recovery Support, UN
India
[3] Jones, H., Williams, M and Thorat, Y. (2007): “Rural Financial Institutions
and Agents in India: A Historical and Contemporary Comparative Analysis”,
International Conference on Rural Finance Research, Moving Results into
Policies and Practice, FAO Headquarters, Rome
[4] Nguyen, C.H. (2007): Access to Credit and Borrowing Behaviour of
Households in a Transitioning Economy, www.ruralfinance.org

Vulnerability to Informal Sources of Finance and Role of Microcredit
Department of Applied Economics, CUSAT 224224
[5] Rangarajan, C. (2006): Microfinance and its future directions. In Towards a
Sustainable Microfinance Outreach in India, New Delhi: NABARD, GTZ and
SDC, pp. 19-25
[6] Thorat, Y.S.P. (2006): Microfinance in India: Sectoral Issues and
Challenges, in Towards a Sustainable Microfinance Outreach in India. New
Delhi: NABARD, GTZ and SDC, pp. 27-42
[7] Rajasekhar, D. (2004): Microfinance, Poverty Alleviation and Empowerment
of Women: A Study of two NGOs from Andhra Pradesh and Karnataka,
Social and Economic Change, Monographs, No. 4, Institute for Social and
Economic Change, Bangalore.
[8] Ramachandran V. K and Mathura Swaminathan. (2004): Financial
Liberalisation and Rural banking in India. Paper presented at the
International Conference on the Agrarian Constraint and Poverty Reduction:
Macroeconomic lessons for Africa, organized by the International
Development Economics Associates (IDEAs), Ethiopian Economic
Association (EEA) and CODESRIA, Addis Ababa.
[9] Kropp, E. W and Suran B.S. (2002): Linking Banks and (Financial) Self Help
Groups in India- An assessment, Paper presented at the Seminar on SHG
bank Linkage Programme at New Delhi on 25th and 26th November 2002,
NABARB, Mumbai, www.nabard.org
[10] Hair J.F., Anderson, R.T., Black, W. (1998): Multivariate Data Analysis,
Prentice Hall
….. …..