chapter 8 - research.vu.nl 8.pdfmartijn van der kuip1, marlo möller4, a. marceline van furth1 1...
TRANSCRIPT

Chapter 8Genetic and clinical risk factors for tuberculous meningitis outcome
Lisanne M. van Leeuwen1,2, Douwe Visser3, Eileen Hoal4, Pauline Versteegen1, Dan Zaharie5, Ronald van Toorn6, Sander Ouburg2, Martijn van der Kuip1, Marlo Möller4, A. Marceline van Furth1
1Department of Pediatric Infectious Diseases & Immunology, VU University Medical Center,
Amsterdam, The Netherlands2Department of Medical Microbiology and Infection Control, VU University Medical Center,
Amsterdam, The Netherlands3Department of Neonatology, Emma Children’s Hospital Academic Medical Center (AMC),
Amsterdam, The Netherlands4DST/NRF Centre of Excellence for Biomedical Tuberculosis Research, South African Medical
Research Council Centre for Tuberculosis Research, Division of Molecular Biology and
Human Genetics, Faculty of Medicine and Health Sciences, Stellenbosch University, Cape
Town, South Africa5Department of Neuroanatomy, Tygerberg Hospital, University of Stellenbosch, Cape Town,
South Africa6Department of Pediatrics and Child Health, Tygerberg Hospital, University of Stellenbosch,
Cape Town, South Africa
Submitted
Risk factors for TBM outcome 1
http://hdl.handle.net/###
Risk factors for TBM outcome 1
Genetic and clinical risk factors for tuberculous meningitis outcome
Lisanne M. van Leeuwen1,2, Douwe Visser3, Eileen Hoal4, Pauline Versteegen1, Dan Zaharie5, Ronald van Toorn6, Sander Ouburg2, Martijn van der Kuip1, Marlo Möller4, A. Marceline van Furth1
1Department of Pediatric Infectious Diseases & Immunology, VU University Medical Center, Amsterdam, The Netherlands
2Department of Medical Microbiology and Infection Control, VU University Medical Center, Amsterdam, The Netherlands
3Department of Neonatology, Emma Children’s Hospital Academic Medical Center (AMC), Amsterdam, The Netherlands
4DST/NRF Centre of Excellence for Biomedical Tuberculosis Research, South African Medical Research Council Centre for Tuberculosis Research, Division of Molecular Biology and Human Genetics, Faculty of Medicine and Health Sciences, Stellenbosch University, Cape Town, South Africa
5Department of Neuroanatomy, Tygerberg Hospital, University of Stellenbosch, Cape Town, South Africa
6Department of Pediatrics and Child Health, Tygerberg Hospital, University of Stellenbosch, Cape Town, South Africa
Submitted

AbstrACt
background: Tuberculous meningitis (TBM) is a devastating disease with high risk of mortality and severe neurologic morbidity, predominantly affecting young children. Evidence suggests that host genetic variation influences intracerebral inflammation, an important determinant of disease outcome.
Methods: In this study, conducted at a tertiary hospital in South Africa, we aimed to ascertain whether certain potentially disease modifying Single Nucleotide Polymor-phisms (SNPs) involved in TNFα, VEGF, Vitamin D and IL-4/IL-13 signaling are associated with TBM outcome. SNP genotyping was done with MassARRAY on postmortem brain samples from 43 adult and 40 childhood TBM patients and on serum of 52 pediatric TBM patients. Genotype characteristics, baseline clinical features, cerebrospinal fluid markers, cerebral imaging and its association with disease outcome after 6 months were investigated.
results: SNPs in genes related to Vitamin D (VDR rs7975232 AA genotype, PPP6R3 rs7109294 *C, CYP2R1 rs10741657 AA, CYP2R1 rs10766197 AA), VEGF (VEGFA rs833061 CC) and IL-4/IL-13 signaling (IL-13 rs2066960 *A, IL-4R rs1805015 CC), were significantly more prevalent in patients with a poor outcome. In children, a significant association was found between VEGFR1 rs9554316 GG genotype and poor outcome. Advanced stage of TBM disease, low CSF cell counts, convulsions, focal neurological deficits and cerebral infarctions were associated with adverse TBM disease outcome.
Conclusion: Our data suggest a genetically defined group of TBM patients that may be predisposed to advanced TBM disease and thus poorer outcome. Identifying poten-tial genetic risk factors are of vital importance to identify patients at risk and to optimize future genotype directed immunomodulatory interventions.
short suMMAry
SNPs in genes related to Vitamin D, VEGF and IL-4/IL-13 signaling, clinical signs of encephalitis (convulsions, infarctions, local neurological deficits), high TBM stage and biochemical findings (low CSF cell count) are risk factors for a poor TBM outcome.
Keywords
Tuberculous meningitis; Vascular Endothelial Growth Factor; Vitamin D; immune bal-ance; interleukin-4/-13
Risk factors for TBM outcome2
IntroduCtIon
Tuberculous meningitis (TBM), the most severe extra-pulmonary complication of tuber-culosis (TB) occurs after dissemination of Mycobacterium tuberculosis from a primary pul-monary focus to the central nervous system (CNS) (Wilkinson et al., 2017). Environmental factors, bacterial virulence, and host’s genetics have been shown to play an important role in determining susceptibility to TBM. Moreover, the host inflammatory response is an important determinant in TBM-related clinical deterioration and eventual disease outcome (Wilkinson et al., 2017). Numerous Single Nucleotide Polymorphisms (SNPs) in host response pathways, including Toll-like receptors, are associated with susceptibility to TBM (Caws et al., 2008; Hawn et al., 2006; Thuong et al., 2007; Wilkinson et al., 2017). For example, mutations in the gene encoding leukotriene A4 hydrolase (LTA4H) influence disease outcome as excessive LTA4H activity results in a hyperinflammatory phenotype, whereas lack of LTA4H activity leads to hypoinflammation (Thuong et al., 2017; Tobin et al., 2012, 2010; Van Laarhoven et al., 2017). Also, Interleukin-4 and 13 (Van Crevel et al., 2000; Visser et al., 2014), Vitamin D (Dangeti et al., 2018; Rizvi et al., 2016; Visser et al., 2014) and Vascular Endothelial Growth Factor (VEGF) (Datta et al., 2015; Misra et al., 2012; Oehlers et al., 2014; van der Flier et al., 2004; Visser et al., 2014) influence the immune response during TBM.
Several studies report that Vitamin D deficiency has modulatory effects on the human immune system and its deficiency predisposes TBM (Rizvi et al., 2016). Data on vitamin D deficiency in TBM and its relationship with treatment outcomes are limited. Recently the frequency of Vitamin D deficiency and insufficiency has been shown to be prevalent among TBM patients, however serum 25(OH)D was not associated with IL-1β levels in CSF or treatment outcome (Dangeti et al., 2018).
VEGF has been implicated in the pathogenesis of TBM as it is secreted by TBM-induced inflammatory cells. It is a potent inducer of vascular permeability and angiogenesis and may potentially worsen TBM outcome by disruption of the blood-brain barrier and increasing brain ischemia. Inhibition of VEGF may explain in part the clinical effect of adjuvant corticosteroid therapy in TBM (Schoeman et al., 2001).
Adjunctive corticosteroid treatment has been shown to reduce inflammation, thereby improving TBM outcome in HIV-negative patients (Donald et al., 2016; Prasad et al., 2016). Some clinical data suggest that thalidomide (a TNFα modifying agent), might be more effective than corticosteroids in controlling the harmful inflammatory complications of TBM (Schoeman et al., 2011; Tsenova et al., 1998; van Toorn et al., 2015). In the future, host genotype-specific therapies may prove the best solution to optimize the inflamma-tory response to mycobacterial infections. In this study, we aimed to investigate genetic and clinical factors and its association with poor TBM disease outcome. Differences in
Risk factors for TBM outcome 3
immune responses and disease pathogenesis in children and adults, led us to a separate analysis of genotype frequencies in children with TBM.
Methods
study setting, population and clinical data collected
This retrospective cohort study was conducted at Tygerberg Hospital (adherence area of 3.6 million), a tertiary hospital in Cape Town, South Africa. Study material included the postmortem brain specimens of 76 (38 adults and 38 children) as well as 7 brain biopsy samples obtained during diagnostic work-up or surgical procedures collected over a 37 year period (1975-2012) by the department of pathology Tygerberg Academic Hospital, Stellenbosch University. Hospital records were used to obtain relevant clinical and radiological data (Figure 1A, Zaharie et al., unpublished data). In addition, baseline blood, CSF samples and clinical data of 52 consecutive childhood definite TBM cases prospectively collected over a 4-year period (2009-2012) were analyzed (Figure 1A). CT and/or MRI scans with radiology reports were available for 43/52 patients.
tbM disease severity and outcome definition
Tuberculous meningitis stage is based on the ‘refined’ British Medical Research Council scale (van Toorn et al., 2012); Stage 1: Glasgow Coma Scale (GCS) of 15, without fo-cal neurological deficits; Stage 2a: GCS of 15, with focal neurological deficits, or GCS of 13–14, with or without focal neurological deficits; Stage 2b: GCS of 10–12, with or without focal neurological deficits; Stage 3: GCS <10, with or without focal neurologi-cal deficits. Neurological outcome was divided into four categories: 1) normal (normal motor function, intelligence, vision and hearing); 2) mild sequelae (hemiparesis, mild intellectual impairment and impaired vision and/or hearing); 3) severe sequelae (quadri-paresis, severe intellectual impairment, blindness and/or deafness); and 4) death. Out-come was defined as ‘good’ in the case of normal outcome or mild sequelae and ‘poor’ in the case of severe sequelae or death (Figure 1B). Motor function, intelligence, vision and hearing were tested, after completing 6 months of treatment. Intelligence, determined by developmental quotient (DQ) was measured by Griffiths test. Patients were grouped as ‘normal’ (DQ > 80), ‘mild intellectual impairment’ (DQ 50–80), or ‘severe intellectual impairment’ (DQ < 50). Vision and hearing were tested by a skilled neurologist and clas-sified as normal, impaired vision or hearing, and blindness or deafness. When hearing was impaired, a BERA (Brainstem Evoked Response Audiometry) or OAE (Otoacoustic Emissions) hearing test was performed for confirmation.
Risk factors for TBM outcome4

sample preparation
Formalin-fixed paraffin embedded (FFPE) brain tissue was sectioned with a microtome, per block 3-5 slices of 10μm (block size 8-54 cm2). DNA was extracted from FFPE with the NucleoSpin DNA FFPE XS kit (Macherey-Nagel, Duren, Germany) protocol was adjusted to the amount of tissue. DNA was extracted from blood according to the Nucleon BACC Genomic Extraction Kit protocol (Illustra, Buckinghamshire, UK). Concentration and purity assessments of DNA were determined using the Nanodrop 2000c and Nanodrop 2000/2000c software (ThermoFisher Scientific Waltham, MA, USA).
Genotyping
The following SNPs were selected:(1) TNFα-pathway: TNFA (rs1800629, rs361525, rs1800750, rs1799724), LTA4H (rs1978331,
rs2660898, rs17525495, rs2660845, rs2540475, rs2247570), TNFR (rs3397);
Neuropathology samples
Collected between 1975 – 2002a
N=83
< 14 yr: N=40 > 14 yr: N=43
Blood samples
Collected between 2009 – 2012b
N=52
< 14 yr: N=52 > 14 yr: N=0
Bloc8s o9tained a<er death N=76
< 14 yr: N=38 > 14 yr: N=38
Poor outcome
N=76
< 14 yr: N=38 > 14 yr: N=38
Good outcome
N=1
< 14 yr: N=1 > 14 yr: N=0
BiagnosCc 9iopsies
N=7
< 14 yr: N=2 > 14 yr: N=5
Missing outcome
N=2
< 14 yr: N=2 > 14 yr: N=0
Good outcome
N=35
< 14 yr: N=35 > 14 yr: N=0
Missing outcome
N=6
< 14 yr: N=1 > 14 yr: N=5
Sam
ples
O
utco
me
defin
ition
Poor outcome, N=91
Death -‐ N=77
Severe sequelae -‐ N=14
Good outcome, N=36
No sequelae -‐ N=10
Mild sequelae -‐ N=26
Poor outcome
N=15
< 14 yr: N=15 > 14 yr: N=0
A
B
Figure 1. Flow diagram of study material[A] This study is a combination of two historical cohorts. 83 neuropathology samples from adults and chil-dren were collected between 1975 and 2002, 76 samples were obtained after death, 7 from diagnostic biopsies. Out of these 7 diagnostic biopsies 1 patient had a good outcome and was analyzed in this group; the other 6 patients survived TBM, without further available information. 56 additional patients (age<14 years) were included between 2009 and 2012, of which blood samples were available in 52 cases and clini-cal information about outcome in 54 patients. [B] Outcome was defined as good (normal outcome or mild sequelae) or poor (severe sequelae or death). Patients with missing information about outcome were ex-cluded for further analysis. a: Zaharie et al, unpublished results, b: (Visser et al., 2014)
Risk factors for TBM outcome 5

(2) VEGF-signaling: VEGFA (rs699946, rs699947, rs833061, rs2010963, rs25648, rs3025039), FLT1 (rs9554316, rs7993418, rs9582036, rs9554320), VEGFR2 (rs12505758, rs7655964, rs2305948, rs2305949, rs11133360, rs2071559);
(3) Vitamin D cascade: VDR (rs7975232, rs7975232, rs7975232, rs7975232), PPP6R3 (rs7109294), SCUBE (rs732594), PHF11 (rs2980, rs2981), CYP27B1 (rs10877012, rs4646536, rs703842), CYP2R1 (rs10741657, rs12794714, rs10766197), GC (rs7041, rs1155563);
(4) IL-4/IL-13 pathway: IL13 (rs1881457, rs1800925, rs2066960, rs20541, rs1295685), IL13RA1 (rs2250747), IL4 (rs2243250), IL4R (rs1805015, rs1801275), STAT6 (rs324011).
Selected SNPs and/or the respective pathways were previously associated with tubercu-losis susceptibility (Hölscher et al., 2016; Möller et al., 2010; Tobin et al., 2010; Visser et al., 2014; Wilkinson et al., 2017). Genotyping was performed using MassARRAY with an iPlex system (Inqaba Biotec, South Africa).
ethics
The study was approved by the Health Research Ethics Committee of the Faculty of Health and Medical Sciences, Stellenbosch University, Cape Town, Western Cape, South Africa (ethics approval number S12/11/298 and N09/07/185).
statistical analysis
Statistical analyses were performed using Rstudio with functions from the ‘genetics’ R package (Warnes et al., 2013) and SPSS version 2.0 (SPSS Inc., Chicago, IL, USA). Hardy-Weinberg equilibrium was assessed for deviations from Mendelian Inheritance. Fisher exact tests were used to assess differences in genotype distributions between 1) ho-mozygotes for the minor allele versus homozygotes for the major allele and 2) carriers of the minor allele versus homozygotes for the major allele. For correction we used the rough False Discovery Rate (rFDR). A power calculation was performed with http://csg.sph.umich.edu/abecasis/cats/ to determine the effect size in this study group. With the sample size available we had 72% power to detect and OR of 2. An overrepresentation enrichment analysis was performed on significant hits, using Webgestalt (Wang et al., 2013). Potential clinical predictors for outcome were analyzed using univariable logistic regression analysis and Odds ratios with 95% confidence intervals (95%CI) were calcu-lated to measure effect size. A p-value cut-off for significance of 0.05 was used.
Risk factors for TBM outcome6
results
baseline characteristics
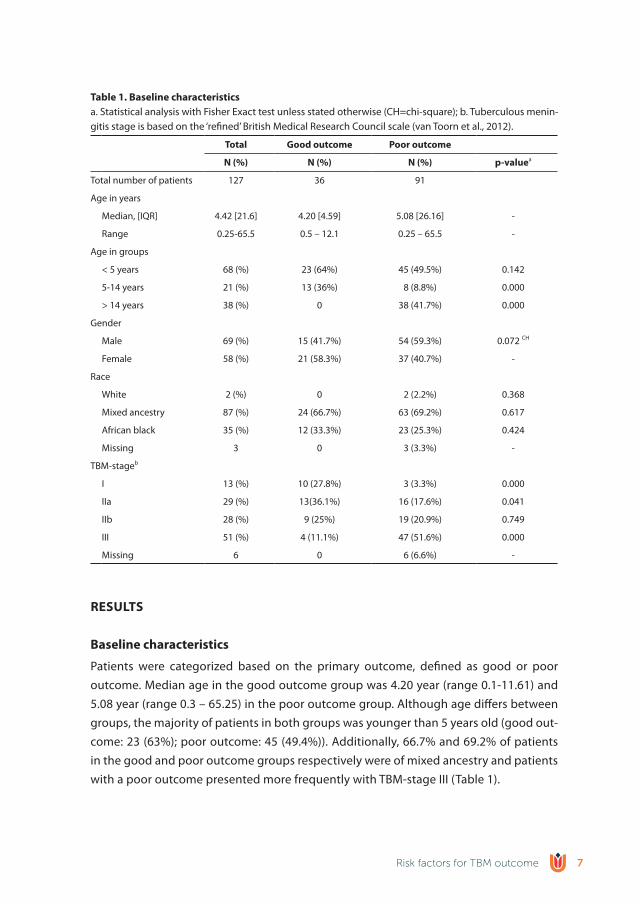
Patients were categorized based on the primary outcome, defined as good or poor outcome. Median age in the good outcome group was 4.20 year (range 0.1-11.61) and 5.08 year (range 0.3 – 65.25) in the poor outcome group. Although age differs between groups, the majority of patients in both groups was younger than 5 years old (good out-come: 23 (63%); poor outcome: 45 (49.4%)). Additionally, 66.7% and 69.2% of patients in the good and poor outcome groups respectively were of mixed ancestry and patients with a poor outcome presented more frequently with TBM-stage III (Table 1).
table 1. baseline characteristicsa. Statistical analysis with Fisher Exact test unless stated otherwise (CH=chi-square); b. Tuberculous menin-gitis stage is based on the ‘refined’ British Medical Research Council scale (van Toorn et al., 2012).
total Good outcome Poor outcome
n (%) n (%) n (%) p-valuea
Total number of patients 127 36 91
Age in years
Median, [IQR] 4.42 [21.6] 4.20 [4.59] 5.08 [26.16] -
Range 0.25-65.5 0.5 – 12.1 0.25 – 65.5 -
Age in groups
< 5 years 68 (%) 23 (64%) 45 (49.5%) 0.142
5-14 years 21 (%) 13 (36%) 8 (8.8%) 0.000
> 14 years 38 (%) 0 38 (41.7%) 0.000
Gender
Male 69 (%) 15 (41.7%) 54 (59.3%) 0.072 CH
Female 58 (%) 21 (58.3%) 37 (40.7%) -
Race
White 2 (%) 0 2 (2.2%) 0.368
Mixed ancestry 87 (%) 24 (66.7%) 63 (69.2%) 0.617
African black 35 (%) 12 (33.3%) 23 (25.3%) 0.424
Missing 3 0 3 (3.3%) -
TBM-stageb
I 13 (%) 10 (27.8%) 3 (3.3%) 0.000
IIa 29 (%) 13(36.1%) 16 (17.6%) 0.041
IIb 28 (%) 9 (25%) 19 (20.9%) 0.749
III 51 (%) 4 (11.1%) 47 (51.6%) 0.000
Missing 6 0 6 (6.6%) -
Risk factors for TBM outcome 7
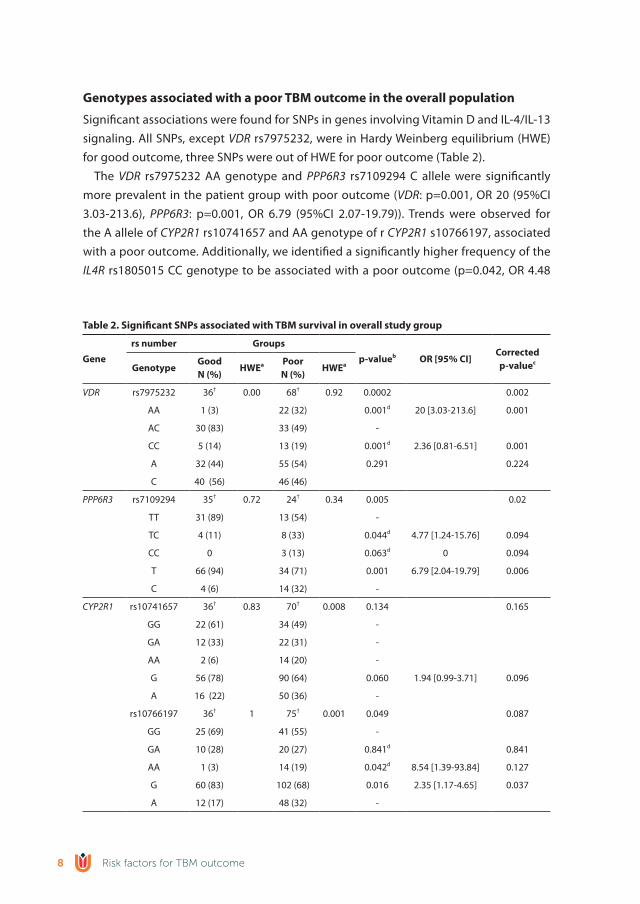
Genotypes associated with a poor tbM outcome in the overall population
Significant associations were found for SNPs in genes involving Vitamin D and IL-4/IL-13 signaling. All SNPs, except VDR rs7975232, were in Hardy Weinberg equilibrium (HWE) for good outcome, three SNPs were out of HWE for poor outcome (Table 2).
The VDR rs7975232 AA genotype and PPP6R3 rs7109294 C allele were significantly more prevalent in the patient group with poor outcome (VDR: p=0.001, OR 20 (95%CI 3.03-213.6), PPP6R3: p=0.001, OR 6.79 (95%CI 2.07-19.79)). Trends were observed for the A allele of CYP2R1 rs10741657 and AA genotype of r CYP2R1 s10766197, associated with a poor outcome. Additionally, we identified a significantly higher frequency of the IL4R rs1805015 CC genotype to be associated with a poor outcome (p=0.042, OR 4.48
table 2. significant snPs associated with tbM survival in overall study group
Gene
rs number Groups
p-valueb or [95% CI]Correctedp-valuec
GenotypeGoodn (%)
hwea Poorn (%)
hwea
VDR rs7975232 36† 0.00 68† 0.92 0.0002 0.002
AA 1 (3) 22 (32) 0.001d 20 [3.03-213.6] 0.001
AC 30 (83) 33 (49) -
CC 5 (14) 13 (19) 0.001d 2.36 [0.81-6.51] 0.001
A 32 (44) 55 (54) 0.291 0.224
C 40 (56) 46 (46)
PPP6R3 rs7109294 35† 0.72 24† 0.34 0.005 0.02
TT 31 (89) 13 (54) -
TC 4 (11) 8 (33) 0.044d 4.77 [1.24-15.76] 0.094
CC 0 3 (13) 0.063d 0 0.094
T 66 (94) 34 (71) 0.001 6.79 [2.04-19.79] 0.006
C 4 (6) 14 (32) -
CYP2R1 rs10741657 36† 0.83 70† 0.008 0.134 0.165
GG 22 (61) 34 (49) -
GA 12 (33) 22 (31) -
AA 2 (6) 14 (20) -
G 56 (78) 90 (64) 0.060 1.94 [0.99-3.71] 0.096
A 16 (22) 50 (36) -
rs10766197 36† 1 75† 0.001 0.049 0.087
GG 25 (69) 41 (55) -
GA 10 (28) 20 (27) 0.841d 0.841
AA 1 (3) 14 (19) 0.042d 8.54 [1.39-93.84] 0.127
G 60 (83) 102 (68) 0.016 2.35 [1.17-4.65] 0.037
A 12 (17) 48 (32) -
Risk factors for TBM outcome8
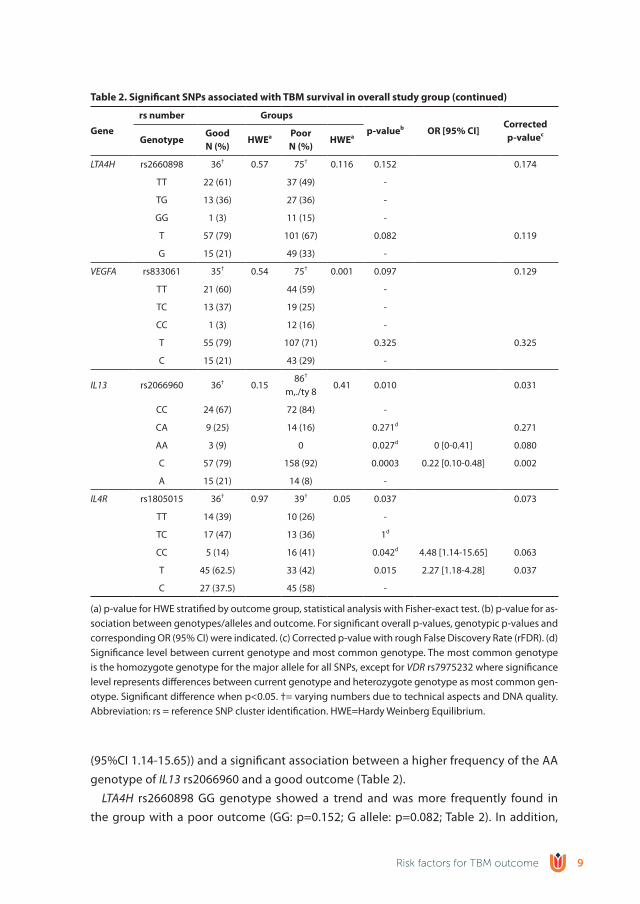
(95%CI 1.14-15.65)) and a significant association between a higher frequency of the AA genotype of IL13 rs2066960 and a good outcome (Table 2).
LTA4H rs2660898 GG genotype showed a trend and was more frequently found in the group with a poor outcome (GG: p=0.152; G allele: p=0.082; Table 2). In addition,
table 2. significant snPs associated with tbM survival in overall study group (continued)
Gene
rs number Groups
p-valueb or [95% CI]Correctedp-valuec
GenotypeGoodn (%)
hwea Poorn (%)
hwea
LTA4H rs2660898 36† 0.57 75† 0.116 0.152 0.174
TT 22 (61) 37 (49) -
TG 13 (36) 27 (36) -
GG 1 (3) 11 (15) -
T 57 (79) 101 (67) 0.082 0.119
G 15 (21) 49 (33) -
VEGFA rs833061 35† 0.54 75† 0.001 0.097 0.129
TT 21 (60) 44 (59) -
TC 13 (37) 19 (25) -
CC 1 (3) 12 (16) -
T 55 (79) 107 (71) 0.325 0.325
C 15 (21) 43 (29) -
IL13 rs2066960 36† 0.1586†
m,./ty 80.41 0.010 0.031
CC 24 (67) 72 (84) -
CA 9 (25) 14 (16) 0.271d 0.271
AA 3 (9) 0 0.027d 0 [0-0.41] 0.080
C 57 (79) 158 (92) 0.0003 0.22 [0.10-0.48] 0.002
A 15 (21) 14 (8) -
IL4R rs1805015 36† 0.97 39† 0.05 0.037 0.073
TT 14 (39) 10 (26) -
TC 17 (47) 13 (36) 1d
CC 5 (14) 16 (41) 0.042d 4.48 [1.14-15.65] 0.063
T 45 (62.5) 33 (42) 0.015 2.27 [1.18-4.28] 0.037
C 27 (37.5) 45 (58) -
(a) p-value for HWE stratified by outcome group, statistical analysis with Fisher-exact test. (b) p-value for as-sociation between genotypes/alleles and outcome. For significant overall p-values, genotypic p-values and corresponding OR (95% CI) were indicated. (c) Corrected p-value with rough False Discovery Rate (rFDR). (d) Significance level between current genotype and most common genotype. The most common genotype is the homozygote genotype for the major allele for all SNPs, except for VDR rs7975232 where significance level represents differences between current genotype and heterozygote genotype as most common gen-otype. Significant difference when p<0.05. †= varying numbers due to technical aspects and DNA quality. Abbreviation: rs = reference SNP cluster identification. HWE=Hardy Weinberg Equilibrium.
Risk factors for TBM outcome 9
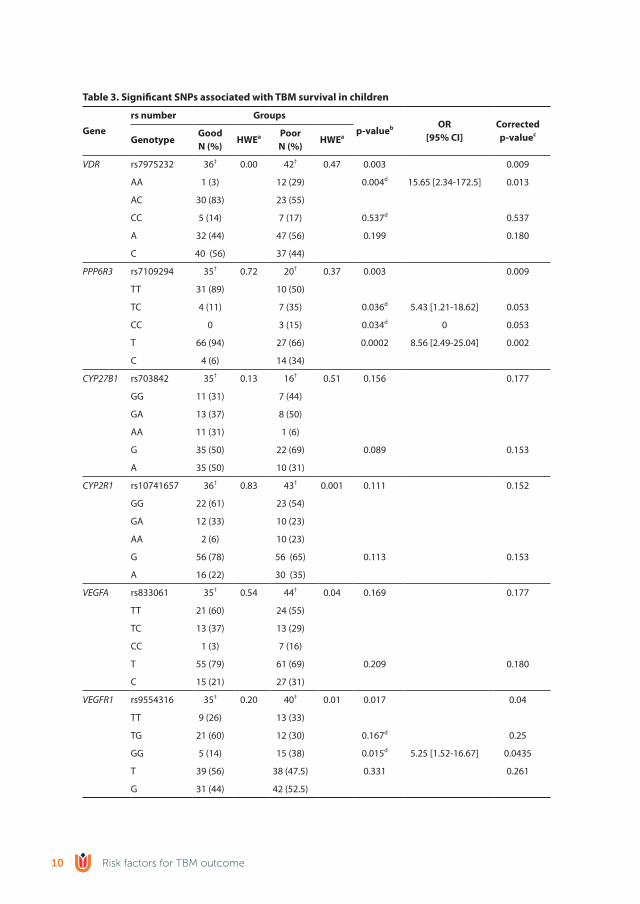
table 3. significant snPs associated with tbM survival in children
Gene
rs number Groups
p-valueb or[95% CI]
Correctedp-valuec
GenotypeGoodn (%)
hwea Poorn (%)
hwea
VDR rs7975232 36† 0.00 42† 0.47 0.003 0.009
AA 1 (3) 12 (29) 0.004d 15.65 [2.34-172.5] 0.013
AC 30 (83) 23 (55)
CC 5 (14) 7 (17) 0.537d 0.537
A 32 (44) 47 (56) 0.199 0.180
C 40 (56) 37 (44)
PPP6R3 rs7109294 35† 0.72 20† 0.37 0.003 0.009
TT 31 (89) 10 (50)
TC 4 (11) 7 (35) 0.036d 5.43 [1.21-18.62] 0.053
CC 0 3 (15) 0.034d 0 0.053
T 66 (94) 27 (66) 0.0002 8.56 [2.49-25.04] 0.002
C 4 (6) 14 (34)
CYP27B1 rs703842 35† 0.13 16† 0.51 0.156 0.177
GG 11 (31) 7 (44)
GA 13 (37) 8 (50)
AA 11 (31) 1 (6)
G 35 (50) 22 (69) 0.089 0.153
A 35 (50) 10 (31)
CYP2R1 rs10741657 36† 0.83 43† 0.001 0.111 0.152
GG 22 (61) 23 (54)
GA 12 (33) 10 (23)
AA 2 (6) 10 (23)
G 56 (78) 56 (65) 0.113 0.153
A 16 (22) 30 (35)
VEGFA rs833061 35† 0.54 44† 0.04 0.169 0.177
TT 21 (60) 24 (55)
TC 13 (37) 13 (29)
CC 1 (3) 7 (16)
T 55 (79) 61 (69) 0.209 0.180
C 15 (21) 27 (31)
VEGFR1 rs9554316 35† 0.20 40† 0.01 0.017 0.04
TT 9 (26) 13 (33)
TG 21 (60) 12 (30) 0.167d 0.25
GG 5 (14) 15 (38) 0.015d 5.25 [1.52-16.67] 0.0435
T 39 (56) 38 (47.5) 0.331 0.261
G 31 (44) 42 (52.5)
Risk factors for TBM outcome10

the VEGFA rs833061 CC genotype showed a higher prevalence in the poor outcome group, with a p-value representing a trend (p=0.097, Table 2). No significant differences for outcome were found in SNPs in TNFA, LTA4H and TNFR genes examined in the TNFα signaling pathway and SNPs in VEGFA, VEGFR1 and VEGFR2 genes of the VEGF signaling pathway (supplemental Table S1).
When p-values were corrected with the rough False-Discovery Rate (rFDR, Table 2 last column) the majority of the significant associations disappeared. However, significant differences were still found for VDR rs7975232, PPP6R3 rs7109294, IL13 rs2066960 and IL4R rs1805015, suggesting a strong correlation.
outcome in children associated with snPs affecting Vitamin d and VeGF related genes
When specifically examining genotype distribution in children, significant associations between poor outcome and the DR rs7975232 AA genotype and the PPP6R3 rs7109294*C genotype were found (VDR: p=0.004, OR 15.65 (95%CI 2.34-172.5); PPP6R3: CC-genotype p=0.03, OR 0), C-allele p=0.0002, OR 8.56 (95%CI 2.49-25.04); Table 3). In VEGF pathway related genes, a correlation was found between poor outcome and VEGFR1 rs9554316 GG
(a) p-value for HWE stratified by outcome group, statistical analysis with Fisher-exact test. (b) p-value for as-sociation between genotypes/alleles and outcome. For significant overall p-values, genotypic p-values and corresponding OR (95% CI) were indicated. (c) Corrected p-value with rough False Discovery Rate (rFDR). (d) Significance level between current genotype and most common genotype. The most common genotype is the homozygote genotype for the major allele for all SNPs, except for VDR rs7975232 where significance level represents differences between current genotype and heterozygote genotype as most common gen-otype. Significant difference when p<0.05. †= varying numbers due to technical aspects and DNA quality. Abbreviation: rs, reference SNP cluster identification. HWE=Hardy Weinberg Equilibrium.
table 4. overrepresentation enrichment analysis of genes identified in this study, data analyzed with (wang et al., 2013)
Gene setbiological process
description
number of genes in category
observed: expected
enrichment ratio
P value Genes
GO:0042368Formation of
vitamin D11 3 : 0.01 492.67 1.93 x 10^-08
CYP2R1; CYP27B1; VDR
GO:0030858Epithelial cell
differentiation54 3 : 0.03 100.36 2.87 x 10^-06
CYP27B1; VDR; IL13
GO:0060558Regulation of
CYP27B1 activity7 2 : 0 526.13 5.71 x 10^-06 CYP27B1; VDR
GO:0051094Regulation of
developmental processes
1152 6 : 0.64 9.41 8.71 x 10^-06CYP27B1; FLT1; IL4R; IL13; VDR;
VEGFA
GO:0042359 Vitamin D pathway 20 3 : 0.01 270.97 3.79 x 10^-04CYP2R1;
CYP27B1; VDR
Risk factors for TBM outcome 11

genotype (p=0.015, OR 5.25 (95%CI 1.52-16.67)). This was not seen in the overall group, suggesting a specific role in children. Additionally, trends for the CYP2R1 rs10741657 AA genotype, CYP27B1 rs703842 AA genotype and VEGF rs833061 CC were found, similar to the observation made in the overall cohort.
In conclusion, sub-analysis of children, in which confounding factors play a minor role compared to adults, revealed associations between SNPs in genes affecting Vitamin D and VEGF related genes (Table 3).
overrepresentation enrichment analysis
To identify which biological processes are related to genes with significant associations found in this study, an overrepresentation enrichment analysis was performed (Wang et al., 2013) (Table 4). This confirms that the majority of processes are related to the Vitamin D pathway, formation of Vitamin D and regulation of CY27B1 activity. In addi-
table 5. univariable logistic regression analyses of patients with tuberculous meningitis
tbM Good Pooror (95%CI) P-value
n (%) [IQr] n (%) [IQr] n (%) [IQr]
Clinical characteristics
Diagnosis TBM 50 35 (70) 15 (30)
Definite 26 (52) 23 (66) 3 (20) 0
Probable / Possible 24 (48) 12 (34) 12 (80) 0.13 (0.03 – 0.55) 0.006
DST (n=27) †
DS 17 (63) 15 (65) 2 (50)
IMR 3 (11) 2 (9) 1 (25) 0.267 (0.02-4.46) 0.358
Unknown 7 (26) 6 (26) 1 (25)
history and clinical signs
Age in months (Mean ± SD) 52.4 ± 40.9 56.6 ± 41.7 42.8 ± 38.5 0.281
Sex, male 25 (50) 16 (46) 9 (60) 0.56 (0.16 – 1.92) 0.357
HIV-infected 4 (8) 3 (9) 1 (7) 1.31 (0.125 – 13.74) 0.820
BMI, <-2SD (n=40) 15 (38) 10 (35) 5 (46) 0.63 (0.15 – 2.59) 0.524
Race
African black 13 (26) 12 (34) 1 (7) 0
Mixed ancestry 37 (74) 23 (66) 14 (93) 7.30 (0.86 – 62.42) 0.069
Presenting symptoms:
Fever 41 (82) 28 (80) 13 (87) 0.62 (0.11 – 3.38) 0.615
Headache 21 (42) 16 (46) 5 (33) 1.68 (0.48 – 5.95) 0.418
Convulsions 12 (24) 5 (14) 7 (47) 0.19 (0.05 – 0.76) 0.019
Vomiting 34 (68) 26 (74) 8 (53) 2.53 (0.71 – 8.97) 0.151
Focal neurological deficit 22 (44) 11 (31) 11 (73) 0.17 (0.04 – 0.64) 0.009
Irritability 21 (42) 17 (49) 4 (27) 2.60 (0.69 – 9.75) 0.157
Risk factors for TBM outcome12

table 5. univariable logistic regression analyses of patients with tuberculous meningitis (continued)
tbM Good Pooror (95%CI) P-value
n (%) [IQr] n (%) [IQr] n (%) [IQr]
Lethargy 18 (36) 12 (34) 6 (40) 0.78 (0.23 – 2.72) 0.700
Neck stiffness 29 (58) 18 (51) 11 (73) 0.39 (0.10 – 1.45) 0.157
Altered consciousness 35 (70) 24 (69) 11 (73) 0.79 (0.21 – 3.06) 0.737
Symptom duration > 5 days 26 (52.0) 19 (54) 7 (47) 1.36 (0.40 – 4.57) 0.622
Symptoms suggestive of TB†† 13 (26) 8 (23) 5 (33) 0.59 (0.16 – 2.25) 0.441
TB contact in history# (n=49) 24 (49) 14 (41) 10 (67) 0.35 (0.10 – 1.25) 0.106
TBM-stagea
I 11 (22) 10 (29) 1 (7) 0
IIa 15 (31) 13 (37) 2 (14) 1.54 (0.12 – 19.47) 0.739
IIb 15 (31) 9 (26) 6 (43) 6.67 (0.67 – 66.53) 0.106
III 8 (16) 3 (9) 5 (36) 16.67 (1.36 – 204.03) 0.028
TST positive (n=29) 19 (66) 15 (63) 4 (80) 0.42 (0.04 – 4.33) 0.464
Evidence of BCG 49 (98) 34 (97) 15 (100) 0.00 (0.00 - ) 1.000
CsF
Clear appearance 44 (88) 33 (94) 11 (73) 6.00 (0.96 – 37.38) 0.055
Total cell-count - cells/μL(median; IQR), n=49
116[35 - 217]
137[71 – 301]
26 [6 – 133] 0.002
Lymphocytes - cells/μL(median; IQR), n=49
100[35 – 184]
127[64 – 241]
26 [5 – 105] 0.002
Protein concentration - g/L(mean; SD), n=32
1.52 ± 0.79 1.51 ± 0.78 1.52 ± 0.87 0.966
Glucose concentration - mmol/L(mean; SD), n=44
2.11 ± 1.25 1.92 ± 1.07 2.56 ± 1.54 0.118
Cerebral imaging (n=49)
Hydrocephalus 37 (76) 23 (68) 14 (93) 0.15 (0.02 – 1.29) 0.083
Basal meningeal enhancement 34 (69) 21 (62) 13 (87) 0.25 (0.05 – 1.28) 0.096
Tuberculoma 13 (27) 10 (29) 3 (20) 1.67 (0.39 – 7.21) 0.494
Infarct 14 (29) 4 (12) 10 (67) 0.07 (0.02 – 0.30) <0.001
Pre-contrast basal hyperdensity (n=46) 16 (35) 9 (28) 7 (50) 0.39 (0.11 – 1.44) 0.157
other
Evidence of tuberculosis elsewhereb 28 (56) 20 (57) 8 (53) 1.17 (0.35 – 3.93) 0.804
Neurosurgical intervention (n=52) 17 (37) 9 (28) 8 (57) 0.29 (0.08 – 1.09) 0.066
ICU admission (n=31) 6 (23) 3 (16) 3 (43) 0.25 (0.04 – 1.74) 0.161
†In 7 culture positive patients DST was unknown. One patient had negative CSF but positive gastric wash-ing. ††Symptoms suggestive of tuberculosis consisted one or more of the following: weight loss or poor weight gain, night sweats, or persistent cough for more than 2 weeks. #History of recent close contact with an individual with pulmonary tuberculosis or a positive TST or Interferon-Gamma Release Assay (IGRA). aTuberculous meningitis stage is based on the ‘refined’ British Medical Research Council scale (van Toorn et al., 2012). bPatient had evidence of TB elsewhere in case culture (sputum and/or gastric washing and/or blood) and/or CXR was positive for TB. Abbreviations: IQR=interquartile range; TBM=tuberculous menin-gitis; DST=Drug susceptibility test; IMR=Isoniazid monoresistance; DS=Drug susceptible; BMI=Body Mass Index; TB=tuberculosis TST=Tuberculin Skin Test; BCG=Bacillus Calmette-Guérin; CSF=cerebral spinal fluid; ICU=Intensive Care Unit
Risk factors for TBM outcome 13
tion, genes were found to be involved in epithelial cell differentiation and regulation of developmental processes.
Clinical risk factors for poor outcome
The total study cohort consisted of 135 patients, with neuropathology samples from 76 patients who had died of TBM and 7 diagnostic biopsies. Of the latter, 6 patients were lost to follow-up and one patient had a good outcome with mild sequelae without any further information available. Of the remaining 52 patients, two patients were lost to follow-up after completing treatment, resulting in complete 6 month follow-up data of 50 patients. Of these, 1 patient (2%) died during the treatment course, and after com-pleting treatment 14 patients (28%) had severe sequelae, 26 (52%) had mild sequelae and 9 patients (18%) were considered as completely normal. Drug susceptibility test (DST) results were available in 20 cases with 3 isoniazid mono resistance (IMR) cases. The others were drug susceptible (DS) or unknown. Definite TBM, i.e. culture confirmed, was associated with good outcome. Patients who presented with convulsions, TBM stage III, focal neurological deficits, low CSF cell-count (including low lymphocytes) and patients with cerebral infarcts were significantly (p≤0.05) more at risk for poor outcome (Table 5).
dIsCussIon
In the cohort study with South African TBM patients presented here we show that a subset of specifically selected polymorphisms in genes related to Vitamin D, VEGF and IL-4/IL-13 signaling were more prevalent among patients with a poor outcome.
VDR rs7975232, also known as ApaI, is commonly studied for its potential role in a wide variety of diseases, including pulmonary TB. The functional effect of polymor-phisms in this gene is not known and so far results of association studies have been inconsistent due to small sample sizes (Gao et al., 2010; Lee and Song, 2015; Möller et al., 2010; Panwar et al., 2016). Interestingly, two case-control studies showed a higher prevalence of heterozygotes and homozygotes for the minor allele of VDR ApaI in pa-tients with extra-pulmonary TB (spinal and TBM) compared to pulmonary TB (Panwar et al., 2016; Rizvi et al., 2016). Interestingly, this is in contrast with the current study, which found that homozygotes for the major allele (AA) of VDR rs7975232 might determine outcome. Nevertheless, it might suggest that specific variations are associated with dif-ferent manifestations of extra-pulmonary disease, as we show here for TBM, or that VDR rs7975232 AA genotype specifically affects outcome.
Of additional interest are SNPs affecting VEGF signaling, which potentially affect the angiogenic balance. Several studies have focused on the role of the VEGF pathway and vascular dysfunction in TB pathogenesis (Donald et al., 2016; van der Flier et al., 2004),
Risk factors for TBM outcome14
but this study is the first to show an association between genetic variance in VEGF related genes and TBM outcome. VEGFR1 and VEGFR2 are two of three endothelial transmem-brane receptors and are bound by VEGFA. VEGFR2 is known to drive angiogenesis after binding by VEGFA, VEGFR1 most likely restricts the angiogenic signal (Kumar et al., 2016). It seems likely that VEGFR1 and VEGFR2 are both necessary for a balanced angiogenic response and one might speculate that alterations of these signals, by polymorphisms in encoding genes, result in angiogenesis that is either too restricted or uncontrolled. Subsequently, this might affect TBM vasculopathy and outcome.
A crucial role for the balance between Th1-type cytokines and Th2-type cytokines, including IL-4 and IL-13, has been suggested based on studies within mice and patients with pulmonary TB and TBM (Heitmann et al., 2014; Hölscher et al., 2016; Sharma et al., 2017). Little is known about the exact role of IL-4 and IL-13 in TB susceptibility, but increased expression of IL4 and IL13 and a variant of the gene encoding IL4Rα have been linked to reactivation of disease and increased pulmonary cavity formation (Heitmann et al., 2014; Hölscher et al., 2016; Van Crevel et al., 2000). In TBM patients, elevated levels of pro-inflammatory cytokines, including IL-4, were found in the CSF and were associated with hydrocephalus and infarction (Sharma et al., 2017). Additionally, IL-13 was found to be elevated in the CSF of TBM patients compared to non-mycobacterial meningitis (Visser et al., 2014). Here, we identified SNPs in IL13 and IL4R to be associated with a poor TBM outcome and table 5 shows its potential role in regulation of developmental pro-cesses. However, additional functional studies are necessary to determine the potential effect of these polymorphisms in TBM (Sharma et al., 2017).
In addition to genetic risk factors, patients presenting with convulsions, focal neu-rological deficit, infarctions, high TBM stage at presentation and low CSF cell counts were at higher risk for poor outcome. In line with previous reports, our study confirmed the association between poor outcome and severe TBM stage at presentation, cerebral infarction, convulsions and low CSF lymphocyte counts (Kalita and Misra, 1999; Thao et al., 2017; van Well et al., 2009). Interestingly, culture confirmed TBM was associated with a good outcome, an association not demonstrated before (Nicolette et al., 2014; van Well et al., 2009). Further evaluation of the CSF showed an association between low cell counts, with a predominance of lymphocytes, and poor outcome. This suggests that either a depletion of lymphocytes due to increased use or an inadequate lymphocyte response predicts mortality. A high monocyte to lymphocyte ratio, with increased neutrophils, has also been suggested to link to a higher mortality (Van Laarhoven et al., 2017). These observations support the importance of a balanced inflammatory response in the CNS predicting outcome.
The major limitation of this retrospective study is the small fixed sample size. Our study has a power of 72 to detect differences, thereby possibly not revealing associations that may have been apparent in a larger population. However, we are confident that this
Risk factors for TBM outcome 15

historical collection with radiographic imaging, neuropathology material and follow-up data of the majority of patients reveals valuable information indicating specific SNPs involved in TBM outcome. Since genetic associations with a certain a priori probability were tested, it is debatable if corrections of obtained p-values are necessary. Bonfer-roni correction for multiple testing was not applied, because this method is thought to be too conservative resulting in the rejection of potentially interesting associations (Nyholt, 2004; Perneger, 1998). Another limitation is the large difference between both groups for the baseline characteristics age and TBM stage, which is a consequence of the independently collected neuropathology material and blood samples. The high prevalence of TBM stage III among patients of whom neuropathology samples were obtained might be understandable in a group of patients mostly included after death, but it introduces selection bias. In addition, not all SNPs were in HWE (Table 2, 3), which might affect the results. However, the majority of SNPs out of HWE were found in the poor outcome group, which is a clear result of the large amount of individuals in this group who died. Lastly, a large proportion of patients are of mixed ancestries and no population stratification was performed. It has been suggested that ethnicity affects susceptibility to TB, which means that our results might be an under or overrepresenta-tion of the actual genotype distribution (Daya et al., 2014).
A large proportion of the examined SNPs in this study showed a trend or no significant association, even though some of these genes were suggested to be of importance based on previous reports. Genes involved in TNFα signaling, like LTA4H, were shown to affect survival in TBM patients in a Vietnamese cohort (Thuong et al., 2017; Tobin et al., 2010). In the current cohort, no significant difference could be identified, but a trend for LTA4H rs2660898 was found. The explanation for our inability to show a link might be the small sample size. However, in line with the lack of an association in an Indonesian cohort (Van Laarhoven et al., 2017) it could also mean that this polymorphism is popula-tion specific and is of little importance in our South-African cohort .
In conclusion, this study adds to our current understanding of genetic and clinical risk factors for TBM severity and outcome. Polymorphisms in genes affecting Vitamin D, VEGF and IL-4/IL-13 signaling were identified in this unique cohort, and can direct future research in a large population. Combining genetic and clinical risk factors into a predic-tion model introduces the possibility of personalized prognosis prediction of morbidity and mortality. Future studies might extend this into the development of host-directed therapy and improve the outcome of individual TBM patients.
Risk factors for TBM outcome16

ACKnowledGeMents
The authors would like to thank Willy Pieterse, Daniel Franken and Nick Bowker for technical assistance and Sabine van Elsland as project manager of the tuberculous men-ingitis study group. We thank Astrid van der Sar for valuable input on conceptualization and experimental design. This study was supported by a travel grant of the Catharine van Tussenbroek foundation, awarded to LMvL, and partially funded by a South African National Research Foundation fellowship awarded to MM (Grant No: 91481).
Risk factors for TBM outcome 17
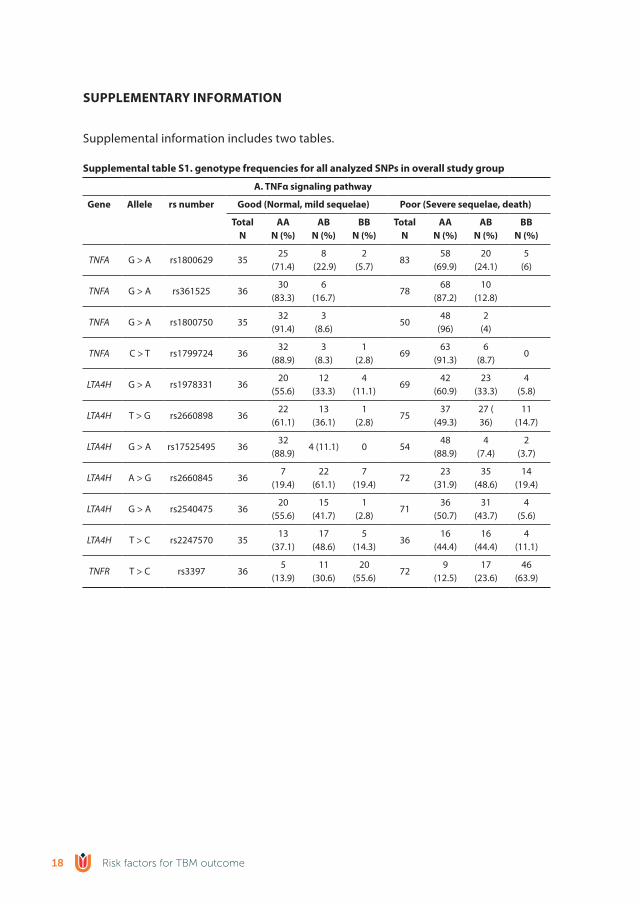
suPPleMentAry InForMAtIon
Supplemental information includes two tables.
supplemental table s1. genotype frequencies for all analyzed snPs in overall study group
A. tnFα signaling pathway
Gene Allele rs number Good (normal, mild sequelae) Poor (severe sequelae, death)
totaln
AAn (%)
Abn (%)
bbn (%)
totaln
AAn (%)
Abn (%)
bbn (%)
TNFA G > A rs1800629 3525
(71.4)8
(22.9)2
(5.7)83
58 (69.9)
20 (24.1)
5(6)
TNFA G > A rs361525 3630
(83.3)6
(16.7)78
68 (87.2)
10 (12.8)
TNFA G > A rs1800750 3532
(91.4)3
(8.6)50
48(96)
2(4)
TNFA C > T rs1799724 3632
(88.9)3
(8.3)1
(2.8)69
63 (91.3)
6(8.7)
0
LTA4H G > A rs1978331 3620
(55.6)12
(33.3)4
(11.1)69
42 (60.9)
23 (33.3)
4(5.8)
LTA4H T > G rs2660898 3622
(61.1)13
(36.1)1
(2.8)75
37 (49.3)
27 (36)
11 (14.7)
LTA4H G > A rs17525495 3632
(88.9)4 (11.1) 0 54
48 (88.9)
4(7.4)
2(3.7)
LTA4H A > G rs2660845 367
(19.4)22
(61.1)7
(19.4)72
23 (31.9)
35 (48.6)
14 (19.4)
LTA4H G > A rs2540475 3620
(55.6)15
(41.7)1
(2.8)71
36 (50.7)
31 (43.7)
4(5.6)
LTA4H T > C rs2247570 3513
(37.1)17
(48.6)5
(14.3)36
16 (44.4)
16 (44.4)
4(11.1)
TNFR T > C rs3397 365
(13.9)11
(30.6)20
(55.6)72
9(12.5)
17 (23.6)
46 (63.9)
Risk factors for TBM outcome18

supplemental table s1. genotype frequencies for all analyzed snPs in overall study group
b. VeGF signaling pathway
Gene Allele rs number Good (normal, mild sequelae) Poor (severe sequelae, death)
totaln
AAn (%)
Abn (%)
bbn (%)
totaln
AAn (%)
Abn (%)
bbn (%)
VEGF A > G rs699946 3624
(66.7)10
(27.8)2
(5.6)35
22 (62.9)
12 (24.3)
1 (2.9)
VEGF C > A rs699947 35 28 (80)7
(20)0 68
49 (72.1)
17 (25)2
(2.9)
VEGF T > C rs833061 35 21 (60)13
(37.1)1
(2.9)75
44 (58.7)
19 (25.3)
12(16)
VEGF G > C rs2010963 3619
(52.8)17
(47.2)0 79
40 (50.6)
33 (41.8)
6(7.6)
VEGF C > T rs25648 2926
(89.7)2
(6.9)1
(3.4)54
47(87)
7(13)
0
VEGF C > T rs3025039 3632
(88.9)3
(8.3)1
(2.8)80
74 (92.5)
4(5)
2(2.5)
VEGFR1 T > G rs9554316 359
(25.7)21
(60)5
(14.3)65
25 (38.5)
21 (32.3)
19 (29.2)
VEGFR1 G > A rs7993418 3510
(28.6)19
(54.3)6
(17.1)67
22 (32.8)
27 (40.3)
18 (26.9)
VEGFR1 C > A rs9582036 3617
(47.2)16
(44.4)3
(8.3)64
38 (59.4)
18 (27.7)
8(12.5)
VEGFR1 A > C rs9554320 3619
(52.8)14
(38.9)3
(8.3)81
57 (70.4)
22 (27.2)
2(2.5)
VEGFR2 T > C rs12505758 3529
(82.9)6
(17.1)49
45 (91.8)
4(8.2)
VEGFR2 A > C rs7655964 3530
(85.7)5
(14.3)48
38 (79.2)
10 (20.8)
VEGFR2 C > T rs2305948 3526
(74.3)9
(25.7)71
58 (81.7)
12 (16.9)
1(1.4)
VEGFR2 C > T rs2305949 3631
(86.1)5
(13.9)76
69 (90.8)
7(9.2)
VEGFR2 C > T rs11133360 369
(25)18
(50)9
(25)82
31 (37.8)
30 (36.6)
21 (25.6)
VEGFR2 G > A rs2071559 3511
(31.4)17
(48.6)7
(20)76
24 (31.6)
39 (51.3)
13 (17.1)
Risk factors for TBM outcome 19

supplemental table s1. genotype frequencies for all analyzed snPs in overall study group
C. Vitamin d signaling pathway
Gene Allele rs number Good (normal, mild sequelae) Poor (severe sequelae, death)
totaln
AAn (%)
Abn (%)
bbn (%)
totaln
AAn (%)
Abn (%)
bbn (%)
VDR A > C rs7975232 361
(2.8)30
(83.3)5
(13.9)68
22 (32.4)
33 (48.5)
13 (19.1)
VDR A > G rs731236 3622
(61.1)14
(38.9)0 65
43 (66.2)
18 (27.7)
4(6.2)
VDR C > G rs7139166 3627
(75)9
(25)0 85
66 (77.6)
18 (21.2)
1(1.2)
VDR T > C rs4516035 3627
(75)9
(25)0 83
64 (77.1)
17 (20.5)
2(2.4)
PPP6R3 T > C rs7109294 3531
(88.6)4
(11.4)0 24
13 (54.2)
8(33.3)
3 (12.5)
SCUBE C > A rs732594 3510
(28.6)19
(54.3)6
(17.1)41
21 (51.2)
17 (41.5)
3(7.3)
PHF11 C > T rs2980 3513
(37.1)13
(37.1)9
(25.7)23 8 (34.8)
13 (56.5)
2(8.7)
PHF11 G > A rs2981 3614
(38.9)15
(41.7)7
(19.4)55
19 (34.5)
28 (50.9)
8(14.5)
CYP27B1 G > T rs10877012 3624
(66.7)9
(25)3
(8.3)78
55 (70.5)
17 (21.8)
6(7.7)
CYP27B1 A > G rs4646536 3512
(34.3)14
(40)9 (25.7) 69
24 (34.8)
31 (44.9)
14 (20.3)
CYP27B1 G > A rs703842 3511
(31.4)13
(37.1)11
(31.4)16 7 (43.8)
8(50)
1(6.3)
CYP2R1 G > A rs10741657 3622
(61.1)12
(33.3)2
(5.6)70
34 (48.6)
22 (31.4)
14 (20)
CYP2R1 G > A rs12794714 3627
(75)9
(25)66
55 (83.3)
11 (16.7)
CYP2R1 G > A rs10766197 3625
(69.4)10
(27.8)1
(2.8)75
41 (54.7)
20 (26.7)
14 (18.7)
GC A > C rs7041 3626
(72.2)9
(25)1
(2.8)78
56 (71.8)
21 (26.9)
1(1.3)
GC T > C rs1155563 3532
(91.4)3
(8.6)0 17
14 (82.4)
2 (11.8)1
(5.9)
Risk factors for TBM outcome20
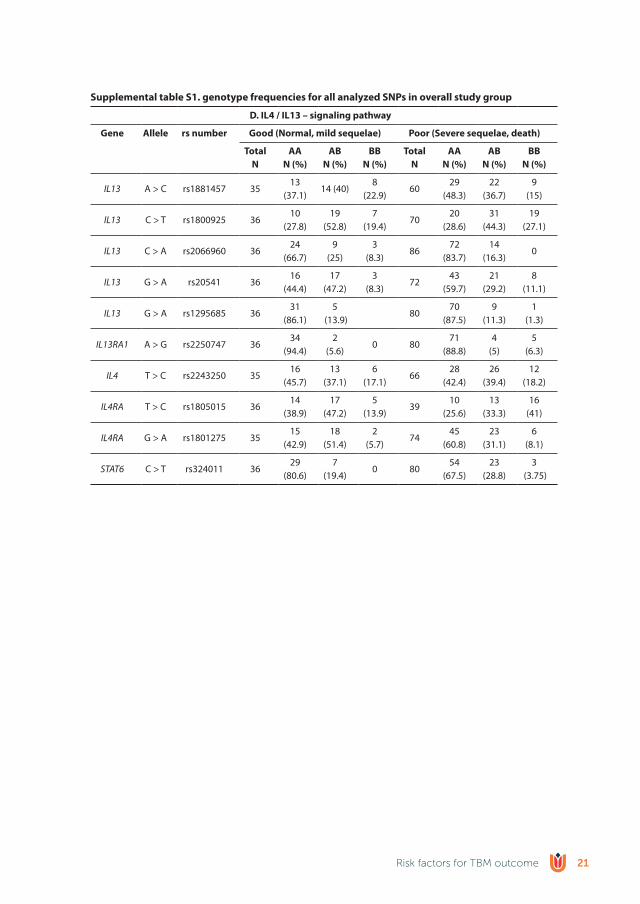
supplemental table s1. genotype frequencies for all analyzed snPs in overall study group
d. Il4 / Il13 – signaling pathway
Gene Allele rs number Good (normal, mild sequelae) Poor (severe sequelae, death)
totaln
AAn (%)
Abn (%)
bbn (%)
totaln
AAn (%)
Abn (%)
bbn (%)
IL13 A > C rs1881457 3513
(37.1)14 (40)
8(22.9)
6029
(48.3)22
(36.7)9
(15)
IL13 C > T rs1800925 3610
(27.8)19
(52.8)7
(19.4)70
20 (28.6)
31 (44.3)
19 (27.1)
IL13 C > A rs2066960 3624
(66.7)9
(25)3
(8.3)86
72 (83.7)
14 (16.3)
0
IL13 G > A rs20541 3616
(44.4)17
(47.2)3
(8.3)72
43 (59.7)
21 (29.2)
8(11.1)
IL13 G > A rs1295685 3631
(86.1)5
(13.9)80
70 (87.5)
9(11.3)
1(1.3)
IL13RA1 A > G rs2250747 3634
(94.4)2
(5.6)0 80
71 (88.8)
4(5)
5(6.3)
IL4 T > C rs2243250 3516
(45.7)13
(37.1)6
(17.1)66
28 (42.4)
26 (39.4)
12 (18.2)
IL4RA T > C rs1805015 3614
(38.9)17
(47.2)5
(13.9)39
10 (25.6)
13 (33.3)
16(41)
IL4RA G > A rs1801275 3515
(42.9)18
(51.4)2
(5.7)74
45 (60.8)
23 (31.1)
6(8.1)
STAT6 C > T rs324011 3629
(80.6)7
(19.4)0 80
54 (67.5)
23 (28.8)
3 (3.75)
Risk factors for TBM outcome 21
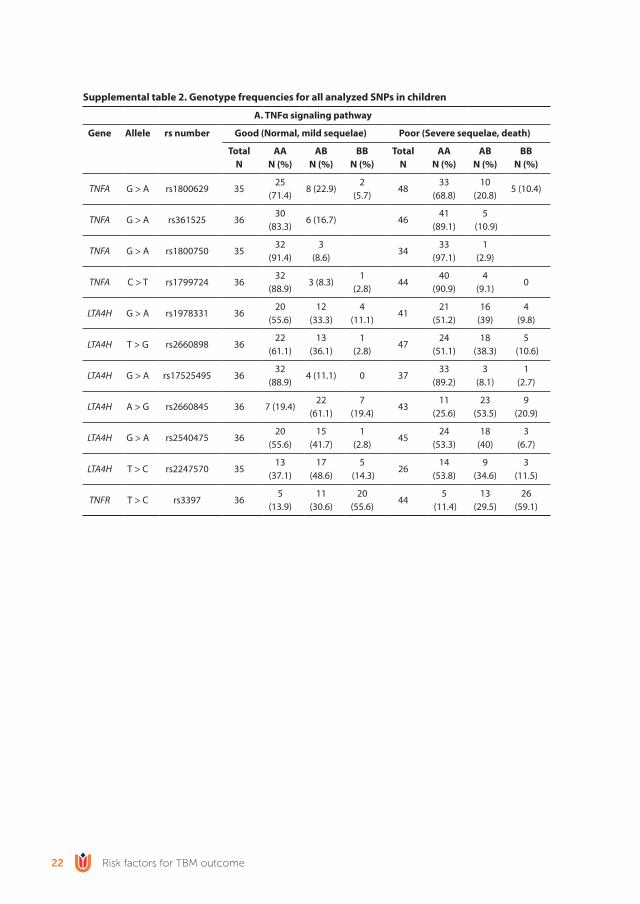
supplemental table 2. Genotype frequencies for all analyzed snPs in children
A. tnFα signaling pathway
Gene Allele rs number Good (normal, mild sequelae) Poor (severe sequelae, death)
totaln
AAn (%)
Abn (%)
bbn (%)
totaln
AAn (%)
Abn (%)
bbn (%)
TNFA G > A rs1800629 3525
(71.4)8 (22.9)
2(5.7)
4833
(68.8)10
(20.8)5 (10.4)
TNFA G > A rs361525 3630
(83.3)6 (16.7) 46
41 (89.1)
5 (10.9)
TNFA G > A rs1800750 3532
(91.4)3
(8.6)34
33 (97.1)
1(2.9)
TNFA C > T rs1799724 3632
(88.9)3 (8.3)
1(2.8)
4440
(90.9)4
(9.1)0
LTA4H G > A rs1978331 3620
(55.6)12
(33.3)4
(11.1)41
21 (51.2)
16(39)
4(9.8)
LTA4H T > G rs2660898 3622
(61.1)13
(36.1)1
(2.8)47
24 (51.1)
18 (38.3)
5 (10.6)
LTA4H G > A rs17525495 3632
(88.9)4 (11.1) 0 37
33 (89.2)
3(8.1)
1(2.7)
LTA4H A > G rs2660845 36 7 (19.4)22
(61.1)7
(19.4)43
11 (25.6)
23 (53.5)
9(20.9)
LTA4H G > A rs2540475 3620
(55.6)15
(41.7)1
(2.8)45
24 (53.3)
18(40)
3(6.7)
LTA4H T > C rs2247570 3513
(37.1)17
(48.6)5
(14.3)26
14 (53.8)
9(34.6)
3(11.5)
TNFR T > C rs3397 365
(13.9)11
(30.6)20
(55.6)44
5 (11.4)
13 (29.5)
26 (59.1)
Risk factors for TBM outcome22

supplemental table 2. Genotype frequencies for all analyzed snPs in children
b. VeGF signaling pathway
Gene Allele rs number Good (normal, mild sequelae) Poor (severe sequelae, death)
totaln
AAn (%)
Abn (%)
bbn (%)
totaln
AAn (%)
Abn (%)
bbn (%)
VEGFA A > G rs699946 3624
(66.7)10
(27.8)2
(5.6)25
15(60)
10 (40)
0
VEGFA C > A rs699947 3528
(80)7
(20)0 42
27 (64.3)
13 (31)2
(4.8)
VEGFA T > C rs833061 3521
(60)13
(37.1)1
(2.9)44
24 (54.5)
13 (29.2)
7(15.9)
VEGFA G > C rs2010963 3619
(52.8)17
(47.2)0 46
27 (58.7)
16 (34.8)
3(6.5)
VEGFA C > T rs25648 2926
(89.7)2
(6.9)1
(3.4)30
24 (80)
6(20)
0
VEGFA C > T rs3025039 3632
(88.9)3
(8.3)1
(2.8)48
45 (93.8)
1(2.1)
2(4.2)
VEGFR1 T > G rs9554316 359
(25.7)21
(60)5
(14.3)40
13 (32.5)
12 (30)15
(37.5)
VEGFR1 G > A rs7993418 3510
(28.6)19
(54.3)6
(17.1)42
13(31)
17 (40.5)
12 (28.6)
VEGFR1 C > A rs9582036 3617
(47.2)16
(44.4)3
(8.3)41
22 (53.7)
13 (31.7)
6(14.6)
VEGFR1 A > C rs9554320 3619
(52.8)14
(38.9)3
(8.3)49
29 (59.2)
18 (36.7)
2(4.1)
VEGFR2 T > C rs12505758 3529
(82.9)6
(17.1)35
31 (88.6)
4(11.4)
VEGFR2 A > C rs7655964 3530
(85.7)5
(14.3)36
27(75)
9(25)
VEGFR2 C > T rs2305948 3526
(74.3)9
(25.7)45
35 (77.8)
10 (22.2)
VEGFR2 C > T rs2305949 3631
(86.1)5
(13.9)47
42 (89.4)
5 (10.6)
VEGFR2 C > T rs11133360 369
(25)18
(50)9
(25)48
15 (31.3)
19 (39.6)
14 (29.2)
VEGFR2 G > A rs2071559 3511
(31.4)17
(48.6)7
(20)45
15 (33.3)
19 (42.2)
11 (24.4)
Risk factors for TBM outcome 23
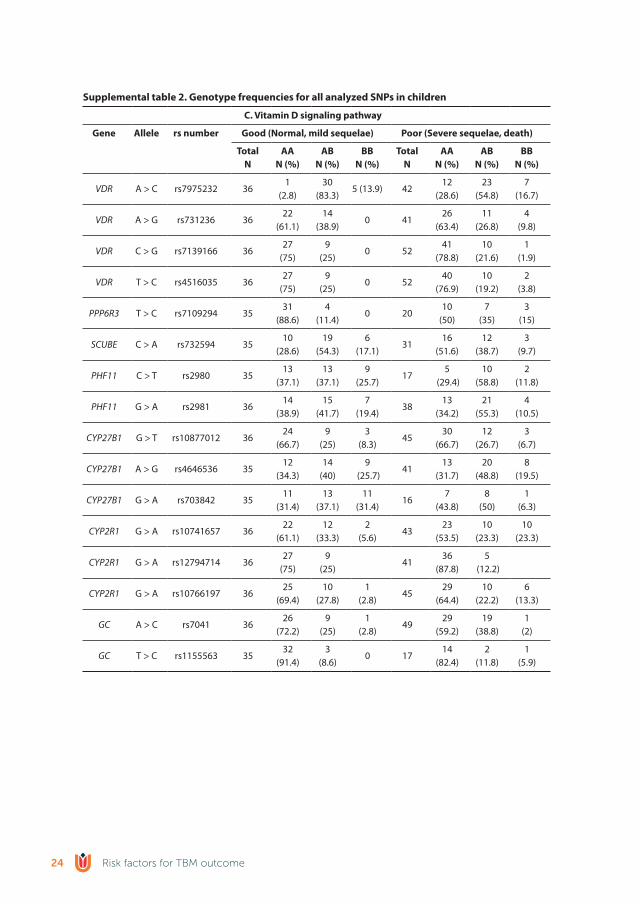
supplemental table 2. Genotype frequencies for all analyzed snPs in children
C. Vitamin d signaling pathway
Gene Allele rs number Good (normal, mild sequelae) Poor (severe sequelae, death)
totaln
AAn (%)
Abn (%)
bbn (%)
totaln
AAn (%)
Abn (%)
bbn (%)
VDR A > C rs7975232 361
(2.8)30
(83.3)5 (13.9) 42
12 (28.6)
23 (54.8)
7(16.7)
VDR A > G rs731236 3622
(61.1)14
(38.9)0 41
26 (63.4)
11 (26.8)
4(9.8)
VDR C > G rs7139166 3627
(75)9
(25)0 52
41 (78.8)
10 (21.6)
1(1.9)
VDR T > C rs4516035 3627
(75)9
(25)0 52
40 (76.9)
10 (19.2)
2(3.8)
PPP6R3 T > C rs7109294 3531
(88.6)4
(11.4)0 20
10(50)
7(35)
3(15)
SCUBE C > A rs732594 3510
(28.6)19
(54.3)6
(17.1)31
16 (51.6)
12 (38.7)
3(9.7)
PHF11 C > T rs2980 3513
(37.1)13
(37.1)9
(25.7)17
5 (29.4)
10 (58.8)
2(11.8)
PHF11 G > A rs2981 3614
(38.9)15
(41.7)7
(19.4)38
13 (34.2)
21 (55.3)
4(10.5)
CYP27B1 G > T rs10877012 3624
(66.7)9
(25)3
(8.3)45
30 (66.7)
12 (26.7)
3(6.7)
CYP27B1 A > G rs4646536 3512
(34.3)14
(40)9
(25.7)41
13 (31.7)
20 (48.8)
8(19.5)
CYP27B1 G > A rs703842 3511
(31.4)13
(37.1)11
(31.4)16
7(43.8)
8(50)
1(6.3)
CYP2R1 G > A rs10741657 3622
(61.1)12
(33.3)2
(5.6)43
23 (53.5)
10 (23.3)
10 (23.3)
CYP2R1 G > A rs12794714 3627
(75)9
(25)41
36 (87.8)
5 (12.2)
CYP2R1 G > A rs10766197 3625
(69.4)10
(27.8)1
(2.8)45
29 (64.4)
10 (22.2)
6(13.3)
GC A > C rs7041 3626
(72.2)9
(25)1
(2.8)49
29 (59.2)
19 (38.8)
1(2)
GC T > C rs1155563 3532
(91.4)3
(8.6)0 17
14 (82.4)
2(11.8)
1(5.9)
Risk factors for TBM outcome24
supplemental table 2. Genotype frequencies for all analyzed snPs in children
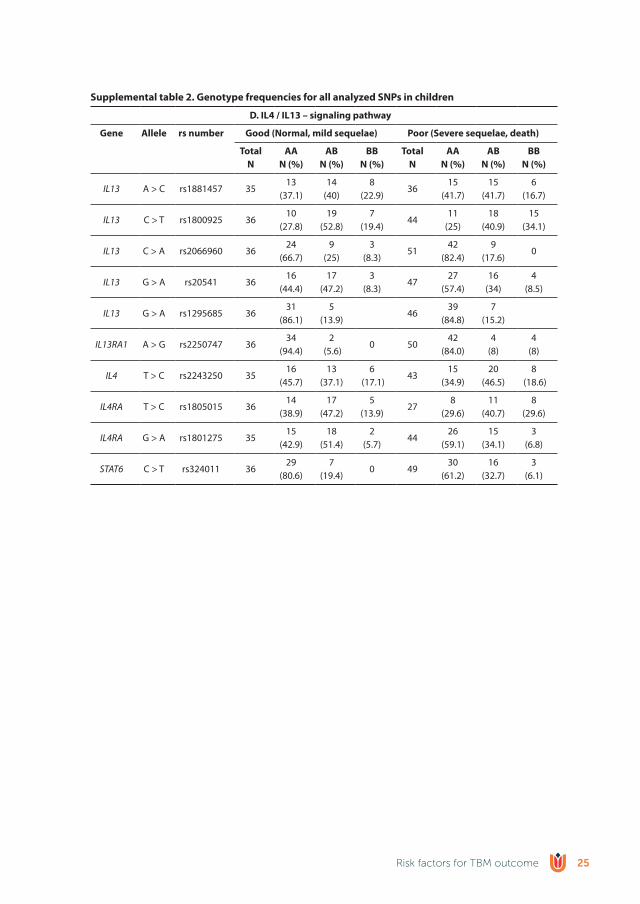
d. Il4 / Il13 – signaling pathway
Gene Allele rs number Good (normal, mild sequelae) Poor (severe sequelae, death)
totaln
AAn (%)
Abn (%)
bbn (%)
totaln
AAn (%)
Abn (%)
bbn (%)
IL13 A > C rs1881457 3513
(37.1)14
(40)8
(22.9)36
15 (41.7)
15 (41.7)
6(16.7)
IL13 C > T rs1800925 3610
(27.8)19
(52.8)7
(19.4)44
11(25)
18 (40.9)
15 (34.1)
IL13 C > A rs2066960 3624
(66.7)9
(25)3
(8.3)51
42 (82.4)
9(17.6)
0
IL13 G > A rs20541 3616
(44.4)17
(47.2)3
(8.3)47
27 (57.4)
16(34)
4(8.5)
IL13 G > A rs1295685 3631
(86.1)5
(13.9)46
39 (84.8)
7(15.2)
IL13RA1 A > G rs2250747 3634
(94.4)2
(5.6)0 50
42 (84.0)
4(8)
4(8)
IL4 T > C rs2243250 3516
(45.7)13
(37.1)6
(17.1)43
15 (34.9)
20 (46.5)
8 (18.6)
IL4RA T > C rs1805015 3614
(38.9)17
(47.2)5
(13.9)27
8(29.6)
11 (40.7)
8(29.6)
IL4RA G > A rs1801275 3515
(42.9)18
(51.4)2
(5.7)44
26 (59.1)
15 (34.1)
3(6.8)
STAT6 C > T rs324011 3629
(80.6)7
(19.4)0 49
30 (61.2)
16 (32.7)
3(6.1)
Risk factors for TBM outcome 25

reFerenCes
Caws, M., Thwaites, G., Dunstan, S., Hawn, T.R., Lan, N.T.N., Thuong, N.T.T., Stepniewska, K., Huyen, M.N.T., Nguyen, D.B., Tran, H.L., et al., 2008. The influence of host and bacterial genotype on the de-velopment of disseminated disease with Mycobacterium tuberculosis. PLoS Pathog. 4, e100034. doi:10.1371/journal.ppat.1000034
Dangeti, G. V., Mailankody, S., Neeradi, C., Mandal, J., Soundravally, R., Joseph, N.M., Kamalanathan, S., Swaminathan, R.., Kadhiravan, T., 2018. Vitamin D deficiency in patients with tuberculous menin-gitis and its relationship with treatment outcome. Int. J. Tuberc. lung Dis. 22, 93–99.
Datta, M., Via, L.E., Kamoun, W.S., Liu, C., Chen, W., Seano, G., Weiner, D.M., Schimel, D., England, K., Martin, J.D., Gao, X., Xu, L., Barry, C.E., Jain, R.K., 2015. Anti-vascular endothelial growth factor treatment normalizes tuberculosis granuloma vasculature and improves small molecule delivery. Proc. Natl. Acad. Sci. 112, 1827–1832. doi:10.1073/pnas.1424563112
Daya, M., Van Der Merwe, L., Van Helden, P.D., Möller, M., Hoal, E.G., 2014. The role of ancestry in TB susceptibility of an admixed South African population. Tuberculosis 94, 413–420. doi:10.1016/j.tube.2014.03.012
Donald, P.R., Van Toorn, R., Fitzpatrick, M., Lammie, G., Hewlett, R., Schoeman, J., Donald, P., Prasad, K., Volmink, J., Menon, G., et al., 2016. Use of corticosteroids in tuberculous meningitis. Lancet 387, 2585–2587. doi:10.1016/S0140-6736(16)30770-X
Gao, L., Tao, Y., Zhang, L., Jin, Q., 2010. Vitamin D receptor genetic polymorphisms and tuberculosis: updated systematic review and meta-analysis. Int J Tuberc Lung Dis 14, 15–23.
Hawn, T.R., Dunstan, S.J., Thwaites, G.E., Simmons, C.P., Thuong, N.T., Thi, N., Lan, N., Quy, H.T., Thi, T., Chau, H., et al., 2006. A polymorphism in toll-interleukin 1 receptor domain containing adaptor protein is associated with susceptibility to meningeal tuberculosis. J. Infect. Dis. 194, 1127–1134.
Heitmann, L., Dar, M.A., Schreiber, T., Erdmann, H., Behrends, J., Mckenzie, A.N.J., Brombacher, F., Ehlers, S., Hölscher, C., 2014. The IL-13/IL-4Rα axis is involved in tuberculosis-associated pathology. J. Pathol. 234, 338–350. doi:10.1002/path.4399
Hölscher, C., Heitmann, L., Owusu-Dabo, E., Horstmann, R.D., Meyer, C.G., Ehlers, S., Thye, T., 2016. A Mutation in IL4RA Is Associated with the Degree of Pathology in Human TB Patients. Mediators Inflamm. 2016. doi:10.1155/2016/4245028
Kalita, J., Misra, U.K., 1999. Outcome of tuberculous meningitis at 6 and 12 months: A multiple regression analysis. Int. J. Tuberc. Lung Dis. 3, 261–265.
Kumar, N.P., Banurekha, V. V., Nair, D., Babu, S., 2016. Circulating angiogenic factors as biomarkers of disease severity and bacterial burden in pulmonary tuberculosis. PLoS One 11, 1–12. doi:10.1371/journal.pone.0146318
Lee, Y.H., Song, G.G., 2015. Vitamin D receptor gene Fok I , Taq I , Bsm I , and Apa I polymorphisms and susceptibility to pulmonary tuberculosis : a meta-analysis 14, 9118–9129.
Misra, U.K., Kalita, J., Singh, A.P., Prasad, S., 2012. Vascular Endothelial Growth Factor in Tuberculous Meningitis. Int. J. Neurosci. 123, 128–132. doi:10.3109/00207454.2012.743127
Möller, M., De Wit, E., Hoal, E.G., 2010. Past, present and future directions in human genetic susceptibility to tuberculosis. FEMS Immunol. Med. Microbiol. 58, 3–26. doi:10.1111/j.1574-695X.2009.00600.x
Nicolette, N.B., Jo, W., Muloiwa, R., James, N., 2014. Presentation and outcome of tuberculous meningitis among children: Experiences from a tertiary children’s hospital. Afr. Health Sci. 14, 143–149. doi:10.4314/ahs.v14i1.22
Nyholt, D.R., 2004. A Simple Correction for Multiple Testing for Single-Nucleotide Polymorphisms in Link-age Disequilibrium with Each Other. Am. J. Hum. Genet. 74, 765–769. doi:10.1086/383251
Risk factors for TBM outcome26

Oehlers, S.H., Cronan, M.R., Scott, N.R., Thomas, M.I., Okuda, K.S., Walton, E.M., Beerman, R.W., Crosier, P.S., Tobin, D.M., 2014. Interception of host angiogenic signalling limits mycobacterial growth. Nature 517, 612–615. doi:10.1038/nature13967
Panwar, A., Garg, R.K., Malhotra, H.S., Jain, A., Singh, A.K., Prakash, S., Kumar, N., Garg, R., Mahdi, A.A., Verma, R., Sharma, P.K., 2016. 25-Hydroxy Vitamin D, Vitamin D Receptor and Toll-like Receptor 2 Polymorphisms in Spinal Tuberculosis: A Case-Control Study. Medicine (Baltimore). 95, e3418. doi:10.1097/MD.0000000000003418
Perneger, T.V., 1998. What’s wrong with Bonferroni adjustment. Br. Med. J. 316.Prasad, K., Singh, M.B., Ryan, H., 2016. Corticosteroids for managing tuberculous meningitis. Cochrane
Database Syst. Rev. 2016. doi:10.1002/14651858.CD002244.pub4Rizvi, I., Garg, R.K., Jain, A., Malhotra, H.S., Singh, A.K., Prakash, S., Kumar, N., Garg, R., Verma, R., Mahdi,
A.A., Sharma, P.K., 2016. Vitamin D status, vitamin D receptor and toll like receptor-2 polymor-phisms in tuberculous meningitis: a case–control study. Infection 44, 633–640. doi:10.1007/s15010-016-0907-x
Schoeman, J., Elshof, J., Laubscher, J., Janse van Rensburg, A., Donald, P., 2001. The effect of adjuvant steroid treatment on serial cerebrospinal fluid changes in tuberculous meningitis. Ann Trop Paediatr 21, 299–305.
Schoeman, J.F., Janse Van Rensburg, A., Laubscher, J.A., Springer, P., 2011. The role of aspirin in childhood tuberculous meningitis. J. Child Neurol. 26, 956–962. doi:10.1177/0883073811398132
Sharma, S., Goyal, M.K., Sharma, K., Modi, M., Sharma, M., Khandelwal, N., Prabhakar, S., Sharma, N., Shree, R., Gairolla, J., Jain, A., Lal, V., 2017. Cytokines do play a role in pathogenesis of tuberculous meningitis: A prospective study from a tertiary care center in India. J. Neurol. Sci. 379, 131–136. doi:10.1016/j.jns.2017.06.001
Thao, L.T.P., Heemskerk, A.D., Geskus, R.B., Mai, N.T.H., Ha, D.T.M., Chau, T.T.H., Phu, N.H., Chau, N.V.V., Caws, M., Lan, N.H., et al., 2017. Prognostic models for 9 month mortality in tuberculous meningitis. Clin. Infect. Dis. 1–10. doi:10.1093/cid/cix849
Thuong, N.T.T., Hawn, T.R., Thwaites, G.E., Chau, T.T.H., Lan, N.T.N., Quy, H.T., Hieu, N.T., Aderem, A., Hien, T.T., Farrar, J.J., Dunstan, S.J., 2007. A polymorphism in human TLR2 is associated with increased susceptibility to tuberculous meningitis. Genes Immun. 8, 422–428. doi:10.1038/sj.gene.6364405
Thuong, N.T.T., Heemskerk, D., Tram, T.T.B., Thao, L.T.P., Ramakrishnan, L., Ha, V.T.N., Bang, N.D., Chau, T.T.H., Lan, N.H., et al., 2017. Leukotriene A4 hydrolase genotype and HIV infection influence in-tracerebral inflammation and survival from tuberculous meningitis. J. Infect. Dis. 215, 1020–1028. doi:10.1093/infdis/jix050
Tobin, D.M., Roca, F.J., Oh, S.F., McFarland, R., Vickery, T.W., Ray, J.P., Ko, D.C., Zou, Y., Bang, N.D., Chau, T.T.H., Vary, J.C., Hawn, T.R., Dunstan, S.J., Farrar, J.J., Thwaites, G.E., King, M.-C., Serhan, C.N., Ramak-rishnan, L., 2012. Host genotype-specific therapies can optimize the inflammatory response to mycobacterial infections. Cell 148, 434–446. doi:10.1016/j.cell.2011.12.023
Tobin, D.M., Vary, J.C., Ray, J.P., Walsh, G.S., Dunstan, S.J., Bang, N.D., Hagge, D. a., Khadge, S., King, M.C., Hawn, T.R., Moens, C.B., Ramakrishnan, L., 2010. The lta4h Locus Modulates Susceptibility to My-cobacterial Infection in Zebrafish and Humans. Cell 140, 717–730. doi:10.1016/j.cell.2010.02.013
Tsenova, L., Sokol, K., Freedman, V.H., Kaplan, G., 1998. A combination of thalidomide plus antibiotics protects rabbits from mycobacterial meningitis-associated death. J. Infect. Dis. 177, 1563–1572.
Van Crevel, R., Karyadi, E., Preyers, F., Leenders, M., Kullberg, B.-J., Nelwan, R.H.H., Van Der Meer, J.W.M., 2000. Increased production of interleukin 4 by CD4+ and CD8+ T cells from patients with tuberculosis is related to the presence of pulmonary cavities. J. Infect. Dis. 181, 1194–1197. doi:10.1086/315325
Risk factors for TBM outcome 27
van der Flier, M., Hoppenreijs, S., van Rensburg, A.J., Ruyken, M., Kolk, A.H.J., Springer, P., Hoepelman, A.I.M., Geelen, S.P.M., Kimpen, J.L.L., Schoeman, J.F., 2004. Vascular Endothelial Growth Factor and Blood-Brain Barrier Disruption in Tuberculous Meningitis. Pediatr. Infect. Dis. J. 23, 608–613. doi:10.1097/01.inf.0000131634.57368.45
Van Laarhoven, A., Dian, S., Ruesen, C., Hayati, E., Damen, M.S.M.A., Annisa, J., Chaidir, L., Ruslami, R., Achmad, T.H., Netea, M.G., et al., 2017. Clinical parameters, routine inflammatory markers, and LTA4H genotype as predictors of mortality among 608 patients with tuberculous meningitis in Indonesia. J. Infect. Dis. 215, 1029–1039. doi:10.1093/infdis/jix051
van Toorn, R., du Plessis, A.M., Schaaf, H.S., Buys, H., Hewlett, R.H., Schoeman, J.F., 2015. Clinicoradiologic response of neurologic tuberculous mass lesions in children treated with thalidomide. Pediatr Infect Dis J 34, 214–218. doi:10.1097/inf.0000000000000539
van Toorn, R., Springer, P., Laubscher, J. a, Schoeman, J.F., 2012. Value of different staging systems for predicting neurological outcome in childhood tuberculous meningitis. Int. J. Tuberc. Lung Dis. 16, 628–32. doi:10.5588/ijtld.11.0648
van Well, G.T.J., Paes, B.F., Terwee, C.B., Springer, P., Roord, J.J., Donald, P.R., van Furth, A.M., Schoeman, J.F., 2009. Twenty years of pediatric tuberculous meningitis: a retrospective cohort study in the western cape of South Africa. Pediatrics 123, e1–e8. doi:10.1542/peds.2008-1353
Visser, D.H., Solomons, R.S., Ronacher, K., van Well, G.T., Heymans, M.W., Walzl, G., Chegou, N.N., Schoe-man, J.F., van Furth, a. M., 2014. Host Immune Response to Tuberculous Meningitis. Clin. Infect. Dis. 60, 177–187. doi:10.1093/cid/ciu781
Wang, J., Duncan, D., Shi, Z., Zhang, B., 2013. WEB-based GEne SeT AnaLysis Toolkit (WebGestalt): update 2013. Nucleic Acids Res. 41, 77–83. doi:10.1093/nar/gkt439
Warnes, G., Leisch, F., Man, M., Warnes, M.G., 2013. R-Package ’ genetics ’ Ver.1.3.8.1 43.Wilkinson, R.J., Rohlwink, U., Misra, U.K., Van Crevel, R., Mai, N.T.H., Dooley, K.E., Caws, M., Figaji, A., Savic,
R., Solomons, R., Thwaites, G.E., 2017. Tuberculous meningitis. Nat. Rev. Neurol. 13, 581–598. doi:10.1038/nrneurol.2017.120
Risk factors for TBM outcome28