chapter 8 development of a carambola …shodhganga.inflibnet.ac.in/bitstream/10603/54621/16/16...177...
TRANSCRIPT
177
CHAPTER 8
DEVELOPMENT OF A CARAMBOLA POMACE FIBRE FORTIFIED MIX FRUIT
BEVERAGE POWDER AND ITS CHARACTERIZATION
8.1. Introduction
Fruits in their natural form are good sources of micronutrients and phytochemicals.
But as most of the fruits are seasonal in nature, most of them are not available throughout
the year. With the technological advancement in the food industries, many processing
methods have developed to ensure the availability of the seasonal fruits in the form of
processed products which are generally read-to-use. Unlike the fresh fruits which are highly
perishable in nature and their transportation is a major problem for the suppliers, the
processed products are more stable with increased shelf life and easy to transport and
supply. The popular processed fruit products available in the market are different ready-to-
drink and ready-to-serve fruit juice drinks in addition to spray dried powders of some citrus
fruits. Compared to other processed fruit drinks which are prepared by conventional
pasteurisation, the products which were processed using high pressure processing,
membrane processing or spray drying are more stable, compact in size and easy to transport.
The spray dried products could be easily reconstituted before consumption and can be quite
comparable to their original unprocessed counterpart.
With an increase in awareness for health among the consumers, there has been a
rapid growth in the functional food segments. Researchers and food manufacturers are
developing newer food products with health promoting properties. In the present time, low
calorie breakfast cereals with added dietary fibre are the most popular products among the
consumers in the functional food segments. Dietary fibre helps in the regulation of serum
cholesterol and glucose level. It acts as a bulking agent; regulates energy intake; improves
satiety; controls weight gain; and maintains health of the digestive system through its
fermentation in the colon by the bacteria present that produces many secondary bioactive
metabolites with health promoting properties.[1-4]
The dietary fibres derived mainly from the
fruit by-products are rich in polyphenols, carotenoids and minerals. [5-10]
The carambola
pomace derived fibre rich fractions have been reported to have serum cholesterol and
178
glucose lowering properties under in vitro and in vivo conditions. [11-13]
However, till date
their application in the development of a functional beverage has not been reported.
The use of dietary fibre as fortificant in cereal based functional food is very
prevalent and well accepted. However, fibre fortification in fruit based products is very
sparse. Some work has been reported on using fibre in fruit smoothie.[14, 15]
Sun-
Waterhouse[16]
, reported a study on addition of polyphenols and fibre from apple to fruit
smoothies. But as the dietary fibre, specifically insoluble dietary fibre is insoluble in water
and therefore, their use in the beverage industry is very limited. This is mainly because,
fortification of fibre into a liquid medium has many shortcomings and challenges like
immiscibility, separation and sedimentation problems during storage which would
ultimately affect the overall acceptability and appearance of the fortified juice product.[17-19]
To overcome these problems, the manufacturers are then needed to use some techniques like
microencapsulation, emulsification using natural emulsifiers or high pressure
homogenisation. Another method is to use chemical additives which are not always
preferred by the consumers who are looking for a natural healthy food product with
functional properties.
In chapter 7, it has been reported that out of the six fibre sources that were studied
for their functional properties, only carambola pomace fibre was found to have good TPC
content; high water- and oil-holding capacities and other functional properties; and good
color. The reported results indicated that carambola pomace could be used as a source of
fibre to develop the functional fruit beverage.
Therefore, considering the above aspects, a study was carried out to optimize the
development of a functional mix fruit beverage powder fortified with fibre rich fraction of
carambola pomace using response surface methodology and study the quality of the
obtained powder product. This chapter has the report of the detailed study.
8.2. Materials and methods
All the chemicals used were of analytical grade and supplied by Merck, India,
Himedia Laboratories and Sigma Aldrich, India.
179
8.2.1. Materials
The fruits samples viz. carambola (Averrhoa carambola L.), watermelon (Citrullus
lanatus var lanatus), and pineapple (Anona sativas L. Merr) were procured from the local
fruit market, Tezpur, Assam during the season.
8.2.2. Fruit juice mix preparation for spray drying
The fruit samples were washed and sorted properly and the juice was extracted using
a household juicer (Philips). The juice was strained through a muslin cloth and kept aside.
The juice mix was obtained by blending the fruit juice in the ratio 90:5:5 (pineapple:
carambola: watermelon). This was obtained after initial trials based on taste. To the mixed
juice, 10% of fibre rich carambola pomace was added along with maltodextrin (≤ 20 DE,
Himedia) in the required amount (15-35%) and homogenized (UltraTurex 25, IKA). After
adding the different concentrations of maltodextrin to the mixed juice fibre, the final °Brix
of all the feed mixtures were diluted to 10°B to maintain a constant feed flow rate.
The total solid content or °Brix was measured using a portable refractometer, (0-
32%, Erma, Japan).
8.2.3. Viscosity and pH of the mix fruit juice fibre-maltodextrin feed sample at 10°B
Viscosity of the feed sample was measured by a viscometer (LabTech, LTT30) at
30°C and 30 rpm using spindle no.2. pH was measured using an electronic pH meter
(Eutech, Merck) at 27°C.
8.2.4. Spray drying of the mix fruit juice fibre-maltodextrin
The homogenized mix fruit juice fibre-maltodextrin feed mixture at different
concentration of maltodextrin was spray dried at an inlet temperature of 165 ºC - 185 ºC in a
laboratory scale spray drier ((Lab plant system, UK). The feed rate was maintained at 7
mL/min and the nozzle size of the atomizer was 1mm. The obtained powder was kept in an
airtight container and stored at room temperature for the various analyses.
8.2.5. Experimental design for optimization using central composite rotatable design
(CCRD) by response surface methodology (RSM)
For the optimization of the spray drying process, CCRD model was applied. Two
independent variables were taken viz., maltodextrin concentration and inlet temperature at 5
levels (Table 8.1). The CCD consisted of 13 experiments including 5 centers, 4 axial and 4
180
factorial points. The design independent variables were maltodextrin concentration (X1, %)
and inlet temperature (X2, oC) while, the dependent or response variables were moisture
content, yield, solubility, bulk density, and hygroscopicity.
Experimental data obtained were fitted into a second order polynomial model. The
generalized second order polynomial order equation used was:
2112
2
222
2
11122110XXaXaXaXaXaaYi Eq. 8.1
Where, Yi (i= 1-3) is predicted response for moisture content, yield, solubility, bulk
density, and hygroscopicity. The ao is the fitted response at the center point; a1and a2 are
linear terms; a12 is the interaction effect, a11 and a22 are squared effects. X1 and X2 are the
independent variables.
Design expert 6.0 software was used to generate response surfaces and the plot. The
data were statistically analyzed by ANOVA. The p values of 0.01 were considered to be
statistically significant.
8.2.6. Determination of the response variables
8.2.6.1. Moisture content
Moisture content was determined based on AOAC method.[20]
The spray dried
sample was taken in a previously dried and weighed covered dish. The sample was allowed
to dry in a hot air oven (Jiotech, South Korea) at 105°C for 8 h till a constant weight was
attained. The final weight of the dish containing the sample was measured both before and
after drying and moisture content was calculated.
Moisture content (%) = 1002
21
W
WW
Eq. 8.2
Where, W1 is the weight of the sample with the dish before drying; W2 is the final
weight of the sample with dish after drying
8.2.6.2. Yield of powder
The yield of the spray drying process was calculated by taking into consideration the
total solid content of the feed sample with maltodextrin and weight of the final dry powder.
Yield (%) = 100)°(
)(
BmaterialfeedtheofcontentSolid
gpowderdriedsolidsofWeight Eq. 8.3
181
8.2.6.3. Solubility
The solubility was determined according to the method described by Chau et al.[21]
Briefly, samples were mixed with distilled water (1:10 w/v), stirred for 1 h at room
temperature and centrifuged at 1500 rpm for 10 min. The supernatant was collected, dried
and weighed.
Solubility (%) = 100sampleof(g)Weight
dryingaftertsupernatanof(g)Weight Eq. 8.4
8.2.6.4. Bulk density
The bulk density and tapped density were calculated by weighing 1g of sample
powder into a graduated 10 mL cylinder and measuring the volume occupied by the
sample.[22]
The results are expressed as g/mL.
Bulk density (g/mL) = occupiedVolume
sampleofWeight Eq. 8.5
8.2.6.5. Hygroscopicity
The hygroscopicity property of the sample powders was determined according to Cai
and Corke [23]
with some modifications. Briefly, 2 g of spray dried powder samples were
placed in pre-weighed glass vials and placed in a desiccator containing saturated salt
solution of sodium chloride (relative humidity of 75.09 %) maintained at 30°C and kept for
7 days. After the incubation period, sample vials were weighed and hygroscopicity was
expressed as expressed as g moisture per 100 g solids.
8.2.7. Characterization of the obtained spray dried fibre fortified mix fruit beverage
powder
8.2.7.1. Determination of proximate content.
8.2.7.1.1. Moisture content
It was determined by the method as mentioned in 8.2.6.1.
8.2.7.1.2. Crude protein content
The crude protein content was determined by modified Micro-Kjeldahl method of
AOAC [20]
using a digestion and distillation system (KelPlus, Pelican Equipment, Chennai,
India). Briefly, 250 mg of the fibre sample was weighed and then digested with 10 mL
concentrated sulphuric acid in a digestion tube at 350°C till a bluish green colour appeared.
182
The digested sample was then distilled using 40 mL of 40 M sodium hydroxide with 20% of
20 mL boric acid with 1-2 drops of methyl red indicator. During distillation the ammonium
vapor produced is passed over the boric acid solution which results in change of its colour
from pink to light yellow. After completion of the distillation process the distillate was
titrated against 0.1N hydrochloric acid and the end point was noted when a light pink colour
appeared. The nitrogen content of the sample was calculated. The crude protein was
calculated by multiplying a factor of 6.25 with nitrogen content.
Nitrogen content (%, db) = 1000
10014
sampleofWeight
HCLofnormalityBS Eq. 8.6
Where, S is the titre value of sample and B is the titre value of blank
Crude protein content (%, db) = 25.6(%)contentNitrogen Eq. 8.7
8.2.7.1.3. Crude lipid content
The crude lipid content was determined as per AOAC method [20]
using a Soxhlet
apparatus (Socs Plus, Pelican Equipment, India). Briefly, 2 g of sample was weighed and
extracted with petroleum ether (60°C-80°C boiling range) for 2 h at 100°C and recovered for
2 h at 200°C in a pre-weighed glass jar. Once the recovery process was over, the glass jars
were put into a hot air oven at 105°C to remove any trace of moisture, cooled in a desiccator
and then the final weight was measured. The total fat content was calculated.
Crude lipid content (%, db) = 10012
S
WW
Eq. 8.8
Where, W1 is the initial weight of the glass jar; W2 is the final weight of the glass jar;
S is the weight of the sample.
8.2.7.1.4. Ash content
The ash content was determined by AOAC method [20]
. Briefly, 5g of sample was
weighed into a pre-weighed sintered crucible (W1), charred on a hot plate and ashed at
625°C for 6 h in a muffle furnace (Labtech). The ashed sample with the crucible was then
cooled in a desiccator and the final weight of the crucible (W2) was measured and the total
ash content was calculated.
Ash content (%) = 10012
S
WW
Eq. 8.9
183
Where, W1 is the initial weight of the empty crucible; W2 is the final weight of the
crucible after ashing; S is the weight of the sample.
8.2.7.1.5. Total reducing sugar
The total reducing sugar was measured by Nelson Somogyi method.[24]
The alkaline
copper taratarate solution was prepared mixing 4 mL of solution A and 96 mL of solution B.
The solution A was made by dissolving 2.5 g anhydrous sodium carbonate, 2.0 g sodium
carbonate, 2.5 g potassium sodium tartarate and 20 g anhydrous sodium sulphate in 80 mL
of distilled water and the volume was made up to 100 mL. Similarly, the solution B was
prepared by dissolving 15.0 g copper sulphate in distilled water. To this solution 1 drop of
concentrated suplhuric acid was added and volume was made up to 100 mL. For the
preparation of the arsenomolybdate reagent, 2.5 g of ammonium molybdate in 45 mL
distilled water was dissolved. Then added 2.5 mL concentrated sulphuric acid and mixed
well. After that 0.3 g disodium hydrogen arsenate was dissolved in 25 mL distilled water.
Both the solution was mixed well and incubated at 13°C for 24 h. A standard glucose
solution (100 µg/mL) was prepared for obtaining the calibration curve.
Sample aliquot of 0.1 mL was taken in a test tube and volume made up to 2mL with
distilled water. Then added 1 mL of alkaline copper tartarate solution and placed in a boiling
water bath for 10 min. After 10 min the test tubes were cooled and then 1 mL of
arsenomolybic acid reagent was added to the tubes. The final volume up to 10mL was made
up with distilled water and after an incubation period of 10 min, the absorbance of the test
samples was taken at 620 nm. The reducing sugar concentration was calculated from
standard glucose calibration graph.
8.2.7.1.6. Total dietary fibre
The dietary fibre estimation was done by an enzymatic gravimetric method. [20]
The
beverage powder (1 g) was homogenized in 40 mL of 0.05 M 2-(N-morpholino)
ethanesulfonic acid (MES) buffer (pH 8.2), followed by the addition of 50 µL heat stable α-
amylase (product code A 3306, termamyl, Sigma) and was incubated at 95°C for 15 min
with occasional stirring. The contents were cooled to 60°C and rinsed with 10 mL of water.
Then added 100 µL of protease (product code P 3910, Sigma) and incubated at 60°C for 30
min. Then 5mL 0.561 M hydrochloric acid was added into the beakers while stirring. The
184
pH was adjusted to 4-4.7 at 60°C, by adding 1 M hydrochloric acid. Lastly, 300 µL of
amyloglucosidase (product code A 9913, Sigma) was added and incubated for another 30
min at 60°C with constant stirring. To the digested test solution, 225 mL 95% ethanol was
added at 60°C. The ratio of ethanol to test solution was kept at 4:1. The digested solution
and ethanol mixture was allowed to precipitate at room temperature for 1 h. The precipitate
was collected by vacumm filtration through a dried and weighed crucible containing 0.5 g of
celite. (Drying and weighing of crucible was done by adding 0.5 g of celite into the crucible
and washing it with 20 mL of 95% ethanol and 20 mL acetone. It was then dried in oven at
105°C for 30 min and weighed).
The residue retained on the crucible was then washed with 20 mL of 95% ethanol
and 20 ml of acetone, the crucible was dried at 105°C overnight and the final weight was
recorded. Total dietary fibre was calculated by the given equation:
TDF (%) = 1002/
2/
21
21
MM
BAPRR
Eq. 8.10
Where, R1 and R2 are the residue weight of the duplicate test samples; M1and M2 are
the weight of the test samples in duplicate; P is the weight of protein; A is the weight of ash
content; and B is the test blank
8.2.7.2. Color comparison of the reconstituted beverage with the feed solution before
drying
Color values (L, a, b) were measured using a Hunter color spectrophotometer
(Hunter Color Lab UltrascanVis). The ‗L‘ value indicates degree of lightness. ‗L‘ value in
the range between 0-50 indicates dark and 51-100 indicates light. Similarly, ‘a‘ means
measure of red (positive values) and green color (negative values); ‘b‘ measures the yellow
(positive value) or blue (negative values) colors [25]
. The color change of the samples was
determined by comparing the L, a, b values of the reconstituted samples with that of the
fresh feed sample just before spray drying. The quantity required (water/g) of the powder
samples for the reconstitution was calculated to obtain 10°B .The overall color change (E)
of the samples was calculated. [26]
E = Eq. 8.11
2*
0
2*
0
2
0
*
0 )()()( bbaaLL
185
Where, E is the overall change in colour; L0* is the ‗L‘ value of fresh feed; L0 is
the ‗L‘ value of reconstituted sample; a0*
the ‗a‘ value of fresh feed; a0 is the ‗a‘ value of
reconstituted sample; b0* is the ‗b‘ value of fresh feed; and b0 is the ‗b‘ value of
reconstituted sample.
8.2.7.3. Particle size distribution
The particle size distribution was determined using a particle size analyzer
(NanoPlus zeta potential & particle size analyzer, Particulate Systems). The particle size was
analyzed based on the principle that when laser beams are irradiated to particles under the
Brownian motion, scattered light from the particles shows fluctuation corresponding to
individual particles. The fluctuation is observed according to the pinhole type photon
detection method, so that particle size and particle size distributions are calculated. A small
powder sample was suspended in water and analyzed at 25°C. The particle size (µM) was
depicted with respect to its intensity (%) while particle size distribution was represented by
calculating Span.
Span =50
1090
D
DD Eq. 8.12
Where, D10, D50, and D90 are the diameters of sample at the 10th, 50th, and 90th
percentiles.
8.2.7.4. Bulk density (BD), tapped density (TD), Hausner’s ratio (HR) and Carr Index
(CI)
Bulk density was measured as given in 8.2.6.4. For tapped density, 1 g of sample
was taken in a cylinder and then it was tapped manually for 50 times and the volume
occupied by the sample was noted. [22]
From the bulk and tapped density values, the Hausner‘s ratio (HR) and Carr index
(CI) were calculated to determine the cohesiveness and flowability property of the powder
samples. [27, 28]
Based on the values of HR and CI (Table 8.1), the flowability and
cohesiveness of the sample powders were classified. [29]
HR = BD
TD Eq. 8.13
CI = 100
TD
BDTD
Eq. 8.14
186
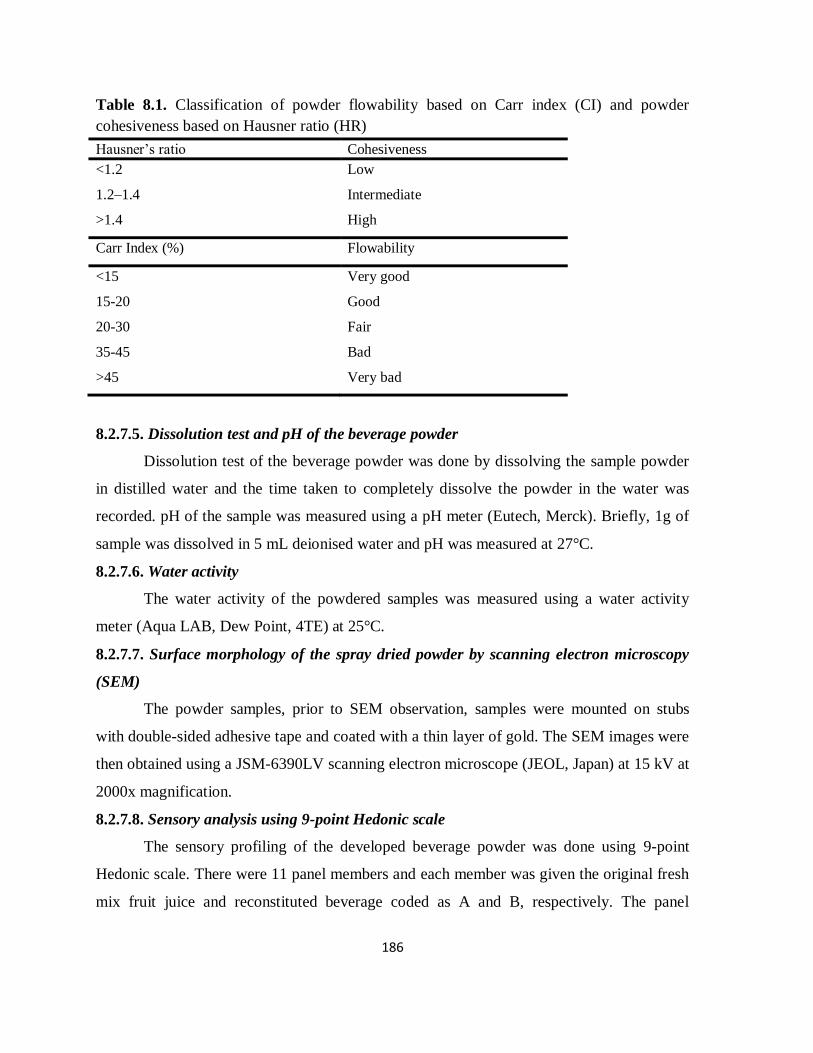
Table 8.1. Classification of powder flowability based on Carr index (CI) and powder
cohesiveness based on Hausner ratio (HR)
Hausner‘s ratio Cohesiveness
<1.2 Low
1.2–1.4 Intermediate
>1.4 High
Carr Index (%) Flowability
<15 Very good
15-20 Good
20-30 Fair
35-45 Bad
>45 Very bad
8.2.7.5. Dissolution test and pH of the beverage powder
Dissolution test of the beverage powder was done by dissolving the sample powder
in distilled water and the time taken to completely dissolve the powder in the water was
recorded. pH of the sample was measured using a pH meter (Eutech, Merck). Briefly, 1g of
sample was dissolved in 5 mL deionised water and pH was measured at 27°C.
8.2.7.6. Water activity
The water activity of the powdered samples was measured using a water activity
meter (Aqua LAB, Dew Point, 4TE) at 25°C.
8.2.7.7. Surface morphology of the spray dried powder by scanning electron microscopy
(SEM)
The powder samples, prior to SEM observation, samples were mounted on stubs
with double-sided adhesive tape and coated with a thin layer of gold. The SEM images were
then obtained using a JSM-6390LV scanning electron microscope (JEOL, Japan) at 15 kV at
2000x magnification.
8.2.7.8. Sensory analysis using 9-point Hedonic scale
The sensory profiling of the developed beverage powder was done using 9-point
Hedonic scale. There were 11 panel members and each member was given the original fresh
mix fruit juice and reconstituted beverage coded as A and B, respectively. The panel
187
members then rated the two samples for color, odour, taste, aroma, appearance and overall
acceptability using the 9-point scale.
1=dislike extremely 6= like slightly
2= dislike very much 7= like moderately
3= dislike moderately 8= like very much
4= dislike slightly 9= like extremely
5= neither like nor dislike
8.2.7.9. Statistical analysis
All experiments were carried out at least in triplicates and reported as mean ±
standard deviation of mean (S.E.M). The optimization data were analyzed by ANOVA using
Design Expert 6.0 software. The ‗L’, ‘a’, ‘b’ values were subjected to paired-comparison t-
test (p0.05).
8.3. Results and discussion
8.3.1. Optimization and fitting of the model
RSM was applied to determine the effect of maltodextrin concentration and inlet
temperature on responses for moisture content, yield, solubility, bulk density, and
hygroscopicity. The results of the experiments performed for CCRD of the variables along
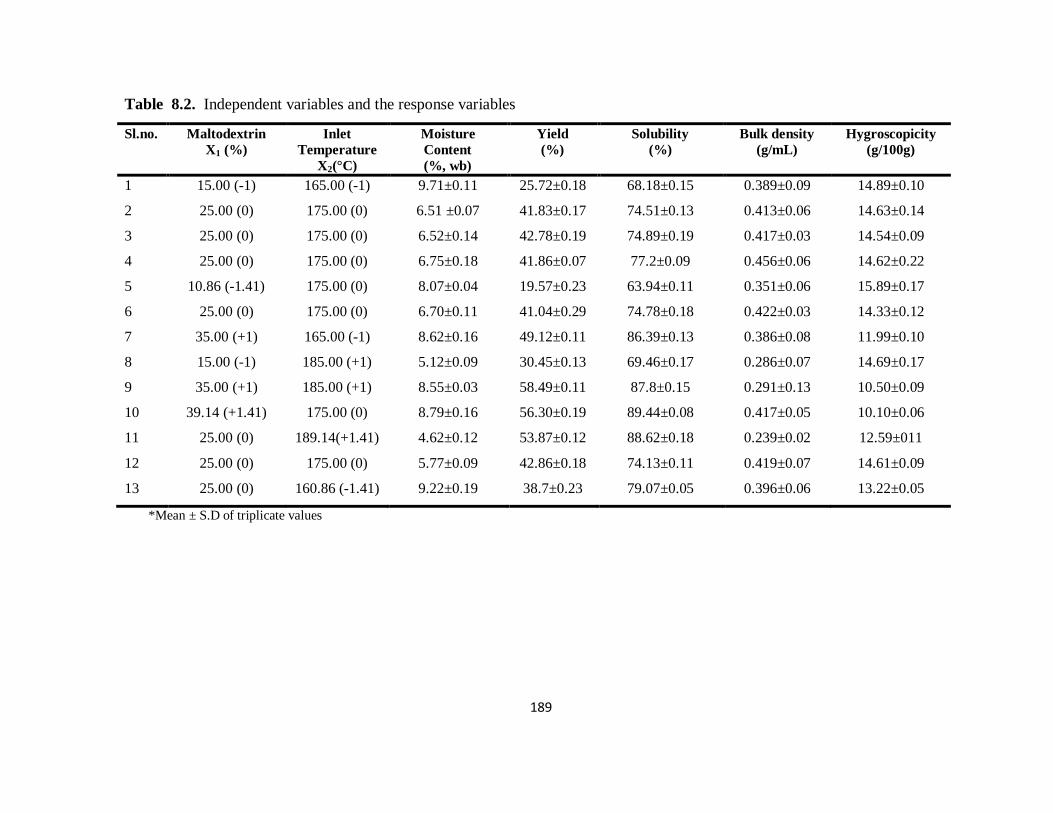
with the responses are given in Table 8.2. The ANOVA results for the model responses are
presented in Table 8.3. For the good fit of a model, the R2 value should be 0.80.
[30] In the
present study, R2
values for the three responses were higher than 0.80 which implied the
adequacy of the applied regression model. The lack of fit for all fitted models was found to
be not significant (p>0.05). The lack of fit measures the failure of the model to represent
data in the experimental domain at points which are not included in the regression. [31]
Therefore, it can be assumed that the selected model can be used for the optimization of
variables and development of the spray dried fibre fortified mix fruit beverage powder.
8.3.2. Effect of independent variables on responses in the spray dried beverage powder
8.3.2.1. Moisture content
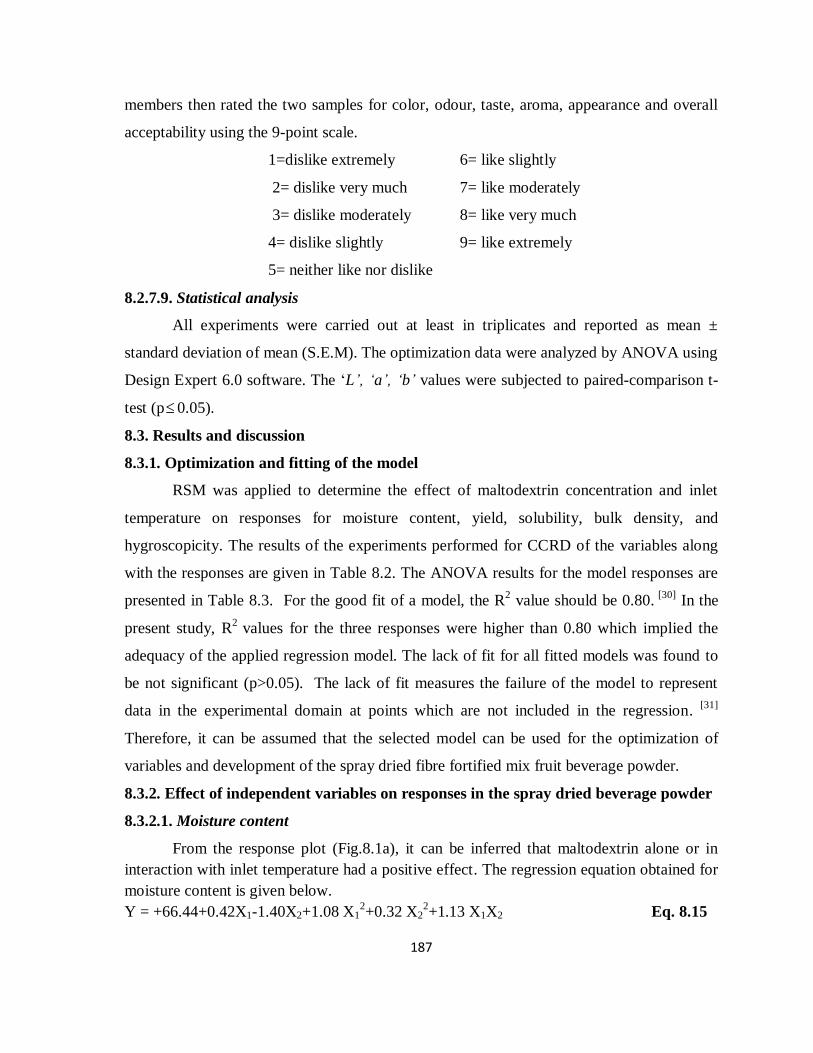
From the response plot (Fig.8.1a), it can be inferred that maltodextrin alone or in
interaction with inlet temperature had a positive effect. The regression equation obtained for
moisture content is given below.
Y = +66.44+0.42X1-1.40X2+1.08 X12+0.32 X2
2+1.13 X1X2 Eq. 8.15
188
(a)
(b)
Fig 8.1. 3D plot of the response variables (a) moisture content and (b) yield
8.3.2.2. Yield
From the response plot (Fig.8.1b), it showed that increase in temperature and
maltodextrin concentration increased the yield value. The regression equation obtained for
yield is given below.
Y = +42.07+1291X1+4.45X2-2.37X12+1.81X2
2 +1.18X1X2 Eq. 8.16
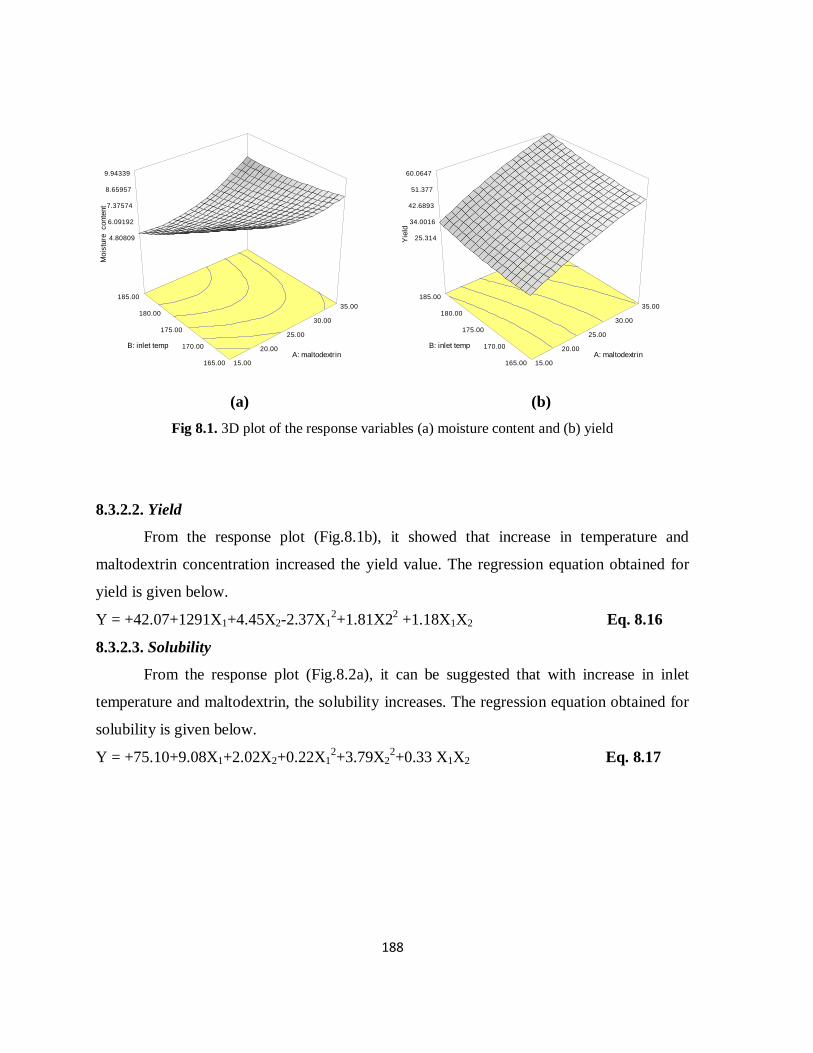
8.3.2.3. Solubility
From the response plot (Fig.8.2a), it can be suggested that with increase in inlet
temperature and maltodextrin, the solubility increases. The regression equation obtained for
solubility is given below.
Y = +75.10+9.08X1+2.02X2+0.22X12+3.79X2
2+0.33 X1X2 Eq. 8.17
4.80809
6.09192
7.37574
8.65957
9.94339
M
ois
ture
conte
nt
15.00
20.00
25.00
30.00
35.00
165.00
170.00
175.00
180.00
185.00
A: maltodextrin
B: inlet temp
25.314
34.0016
42.6893
51.377
60.0647
Y
ield
15.00
20.00
25.00
30.00
35.00
165.00
170.00
175.00
180.00
185.00
A: maltodextrin
B: inlet temp
189
Table 8.2. Independent variables and the response variables
Sl.no. Maltodextrin
X1 (%)
Inlet
Temperature
X2(°C)
Moisture
Content
(%, wb)
Yield
(%)
Solubility
(%)
Bulk density
(g/mL)
Hygroscopicity
(g/100g)
1 15.00 (-1) 165.00 (-1) 9.71±0.11 25.72±0.18 68.18±0.15 0.389±0.09 14.89±0.10
2 25.00 (0) 175.00 (0) 6.51 ±0.07 41.83±0.17 74.51±0.13 0.413±0.06 14.63±0.14
3 25.00 (0) 175.00 (0) 6.52±0.14 42.78±0.19 74.89±0.19 0.417±0.03 14.54±0.09
4 25.00 (0) 175.00 (0) 6.75±0.18 41.86±0.07 77.2±0.09 0.456±0.06 14.62±0.22
5 10.86 (-1.41) 175.00 (0) 8.07±0.04 19.57±0.23 63.94±0.11 0.351±0.06 15.89±0.17
6 25.00 (0) 175.00 (0) 6.70±0.11 41.04±0.29 74.78±0.18 0.422±0.03 14.33±0.12
7 35.00 (+1) 165.00 (-1) 8.62±0.16 49.12±0.11 86.39±0.13 0.386±0.08 11.99±0.10
8 15.00 (-1) 185.00 (+1) 5.12±0.09 30.45±0.13 69.46±0.17 0.286±0.07 14.69±0.17
9 35.00 (+1) 185.00 (+1) 8.55±0.03 58.49±0.11 87.8±0.15 0.291±0.13 10.50±0.09
10 39.14 (+1.41) 175.00 (0) 8.79±0.16 56.30±0.19 89.44±0.08 0.417±0.05 10.10±0.06
11 25.00 (0) 189.14(+1.41) 4.62±0.12 53.87±0.12 88.62±0.18 0.239±0.02 12.59±011
12 25.00 (0) 175.00 (0) 5.77±0.09 42.86±0.18 74.13±0.11 0.419±0.07 14.61±0.09
13 25.00 (0) 160.86 (-1.41) 9.22±0.19 38.7±0.23 79.07±0.05 0.396±0.06 13.22±0.05
*Mean ± S.D of triplicate values
190
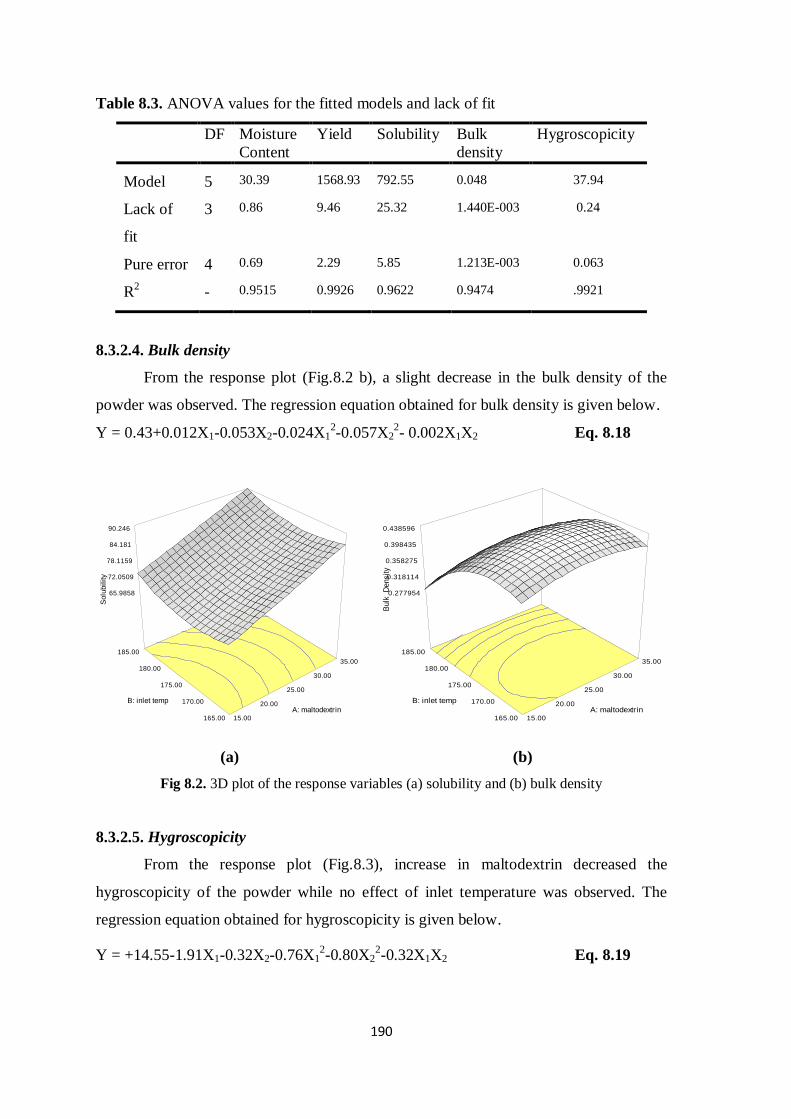
Table 8.3. ANOVA values for the fitted models and lack of fit
DF Moisture
Content
Yield Solubility Bulk
density
Hygroscopicity
Model 5 30.39 1568.93 792.55 0.048 37.94
Lack of
fit
3 0.86 9.46 25.32 1.440E-003 0.24
Pure error 4 0.69 2.29 5.85 1.213E-003 0.063
R2
- 0.9515 0.9926 0.9622 0.9474 .9921
8.3.2.4. Bulk density
From the response plot (Fig.8.2 b), a slight decrease in the bulk density of the
powder was observed. The regression equation obtained for bulk density is given below.
Y = 0.43+0.012X1-0.053X2-0.024X12-0.057X2
2- 0.002X1X2 Eq. 8.18
(a)
(b)
Fig 8.2. 3D plot of the response variables (a) solubility and (b) bulk density
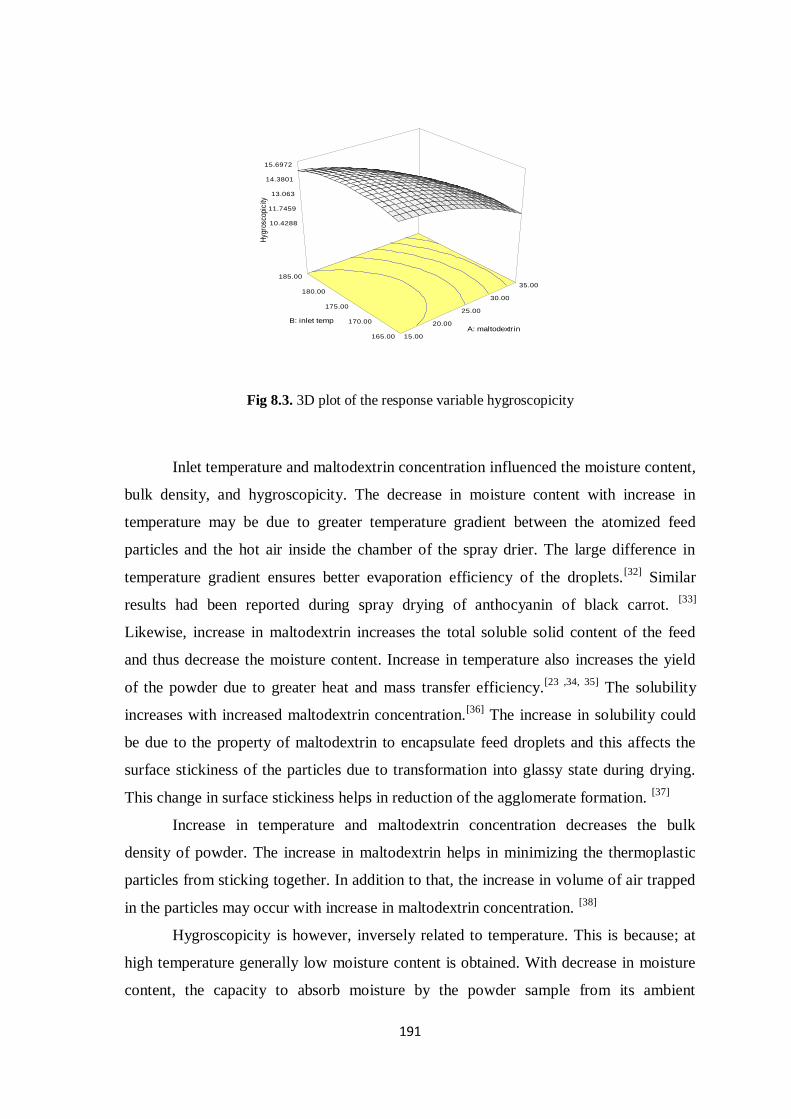
8.3.2.5. Hygroscopicity
From the response plot (Fig.8.3), increase in maltodextrin decreased the
hygroscopicity of the powder while no effect of inlet temperature was observed. The
regression equation obtained for hygroscopicity is given below.
Y = +14.55-1.91X1-0.32X2-0.76X12-0.80X2
2-0.32X1X2 Eq. 8.19
65.9858
72.0509
78.1159
84.181
90.246
S
olu
bility
15.00
20.00
25.00
30.00
35.00
165.00
170.00
175.00
180.00
185.00
A: maltodextrin
B: inlet temp
0.277954
0.318114
0.358275
0.398435
0.438596
B
ulk
D
ensity
15.00
20.00
25.00
30.00
35.00
165.00
170.00
175.00
180.00
185.00
A: maltodextrin
B: inlet temp
191
Fig 8.3. 3D plot of the response variable hygroscopicity
Inlet temperature and maltodextrin concentration influenced the moisture content,
bulk density, and hygroscopicity. The decrease in moisture content with increase in
temperature may be due to greater temperature gradient between the atomized feed
particles and the hot air inside the chamber of the spray drier. The large difference in
temperature gradient ensures better evaporation efficiency of the droplets.[32]
Similar
results had been reported during spray drying of anthocyanin of black carrot. [33]
Likewise, increase in maltodextrin increases the total soluble solid content of the feed
and thus decrease the moisture content. Increase in temperature also increases the yield
of the powder due to greater heat and mass transfer efficiency.[23 ,34, 35]
The solubility
increases with increased maltodextrin concentration.[36]
The increase in solubility could
be due to the property of maltodextrin to encapsulate feed droplets and this affects the
surface stickiness of the particles due to transformation into glassy state during drying.
This change in surface stickiness helps in reduction of the agglomerate formation. [37]
Increase in temperature and maltodextrin concentration decreases the bulk
density of powder. The increase in maltodextrin helps in minimizing the thermoplastic
particles from sticking together. In addition to that, the increase in volume of air trapped
in the particles may occur with increase in maltodextrin concentration. [38]
Hygroscopicity is however, inversely related to temperature. This is because; at
high temperature generally low moisture content is obtained. With decrease in moisture
content, the capacity to absorb moisture by the powder sample from its ambient
10.4288
11.7459
13.063
14.3801
15.6972
Hyg
rosc
opic
ity
15.00
20.00
25.00
30.00
35.00
165.00
170.00
175.00
180.00
185.00
A: maltodextrin
B: inlet temp
192
surrounding increases. This is due to greater water concentration gradient between the
powder and the surrounding. Thus, this phenomenon leads to an increase in
hygroscopicity. [34, 39]
However, increase in maltodextrin decreases the hygroscopicity of
the powder. [40]
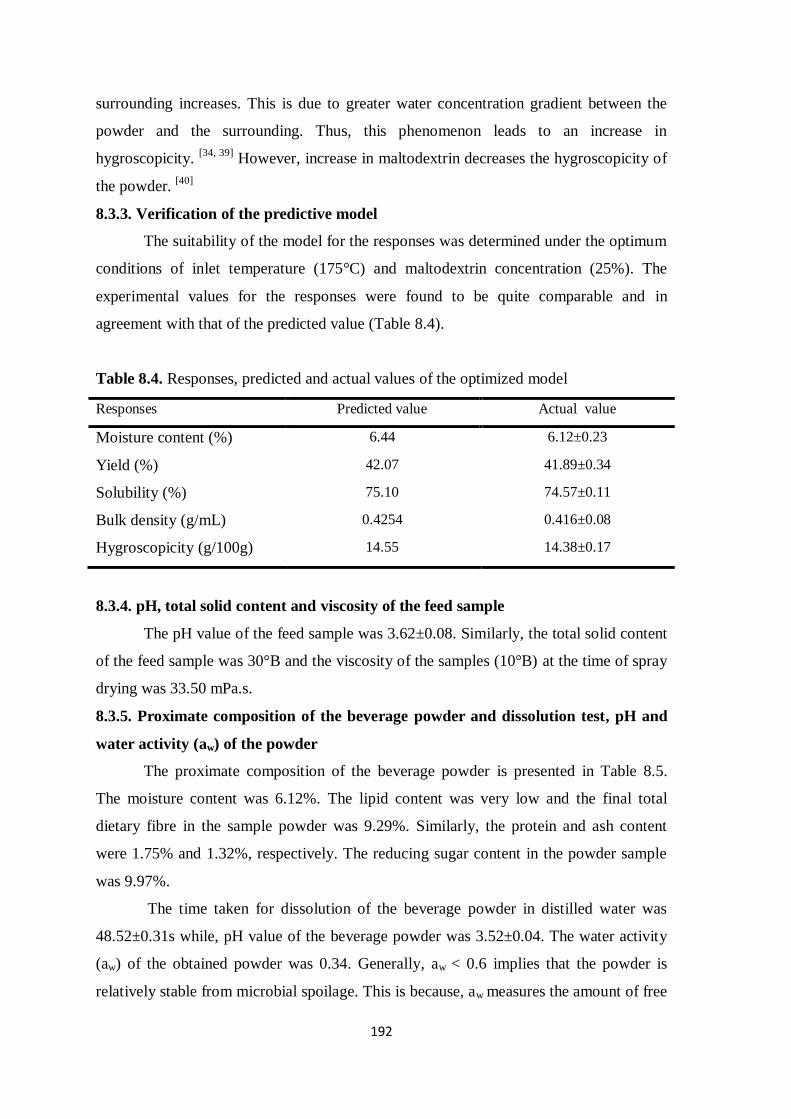
8.3.3. Verification of the predictive model
The suitability of the model for the responses was determined under the optimum
conditions of inlet temperature (175°C) and maltodextrin concentration (25%). The
experimental values for the responses were found to be quite comparable and in
agreement with that of the predicted value (Table 8.4).
Table 8.4. Responses, predicted and actual values of the optimized model
Responses Predicted value Actual value
Moisture content (%) 6.44 6.12±0.23
Yield (%) 42.07 41.89±0.34
Solubility (%) 75.10 74.57±0.11
Bulk density (g/mL) 0.4254 0.416±0.08
Hygroscopicity (g/100g) 14.55 14.38±0.17
8.3.4. pH, total solid content and viscosity of the feed sample
The pH value of the feed sample was 3.62±0.08. Similarly, the total solid content
of the feed sample was 30°B and the viscosity of the samples (10°B) at the time of spray
drying was 33.50 mPa.s.
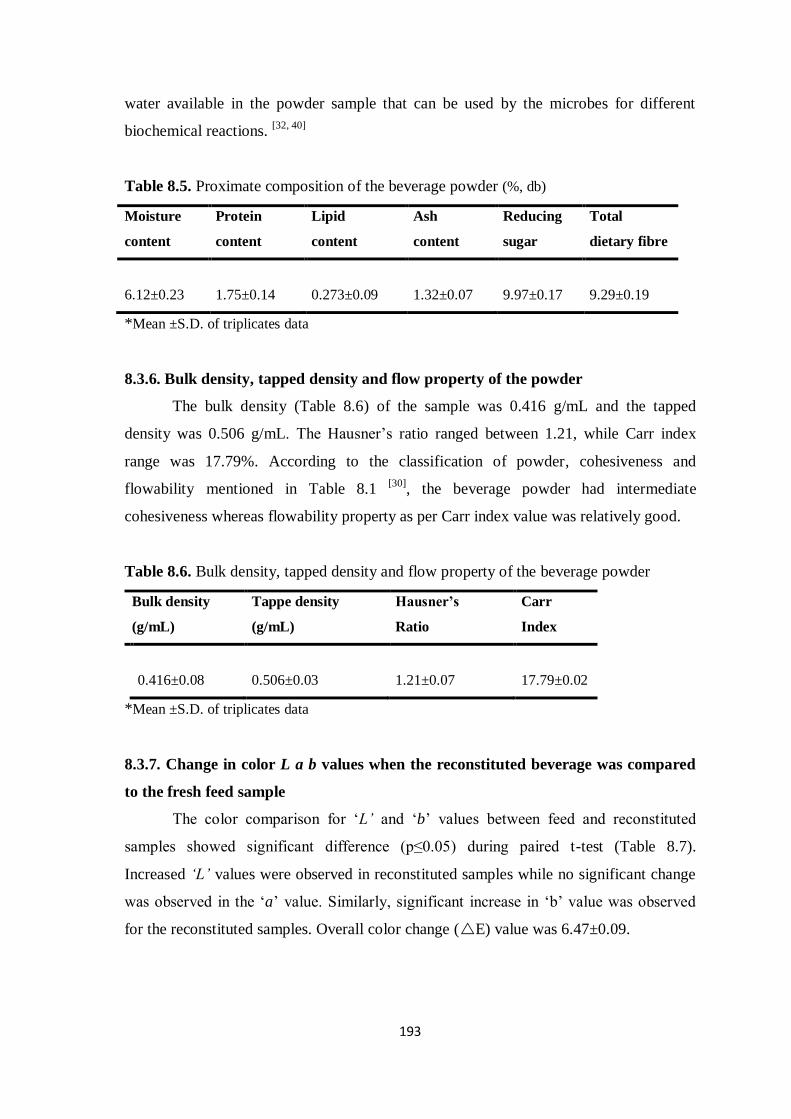
8.3.5. Proximate composition of the beverage powder and dissolution test, pH and
water activity (aw) of the powder
The proximate composition of the beverage powder is presented in Table 8.5.
The moisture content was 6.12%. The lipid content was very low and the final total
dietary fibre in the sample powder was 9.29%. Similarly, the protein and ash content
were 1.75% and 1.32%, respectively. The reducing sugar content in the powder sample
was 9.97%.
The time taken for dissolution of the beverage powder in distilled water was
48.52±0.31s while, pH value of the beverage powder was 3.52±0.04. The water activity
(aw) of the obtained powder was 0.34. Generally, aw < 0.6 implies that the powder is
relatively stable from microbial spoilage. This is because, aw measures the amount of free
193
water available in the powder sample that can be used by the microbes for different
biochemical reactions. [32, 40]
Table 8.5. Proximate composition of the beverage powder (%, db)
Moisture
content
Protein
content
Lipid
content
Ash
content
Reducing
sugar
Total
dietary fibre
6.12±0.23
1.75±0.14
0.273±0.09
1.32±0.07
9.97±0.17
9.29±0.19
*Mean ±S.D. of triplicates data
8.3.6. Bulk density, tapped density and flow property of the powder
The bulk density (Table 8.6) of the sample was 0.416 g/mL and the tapped
density was 0.506 g/mL. The Hausner‘s ratio ranged between 1.21, while Carr index
range was 17.79%. According to the classification of powder, cohesiveness and
flowability mentioned in Table 8.1 [30]
, the beverage powder had intermediate
cohesiveness whereas flowability property as per Carr index value was relatively good.
Table 8.6. Bulk density, tapped density and flow property of the beverage powder
Bulk density
(g/mL)
Tappe density
(g/mL)
Hausner’s
Ratio
Carr
Index
0.416±0.08
0.506±0.03
1.21±0.07
17.79±0.02
*Mean ±S.D. of triplicates data
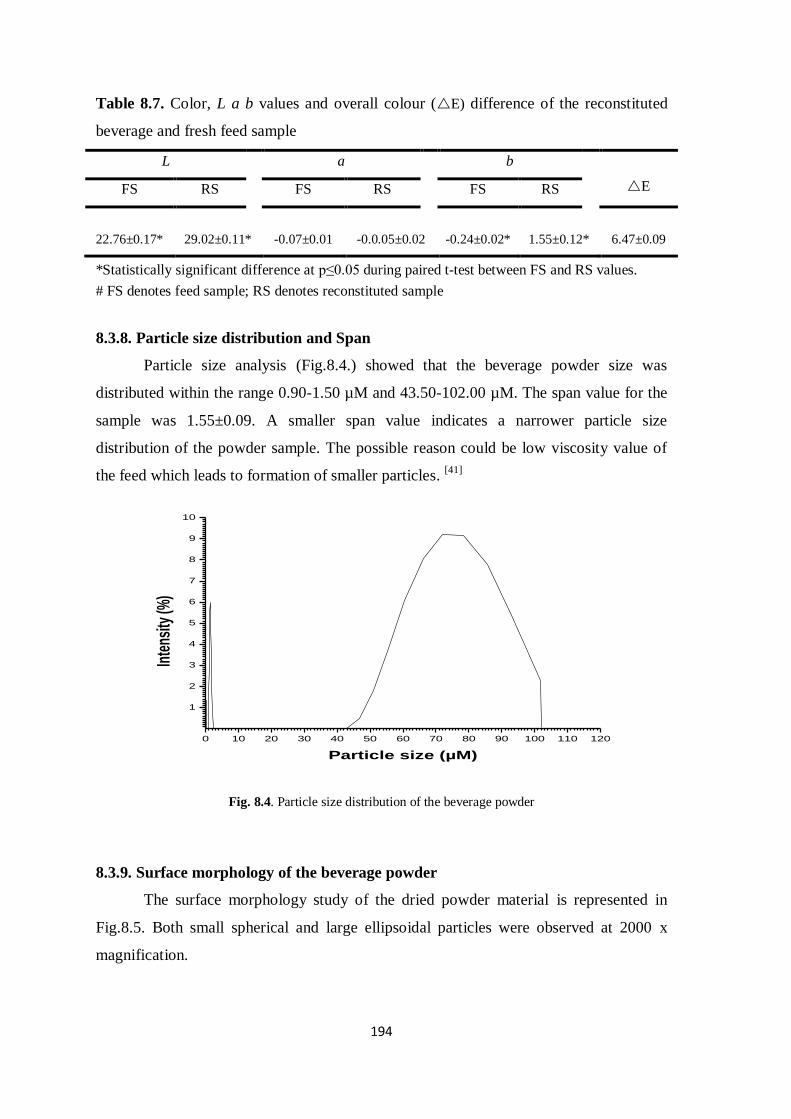
8.3.7. Change in color L a b values when the reconstituted beverage was compared
to the fresh feed sample
The color comparison for ‗L’ and ‗b‘ values between feed and reconstituted
samples showed significant difference (p≤0.05) during paired t-test (Table 8.7).
Increased ‘L’ values were observed in reconstituted samples while no significant change
was observed in the ‗a‘ value. Similarly, significant increase in ‗b‘ value was observed
for the reconstituted samples. Overall color change (E) value was 6.47±0.09.
194
Table 8.7. Color, L a b values and overall colour (E) difference of the reconstituted
beverage and fresh feed sample
L a b
E FS RS FS RS FS RS
22.76±0.17*
29.02±0.11*
-0.07±0.01
-0.0.05±0.02
-0.24±0.02*
1.55±0.12*
6.47±0.09
*Statistically significant difference at p≤0.05 during paired t-test between FS and RS values.
# FS denotes feed sample; RS denotes reconstituted sample
8.3.8. Particle size distribution and Span
Particle size analysis (Fig.8.4.) showed that the beverage powder size was
distributed within the range 0.90-1.50 µM and 43.50-102.00 µM. The span value for the
sample was 1.55±0.09. A smaller span value indicates a narrower particle size
distribution of the powder sample. The possible reason could be low viscosity value of
the feed which leads to formation of smaller particles. [41]
0 10 20 30 40 50 60 70 80 90 100 110 120
1
2
3
4
5
6
7
8
9
10
Inte
nsity
(%)
Particle size (µM)
Fig. 8.4. Particle size distribution of the beverage powder
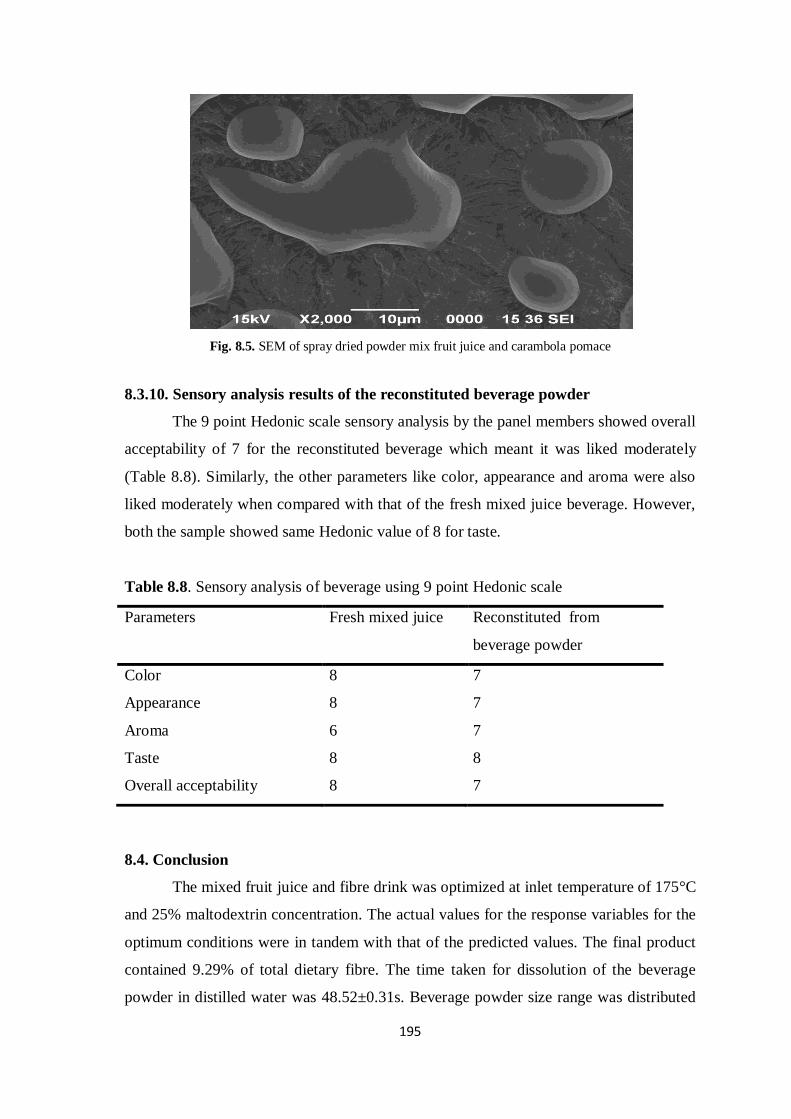
8.3.9. Surface morphology of the beverage powder
The surface morphology study of the dried powder material is represented in
Fig.8.5. Both small spherical and large ellipsoidal particles were observed at 2000 x
magnification.
195
Fig. 8.5. SEM of spray dried powder mix fruit juice and carambola pomace
8.3.10. Sensory analysis results of the reconstituted beverage powder
The 9 point Hedonic scale sensory analysis by the panel members showed overall
acceptability of 7 for the reconstituted beverage which meant it was liked moderately
(Table 8.8). Similarly, the other parameters like color, appearance and aroma were also
liked moderately when compared with that of the fresh mixed juice beverage. However,
both the sample showed same Hedonic value of 8 for taste.
Table 8.8. Sensory analysis of beverage using 9 point Hedonic scale
Parameters Fresh mixed juice Reconstituted from
beverage powder
Color 8 7
Appearance 8 7
Aroma 6 7
Taste 8 8
Overall acceptability 8 7
8.4. Conclusion
The mixed fruit juice and fibre drink was optimized at inlet temperature of 175°C
and 25% maltodextrin concentration. The actual values for the response variables for the
optimum conditions were in tandem with that of the predicted values. The final product
contained 9.29% of total dietary fibre. The time taken for dissolution of the beverage
powder in distilled water was 48.52±0.31s. Beverage powder size range was distributed
196
in the range of 0.90-1.50µM and 43.50-102.00 µM. The Span value for the sample was
1.55±0.09. The beverage powder had intermediate cohesiveness whereas flowability
property as per Carr index value was relatively good. The color comparison for ‗L’ and
‗b‘ values between feed and reconstituted samples showed significant difference
(p≤0.05) during paired t-test. Overall color change (E) value was 6.47±0. The sensory
analysis by 9 point hedonic scale showed overall acceptability of the product at 7 (liked
moderately). It can be concluded that, the proposed optimization model of CCRD
through RSM could be used for the development of a functional mix fruit beverage
powder fortified with fibre rich fraction of carambola pomace.
Bibliography
1. Scott, K.P. et al. Dietary fibre and the gut microbiota, Nutr. Bull. 33, 201–211,
2008.
2. Elia, M. & Cummings, J. H. Physiological aspects of energy metabolism and
gastrointestinal effects of carbohydrates, Euro. J Clin. Nutr. 61(1), 40–74, 2007.
3. Slavin, J. & Green, H. Dietary fibre and satiety, Nutr. Bull. 32, S32–S42, 2007.
4. L. Prosky. What is fibre? Current controversies, Trends Food Sci. Tech. 10, 271–
275, 2000.
5. Figuerola, F. et al. Fibre concentrates from apple pomace and citrus peel as
potential fibre sources for food enrichment, Food Chem. 91, 395-401, 2005.
6. Schieber, A. et al. By-products of plant food processing as a source of functional
compounds-recent developments, Trends Food Sci. Technol. 12, 401–413, 2001.
7. Ajila, C. M. et al. Bioactive compounds and antioxidant potential of mango peel
extract, Food Chem. 105, 982-988, 2007.
8. Saura-Calixto, F. Antioxidant dietary fibre: a new functional ingredient, Nutr. 34,
12, 2010
9. Saura-Calixto, F. Proanthocyanidin metabolites associated with dietary fibre
from in vitro colonic fermentation and proanthocyanidin metabolites in human
plasma, Mol. Nutr. Food Res. 54, 1–8, 2010.
197
10. Goni, I. et al. Towards an updated methodology for measurement of dietary fibre,
including associated polyphenols, in food and beverages, Food Res. Int. 42, 840–
846, 2009.
11. Chau, C.F. et al. Characterization and physiochemical properties of some
potential fibres derived from Averrhoa carambola, Mol. Nutr. Food Res. 48(1),
43-46, 2004.
12. Chau, C.F. et al. Insoluble fibre-rich fractions derived from Averrhoa carambola:
hypoglycemic effects determined by in vitro methods, LWT - Food Sci. Technol.
37(3), 331-335, 2004.
13. Chau, C.F. et al. Effects of a novel pomace fibre on lipid and cholesterol
metabolism in the hamster. Nutr. Res. 24(5), 337-345, 2004
14. Jacob. K. et al. Investigation into the total phenols and antioxidant activity during
storage of fruit smoothies, J. Food Sci. Eng. 2, 72-79, 2012.
15. Sun-Waterhouse, D. et al. Insights into smoothies with high levels of fibre and
polyphenols: factors influencing chemical, rheological and sensory properties,
World Acad. Sci. Eng. Technol. 4, 05-23, 2010.
16. Sun-Waterhouse, D. The development of fruit-based functional foods targeting
the health and wellness market: a review, Int. J. Food Sci. Techno. 46, 899–920,
2011.
17. Soukoulis, C. et al. Enrichment of ice cream with dietary fibre: Effects on
rheological properties, ice crystallisation and glass transition phenomena, Food
Chem. 115(2), 665–671, 2009.
18. Dikeman, C. L. & Fahey, G. C. Viscosity as related to dietary fibre: A review,
Crit. Rev. Food Sci. Nutr. 46(8), 649–663, 2006.
19. Dello, S. M. et al. Influence of dietary fibre addition on sensory and rheological
properties of yogurt, Int. Dairy J. 14(3), 263–268, 2004.
20. AOAC. Official Methods of Analysis, Association of Official Analytical
Chemists, 16th ed., Washington, DC, 1995.
21. Chau, C. F. et al. Different micronization methods significantly improve the
functionality of carrot insoluble fibre, Food Chem. 100, 1402-1408, 2007.
22. Goula, A. M. & Adamopoulos, K. G. Effect of maltodextrin addition during
spray drying of tomato pulp in dehumidified air: I. Powder properties, Drying
Tech. 26, 726-737, 2008.
198
23. Cai, Y.Z. & Corke, H. Production and properties of spray dried amaranthus
betacyanim pigments, J. Food Sci. 65(6), 1248-1252, 2000.
24. Somogyi, M. Notes on sugar determination, J. Biol. Chem. 195(1), 19–23, 1952.
25. Hutchings, J. B. Food colour and appearance, Blackie Academic & Professional,
Glasgow, 1994.
26. Santipanichwong, R. & Suphantharika, M. Carotenoids as colorants in reduced
fat mayonnaise containing spent brewer‘s yeast β-glucan as a fat replacer, Food
Hydrocoll. 21, 565-574, 2007.
27. Hausner, H. H. Friction conditions in a mass of metal powder, Int. J. Powder
Metall. 3, 7-13, 1967.
28. Carr, R. L. Evaluating flow properties of solids, Chem. Eng., 72, 163-168, 1965.
29. Jinapong, N. et al. Production of instant soymilk powders by ultrafiltration, spray
drying and fluidized bed agglomeration, J. Food Eng. 84, 194-205, 2008.
30. Joglekar, A.M. & May, A.T. Product excellence through design of experiments,
Cereal Food World. 32, 857-868, 1987.
31. Myers, R.H. & Montgomery, D.C. Response Surface Methdology, 2nd
edition,
John Wiley and Sons Inc., New York, 2002.
32. Quek, S.Y. et al. The physicochemical properties of spray-dried watermelon
powders, Chem. Eng. Proc. Process Intensificat. 46(5), 386-392, 2007.
33. Ersus, S. & Yurdagel, U. Microencapsulation of anthocyanin pigments of black
carrot (Daucus carota L.) by spray drier, J. Food Eng. 80(3), 805-812, 2007.
34. Influence of process conditions on the physicochemical properties of açai
(Euterpe oleraceae Mart.) powder produced by spray drying, J. Food Eng. 88(3),
411-418, 2008.
35. Singh, S. & and Dixit, D. A review on spray drying: Emerging technology in
food industry, Int. J. Applied Eng. Technol. 4 (1), 1-8, 2014.
36. Grabowski, J. A. et al. Spray drying of amylase hydrolyzed sweet potato puree
and physicochemical properties of powder, J. Food Sci. 71(5), E209-E217, 2006.
37. Adhikari, B. et al. Characterization of the surface stickiness of fructose-
maltodextrin solutions during drying, Drying Technol. 21(1), 17–20, 2003.
38. Femenia, A. et al. Physical and sensory properties of model foods supplemented
with cauliflower fibre, J. Food Sci. 62(4), 635–639, 1997.
199
39. Goula, A.M. & Adamopoulos, G. A new technique for spray drying orange juice
concentrate, Innov. Food Sci. Emerg. Technol. 11, 342–351, 2010.
40. Phoungchandang, S. & Sertwasana, A. Spray-drying of ginger juice and
physicochemical properties of ginger powders, Sci. Asia. 36, 40–45, 2010.
41. Behera, A.L. et al. Enhancemnet of stability: A pharmaceutical overview, Der
Pharmacia Lett. 2, 310-318, 2010.