chapter 8 exercise 8 - biology leaving cert.shevlinbiology.webs.com/chapter 8 solutions.pdf ·...
TRANSCRIPT

Active Maths 2 (Strands 1–5): Ch 8 Solutions
Chapter 8 Exercise 8.1
1
Q. 1. (i) Discrete numerical
(ii) Nominal categorial
(iii) Continuous
(iv) Sample
Q. 2. (i) Time - it is faster to survey a sample than the entire population.
Economy - it is cheaper to survey a sample than the entire population.
(ii) Bias - workers involved in the production/sale of overalls will have a keener interest in supporting the sale of overalls (compared to workers not involved in production/sale of overalls).
(iii) Biased - not a random sample. The first 30 workers may be a particular group (hence not representing the whole work force).
Q. 3. (i) Time → it will be faster.
Economy → it will be cheaper
Practicality → it would not be practical/possible to survey all its customers.
(ii) Only representing a single route; hence not a sample which represents the entire population.
Only on a Monday → Monday might be slower, the people taking the survey may be more critical than on a Friday, for example.
(iii) Only represents customers that listen to the radio.
Only represents customers who are willing to speak on radio.
Only represents customers who can afford to call in.
Only represents customers with strong opinions (generally speaking).
(iv) Take a sample from each of its bus routes, each day of the week and at both peak and off peak times.
Q. 4. (i) Because the selection of each student is not influenced by anything. (All names selected without looking.)
(ii) Because every possible sample within the population cannot occur, e.g. we cannot get a sample with all 8 being girls.
(iii) Put all the names (girls & boys) into a single hat and select 8.
Q. 5. (i) 7, 30, 39, 5, 37, 26, 4, 13, 48, 19
(ii) Make a list containing all 80 students alphabetically or otherwise. (It doesn’t matter as we’ll take a random sample from this list.)
Number the students from 1 to 80.
Select the first 12 numbers in the table that are between 1 and 80.
Use the students that have been designated to the 12 numbers selected.
Q. 6. (i) Registered voters who have phones and are in the telephone directory.
(ii) People may not answer.
People may not be willing to take part in the survey.
(iii) It is unlikely people will have an accurate answer. Instead it is likely to be estimated and hence subject to bias and error.
Q. 7. (i) Male First Year students that play PlayStation.
(ii) Only boys, only First Years.
(iii) Take a sample from all the students in the school.

2 Active Maths 2 (Strands 1–5): Ch 8 Solutions
Q. 8. No. Sample is biased. It only considers the subjects who took the initiative to respond and hence is likely to only represent the subjects with strong opinions on the matter.
Q. 9. (i) A sample that only contains the boys that play football, from a population containing the entire school.
(ii) A sample where all subjects have an equal probability of being selected, and every possible sample within the population has an equal possibility of being selected.
(iii) A sample which is selected by first separating the boys and girls and then selecting an equal number of each from a hat.
Q. 10. (i) Mean = 68 + 75 + 78 + 82 + 87 _______________________ 5 = 78 (seconds)
(ii) Sample 1: 68 + 75 + 78 _____________ 3 = 73.66 (seconds)
Sample 2: 68 + 75 + 82 _____________ 3 = 75 (seconds)
Sample 3: 68 + 75 + 87 _____________ 3 = 76.66 (seconds)
Sample 4: 68 + 78 + 82 _____________ 3 = 76 (seconds)
Sample 5: 68 + 78 + 87 _____________ 3 = 77.66 (seconds)
Sample 6: 68 + 82 + 87 _____________ 3 = 79 (seconds)
Sample 7: 75 + 78 + 82 _____________ 3 = 78.33 (seconds)
Sample 8: 75 + 78 + 87 _____________ 3 = 80 (seconds)
Sample 9: 75 + 82 + 87 _____________ 3 = 81.33 (seconds)
Sample 10: 78 + 82 + 87 _____________ 3 = 82.33 (seconds)
(iii) 73.66 + 75 + 76.66 + 76 + 77.66 + 79 + 78.33 + 80 + 81.33 + 82.33 ________________________________________________________________ 10
= 780 ____ 10 = 78 (seconds)
(same as the mean estimated time for the 5 girls)
(iv) There are 3 samples whose mean is within 1 second of the true mean (samples 5, 6, 7).
⇒ Probability = 3 ___ 10 = 0.3
(v) One sample with range (sample 3)
⇒ Probability = 1 ___ 10 = 0.1
Q. 11. (i) Method 1 Method 2 Method 3
Number of bulbs tested 350 200 292
Number of defects 3 2 4
Proportion of defects 3 ____ 350 = 0.86% 2 ____ 200 = 1% 4 ____ 292 = 1.37%
(ii) Method 3 → Method 3 suggests 1.37% bulbs have defects which is greater than the company’s claim of < 1%.
3Active Maths 2 (Strands 1–5): Ch 8 Solutions
(iii) Method 2 → It is the only method that gives every possible sample of the population the same chance of being selected.
(iv) Method 3 → The sample only considers a very minute part of the whole population and hence is biased so it cannot be considered as a true representative of the population.
(v) Method 2 → Simple random testing ensures every bulb has an equal opportunity and every possible sample can be selected. Hence if there was a cluster of defected bulbs produced at the same time method 2 could still select these proportionately where as method 1 would not.
(vi) Increase the size of the sample taken.
(vii) takes more time
costs more money
wastes produce (bulbs)
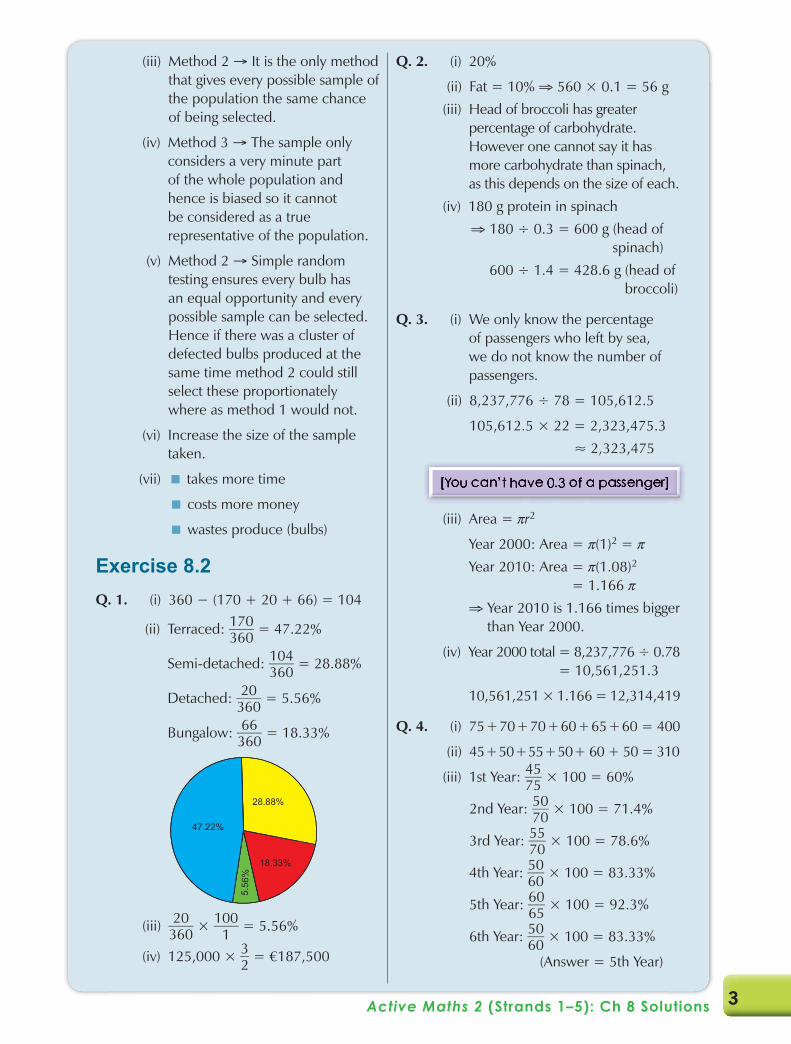
Exercise 8.2Q. 1. (i) 360 − (170 + 20 + 66) = 104
(ii) Terraced: 170 ____ 360 = 47.22%
Semi-detached: 104 ____ 360 = 28.88%
Detached: 20 ____ 360 = 5.56%
Bungalow: 66 ____ 360 = 18.33%
47.22%
28.88%
18.33%
5.56
%
(iii) 20 ____ 360 × 100 ____ 1 = 5.56%
(iv) 125,000 × 3 __ 2 = €187,500
Q. 2. (i) 20%
(ii) Fat = 10% ⇒ 560 × 0.1 = 56 g(iii) Head of broccoli has greater
percentage of carbohydrate. However one cannot say it has more carbohydrate than spinach, as this depends on the size of each.
(iv) 180 g protein in spinach⇒ 180 ÷ 0.3 = 600 g (head of
spinach)600 ÷ 1.4 = 428.6 g (head of
broccoli)
Q. 3. (i) We only know the percentage of passengers who left by sea, we do not know the number of passengers.
(ii) 8,237,776 ÷ 78 = 105,612.5
105,612.5 × 22 = 2,323,475.3≈ 2,323,475
(iii) Area = pr2
Year 2000: Area = p(1)2 = pYear 2010: Area = p(1.08)2
= 1.166 p⇒ Year 2010 is 1.166 times bigger
than Year 2000.
(iv) Year 2000 total = 8,237,776 ÷ 0.78 = 10,561,251.3
10,561,251 × 1.166 = 12,314,419
Q. 4. (i) 75 + 70 + 70 + 60 + 65 + 60 = 400
(ii) 45 + 50 + 55 + 50 + 60 + 50 = 310
(iii) 1st Year: 45 ___ 75 × 100 = 60%
2nd Year: 50 ___ 70 × 100 = 71.4%
3rd Year: 55 ___ 70 × 100 = 78.6%
4th Year: 50 ___ 60 × 100 = 83.33%
5th Year: 60 ___ 65 × 100 = 92.3%
6th Year: 50 ___ 60 × 100 = 83.33%
(Answer = 5th Year)

4 Active Maths 2 (Strands 1–5): Ch 8 Solutions
(iv) From 1st Year to 5th Year the percentage of students with smartphones is constantly rising.
(v) 1st Year: 45 ___ 75 × 100 = 60%
⇒ 60% chance of owning a smartphone
Third Year: 55 ___ 70 × 100 = 78.6%
⇒ 78.6% chance at owning a smartphone.
78.6% > 60%
⇒ Third Year is more likely to own a smartphone.
Q. 5. (i) January
(ii) June
(iii) April 1854 to March 1855 (One Year)
(iv) May
(v) 360 ÷ 12 = 30° (360 degrees, 12 segments)
(vi) Jan 1855
Radius length = 43 mm
Area = p(43)2
= 1,849p mm2
March 1855
Radius length = 28 mm
Area = p(28)2
= 784p
Jan 1855: 1,879p mm2;Mar 1855: 784p mm2
(vii) 1,849p : 784p
1, 849 : 784
Q. 6. (i) Continuous numerical data
(ii)
Age
Freq
uenc
y
0 20 40 60 80 100
(iii) The most frequent age bracket is 20–40
There is a tail to the right; hence we have a positively skewed/skewed right distribution.
(iv) 12 ___ 40 × 100 ____ 1 = 30%
Q. 7. (i) 18
Hint: Must be greater than 100 beats ⇒ don’t include 100.
(ii) 1
(iii) People had higher pulse rates after the run.

5Active Maths 2 (Strands 1–5): Ch 8 Solutions
Q. 8. (i) Class 1 Stem Class 2
3, 2 3 4
5, 5 3 5, 6, 8
3, 2, 0 4 0, 1, 1, 2, 2, 3, 3
8, 8, 7, 6, 6, 5 4 5, 5, 6, 6, 7, 7, 8, 9
4, 3, 3, 2, 0, 0 5 0, 0, 1
9, 7, 6, 5, 5, 5 5 6, 7, 8
3, 1, 0 6 4
Key: 3|6| = 63 sit ups Key: |6|4 = 64 sit ups
(ii) Class 1 has a tail to the left meaning that its’ skewed left.
Class 2 has a more symetrical distribution.
(iii) Class 1 has a greater mean (49.0 vs 45.92), a greater median and a greater mode compared with Class 2.
Q. 9. Men Stem Women
14 8, 9
9 15 0, 1, 2, 3, 4, 5, 5, 7, 7, 8, 8
8, 6, 1, 0 16 1, 2, 3, 5, 6, 7, 9
9, 9, 8, 6, 5, 5, 4, 4, 1, 0, 0 17 1, 4, 8
6, 5, 4, 3, 3, 1 18
1 19
Key: 9|15| = 159 cm Key: |17|1 = 171 cm
Q. 10. (i) Male Stem Female
8 11
12
13 5
8, 7 14 9
8, 8, 4, 1 15 0, 1, 4, 6, 8
7, 4 16 0
0 17 1, 1
Key: 4|16| = 164 cm Key: 16|0| = 160 cm
(ii) Male Stem Female
3, 2 2 0, 1, 2, 2, 3
5, 4, 4, 4, 4, 4 2 4, 4
2
1 3 1, 1, 2
Key: 1|3| = 31 cm Key: |3|1 = 31 cm

6 Active Maths 2 (Strands 1–5): Ch 8 Solutions
Q. 11. (i) Aoife Stem Séamus9 11
9, 6 12 0, 0
5, 2 13 1, 3, 5
8, 3, 2 14 3, 7, 8
9, 8, 7, 2, 0 15 1, 2, 6, 8
8, 8, 8, 6, 2 16 4, 5, 5, 8, 9
9, 8, 6, 5, 2, 2 17 2, 2, 3, 3, 7, 8
6, 5, 0 18 1, 3, 4, 5, 6, 7, 8
5, 3 19
8 20
Key: 8|20| = 208 units Key: |18|1 = 181 units
(ii) 208
(iii) 120
(iv) Aoife’s sales have a symmetrical distribution whereas Seamus has a distribution that is skewed left.
Q. 12. (i) Speed km/h 32–40 40–48 48–56 56–64 64–72 72–80
Frequency 2 3 7 5 9 4
(ii)
Speed (km/h)
Freq
uenc
y
2
4
6
8
10
32 40 48 56 64 72 80
(iii) There is a tail to the left so data is skewed left.
Exercise 8.3 Q. 1. (i)
3
20
35
10
55
4 5Number of weddings
Freq
uenc
y
6 7
70

7Active Maths 2 (Strands 1–5): Ch 8 Solutions
(ii) 20 + 64 + 50 + 12 + 6 = 152
(iii) Mean: (3 × 20) + (4 × 64) + (5 × 50) + (6 × 12) + (7 × 6)
______________________________________________ 20 + 64 + 50 + 12 + 6
= 60 + 256 + 250 + 72 + 42 _________________________ 152 = 680 ____ 152
= 4.47
Median = 152 weeks ⇒ use 152 ____ 2 = 76th week in order
→ this falls within the area of 4 weddings per week ⇒ Answer = 4
(iv) 10,000 × 680 = €680,000
(v) No extremes ⇒ use mean
Weekly revenue = 4.47 × 10,000 = €44,700
Q. 2. (i) Mean = 5.4 + 1.1 + 0.42 + 0.73 + 0.48 + 1.1 __________________________________ 6 = 1.54
Median = 0.73 + 1.1 __________ 2 = 0.915
(ii) Median as it is not affected by the outlier (5.4).
(iii) 5.4 → because we would expect the highest levels of lead to be recorded during the days just after the attack.
Q. 3. (i) Mean = 98 + 92 + 95 + 87 + 96 + 90 + 65 + 92 + 95 + 93 + 98 + 94 _________________________________________________________ 12
= 1,095
______ 12 = 91.25 mins (91 mins 15 seconds)
Median = 93 + 94 ________ 2 = 93.5 mins (93 mins 30 sec)
(ii) 13
(iii) Mean → the mean suggests the geyser erupts more often than the medians’ suggestion. Hence it better promotes the attraction.
(iv) Median → there is an outlier in the data (65). By using the median, the outlier doesn’t effect the measure of centre.
Q. 4. (i) (1 × 3) + (3 × 5) + (5 × 6) + (7 × 4) + (9 × 2)
__________________________________________ 3 + 5 + 6 + 4 + 2 = 94 ___ 20 = 4.7 mins
(ii) Both calls in the 8–10 group are greater than 6.2 mins.
All calls in the 6–8 group could be greater than 6.2 mins.
2 + 4 = 6
Q. 5. (i) (32.5 × 10) + (37.5 × 6) + (42.5 × 22) + (47.5 × 29) + (52.5 × 7)
___________________________________________________________ 10 + 6 + 22 + 29 + 7
= 325 + 225 + 935 + 1377.5 + 367.5 _________________________________ 74
= 3,230
______ 74
= 43.65 mins
(ii) 10 + 6 = 16

8 Active Maths 2 (Strands 1–5): Ch 8 Solutions
Q. 6. (i) (2.5 × 12) + (7.5 × 8) + (12.5 × 8) + (17.5 × 2)
___________________________________________ 12 + 8 + 8 + 2
= 30 + 60 + 100 + 35 ___________________ 30 = 225 ____ 30 = 7.5
(ii) 8 + 2 ______________ 12 + 8 + 8 + 2 = 10 ___ 30 = 33 1 _ 3 %
Q. 7. (i) 24 + 16 + 41 + 15 = 96
(ii) (10 × 24) + (25 × 16) + (40 × 41) + (65 × 15)
__________________________________________ 24 + 16 + 41 + 15
= 240 + 400 + 1640 + 975 _______________________ 96 = 3,255
______ 96 = 33.9 Years
(iii) 24 ___ 96 × 100 = 25%
(iv) 16 + 41 = 57
Q. 8. (i)
140 145
50
150
250
350
150 155 160 165 170 175 180
(ii) Distribution is symetrical (roughly)
(iii) (142.5 × 9) + (147.5 × 65) + (152.5 × 177) + (157.5 × 325) + (162.5 × 253) + (167.5 × 133) + (172.5 × 31) + (177.5 × 7)
= 1,282.5 + 9,587.5 + 26,992.5 + 51,187.5 + 41,112.5 + 22,277.5 + 5,347.5 + 1,242.5
= 159,030
Mean = 159,030
________ 1,000 = 159.03 cm
(iv) As there are 1,000 women, median height occurs where the 500th and 501st women are. (Ordered from smallest to tallest.)
These are within the 155–160 cm interval
(v) The distribution is (roughly) symmetric and does not contain any outliers
⇒ Use the mean = 159.03 cm
Q. 9. (i) Comaneci Gym: There is a tail to the left, hence distribution is skewed left. Hato Gym: There is a tail to the right, hence distribution is skewed right.
(ii) As both distributions are not symmetrical use median.
Comaneci: 7.2 + 7.3 _________ 2 = 7.25
Hato: 5.4 + 5.6 _________ 2 = 5.5
(iii) Comaneci (with a score of 8.7)

9Active Maths 2 (Strands 1–5): Ch 8 Solutions
Q. 10. (i) 72 + 15 + 30 + 63 = 180
Hay: 72 ____ 180 = 40% 0.4 × 360 = 144°
Veg: 15 ____ 180 = 8.33% 15 ____ 180 × 360 = 30°
Wheat: 30 ____ 180 = 16.67% 30 ____ 180 × 360 = 60°
Grazing: 63 ____ 180 = 35% 63 ____ 180 × 360 = 126°
(ii) Categorical data hence use mode
⇒ Mode = Hay
(iii) 30 ____ 180 × 100 ____ 1 = 16.67%
Exercise 8.4
Q. 1. (i) Stem Leaf
0 2
1 5, 7
2 3
3 3
4 2
5 8
(ii) Stem Leaf
0 5
1 2
2 5, 6
3 8
4
5 4, 4
6 3
(iii) Stem Leaf
0 1, 2, 5
1 7
2 8
3 6
4 4
Hay
Veg
Wheat
Grazing
Median = 23
Q1 = 15
Q3 = 42
Q3 − Q1 = 42 − 15 = 27
Median = 26 + 38 ________ 2 = 32
Q1 = 12 + 25 ________ 2 = 18.5
Q3 = 54 + 54 ________ 2 = 54
Q3 − Q1 = 54 − 18.5 = 35.5
Median = 17
Q1 = 2
Q3 = 36
Q3 − Q1 = 36 − 2 = 34

10 Active Maths 2 (Strands 1–5): Ch 8 Solutions
(iv) Stem Leaf
0
0 3, 3
0 4, 4, 5, 5
0 6, 6, 7, 7
0 8, 8
Median = 5 + 6 ______ 2 = 5.5
Q1 = 4 + 4 ______ 2 = 4
Q3 = 7 + 7 ______ 2 = 7
Q3 − Q1 = 7 − 4 = 3
Q. 2. (a) (i) 1 __ 2 (45) = 22.5, round up to 23
Median = 23rd number = 38
(ii) 1 __ 4 (45) = 11.25, round up to 12
Q1 = 30
(iii) 3 __ 4 (45) = 33.75, round up to 34
Q3 = 49
(iv) Q3 − Q1 = 49 − 30 = 19
(b) 25
Q. 3. (i) 1 __ 4 (15) = 3.75 Round to 4
Q1 = 3.2
(ii) 3 __ 4 (15) = 11.25 Round to 12
Q3 = 4.7
(iii) 4.7 − 3.2 = 1.5
(iv) Range = 6.8 − 2.1 = 4.7
Q. 4. (i) Q1 is the median of the 1st half of data
= 16 + 19 ________ 2 = 17.5
(ii) Q3 = 47 + 48 ________ 2 = 47.5
(iii) Q3 − Q1 = 47.5 − 17.5 = 30
(iv) 62 − 11 = 51
Q. 5. (a) (i) Girls: 48 + 54 ________ 2 = 51
Boys: 55 + 57 ________ 2 = 56
(ii) Girls: 8th number = 42
Boys: 8th number = 39
(iii) Girls: 23rd number = 79
Boys: 23rd number = 69
(iv) Girls: Q3 − Q1 = 79 − 42 = 37
Boys: Q3 − Q1 = 69 − 39 = 30
(b) Measure of spread is best found by using the interquartile range, as its’ not affected by outliers. The interquartile range is equal to 37 for the girls and 30 for the boys. Hence the girls have a greater spread of results than the boys.
Median is the best measure of centre for both boys and girls as neither distribution is symmetrical. The measure of centre for the girls = 51 which is 5 marks lower than the boys’ measure of centre at 56.
Q. 6. (i) Male Stem Female15 0, 0, 3, 315 6, 8
3, 0 16 0, 0, 4, 0, 0, 4, 05, 7 16 8, 5, 7, 8, 9, 8, 7
0, 1, 0, 2, 4, 4, 2, 3, 2, 1 17 4, 4, 0, 1, 3, 3, 1, 39, 5, 8, 8, 8, 6, 8 17 6, 7,
4, 2, 4, 0, 0 1818
0, 0 1919
0 209 20
Key : 1|17| = 171 cm Key |16|0 = 160 cm

11Active Maths 2 (Strands 1–5): Ch 8 Solutions
(ii) Male Stem Female
15 0, 0, 3, 3
15 6, 8
3, 0 16 0, 0, 0, 0, 0, 4, 4
7, 5 16 5, 7, 7, 8, 8, 8, 9
4, 4, 3, 2, 2, 2, 1, 1, 0, 0 17 0, 1, 1, 3, 3, 3, 4, 4
9, 8, 8, 8, 8, 6, 5 17 6, 7
4, 4, 2, 0, 0 18
18
0, 0 19
19
0 20
9 20
Key 1|17| = 171 cm Key |16|0 = 160 cm
(iii) Females = 167 + 167 __________ 2 = 167
Males = 175 + 176 __________ 2 = 175.5
(iv) Females: Upper Q3 = 171
Lower Q1 = 160
Males: Upper Q3 = 180
Lower Q1 = 171
(v) Females: Q3 − Q1 = 171 − 160 = 11
Males: Q3 − Q1 = 180 − 171 = 9
The interquartile range tells us about the spread of each set of data, hence that the females have a greater spread of data (11) vs the males (9)
(vi) 7 males are taller than 180 cm.
7 ___ 30 = 0.233 probability
(vii) Female must be between 160 and 171 (inclusive).⇒ 17 possible females
17 ___ 30 = 0.566
Q. 7. (i) 48
(ii) 87 − 43 = 44
(iii) 75 − 59 = 16
(iv) No (unlikely)As the mean and median are almost equal.

12 Active Maths 2 (Strands 1–5): Ch 8 Solutions
Q. 8. (i) 78
(ii) 250 − 6 = 244
(iii) 55 − 18.5 = 36.5
(iv) Yes, the considerable difference between mean and median suggests the presence of outliers in the data.
(v) Farm sizes in the region vary from as little as 6 acres to as much as 250 acres, hence range = 244.
These are extremes, however and excluding these outliers the average size farm can be taken as 34 acres (median).
A more suitable representation of the spread of farm sizes within the region is given by the interquartile range, which suggests a spread of 36.5 acres within the data.
Q. 9. (i) Put the names of all golf courses in the south east into a hat. Take 45 names from the hat without looking.
(ii) 6,760 − 5,150 = 1,610 (yards)
(iii) Between 5,580 and 6,120 yards
(iv) 6,120 − 5,580 = 540
(v) No. The mean and the median are relatively close (almost equal.)
(vi) Golf courses in the region vary in size between 6,760 and 5,150 yards, giving a range of 1,610 yards.
The mean size golf course is 5,870 yards, which is a true representation of the centre of the data.
A more suitable representation of the spread of course sizes can be found by the interquartile range, which shows that the central 50% of courses have a spread of just 540 yards.
Q. 10. (i) Country Mean Median Range IQR
Australia 14.71 14.45 2.4 1.4
Chile 13.95 13.95 3.7 2.1
Egypt 14.69 14.30 3.1 0.6
Korea 13.64 13.65 3.6 3.1
(ii) Korea - has the lowest mean and lowest median
(iii) Australia - has greatest mean and median
(iv) Korea - Even though its range is slightly smaller than Chile’s, its interquartile range is very high, showing it has high variability even within its central 50%. (i.e. even after omitting outliers)
(v) It is true that Australia has the smallest range. However, Egypt has a considerably smaller interquartile range, hence after the omission of outliers one would consider Egypt to have the least dispersion.
(vi) I suggest using the median as the measure of centre for all four countries as this eliminates the effect of outliers on the data.
Use the interquartile range as the measure of spread as this will also eliminate the effect of outliers.

13Active Maths 2 (Strands 1–5): Ch 8 Solutions
Revision ExercisesQ. 1. (i) Bias - towards people who have
an interest in computers.
(ii) Only have one potato in sample -too small.
(iii) Bias - towards wealthier people and hence more expensive cars.
(iv) Not a random sample.
Q. 2. (i) Best method for ensuring interviewee understands questions.
(ii) Good for explaining questions to interviewee
Almost the entire adult population can be used to select sample.
Q. 3. Advantage: not expensiveDisadvantage: people who do reply are likely the ones with the strongest opinions and this may lead to a biased sample.
Q. 4. (i) Its use of the word “every”
- It suggests 80% of the entire teenage population prefers JLS Music, however it only took a sample of ten teenagers - far too small to be considered a true representation of the teenage population.
(ii) The graph is not to scale. If the frequency on the y axis went from 100 all the way down to zero, it would not seem like such a biased result.
(iii) Biased - an online survey’s respondents will be more familar with (and biased towards) the internet than the population as a whole (hence internet shopping).
(iv) The increase in the size of the bin image is not proportional to the scale of the increase in refuse.
Q. 5. (i) Student Stem Teacher
2
9, 8, 7 2 9
4, 4, 1 3
9, 9, 7, 7, 5, 5 3 5, 6, 8
3, 2 4 1, 2, 2, 3, 3, 4
4 5, 5, 5
0 5
5 6
6 1
6
Key 5|3| = 35 Key |2|9 = 29
(ii) Put students’ names in one hat and teachers’ names in another. Pick 15 names out of each without looking.
(iii) Its’ now a biased sample as the selection of teachers doesn’t represent the whole population. It is likely that the teachers who refuse will be slowest texters, hence the sample will not truly represent the teacher population.

14 Active Maths 2 (Strands 1–5): Ch 8 Solutions
Q. 6. (i) Men Stem Women5 0 7
1 0, 28, 5 2 2, 58, 4 38, 6 4
6 5 06 17
0 89
1011
2 1213 0
3 140 15
Key 2|12| = 122 Key |13|0 = 130
(ii) Men take a greater interest in hardware/DIY than women (in general).
A lot of male-dominated occupations (plumber, carpenter) would require them to go to hardware shops.
(iii) Julie concluded that men spend more than women in shops.
(iv) Hardware shop – Male-orientated shop, doesn’t give a true representation of the population.
Saturday morning – only considering customers who stop on a Saturday morning.
“Local” – she is only taking a sample from her locality. This cannot represent all males and females.
(v) She should carry out the survey every day of the week, in an area where both males and females shop and do it in a number of different towns (Preferably selected randomly.)
Q. 7. (i) Mean = Sum of all 20 pulse rates
_____________________ 20 = 1,456
______ 20 = 72.8
(ii) Sample 1 68 96 88 72 60
Sample 2 56 84 88 64 64
Sample 3 60 76 60 72 88
Sample 4 88 64 72 60 88
Sample 5 84 60 64 96 72
Sample 6 72 60 84 64 88
Sample 7 64 68 56 60 84
Sample 8 96 60 72 88 60
Sample 9 60 88 64 56 72
Sample 10 64 84 68 60 76

15Active Maths 2 (Strands 1–5): Ch 8 Solutions
(iii) Sample Mean
Sample 1 76.8
Sample 2 71.2
Sample 3 71.2
Sample 4 74.4
Sample 5 75.2
Sample 6 73.6
Sample 7 66.4
Sample 8 75.2
Sample 9 68.0
Sample 10 70.4
(iv) Sample 1: 76.8 − 72.8 = 4.0
Sample 2: 71.2 – 72.8 = 1.6
Sample 3: 71.2 – 72.8 = 1.6
Sample 4: 74.4 – 72.8 = 1.6
Sample 5: 75.2 – 72.8 = 2.4
Sample 6: 73.6 – 72.8 = 0.8
Sample 7: 66.4 – 72.8 = 6.4
Sample 8: 75.2 – 72.8 = 2.4
Sample 9: 68.0 – 72.8 = 4.8
Sample 10: 70.4 – 72.8 = 2.4
(v) Only one sample (sample 6) is within one beat of the population mean.
Q. 8. (i)
Freq
uenc
y
Mon
369
12151821242730
Tue Wed FriThur SunSat
(ii) Saturday
(iii) Tuesday
Q. 9. (i) No. times 0 1 2 3 4 5
Frequency 2 3 5 8 10 2
(ii) 2 ___ 30 = 6.7% = 24° 8 ___ 30 = 26.7% = 96°
3 ___ 30 = 10% = 36° 10 ___ 30 = 33.3% = 120°
5 ___ 30 = 16.7% = 60° 2 ___ 30 = 6.7% = 24°
2 times16.7%
4 times33.3%
1tim
e
0tim
es5
times
3 times26.7%

16 Active Maths 2 (Strands 1–5): Ch 8 Solutions
(iii)
No. of times per week0 1 2 3 4 5
Q. 10. (i) 40
(ii) 11 cm
(iii) 52 cm
(iv) 52 − 11 = 41 cm
(v) Location 2 has a greater median (42 vs 29) and greater mean (39.15 vs 28.00) compared with location 1.
Q. 11. (i)
Table 1 Stem Table 244 6, 6, 8, 8, 9
3, 2, 2 5 0, 0, 1, 1, 2, 49, 8, 8, 7, 6, 5, 5 5 5, 5, 6, 8
4, 2, 0 67, 6 6
Key: 2|5| = 5.2 Key: |4|6 = 4.6
(ii) Table 1 is male as it contains the larger wrist data
(iii) 5.8 cm
(iv) 6
(v) 5.2 cm
(vi) 9
Q. 12. (i)
Male Stem Female5
6 5
4, 4, 4, 4, 0, 0, 0 6 0, 4, 4
8 6 8, 8, 8, 8, 8
2, 2, 2 7 2, 2, 2, 2, 2
6, 6 7 6, 6
4, 4 8 0, 0, 0
8, 8, 8 8 8
6 9 6
9
Key: 8|6| = 68 Key: |9|6 = 96

17Active Maths 2 (Strands 1–5): Ch 8 Solutions
(ii) No, males have a larger concentration of higher pulse rates.
(iii) Put in the names of the people in her street in two hats, one for the men and one for the women. Then pick 20 names from each without looking.
(iv) 96 − 56 = 40
(v) 96 − 60 = 36
(vi) All subjects are over 20, she should use entire population.
Subjects are only from her street, cannot be a true representation of the population.
(vii) Q1: 1 __ 4 (20) = 5 ⇒ between 5th + 6th
Q1 = 64 + 64 ________ 2 = 64
Q3 = 84 + 84 ________ 2 = 84
Q3 − Q1 = 84 − 64 = 20
Q. 13. (i) Height 145.5–155.5 155.5–165.5 165.5–175.5 175.5–185.5
Number 4 11 4 0
2
4
6
8
10
12
145.5 155.5 165.5 175.5 185.5
(ii) Height 145.5–155.5 155.5–165.5 165.5–175.5 175.5–185.5
Number 1 2 10 5
2
4
6
8
10
12
145.5 155.5 165.5 175.5 185.5Height
Freq
uenc
y

18 Active Maths 2 (Strands 1–5): Ch 8 Solutions
(iii) Both males and females have a single interval that contains more than half of the data set (155.5–165.5 for females, 165.5–175.5 for males).
The distribution shapes are different: the females have a symmetrical distribution whereas the males’ is stewed left.
(iv) They are only considering the heights of current customers of air travel.
The data came from a single source. Instead they need to be getting data on a worldwide scale.
Q. 14. (i) Fr
eque
ncy
Weight50 60 70 80 90 100 110 120 130 140
2468
10121416182022
(ii) (55 × 6) + (65 × 6) + (75 × 14) + (85 × 9) + (95 × 21) + (105 × 21) + (115 × 19) + (125 × 3) + (135 × 1)
___________________________________________________________________ 6 + 6 + 14 + 9 + 21 + 21 + 19 + 3 + 1
= 330 + 390 + 1,050 + 765 + 1,995 + 2,205 + 2,185 + 375 + 135
_________________________________________ 100
= 9,430
____ 100 = 94.3 kg
(iii) Range = 130 − 50 = 80 kg
Q. 15. (i)
0
100150200250300350400450500550
50
30 60 12090 150 180Time
Freq
uenc
y
(ii) (15 × 100) + (45 × 170) + (75 × 500) + (105 × 110) + (135 × 85) + (165 × 35)
________________________________________________________________________ 100 + 170 + 500 + 110 + 85 + 35
= 1,500 + 7,650 + 37,500 + 11,550 + 11,475 + 5,775
_______________________________________________ 1,000
= 75,450
_______ 1,000 = 75.45 mins
(iii) The mean time of 75.45 mins is in the 60–90 min interval as would be expected. The mean, median and mode all fall within this category.

19Active Maths 2 (Strands 1–5): Ch 8 Solutions
(iv) All interviewers are members of a fitness club, so the sample doesn’t contain people who don’t exercise and hence the sample cannot be a true representation of the population.
The sample only contains people from Dublin, obvious bias.
(v) Are you male or female?
What age are you?
How often do you exercise per day?
How often do you walk/cycle to work?
Does your occupation require physical effort?
Q. 16. (i) Stem Reaction11 6, 92 12 6, 6, 7, 7, 8, 8, 8, 9, 93 0, 1, 33 6, 6, 74 1, 3, 44 6, 7, 7, 9
Key |1|6 = 0.16 seconds
(ii) Mean = 8.24 ____ 25
= 0.3296 seconds
(iii) Reaction time 0.15–0.20 0.20–0.25 0.25–0.30 0.30–0.35 0.35–0.40 0.40–0.45 0.45–0.50
Frequency 2 1 9 3 3 3 4
(iv)
0.200.15
4
6
8
10
2
0.25 0.30 0.400.35 0.45 0.50
Time
Freq
uenc
y
(v) (0.175 × 2) + (0.225 × 1) + (0.275 × 9) + (0.325 × 3) + (0.375 × 3) + (0.425 × 3) + (0.475 × 4) _____________________________________________________________________ 2 + 1 + 9 + 3 + 3 + 3 + 4
(0.350) + (0.225) + (2.475) + (0.975) + (1.125) + (1.275) + (1.900) ________________________________________________ 25
= 8.325 _____ 25 = 0.333 seconds
(vi) 0.333 − 0.3296 = 0.0034 seconds
(vii) 0.0034 _______ 0.3296 × 100 = 1.03%

20 Active Maths 2 (Strands 1–5): Ch 8 Solutions
Q. 17. (i) 0
(ii) Boys: 238 ____ 20 = 11.9
Girls: 279 ____ 20 = 13.95
(iii) Boys = 11 + 11 ________ 2 = 11
Girls = 10 + 10 ________ 2 = 10
(iv) Neither distribution is symmetrical so the median should be used.
(v) Boys: Range: 52 − 0 = 52
Q1 = 2
Q3 = 14
Q3 − Q1 = 14 − 2 = 12
Girls: Range: 52 − 0 = 52
Q1 = (3 + 5)
_______ 2 = 4
Q3 = 21
Q3 − Q1 = 21 − 4 = 17
(vi) Range should not be used as both distributions contain outliers. Interquartile range should be used.
(vii) The outliers could be students who had their birthdays on that day (or similar event that generates a large number of texts).
Q. 18. (a) Median is the 4th value
= 250 cm
(b) 188 + 200 + 250 + 30 + 380 + 330 + 302 _______________________________________ 7 = 1,680
______ 7 = 240 cm
(c) 250 = Median = Mean ⇒ Total = 7 × 250 = 1750 cm
1750 − (188 + 200 + 250 + 380 + 330 + 302) = 100 cm
(d) For median to change
D must travel a distance greater than 250 cm.
Q. 19. (a)
(DSL<2 MB/s)
(DSL>2 MB/s)
(Otherfixed)
(Mobile)20
0820
0920
0820
0920
0820
0920
0820
09
10
20
30
40
50

21Active Maths 2 (Strands 1–5): Ch 8 Solutions
(b) There is a decrease in the use of slow fixed line connections (DSL <2 MB and “other fixed line connection”).
The decrease in use of mobile broadband may also follow this trend.
There is an increase in the use of faster broadband connections.
Q. 20. (a) Test 2 Stem Test 1
2 7, 9
9, 9, 8, 8, 7, 3 3 3, 6, 7, 7, 8
9, 9, 9, 8, 6, 4, 4, 4, 0 4 0, 1, 4, 5, 5, 5, 6, 7, 8, 9
9, 8, 2, 2, 1, 1, 0 5 1, 1, 2, 2, 3, 9
2, 1 6 0
Key: 9|3| = 39 Key: |2|7 = 27
(b) 24
(c) Test 1: 60 − 27 = 33
Test 2: 62 − 33 = 29
(d) Yes. The data and the distribution show an obvious increase in sit ups.
(e) Morgan increases sit ups by 3.
Median test 1: 45 increase in median = 2
Median test 2: 47
Morgan’s improved performance is slightly better than the class average.
Q. 21. (a) 9 + 2 + 3 + 4 + 1 + 0 = 19
24 − 19 = 5
(b) 9 (no days absent)
(c) Smallest possible
Number of days None One Two Three Four Five
Number of students 9 7 3 4 1 0
Days absent: (7 × 1) + (3 × 2) + (4 × 3) + (1 × 4) = 7 + 6 + 12 + 4 = 29
Largest possible
Number of days None One Two Three Four Five
Number of students 9 2 3 4 1 5
Days absent: (1 × 2) + (2 × 3) + (3 × 4) + (4 × 1) + (5 × 5)
= 2 + 6 + 12 + 4 + 25 = 49

22 Active Maths 2 (Strands 1–5): Ch 8 Solutions
(d) None: 135 ____ 360 24 × 135 ____ 360 = 9
One: 30 ____ 360 24 × 30 ____ 360 = 2
Two: 75 ____ 360 24 × 75 ____ 360 = 5
Three: 60 ____ 360 24 × 60 ____ 360 = 4
Four: 45 ____ 360 24 × 45 ____ 360 = 3
Five: 15 ____ 360 24 × 15 ____ 360 = 1
Number of days absent None One Two Three Four Five
Number of students 9 2 5 4 3 1
Number of degrees 135° 30° 75° 60° 45° 15°
Mean = 9(0) + 2(1) + 5(2) + 4(3) + 3(4) + 1(5)
__________________________________ 24
= 0 + 2 + 10 + 12 + 12 + 5 ________________________ 24
= 41 ___ 24
= 1.7 days
Q. 22. (a) Number of hours 0–2 2–4 4–6 6–8 8–10 10–12 12–14 14–16 16–18 18–20 20–22
Number of students 11 31 18 13 11 3 1 1 6 1 4
(b) 4–6 hours
(c) (1 × 11) + (3 × 31) + (5 × 18) + (7 × 13) + (9 × 11) + (11 × 3) + (13 × 1) + (15 × 1) + (17 × 6) + (19 × 1) + (21 × 4)
= 11 + 93 + 90 + 91 + 99 + 33 + 13 + 15 + 102 + 19 + 84
= 650
Mean = 650 ____ 100 = 6.5 hours
(d) His sample will contain bias. He only asks First Years, he only asks boys. So this sample cannot be a true representation of the school.
He also carries out the survey on Monday after midterm break, a day when a number of students will be absent. This is another reason why his sample doesn’t represent the whole school.
Q. 23. (a) Stem Brand A112 32 5, 5, 6, 6, 6, 6, 7, 7, 7, 7, 8, 9, 9, 93 0, 0, 1, 1, 1, 2, 2, 2, 3, 43 5, 5, 9

23Active Maths 2 (Strands 1–5): Ch 8 Solutions
Stem Brand B11 72 2, 2, 4, 42 5, 5, 5, 5, 6, 6, 6, 6, 6, 6, 7, 7, 7, 7, 8, 9, 9, 9, 9, 9, 93 0, 03
Stem Brand C1122 5, 5, 5, 6, 6, 6, 6, 6, 7, 7, 7, 8, 8, 8, 8, 8, 8, 8, 8, 8, 9, 9, 93 0, 0, 1, 2, 23
(b) Brand A: Mean = 29.46 [Median = 29]
Range = 39 – 23 = 16
Brand B: Mean = 26.25 [Median = 26]
Range = 30 − 17 = 13
Brand C: Mean = 27.86 [Median = 28]
Range = 32 − 25 = 7
I would buy brand A. It has a greater mean and median than the other two brands and although its range is greater, this is mostly due to it having outliers with large quantities (ie it doesn’t have any outliers with low quantities in the sample).
Q. 24. (a) 93.725 _______ 360 × 100 = 26.03%
3,165 × 0.2603 = 824 schools
(b) No. Their angles are the same/very similar. Hence they would have the same percentage of the total number of schools.
However there are 3,165 primary schools and only 729 post primary schools, so the quantities of primary and post primary in the 200–299 range is completely different.
Q. 25. (a) Male actors Stem Female actors
9 2 5, 6, 8, 9, 9, 9
8, 8, 7, 7, 6, 2 3 0, 2, 3, 3, 3, 3, 5, 5, 6, 9
8, 7, 6, 5, 5, 3, 0 4 2, 5, 5, 9
4, 2, 0, 0 5
0, 0 6 1
Key: 9|2| = 29 Key: |2|5 = 25

24 Active Maths 2 (Strands 1–5): Ch 8 Solutions
(b) Similarity:
More than 60% of winners lie within the 30–50 bracket for both males and females.
Difference:
The female winners are younger than the male winners on average (mean and median).
(c) (i) Male mean = 44.35 True
Female mean = 35.70
(ii) Male median = 45 True
Female median = 33
(d) Male: Q1 = 37.5
Q3 = 50
Q3 − Q1 = 50 − 37.5 = 12.5
Female: Q1 = 29
Q3 = 40.5
Q3 − Q1 = 40.5 − 29 = 11.5