chapter 8 – process capabilitysite.iugaza.edu.ps/aschokry/files/2014/09/sqc-chap-8-pc.pdf · 1...
TRANSCRIPT

1
Islamic University of Gaza - Palestine
Chapter 8 – Process Capability
Islamic University of Gaza - Palestine
1. Investigate and analyze Process Capability (Cp) usingcontrol charts,
2. Understand the differences between Cp and Processpotential,
3. Calculate and interpret Cp ratios,4. Understand the differences between Cp and Cpk,5. Estimate the natural limits of a process from a sample
of data from that process,
Learning Outcomes

2
Islamic University of Gaza - Palestine
Process Capability
• Process capability refers to the ability of a process toproduce products or provide services capable of meetingthe specifications set by the customer or designer.•(Cp is the ability of a process to make a feature within itstolerance.)• Specification limits are set by management in response tocustomers’ expectations• The upper specification limit (USL) is the largest value thatcan be obtained and still conform to customers’expectations• The lower specification limit (LSL) is the smallest valuethat is still conforming
Islamic University of Gaza - Palestine
Process Capability and objectives
• Enables successful manufacturing and sales• Prevents scrap, sorting, rework• Allows jobs to run well• Has major impact on cost and schedule

3
Islamic University of Gaza - Palestine
Process Capability
• Tolerances or specifications– Range of acceptable values established by engineeringdesign or customer requirements
• Process variability– Natural variability in a process
• Process capability– Process variability relative to specification
Islamic University of Gaza - Palestine
Process Capability
Cp represents the precision, but not the accuracy of theprocess in respect to the tolerance window.
High Accuracy but lowprecision
High Precision but lowAccuracy

4
Islamic University of Gaza - Palestine
© Wiley 2010
Process Capability
• Product Specifications– Preset product or service dimensions, tolerances– e.g. bottle fill might be 16 oz. ±.2 oz. (15.8oz.-16.2oz.)– Based on how product is to be used or what the customer expects
• Process Capability – Cp and Cpk– Assessing capability involves evaluating process variability relative
to preset product or service specifications– Cp assumes that the process is centered in the specification range
– Cpk helps to address a possible lack of centering of theprocess
6σLSLUSL
widthprocesswidthionspecificatCp
3σLSLμ,
3σμUSLminCpk
Islamic University of Gaza - Palestine
Process Capability & Tolerance
• When spec. established without knowing whetherprocess capable of meeting it or not serious situationscan result
• Process capable or not – actually looking at processspread, which is called process capability (6)
• Let’s define specification limit as tolerance (T) :T = USL -LSL
• 3 types of situation can result– the value of 6 < USL - LSL– the value of 6 = USL - LSL– the value of 6 > USL - LSL

5
Islamic University of Gaza - Palestine
Process Capability (6) And Tolerance
• Cp - Capability IndexT = U-LCp = 1 Case II 6 = TCp > 1 Case I 6 < TCp < 1 Case III 6 > TUsually Cp = 1.33 (de facto
std.)• Measure of process
performance• Shortfall of Cp - measure
not in terms of nominal ortarget value >>> must useCpk
Formulas
Cp = (T)/6
Cpk =3
Z(min)
Z (USL) = σxUSL
LSLx
Islamic University of Gaza - Palestine
How much of the curve is included in how many standard deviations?
From –1 to +1 is about 68% of the bell curve.From –2 to +2 is about 95%From –3 to +3 is about 99.73%From –4 to +4 is about 99.99%(NOTE: We usually show the bell from –3 to +3 to make it easier to draw, but in concept, the “tails” ofthe bell get very thin and go on forever.)
-6 -5 -4 -3 -2 -1 +1 +2 +3 +4 +5 +60

6
Islamic University of Gaza - Palestine
Islamic University of Gaza - Palestine
One Sigma Shift
-6 -5 -4 -3 -2 -1 0 1 2 3 4 5 6Standard Deviations
LSL USL
Cp = 1.33

7
Islamic University of Gaza - Palestine
Relationship bet. Process Variability and Specification Width
• Possible ranges for Cp
– Cp < 1, as in Fig. (b),process not capable ofproducing withinspecifications
– Cp ≥ 1, as in Fig. (c), processexceeds minimal
specifications
• One shortcoming, Cp assumesthat the process is centered onthe specification range
• Cp = Cpk when process iscentered
Islamic University of Gaza - Palestine
Various Cp Values In Relationship to Specifications
LSL USL
Cp = 2.00
Cp = 1.33Cp = 1.00
Cp = 0.75

8
Islamic University of Gaza - Palestine
Computing the Cp Value at Cocoa Fizz: three bottling machinesare being evaluated for possible use at the Fizz plant. Themachines must be capable of meeting the design specification of15.8-16.2 oz. with at least a process capability index of 1.0 (Cp≥1)
• The table below shows the informationgathered from production runs oneach machine. Are they allacceptable?
• Solution:– Machine A
– Machine B
– Machine C
Machine σ USL-LSL 6σ
A .05 .4 .3
B .1 .4 .6
C .2 .4 1.2
1.336(.05).4
6σLSLUSLCp
67.06(.1).4
6σLSLUSLCp
0.336(.2).4
6σLSLUSLCp
Islamic University of Gaza - Palestine
Process Capability for Variable Control Charts
• Procedure (for S - Chart)1. Take subgroup size 4 for 20 subgroups
2. Calculate sample s.d., s, for each subgroup
3. Calculate avg. sample s.d. s = s/g
4. Calculate est. population s.d.
5. Calculate Process Capability =
4o csˆ
6

9
Islamic University of Gaza - Palestine
Process Capability for Variable Control Charts (cont.)
• R - Chart1. Take subgroup size 4 for 20 subgroups
1. Calculate R for each subgroup
2. Calculate avg. Range, = R/g
3. Calculate
4. Calculate 6
R
o2o dRσ
Islamic University of Gaza - Palestine
A
B
What is Cpk? Itis a measure ofhow wella process iswithin aspecification.
Cpk = A divided by BA = Distance from process mean to closest spec limitB = 3 Standard Deviations (also called “3 Sigma”)
A bigger Cpk is better because fewer units will be beyond spec.(A bigger “A” and a smaller “B” are better.)
SpecificationLimit
SpecificationLimit
Cpk =A divided byB

10
Islamic University of Gaza - Palestine
A
B
An Analogy
Analogy:The bell curve is your automobile.The spec limits are the edges of your garage door.If A = B, you are hitting the frame of your garage door with your car.
SpecificationLimit
SpecificationLimit
Cpk =A divided byB
Islamic University of Gaza - Palestine
A
B
How can we make Cpk (A divided by B) better?
1. Design the product so a wider tolerance is functional (“robust design”)2. Choose equipment and methods for a good safety margin (“process capability”)3. Correctly adjust, but only when needed (“control”)4. Discover ways to narrow the natural variation (“improvement”)
SpecificationLimit
SpecificationLimit
Cpk =A divided byB

11
Islamic University of Gaza - Palestine
A
B
What does a very good Cpk do for us?
This process is producing good units with a good safety margin.
Note that when Cpk = 2, our process mean is 6 standard deviationsfrom the nearest spec, so we say it has “6 Sigma Capability.”
SpecificationLimit
SpecificationLimit
This Cpk isabout 2.Very good!
Mean
Islamic University of Gaza - Palestine
A
B
What does a problem Cpk look like?
This process is in danger of producing some defects.It is too close to the specification limits.
(Remember: the bell curve tail goes further than B……we only show the bell to 3-sigma to make it easier to draw.)
SpecificationLimit
SpecificationLimit
This Cpk is justslightly greaterthan 1. Not good!
12
Islamic University of Gaza - Palestine
A
B
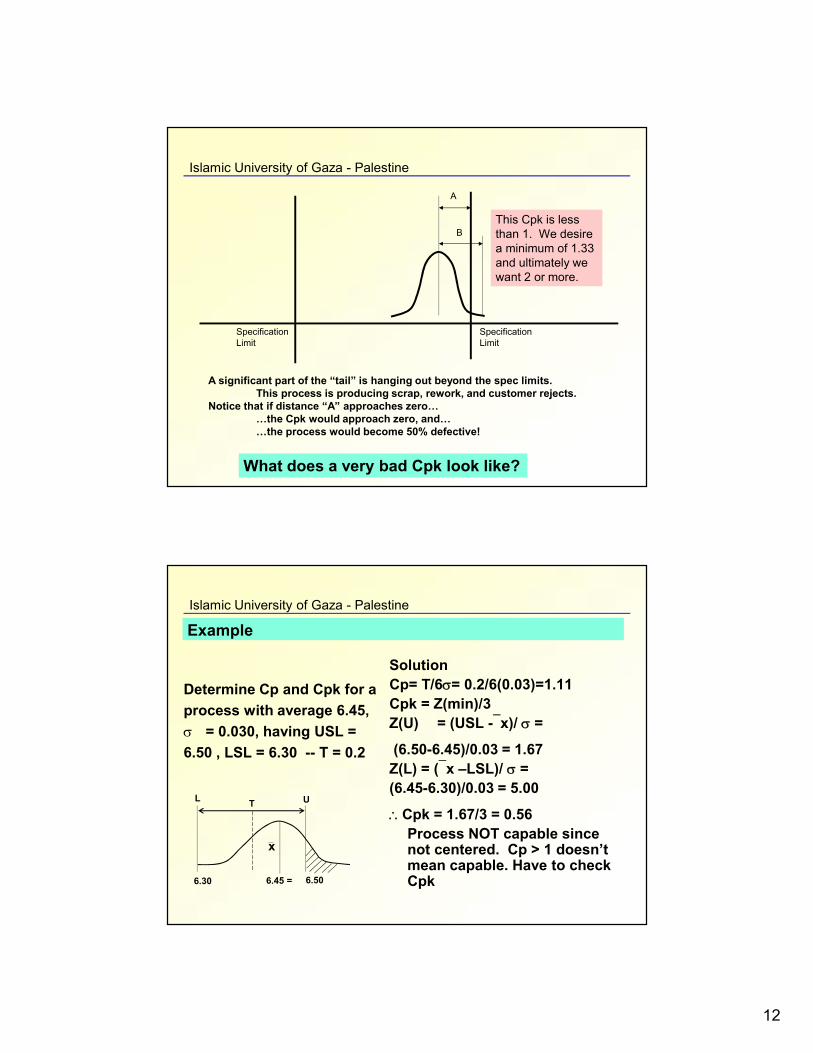
What does a very bad Cpk look like?
A significant part of the “tail” is hanging out beyond the spec limits.This process is producing scrap, rework, and customer rejects.
Notice that if distance “A” approaches zero……the Cpk would approach zero, and……the process would become 50% defective!
SpecificationLimit
SpecificationLimit
This Cpk is lessthan 1. We desirea minimum of 1.33and ultimately wewant 2 or more.
Islamic University of Gaza - Palestine
Example
Determine Cp and Cpk for aprocess with average 6.45, = 0.030, having USL =6.50 , LSL = 6.30 -- T = 0.2
SolutionCp= T/6= 0.2/6(0.03)=1.11Cpk = Z(min)/3Z(U) = (USL -x)/ =
(6.50-6.45)/0.03 = 1.67Z(L) = (x –LSL)/ =(6.45-6.30)/0.03 = 5.00
Cpk = 1.67/3 = 0.56Process NOT capable sincenot centered. Cp > 1 doesn’tmean capable. Have to checkCpk
UL T
6.30 6.506.45 =
x

13
Islamic University of Gaza - Palestine
Computing the Cpk Value at Coc Limon
• Design specifications call for atarget value of 16.0 ±0.2 OZ.(USL = 16.2 & LSL = 15.8)
• Observed process output hasnow shifted and has a µ of 15.9and a σ of 0.1 oz.
• Cpk is less than 1, revealing thatthe process is not capable
(1 L = 33.8 ounce (oz.)
.33.3.1Cpk
3(.1)15.815.9,
3(.1)15.916.2minCpk
Islamic University of Gaza - Palestine
Comments On Cp, Cpk
• Cp does not change when process center (avg.)changes
• Cp = Cpk when process is centred• Cpk Cp always this situation• Cpk = 1.00 de facto standard• Cpk < 1.00 process producing rejects• Cp < 1.00 process not capable• Cpk = 0 process center is at one of spec. limit (U or
L)• Cpk < 0 i.e. – ve value, avg outside of limits

14
Islamic University of Gaza - Palestine
Cpk(Defined as
distance fromprocess mean tothe nearest spec,
divided by 3Standard
Deviations)
"How ManySigma
Capability?"Distance of
Process Mean toSpec Limit in
Standard Deviations
Within Spec(Process Perfectly
Centered,Both Tails
Considered)Good Units Per
Million
PPM of the BellCurve
Out of Spec (Process Perfectly
Centered,Both Tails
Considered)
PPM of the BellCurve
Out of Spec(Process Not
Centered,Only One TailConsidered)
The column ATLEFT equates to 1defective out of how
many total?
PPM of the BellCurve
Out of Specwith Six-Sigma
Philosophyof 1.5 Standard
Deviation Penaltyfor AnticipatedUnfavorable
Process Mean Drift
0 0 0 1,000,000 500,000 2
0.17 0.5 382,925 617,075 308,538 3
0.33 1 682,689 317,311 158,655 6
0.5 1.5 866,386 133,614 66,807 15 500,000
0.67 2 954,500 45,500 22,750 44 308,538
0.83 2.5 987,581 12,419 6,210 161 158,655
1 3 997,300 2,700 1,350 741 66,807
1.17 3.5 999,535 465 233 4,298 22,750
1.33 4 999,937 63 32 31,560 6,210
1.5 4.5 999,993.2 6.8 3.4 294,048 1,350
1.67 5 999,999.4 0.6 0.3 3,483,046 233
1.83 5.5 999,999.96 0.04 0.02 52,530,944 32
2 6 999,999.998 0.002 0.001 1,009,976,693 3.42.17 6.5 999,999.99992 0.00008 0.00004 24,778,276,273 0.3
Cpk, PPM, and "Six Sigma"
Islamic University of Gaza - Palestine
Conclusion:Process Capability:Yes: No:
No:
No:
Yes:
Yes:
potentially capableif re-centered
potentially capableif re-centered
too wide

15
Islamic University of Gaza - Palestine
Examples:
Suppose that a feature tolerance is .750”/.760”, and theprocess average is .759”, and the process standarddeviation is .002”, is the process satisfactory and capable?
Suppose that a diameter tolerance is 8.010” to 8.060”, and theprocess average is 8.041”, and the process standarddeviation is .002”, is the process capable?
Islamic University of Gaza - Palestine
http://elsmar.com/Cp_vs_Cpk.html

16
Islamic University of Gaza - Palestine
End of Chapters (8)