chapter 8. transmission development planopen_jicareport.jica.go.jp/pdf/12303673_02.pdf ·...
TRANSCRIPT

Project on Electricity Sector Master Plan Study in Democratic Socialist Republic of Sri Lanka
Final Report
8-1
Chapter 8. Transmission Development Plan
8.1 Characteristics of Transmission Network Systems in Sri Lanka and the Objects to be investigated
The current network system in Sri Lanka consists of a 200kV transmission network as a trunk system and a 132kV transmission network as a local system. Colombo and the surrounding area are the center of electricity demand, dominating 40% of the demand in the country. In addition, hydro power in the central region and thermal power generated from small thermal power plants in the regions provide electricity to Colombo and the surrounding area. Both the 220kV system and 132kV system are formed in mesh currents. However, there is also a single circuit transmission line in the network. Thus, when a fault occurs in a single circuit line (N-1), there are many cases in which a great impact is caused by the fault. Amid intensely increased demand, and enormous development of electricity generation and deployment of renewables, the development of electricity generation transmission lines and local transmission lines which will supply electricity to consumers in the city of Colombo and other areas are in progress. As mentioned in Chapter 1, the planning of various potential energy generations is under way, including coal as a base-load power plant, LNG as the base-load and the middle power plant, renewable energy, and Pumped Storage Power Plants, which work efficiently in addressing the fluctuations in renewable energy. Various types of electricity generation are planned to be developed in different regions all around the country: renewables in the northern and southern region; coal-fired in the eastern region; Pumped Storage in the central region; and LNG thermal power in Colombo and the surrounding area and the southern region. Each plan is large in degree, and the development is decentralized. Thus, integration of each development plan and strengthening of the transmission network systems are essential.
8.2 Present Network System and Review of the Existing Plan
8.2.1 Present Network System
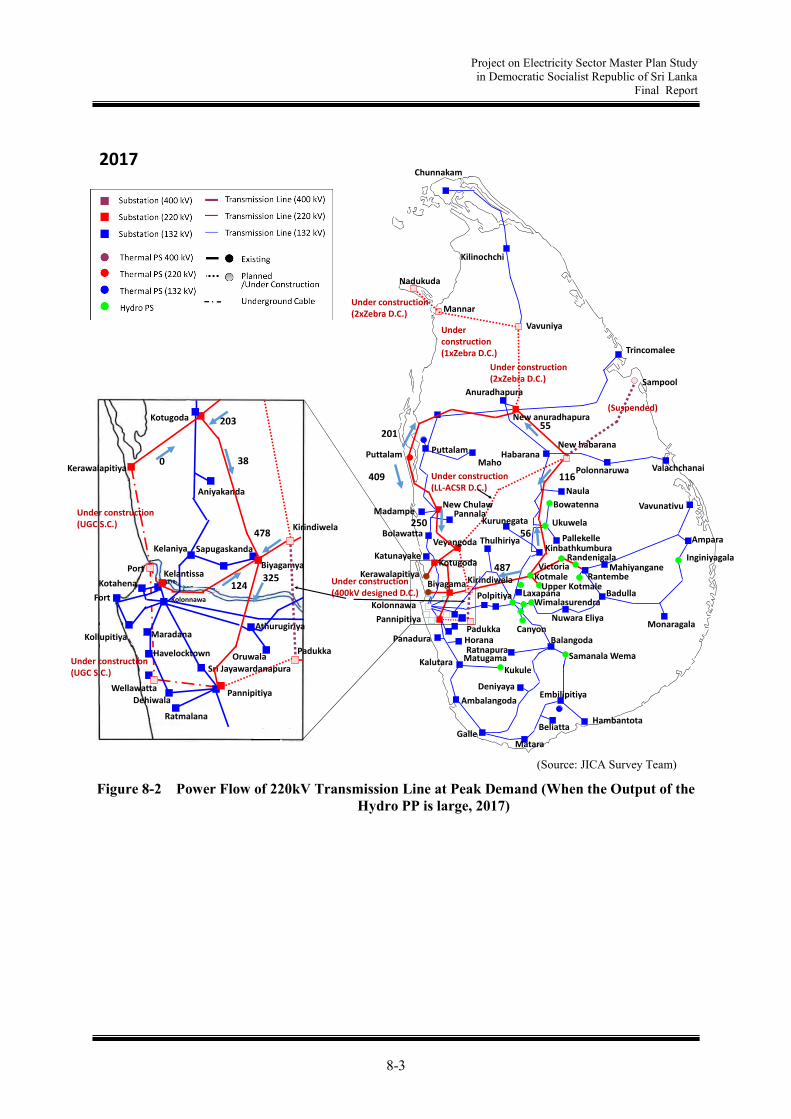
The power transmission system in 2017 and the 220kV power flow at night-time peak demand are shown in Figure 8-1 (when the output of the thermal PP is large) and Figure 8-2 (when the output of the hydro PP is large). The Kerawalapitiya TPP and the Kelanitissa TPP in Colombo city are connected to the 220kV transmission line and are transmitting electricity to the mountain side. When the output of both TPPs is large, power flow of about 550MW flows to the mountain side, and the power flow from Kotmale and other hydro PPs is as low as about 60MW. On the other hand, when the output from the hydro PPs is large, the power flow from Kotmale to Colombo reaches nearly 500MW. The Pannipitiya substation in the south of Colombo City is at the end of the 220kV transmission system, and electric power of about 300MW to 400MW is supplied at peak demand. The Puttalam TPP is located in the north of Colombo, and a total generated power of about 600MW to 900MW is transmitted to the northern region and Colombo via the two routes of 220kV transmission line in both directions.

Project on Electricity Sector Master Plan Study in Democratic Socialist Republic of Sri Lanka
Final Report
8-2
Figure 8-1 Power Flow of 220kV Transmission Line at Peak Demand (When the Output of the
Thermal PP is large, 2017)
(Source: JICA Survey Team)
Chunnakam
Mannar
Vavuniya
Anuradhapura
Habarana
Valachchanai
Bowatenna
Ukuwela
Pallekelle
Randenigala
RantembeKotmale
Badulla
Nuwara Eliya
Ampara
Vavunativu
MahiyanganeInginiyagala
Monaragala
Kukule
Deniyaya
Ambalangoda
GalleBeliatta
Maho
Puttalam
Madampe
Bolawatta
Kinbathkumbura
Horana
Samanala Wema
BalangodaRatnapura
Padukka
Hambantota
Pannipitiya
Thulhiriya
Kolonnawa
BiyagamaKerawalapitiya
Polonnaruwa
Naula
Nadukuda
Trincomalee
New Chulaw
Katunayake
Kalutara
Panadura
Puttalam
Matugama
Kurunegata
Veyangoda
Kotugoda
Canyon
Embilipitiya
Matara
LaxapanaWimalasurendra
Victoria
Kotugoda
Kerawalapitiya
Biyagamya
Kirindiwela
Padukka
PannipitiyaWellawatta
Port
Kollupitiya
Fort
Kotahena
Kolonnawa
Havelocktown
Dehiwala
Ratmalana
Sri Jayawardanapura
Athurugiriya
Oruwala
SapugaskandaKelaniya
Aniyakanda
Maradana
Underconstruction(1xZebra D.C.)
Under construction(2xZebra D.C.)
Under construction(2xZebra D.C.)
Under construction(400kV designed D.C.)
Under construction(UGC S.C.)
Under construction(LL-ACSR D.C.)
Pannala
Under construction(UGC S.C.)
Polpitiya
New habarana
New anuradhapura
2017
280
Kirindiwela
Kilinochchi
347
Upper Kotmale
(Suspended)
Sampool
57
508
328
116
116
402267
301
287
57
Kelantissa
Project on Electricity Sector Master Plan Study in Democratic Socialist Republic of Sri Lanka
Final Report
8-3
Figure 8-2 Power Flow of 220kV Transmission Line at Peak Demand (When the Output of the
Hydro PP is large, 2017)
(Source: JICA Survey Team)
Chunnakam
Mannar
Vavuniya
Anuradhapura
Habarana
Valachchanai
Bowatenna
Ukuwela
Pallekelle
Randenigala
RantembeKotmale
Badulla
Nuwara Eliya
Ampara
Vavunativu
MahiyanganeInginiyagala
Monaragala
Kukule
Deniyaya
Ambalangoda
GalleBeliatta
Maho
Puttalam
Madampe
Bolawatta
Kinbathkumbura
Horana
Samanala Wema
BalangodaRatnapura
Padukka
Hambantota
Pannipitiya
Thulhiriya
Kolonnawa
BiyagamaKerawalapitiya
Polonnaruwa
Naula
Nadukuda
Trincomalee
New Chulaw
Katunayake
Kalutara
Panadura
Puttalam
Matugama
Kurunegata
Veyangoda
Kotugoda
Canyon
Embilipitiya
Matara
LaxapanaWimalasurendra
Victoria
Kotugoda
Kerawalapitiya
Biyagamya
Kirindiwela
Padukka
PannipitiyaWellawatta
Port
Kollupitiya
Fort
Kotahena
Kolonnawa
Havelocktown
Dehiwala
Ratmalana
Sri Jayawardanapura
Athurugiriya
Oruwala
SapugaskandaKelaniya
Aniyakanda
Maradana
Underconstruction(1xZebra D.C.)
Under construction(2xZebra D.C.)
Under construction(2xZebra D.C.)
Under construction(400kV designed D.C.)
Under construction(UGC S.C.)
Under construction(LL-ACSR D.C.)
Pannala
Under construction(UGC S.C.)
Polpitiya
New habarana
New anuradhapura
2017
0
Kirindiwela
Kilinochchi
201
Upper Kotmale
(Suspended)
Sampool
487
409
250
116
55
325124
38
203
478
Kelantissa
56

Project on Electricity Sector Master Plan Study in Democratic Socialist Republic of Sri Lanka
Final Report
8-4
8.2.2 Transmission System under Construction
The 400kV and 220kV transmission lines currently under construction are shown below. 220kV New Habarana-Veyangoda transmission line (2 cct)
Using low-loss electric cables, it is under construction via a Japanese ODA loan. 220kV Nadukuda-Mannar-New Anuradhapura transmission line (2 cct)
It is planned to be constructed with ADB funds in order to transmit the electricity from windpower plants to be constructed at the Nadukuda site.
220kV Kerawalapitiya-Port-Wellawatta underground transmission line (1 cct) A 220kV underground transmission line (1 circuit) between Kerawalapitiya TPP and Port in the city center is being constructed via a Japanese ODA loan.
400kV Kirindiwela – Padukka transmission line (2 cct) It is a 400kV design, but initially it operates at 220kV.
220kV Veyangoda-Kirindiwela transmission line (2 cct) It is in the process of bidding via a Japanese ODA Loan.
220kV Kotmale- New Polpitiya transmission line (2 cct) It is in the process of bidding via a Japanese ODA Loan.
8.2.3 Review of the Existing Plan
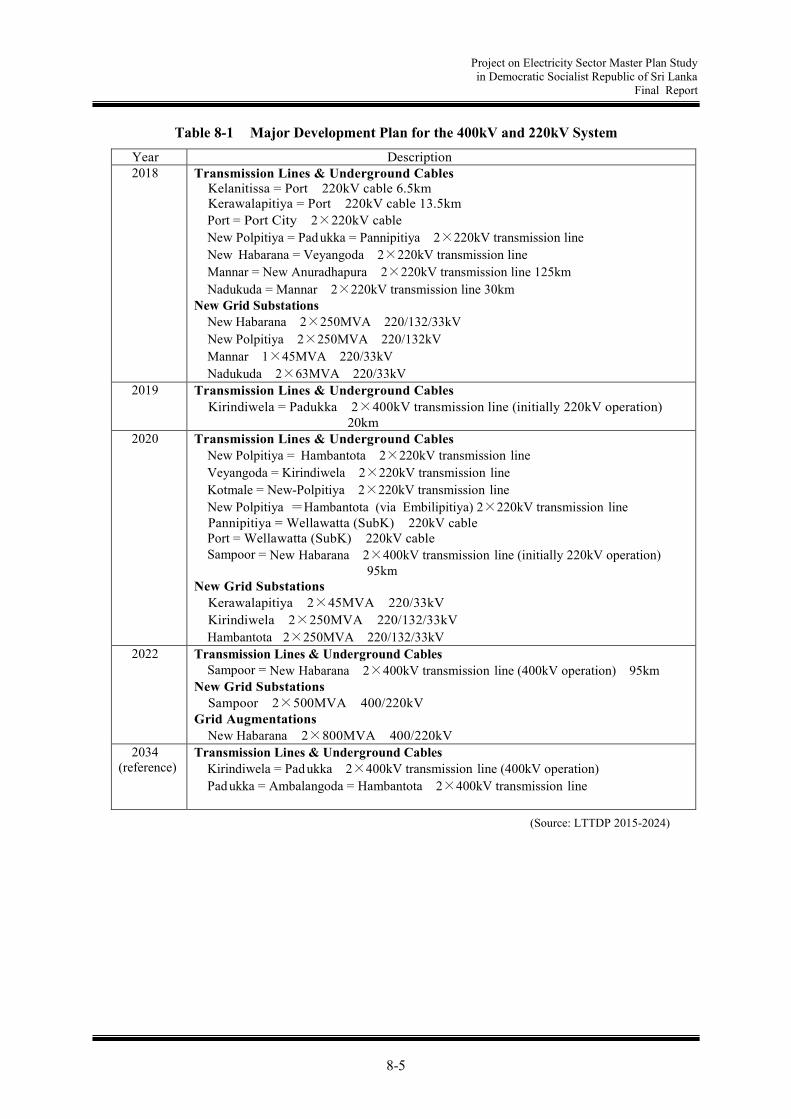
The CEB transmission system comprises a 220kV and 132kV transmission network interconnected with switching stations, grid substations and power stations. Development and strengthening of the transmission and associated grid substation facilities are of paramount importance to meet the growing electricity demand in the country. It is the function of the transmission system to transmit electricity in bulk, generated at power stations, to grid substations to meet the demand of customers. The necessary transmission system reinforcements to maintain satisfactory power system performance are identified by detailed power system analysis carried out during a long-term transmission development planning process. The period of the latest long-term transmission development plan in CEB (LTTDP 2015-2024) is 10 years (2015-2024). This is the updated version of the previous long-term transmission development plan (LTTDP 2013-2022), which was designed based on the enhanced version of the long-term generation expansion plan (LTGEP 2015-2034), the divisional medium-voltage distribution plans, and the demand forecast. Specifically, in the five phases of 2015, 2018, 2020, 2022, 2024, the plan is developed to fulfill each of the network system criteria including voltage, thermal, N-1, security, stability, and short-circuit. As mentioned above, in the five phases, the transmission development plan is proposed and, if this plan is implemented as scheduled, the planning criteria mentioned in 8.2 will be satisfied so that there would not be any great challenges up until 2024 at least. Furthermore, CEB uses PSS/E as a tool for the power network system analysis. The JICA study team also uses PSS/E in investigating the master plan. In the development plan for the long-term transmission network system of CEB, the following is the major transmission system reinforcement plan for 400kV and 220kV, proposed for the year 2018 and beyond.
Project on Electricity Sector Master Plan Study in Democratic Socialist Republic of Sri Lanka
Final Report
8-5
Table 8-1 Major Development Plan for the 400kV and 220kV System Year Description 2018
Transmission Lines & Underground Cables Kelanitissa = Port 220kV cable 6.5km Kerawalapitiya = Port 220kV cable 13.5km Port = Port City 2×220kV cable New Polpitiya = Pad ukka = Pannipitiya 2×220kV transmission line New Habarana = Veyangoda 2×220kV transmission line Mannar = New Anuradhapura 2×220kV transmission line 125km Nadukuda = Mannar 2×220kV transmission line 30km
New Grid Substations New Habarana 2×250MVA 220/132/33kV
New Polpitiya 2×250MVA 220/132kV Mannar 1×45MVA 220/33kV Nadukuda 2×63MVA 220/33kV
2019
Transmission Lines & Underground Cables Kirindiwela = Padukka 2×400kV transmission line (initially 220kV operation) 20km
2020
Transmission Lines & Underground Cables New Polpitiya = Hambantota 2×220kV transmission line Veyangoda = Kirindiwela 2×220kV transmission line Kotmale = New-Polpitiya 2×220kV transmission line New Polpitiya =Hambantota (via Embilipitiya) 2×220kV transmission line Pannipitiya = Wellawatta (SubK) 220kV cable Port = Wellawatta (SubK) 220kV cable Sampoor = New Habarana 2×400kV transmission line (initially 220kV operation) 95km
New Grid Substations Kerawalapitiya 2×45MVA 220/33kV Kirindiwela 2×250MVA 220/132/33kV Hambantota 2×250MVA 220/132/33kV
2022 Transmission Lines & Underground Cables Sampoor = New Habarana 2×400kV transmission line (400kV operation) 95km
New Grid Substations Sampoor 2×500MVA 400/220kV
Grid Augmentations New Habarana 2×800MVA 400/220kV
2034 (reference)
Transmission Lines & Underground Cables Kirindiwela = Pad ukka 2×400kV transmission line (400kV operation) Pad ukka = Ambalangoda = Hambantota 2×400kV transmission line
(Source: LTTDP 2015-2024)

Project on Electricity Sector Master Plan Study in Democratic Socialist Republic of Sri Lanka
Final Report
8-6
8.3 The Future Plan for the Trunk Transmission Network System
In general, the power plant and the consumers are less likely to be located in the same area. Thus, transmission lines become essential as the facilities to transport electricity to all the consumers so that imbalance of power demand and supply can be eliminated. For this, the basic method of the trunk transmission network development plan is to understand the imbalanced volumes of the demand and supply per region and to examine efficient methods of transporting surplus electricity to the regions with an electricity shortage. However, it is vital to draft the future plan for the trunk transmission network considering a sustainability of over 20 years from the perspective of avoiding redundant investment, as it is usually the case that transmission lines are maintained for over 20 years after construction. Thus, the study was conducted considering the year 2040, which is the final year of this master plan.
8.3.1 Criteria of Transmission System Plan
The following are the currently adopted criteria in the CEB plan: Frequency: 50Hz±1% Voltage: 400, 220kV Within ±5%
132kV within ±10% Fault current: 40kA (220kV and more) Overload: No overload at N-1 contingency
Moreover, the following have been confirmed in the consultation with the transmission network systems planning division of CEB:
Rating Capacity: Normal Operation 100% N-1 Contingency 100%
Operational goal for voltage: 0.9-1.1 of standard voltage Fault Current: upgrading to 63kA in case of surpassing ≥220kV transmission system and 40kA Dynamic Stability: Permit generator shedding if dynamic stability cannot be kept
Thus, this study will be based on the above criteria.
8.3.2 Adoption of 400kV Transmission Line
The JICA Survey Team examined the voltage of the transmission line between Sampoor - New Habarana, which is necessary when constructing a coal-fired power plant in Sampoor. The distance between the two substations was about 100 km, and the case where a 400kV transmission line is constructed via a two-circuit tower and the case where a 220kV transmission line is constructed via a four-circuit tower are compared. The reason for adopting the four-circuit tower is based on CEB's opinion that the land width of the transmission line should be as small as possible. Figure 8-3 shows the equipment configurations for the cases compared.

Project on Electricity Sector Master Plan Study in Democratic Socialist Republic of Sri Lanka
Final Report
8-7
Figure 8-3 Equipment Configurations for the Cases compared
Table 8-2 shows the conditions such as resistance value, power transmission distance, unit price of loss, power transmission power factor, etc. of the transmission line used for the study. Costs of power transmission lines, circuit breakers, transformers, etc. used for the study are shown in the same table. The unit price of loss is based on the fuel costs and maintenance costs for the LNG thermal power plant, which is calculated in anticipation of the price rise in 2030, and the cost of the equipment is based on the data obtained from CEB. The cost per circuit when adopting the 4-circuit tower is set to 1.125 times’ the cost when adopting the 2-circuit tower.
Table 8-2 Conditions used for Comparison Study
The results are shown in Table 8-3. If the transmission power is about 600MW or more, the cost including transmission loss becomes smaller for 400kV than 220kV. Therefore, it is more economical to adopt 400kV if there is a transmission power of about 600MW or more and a power transmission distance of about 100km.
Conductor Resistance at 70℃ (Zebra) 0.0700623 ohm/km
Distance 100 km
Loss Price 8.93 Usc/kWh
Power Factor 0.9
Load Loss Factor (0.85*0.7^2+0.15*0.7) 0.5215
Equipment Cost FC(LKR) LC(LKR) LKR million USD
400 4x Zebra, double circuit 109.34 25.44 135 0.88
220 2x Zebra, double circuit 40.47 16.81 57 0.37
400kV Line Bay DB 106.54 11.02 118 0.76
220 kV Line Bay DB 66.53 4.97 72 0.46
400kV TR Bay DB 89.44 9.25 99 0.64
220 kV TR Bay DB 51.99 5.06 57 0.37
Common Items for 400/220/33kV 2x300 MVA (Out door) 368.34 192.09 560 3.64
Transformers 400/220kV 800MVA & E.Tr. & Aux. Tr 555.25 64.15 619 4.02
Exchange rate 0.006496 USD
Cost factor for T/L 4cct towers 1.125
Conditions
Capacity: 1,743 MVA considering N-1
Cap. 581 MVA/cct220 kV 2xZebra
Cap. 2,113 MVA/cct400 kV 4 x Zebra
Capacity: 2,113 MVA considering N-1
400 kV 2 cct(2 cct towers)
220 kV 4 cct(4 cct towers)
(Source: JICA Survey Team)
(Source: JICA Survey Team)

Project on Electricity Sector Master Plan Study in Democratic Socialist Republic of Sri Lanka
Final Report
8-8
In the plan to develop the Sampoor thermal power plant, the output is over 600MW, so the JICA Survey Team decided to adopt 400kV between Sampoor and New Habarana.
Table 8-3 Comparison between 400kV and 220kV Transmission Lines
8.3.3 Plan for Distribution Substations and estimated Load
(1) Plan for distribution substations CEB supplies electricity from a 220kV or 132kV substation to a 33kV (MV) distribution system. In consultation with CEB, existing and new substations of 220kV/MV and 132kV/MV are set as follows.
Table 8-4 Distribution Substations (Existing and Planned)
Division Province Grid Substation Transformer
Capacity (MVA)
Remark
1 CC
Kelanitissa 120 Kolonnawa (Indoor) 94.5 Sub A (Havelock Town) 94.5 Sub A2 (Havelock Town) 90 New Sub B (Pettah) 94.5 Sub C (Kotahena) 94.5 Sub E (Kollupitiya) 90 Sub F (Fort) 90 Sub I (Maradana) 94.5 Sub I2 (Maradana) 90 New Sub K (Wellawatta) 135 Sub L (Port) L1 90 Sub L (Port) L2 90 Sub M (Slave Island) 90 Sub N (Hunupitiya) 90 Sub P (Narahenpita) 135 New Sub Q (Town Hall) 135 Sub R (Port City) R1 189 Sub R (Port City) R2 189 Sub S (Madampitiya) 135 New
(Source: JICA Survey Team)
Peak P.
(MW)
Voltage
Class
(kV)
cct
No. of 800
MVA Tr.
per S/S
R. per
phase
(ohm)
Amp.
per
phase
(A)
Loss
(kW)
Loss
(MWh/y)
Loss
(mill ion
USD/y)
Loss for
10
years
Cost of
T/L
Cost of
Tr.
Cost of
Bays
Common
for S/S
Total
Cost
excl.
Loss
Total
Cost
excl.
Loss
(4cct)
Total
Cost inc.
Loss
600 400 2 2 1.752 481 2,433 11,113 0.992 10 88 8.0 7.1 7.3 110.0 110.0 120
600 220 4 3.503 437 8,042 36,739 3.281 33 74 3.7 78.1 87.9 121
800 400 2 2 1.752 642 4,325 19,757 1.764 18 88 8.0 7.1 7.3 110.0 110.0 128
800 220 4 3.503 583 14,297 65,313 5.832 58 74 3.7 78.1 87.9 146
1000 400 2 3 1.752 802 6,758 30,871 2.757 28 88 12.1 9.1 7.3 116.0 116.0 144
1000 220 4 3.503 729 22,339 102,052 9.113 91 74 3.7 78.1 87.9 179
1200 400 2 3 1.752 962 9,731 44,454 3.970 40 88 12.1 9.1 7.3 116.0 116.0 156
1200 220 4 3.503 875 32,168 146,955 13.123 131 74 3.7 78.1 87.9 219
1500 400 2 3 1.752 1,203 15,204 69,459 6.203 62 88 12.1 9.1 7.3 116.0 116.0 178
1500 220 4 3.503 1,093 50,263 229,617 20.505 205 74 3.7 78.1 87.9 293
Condition Loss Calculaiton Cost (mill ion USD)
Cas
es
Loss Calculation

Project on Electricity Sector Master Plan Study in Democratic Socialist Republic of Sri Lanka
Final Report
8-9
Division Province Grid Substation Transformer
Capacity (MVA)
Remark
NCP
Anuradhapura 94.5 Anuradhapura West 135 New Habarana 94.5 New Anuradhapura 60 Polonnaruwa 94.5 Polonnaruwa East 63 New
NP
Chemmani 94.5 Chunnakam 94.5 Kilinochchi 94.5 Mannar 45 Vavuniya 63
2
NWP
Bolawatta 94.5 Dummalasuriya 135 New Kurunegala 94.5 Kurunegala West 135 New Madampe 94.5 Maho 94.5 Pannala 94.5 Puttalama 94.5 Wariyapola 135
CP
Kandy City 94.5 Kegalle 94.5 Kiribath Kumbura 126 Naula 63 Nawalapitiya 94.5 Nuwara Eliya 94.5 Pallekele 63 Pallekele East 94.5 New Ragala 63 Thulhiriya 94.5 Thulhiriya East 63 New Ukuwela 94.5 Wimalasurendra 94.5
EP
Ampara 94.5 Echalampattu 63 Oluvil 63 New Kappalthurei 189 Kappalthurei North 189 New Pottuvil 63 Trincomalee 63 Valachchenai 63 Vavunathivu 63
WPN Aniyakanda 94.5

Project on Electricity Sector Master Plan Study in Democratic Socialist Republic of Sri Lanka
Final Report
8-10
Division Province Grid Substation Transformer
Capacity (MVA)
Remark
Biyagama 126 Biyagama IPZ 135 New Gampaha 135 New Katunayaka 94.5 Katunayaka 2 135 New Kelaniya 63 Kerawalapitiya 90 Kerawalapitiya North 126 New Kirindiwela 94.5 Kotugoda 120 Kotugoda New 135 Meerigama 1 135 New Meerigama 2 135 New Negombo 135 Sapugaskanda 94.5 Veyangoda 94.5 Yakkala 135
3
SBP
Balangoda 94.5 Embilipitiya 63 Kalawana 63 Maliboda 63 Rathnapura 94.5 Wewalwatta 63
UP
Badulla 94.5 Mahiyanganaya 94.5 Monaragala 63 Wellawaya 63
WPS II
Athurugiriya 94.5 Kaduwela 94.5 New Battaramulla 135 Horana 94.5 Horana West 1 135 New Horana West 2 135 New Kesbewa 94.5 Kollonnawa (Outdoor) 63 Kosgama 63 Oruwala 6.3 Padukka 135 Pannipitiya 94.5 Seethawaka 94.5 Sri Jayawardanapura 94.5 Udahamulla 189
4 SP Ambalangoda 94.5

Project on Electricity Sector Master Plan Study in Democratic Socialist Republic of Sri Lanka
Final Report
8-11
Division Province Grid Substation Transformer
Capacity (MVA)
Remark
Baddegama 135 Beliatta 63 Deniyaya 94.5 Galle 94.5 Hikkaduwa 135 New Hambantota 94.5 Hambantota Port 135 Hambantota Port 2 189 New Hambantota Port 3 189 New Matara 94.5 Suriyawewa 94.5 Tissamaharama 63 Weligama 135
WPS I
Dehiwala 94.5 Mathugama 94.5 Mathugama West 135 New Moratuwa 135 New Kalutara 94.5 Panadura 94.5 Piliyandala 135 New Ratmalana 94.5
Total Demand (2) Estimated load of each substation Based on the load of the substation modeled in the 2037 PSSE data received from CEB, the loads of the 132kV system for 2025, 2030, 2035 and 2040 are estimated by adjusting to the total demand in each year respectively. The estimated load of each substation is shown in Table 8-5.
(Source: JICA Survey Team)

Project on Electricity Sector Master Plan Study in Democratic Socialist Republic of Sri Lanka
Final Report
8-12
Table 8-5 Estimated Load of each Substation

Project on Electricity Sector Master Plan Study in Democratic Socialist Republic of Sri Lanka
Final Report
8-13
(Source: JICA Survey Team)

Project on Electricity Sector Master Plan Study in Democratic Socialist Republic of Sri Lanka
Final Report
8-14
8.3.4 Feature of Power Sources to be developed in each Area
As indicated in Figure 8-4, according to the development plan, the areas are divided into eight, and each area has a distinctive feature of power source developed. The north and north-western (Mannar, Puttalam) region is marked by strong wind. Thus, development of a renewable energy plant such as a wind farm is expected. In the Puttalam area of the north-western region, large-scale coal fired TPP has already been developed. In the north-eastern region, although the plan for the Sampoor coal-fired power plant is on hold, the potential is high as a candidate for a thermal power plant and it is a promising area. In the central region, many hydropower stations have already been developed, and development of a large-scale pumped-storage power plant is expected. In the southern region, there are expectations of not only a development plan for a thermal power plant in Hambantota, but also renewable energy generation such as biomass, and solar power. In addition, development of solar power generation is expected in the south-eastern region. In the western region, where Colombo is located, many oil-fired power plants have already been constructed, but there is a plan to develop a large-scale LNG thermal power plant. The load currents are flowing into Colombo, where electricity consumption is enormous, from the generators in each area.

Project on Electricity Sector Master Plan Study in Democratic Socialist Republic of Sri Lanka
Final Report
8-15
Figure 8-4 Illustration of Power Generation Development
(Source: JICA Survey Team)
North
West Central
MannarNorth
Puttalam
North East
South East
South
Project on Electricity Sector Master Plan Study in Democratic Socialist Republic of Sri Lanka
Final Report
8-16
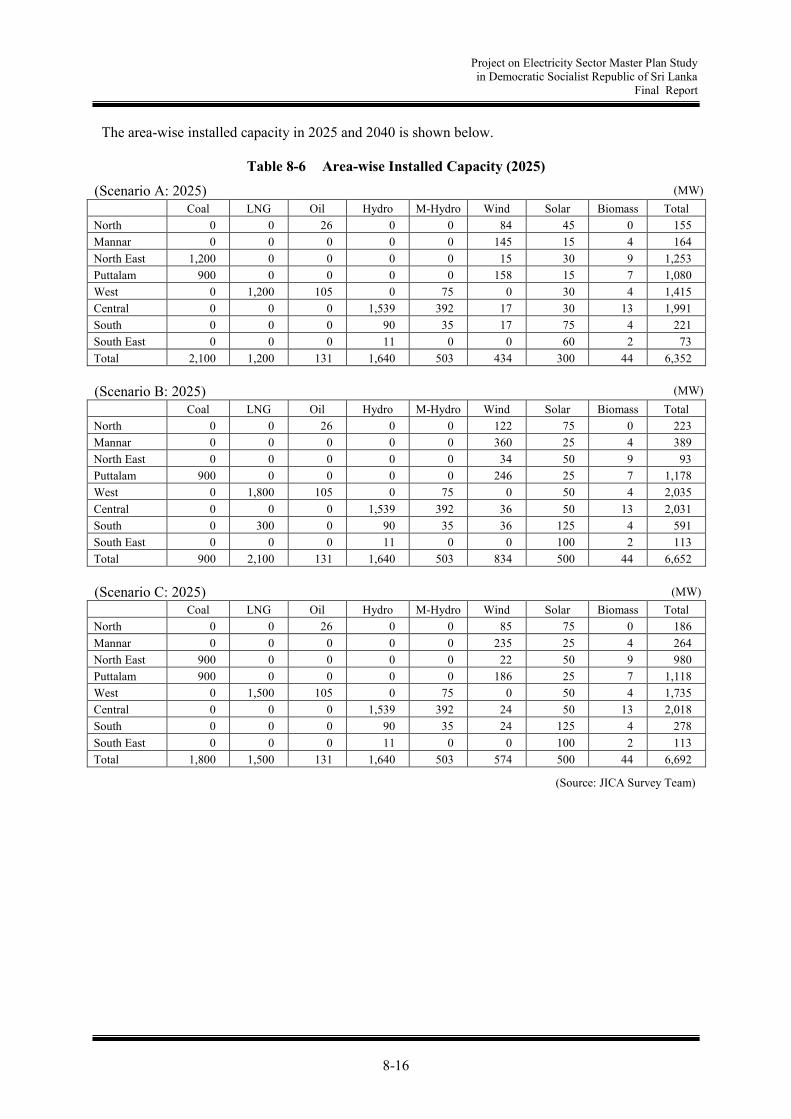
The area-wise installed capacity in 2025 and 2040 is shown below.
Table 8-6 Area-wise Installed Capacity (2025)
(Scenario A: 2025) Coal LNG Oil Hydro M-Hydro Wind Solar Biomass Total North 0 0 26 0 0 84 45 0 155 Mannar 0 0 0 0 0 145 15 4 164 North East 1,200 0 0 0 0 15 30 9 1,253 Puttalam 900 0 0 0 0 158 15 7 1,080 West 0 1,200 105 0 75 0 30 4 1,415 Central 0 0 0 1,539 392 17 30 13 1,991 South 0 0 0 90 35 17 75 4 221 South East 0 0 0 11 0 0 60 2 73 Total 2,100 1,200 131 1,640 503 434 300 44 6,352 (Scenario B: 2025) Coal LNG Oil Hydro M-Hydro Wind Solar Biomass Total North 0 0 26 0 0 122 75 0 223 Mannar 0 0 0 0 0 360 25 4 389 North East 0 0 0 0 0 34 50 9 93 Puttalam 900 0 0 0 0 246 25 7 1,178 West 0 1,800 105 0 75 0 50 4 2,035 Central 0 0 0 1,539 392 36 50 13 2,031 South 0 300 0 90 35 36 125 4 591 South East 0 0 0 11 0 0 100 2 113 Total 900 2,100 131 1,640 503 834 500 44 6,652 (Scenario C: 2025) Coal LNG Oil Hydro M-Hydro Wind Solar Biomass Total North 0 0 26 0 0 85 75 0 186 Mannar 0 0 0 0 0 235 25 4 264 North East 900 0 0 0 0 22 50 9 980 Puttalam 900 0 0 0 0 186 25 7 1,118 West 0 1,500 105 0 75 0 50 4 1,735 Central 0 0 0 1,539 392 24 50 13 2,018 South 0 0 0 90 35 24 125 4 278 South East 0 0 0 11 0 0 100 2 113 Total 1,800 1,500 131 1,640 503 574 500 44 6,692
(MW)
(MW)
(MW)
(Source: JICA Survey Team)

Project on Electricity Sector Master Plan Study in Democratic Socialist Republic of Sri Lanka
Final Report
8-17
Table 8-7 Area-wise Installed Capacity (2040)
(Scenario A: 2040) Coal LNG Oil Hydro M-Hydro Wind Solar Biomass Total North 0 0 0 0 0 172 225 0 397 Mannar 0 0 0 0 0 440 75 10 525 North East 1,800 0 0 0 0 44 150 21 2,015 Puttalam 900 0 0 0 0 276 75 16 1,267 West 0 1,200 105 0 105 0 150 10 1,571 Central 0 0 0 1,539 548 46 150 31 2,315 South 1,200 0 0 90 49 46 375 10 1,771 South East 0 0 0 11 0 0 300 5 316 Total 3,900 1,200 105 1,640 703 1,024 1,500 104 10,176 (Scenario B: 2040) Coal LNG Oil Hydro M-Hydro Wind Solar Biomass Total North 0 0 0 0 0 602 300 0 902 Mannar 0 0 0 0 0 1,960 100 10 2,070 North East 0 0 0 0 0 194 200 21 415 Puttalam 900 0 0 0 0 886 100 16 1,902 West 0 2,100 105 0 105 0 200 10 2,521 Central 0 0 0 2,139 548 196 200 31 3,115 South 0 1,200 0 90 49 196 500 10 2,046 South East 0 0 0 11 0 0 400 5 416 Total 900 3,300 105 2,240 703 4,034 2,000 104 13,386 (Scenario C: 2040) Coal LNG Oil Hydro M-Hydro Wind Solar Biomass Total North 0 0 0 0 0 302 300 0 602 Mannar 0 0 0 0 0 960 100 10 1,070 North East 1,200 0 0 0 0 94 200 21 1,515 Puttalam 900 0 0 0 0 476 100 16 1,492 West 0 1,500 105 0 105 0 200 10 1,921 Central 0 0 0 2,139 548 96 200 31 3,015 South 600 300 0 90 49 96 500 10 1,646 South East 0 0 0 11 0 0 400 5 416 Total 2,700 1,800 105 2,240 703 2,024 2,000 104 11,676
(MW)
(MW)
(MW)
(Source: JICA Survey Team)
Project on Electricity Sector Master Plan Study in Democratic Socialist Republic of Sri Lanka
Final Report
8-18
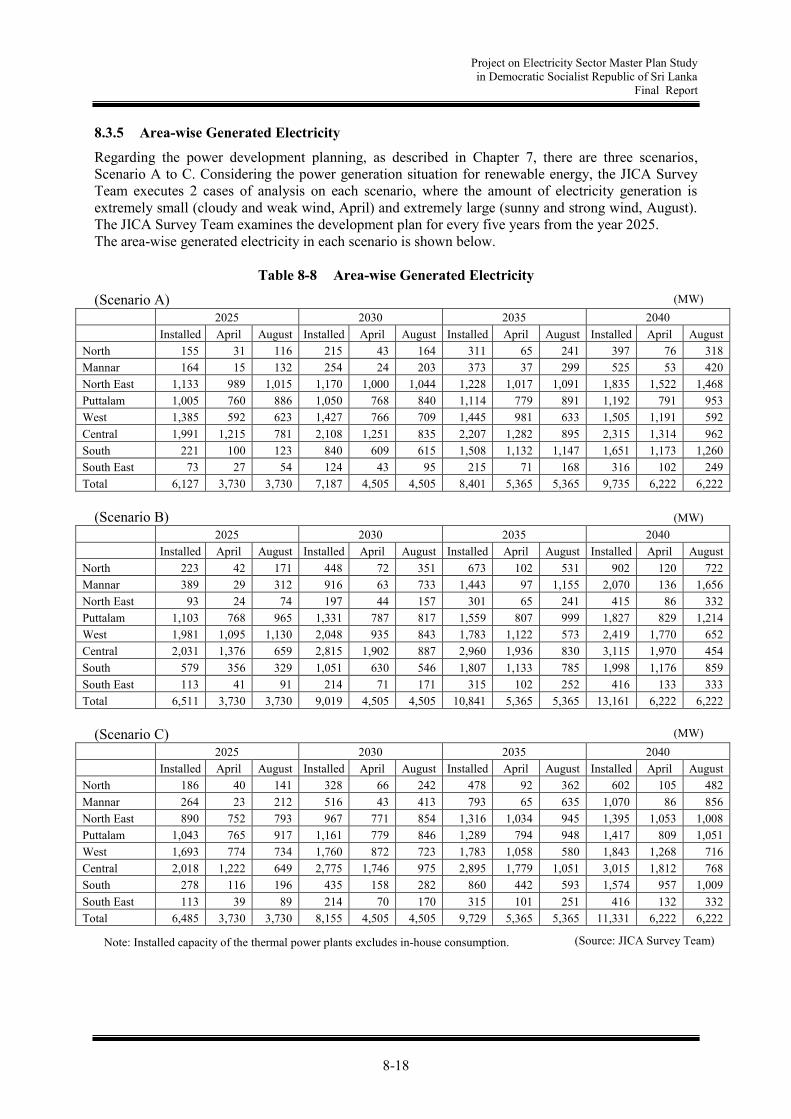
8.3.5 Area-wise Generated Electricity
Regarding the power development planning, as described in Chapter 7, there are three scenarios, Scenario A to C. Considering the power generation situation for renewable energy, the JICA Survey Team executes 2 cases of analysis on each scenario, where the amount of electricity generation is extremely small (cloudy and weak wind, April) and extremely large (sunny and strong wind, August). The JICA Survey Team examines the development plan for every five years from the year 2025. The area-wise generated electricity in each scenario is shown below.
Table 8-8 Area-wise Generated Electricity
(Scenario A) 2025 2030 2035 2040 Installed April August Installed April August Installed April August Installed April August North 155 31 116 215 43 164 311 65 241 397 76 318 Mannar 164 15 132 254 24 203 373 37 299 525 53 420 North East 1,133 989 1,015 1,170 1,000 1,044 1,228 1,017 1,091 1,835 1,522 1,468 Puttalam 1,005 760 886 1,050 768 840 1,114 779 891 1,192 791 953 West 1,385 592 623 1,427 766 709 1,445 981 633 1,505 1,191 592 Central 1,991 1,215 781 2,108 1,251 835 2,207 1,282 895 2,315 1,314 962 South 221 100 123 840 609 615 1,508 1,132 1,147 1,651 1,173 1,260 South East 73 27 54 124 43 95 215 71 168 316 102 249 Total 6,127 3,730 3,730 7,187 4,505 4,505 8,401 5,365 5,365 9,735 6,222 6,222
(Scenario B)
2025 2030 2035 2040 Installed April August Installed April August Installed April August Installed April August North 223 42 171 448 72 351 673 102 531 902 120 722 Mannar 389 29 312 916 63 733 1,443 97 1,155 2,070 136 1,656 North East 93 24 74 197 44 157 301 65 241 415 86 332 Puttalam 1,103 768 965 1,331 787 817 1,559 807 999 1,827 829 1,214 West 1,981 1,095 1,130 2,048 935 843 1,783 1,122 573 2,419 1,770 652 Central 2,031 1,376 659 2,815 1,902 887 2,960 1,936 830 3,115 1,970 454 South 579 356 329 1,051 630 546 1,807 1,133 785 1,998 1,176 859 South East 113 41 91 214 71 171 315 102 252 416 133 333 Total 6,511 3,730 3,730 9,019 4,505 4,505 10,841 5,365 5,365 13,161 6,222 6,222
(Scenario C)
2025 2030 2035 2040 Installed April August Installed April August Installed April August Installed April August North 186 40 141 328 66 242 478 92 362 602 105 482 Mannar 264 23 212 516 43 413 793 65 635 1,070 86 856 North East 890 752 793 967 771 854 1,316 1,034 945 1,395 1,053 1,008 Puttalam 1,043 765 917 1,161 779 846 1,289 794 948 1,417 809 1,051 West 1,693 774 734 1,760 872 723 1,783 1,058 580 1,843 1,268 716 Central 2,018 1,222 649 2,775 1,746 975 2,895 1,779 1,051 3,015 1,812 768 South 278 116 196 435 158 282 860 442 593 1,574 957 1,009 South East 113 39 89 214 70 170 315 101 251 416 132 332 Total 6,485 3,730 3,730 8,155 4,505 4,505 9,729 5,365 5,365 11,331 6,222 6,222
(MW)
(MW)
(MW)
(Source: JICA Survey Team) Note: Installed capacity of the thermal power plants excludes in-house consumption.

Project on Electricity Sector Master Plan Study in Democratic Socialist Republic of Sri Lanka
Final Report
8-19
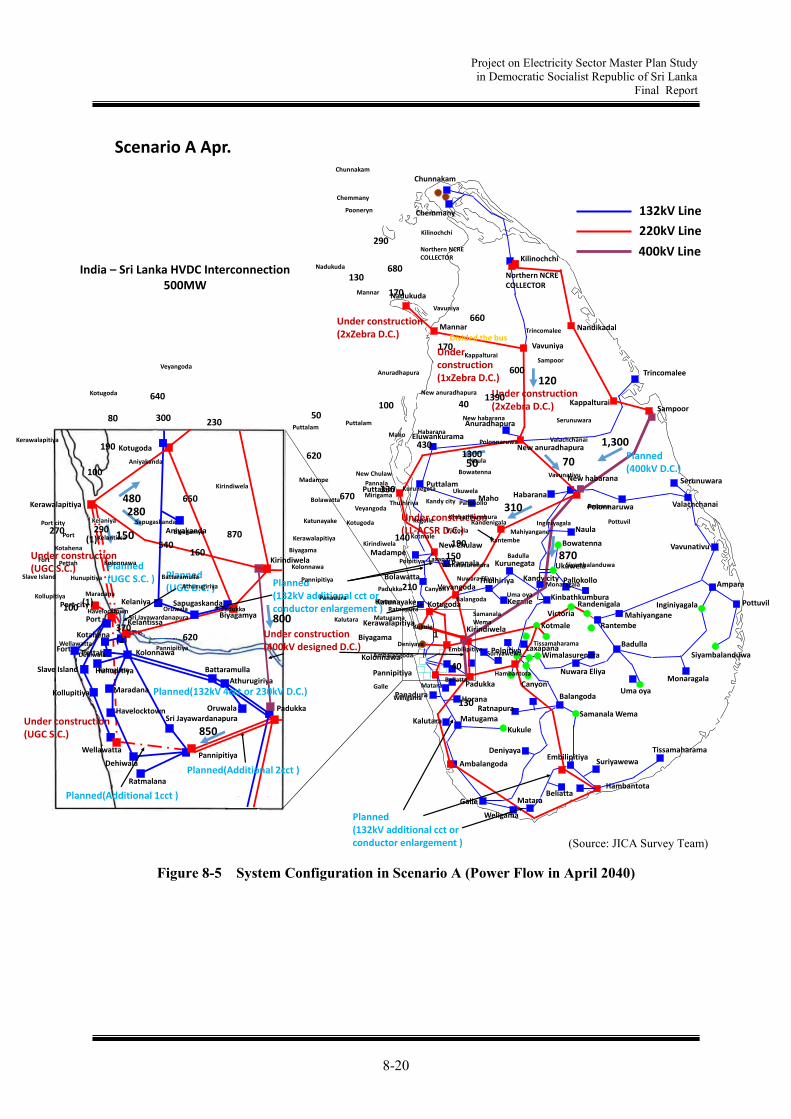
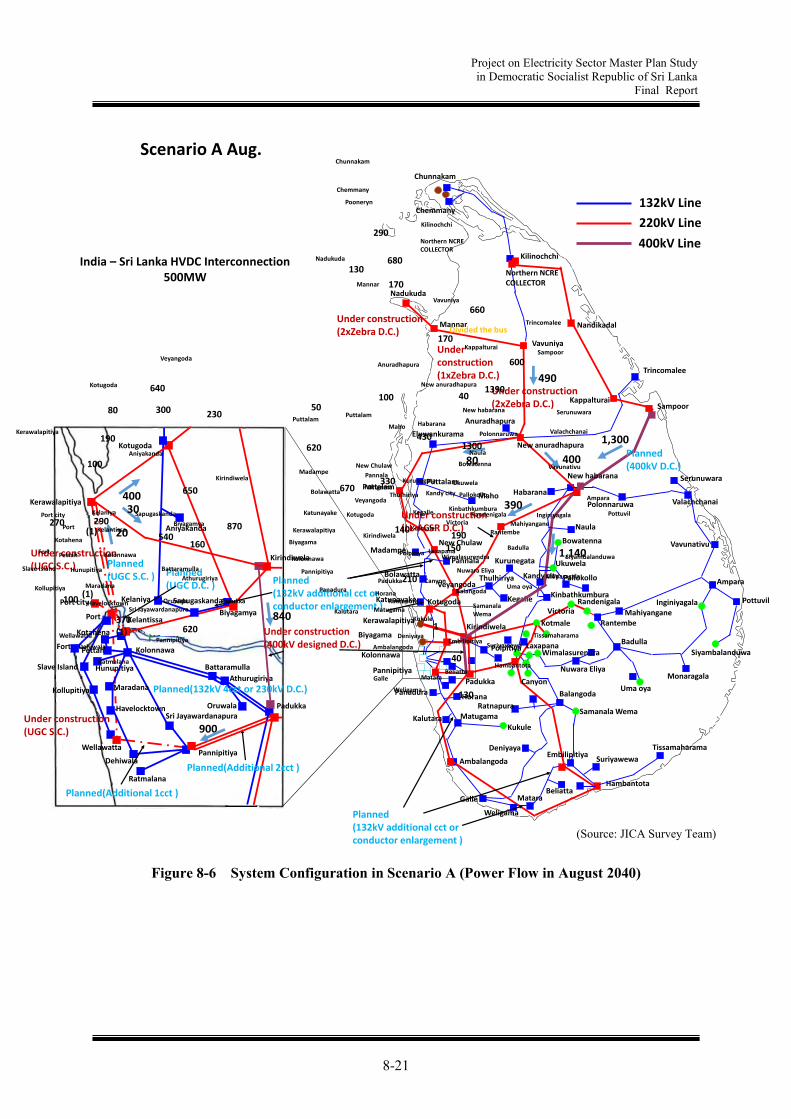
8.3.6 Transmission Development Plan in 2040 corresponding to each Power Development Scenario
Based on the 2037 PSSE data provided by CEB, the JICA Survey Team set up the 2040 network system model corresponding to the power development scenarios A, B and C. The JICA Survey Team conducts power flow calculations and examined the system plan for each scenario up to 2040. (1) Scenario A (High priority on cost) The system configuration and power flow for 2040 in Scenario A is shown in Figure 8-5 (April with low renewable energy power generation) and Figure 8-6 (August with large amount of renewable energy generation). In Scenario A, the generation output from Sampoor coal-fired TPP is large. The main transmission lines required for the 400kV, 220kV system from 2017 to 2040 are as follows. In order to transmit power generated by Sampoor coal-fired TPP, a new 400kV transmission line
is developed between Sampoor - New Habarana. A 400kV transmission line is newly developed between New Habarana - Kirindiwela depending
on the increase in power flow from Sampoor coal-fired TPP. For part of this section, New Habarana-Kotmale, it is expected to be difficult to secure the
right of way for the route. In this case, it is necessary to consider that the route of the existing 220kV transmission line may be used for the new 400kV transmission line.
In order to cope with increase in power flow due to the expansion of the Kerawalapitiya TPP, 1 circuit of 220kV cable from the Kerawalapitiya TPP to the center of Colombo city is added.
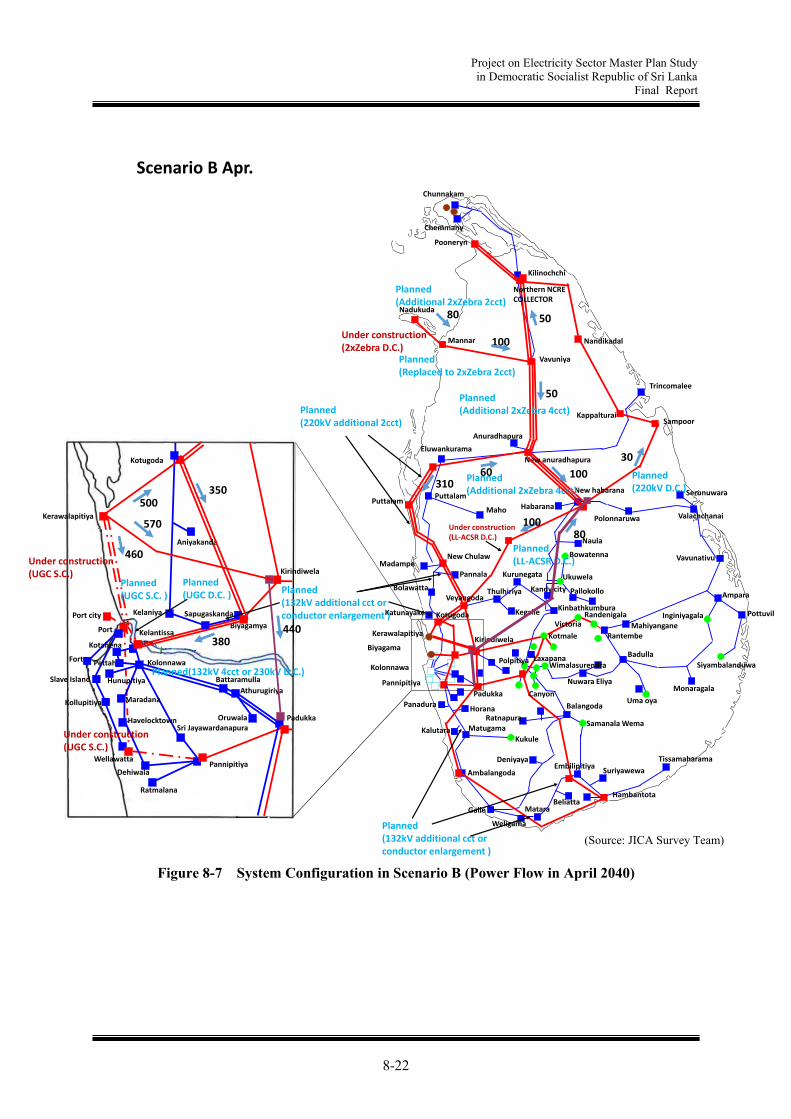
A 220kV transmission line between Kerawalapitiya TPP - Kirindiwela is newly developed. (2) Scenario B (High priority on renewable energy development with CO2 reduction) The system configuration and power flow for 2040 in Scenario B is shown in Figure 8-7 and Figure 8-8. In Scenario B, the generation output from windpower and solar power in the northern part of Sri Lanka is large. The main transmission lines required for the 400kV, 220kV system from 2017 to 2040 are as follows. Due to the increase in power flow due to the windpower and solar power in the northern area, four
circuits of 220kV transmission lines between Vavuniya-New Anuradhapura-New Habarana are added.
A 400kV transmission line is newly developed between New Habarana – Kirindiwela. 2 circuits of 220kV transmission line between Euwnkurama-Puttalam-New Chulaw-Veyangoda-
Kelanitissa are added In order to cope with increase in power flow due to the expansion of the Kerawalapitiya TPP, 1
circuit of 220kV cable from the Kerawalapitiya TPP to the center of Colombo city is added. A 220kV or 400kV transmission line between Kerawalapitiya TPP - Kirindiwela is newly
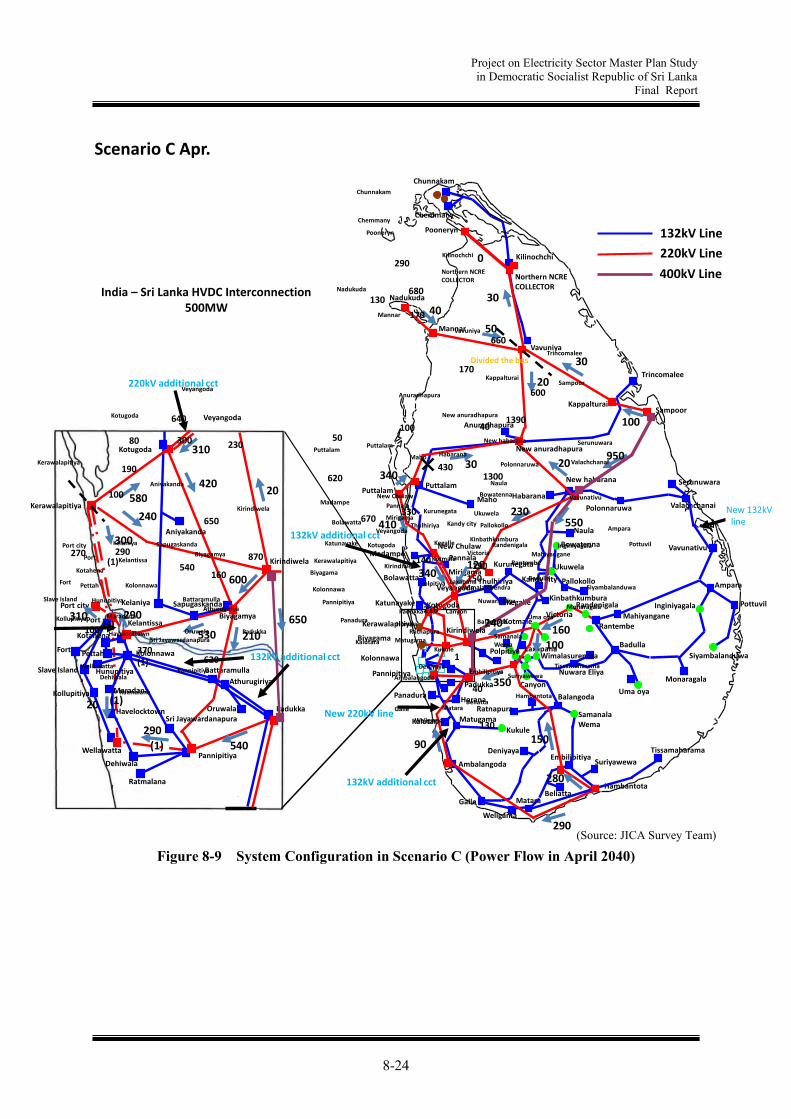
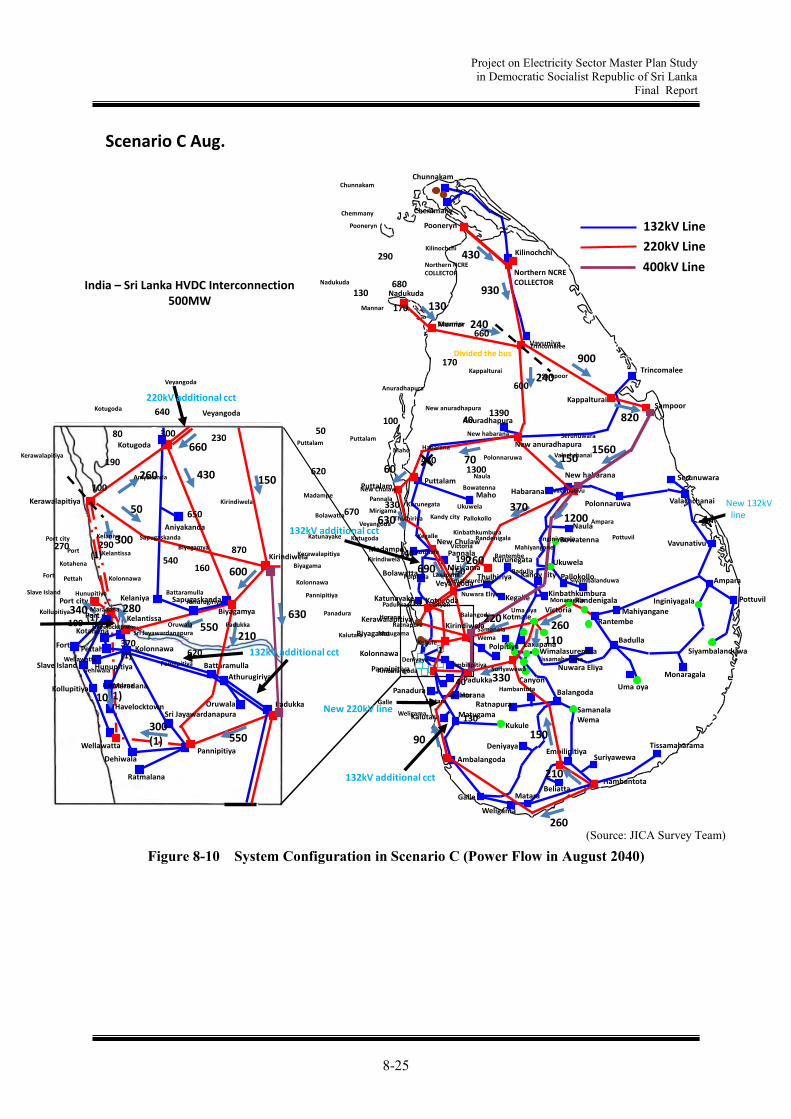
developed. (3) Scenario C (Mixed power supply development) The system configuration and power flow for 2040 in Scenario C is shown in Figure 8-9 and Figure 8-10. The main transmission lines required for the 400kV, 220kV system from 2017 to 2040 are as follows. In order to transmit power generated by Sampoor coal-fired TPP, a new 400kV transmission line
is developed between Sampoor - New Habarana. A 400kV transmission line is newly developed between New Habarana - Kirindiwela depending
on the increase in power flow from Sampoor coal-fired TPP and renewable energies in the northern area.
In order to cope with increase in power flow due to the expansion of the Kerawalapitiya TPP, 1 circuit of 220kV cable from the Kerawalapitiya TPP to the center of Colombo city is added.
A 220kV transmission line between Kerawalapitiya TPP - Kirindiwela is newly developed.
Project on Electricity Sector Master Plan Study in Democratic Socialist Republic of Sri Lanka
Final Report
8-20
Figure 8-5 System Configuration in Scenario A (Power Flow in April 2040)
Chunnakam
Mannar
Vavuniya
Anuradhapura
Sampoor
HabaranaValachchanai
Bowatenna
Ukuwela
Pallokollo
Randenigala
RantembeKotmale
Badulla
Nuwara Eliya
Ampara
Vavunativu
MahiyanganeInginiyagala
Monaragala
Kukule
Deniyaya
Ambalangoda
GalleBeliatta
Maho
Puttalam
Madampe
Bolawatta
KinbathkumburaKegalle
Horana
Samanala Wema
Balangoda
Ratnapura
Padukka
Hambantota
Pannipitiya
Thulhiriya
Kolonnawa
Biyagama
Kerawalapitiya
Kappalturai
Eluwankurama
Polonnaruwa
Naula
Tissamaharama
Suriyawewa
Nandikadal
Nadukuda
Trincomalee
New Chulaw
Katunayake
Kalutara
Panadura
Puttalam
Matugama
Kurunegata
Veyangoda
Kotugoda
Canyon
Embilipitiya
Matara
LaxapanaWimalasurendra
Victoria
Kotugoda
Kerawalapitiya
Biyagamya
Kirindiwela
Padukka
PannipitiyaWellawatta
Kelantissa
Port city
Port
Kollupitiya
Slave Island
Fort
Kotahena
Pettah Kolonnawa
Hunupitiya
Havelocktown
Dehiwala
Ratmalana
Sri Jayawardanapura
Athurugiriya
Battaramulla
Oruwala
SapugaskandaKelaniya
Aniyakanda
Maradana
Pottuvil
Siyambalanduwa
Uma oya
Kandy city
Underconstruction(1xZebra D.C.)
Under construction(2xZebra D.C.)
Under construction(2xZebra D.C.)
Under construction(400kV designed D.C.)
Under construction(UGC S.C.)
Under construction(LL-ACSR D.C.)
Planned(400kV D.C.)
Planned(132kV 4cct or 230kV D.C.)
Planned(132kV additional cct orconductor enlargement )
Planned(132kV additional cct orconductor enlargement )
Pannala
Weligama
Planned(UGC S.C. )
Under construction(UGC S.C.)
Planned(UGC D.C. )
Polpitiya
New habarana
New anuradhapura
Chemmany
Serunuwara
1,300
310
870
280480
150
Kirindiwela
Planned(Additional 2cct )
Planned(Additional 1cct )
Northern NCRECOLLECTOR
Kilinochchi
120
50 70
800
850
Chunnakam
Kilinochchi
Mannar
Vavuniya
Anuradhapura
Sampoor
HabaranaValachchanai
Bowatenna
Ukuwela
Pallokollo
Randenigala
RantembeKotmale
Badulla
Nuwara Eliya
Ampara
Vavunativu
Mahiyangane
Inginiyagala
Monaragala
Kukule
Deniyaya
Ambalangoda
GalleBeliatta
Maho
Puttalam
Madampe
Bolawatta
Kegalle
Horana
SamanalaWema
Balangoda
Ratnapura
Padukka
Hambantota
Pannipitiya
Thulhiriya
Kirindiwela
Kolonnawa
Biyagama
Kerawalapitiya
Kappalturai
Polonnaruwa
Naula
Tissamaharama
Suriyawewa
Nadukuda
Trincomalee
New Chulaw
Katunayake
Kalutara
Panadura
Puttalam
Matugama
Kurunegata
Canyon
Embilipitiya
Matara
LaxapanaWimalasurendra
Victoria
Kotugoda
Kerawalapitiya
Kirindiwela
Padukka
PannipitiyaWellawatta
Kelantissa
Port city
Port
Kollupitiya
Slave Island
Fort
Kotahena
Pettah Kolonnawa
Hunupitiya
Havelocktown
Dehiwala
Ratmalana
Athurugiriya
Battaramulla
Oruwala
SapugaskandaKelaniya
Aniyakanda
Maradana
Pottuvil
Siyambalanduwa
Uma oya
Kandy city
Pannala
Weligama
New habarana
Chemmany
Serunuwara
190
80
100
1390
130
170
170
40100
1300430
Veyangoda
Kotugoda
Pooneryn
300
540870
620
680
50
670 Mirigama330
600
190
Kinbathkumbura
140
150
210
640
230
Veyangoda
290(1)
270
(1)100
(1)370
Biyagamya
Sri Jayawardanapura
160
620
650
New anuradhapura
132kV Line
220kV Line
400kV Line
1
Northern NCRECOLLECTOR
Divided the bus
130
40
660
290
India – Sri Lanka HVDC Interconnection500MW
Polpitiya
Scenario A Apr.
(Source: JICA Survey Team)
Project on Electricity Sector Master Plan Study in Democratic Socialist Republic of Sri Lanka
Final Report
8-21
Figure 8-6 System Configuration in Scenario A (Power Flow in August 2040)
Scenario A Aug.
(Source: JICA Survey Team)
Chunnakam
Mannar
Vavuniya
Anuradhapura
Sampoor
HabaranaValachchanai
Bowatenna
Ukuwela
Pallokollo
Randenigala
RantembeKotmale
Badulla
Nuwara Eliya
Ampara
Vavunativu
MahiyanganeInginiyagala
Monaragala
Kukule
Deniyaya
Ambalangoda
GalleBeliatta
Maho
Puttalam
Madampe
Bolawatta
KinbathkumburaKegalle
Horana
Samanala Wema
Balangoda
Ratnapura
Padukka
Hambantota
Pannipitiya
Thulhiriya
Kolonnawa
Biyagama
Kerawalapitiya
Kappalturai
Eluwankurama
Polonnaruwa
Naula
Tissamaharama
Suriyawewa
Nandikadal
Nadukuda
Trincomalee
New Chulaw
Katunayake
Kalutara
Panadura
Puttalam
Matugama
Kurunegata
Veyangoda
Kotugoda
Canyon
Embilipitiya
Matara
LaxapanaWimalasurendra
Victoria
Kotugoda
Kerawalapitiya
Biyagamya
Kirindiwela
Padukka
PannipitiyaWellawatta
Kelantissa
Port city
Port
Kollupitiya
Slave Island
Fort
Kotahena
Pettah Kolonnawa
Hunupitiya
Havelocktown
Dehiwala
Ratmalana
Sri Jayawardanapura
Athurugiriya
Battaramulla
Oruwala
SapugaskandaKelaniya
Aniyakanda
Maradana
Pottuvil
Siyambalanduwa
Uma oya
Kandy city
Underconstruction(1xZebra D.C.)
Under construction(2xZebra D.C.)
Under construction(2xZebra D.C.)
Under construction(400kV designed D.C.)
Under construction(UGC S.C.)
Under construction(LL-ACSR D.C.)
Planned(400kV D.C.)
Planned(132kV 4cct or 230kV D.C.)
Planned(132kV additional cct orconductor enlargement )
Planned(132kV additional cct orconductor enlargement )
Pannala
Weligama
Planned(UGC S.C. )
Under construction(UGC S.C.)
Planned(UGC D.C. )
Polpitiya
New habarana
New anuradhapura
Chemmany
Serunuwara
1,300
390
1,140
30400
20
Kirindiwela
Planned(Additional 2cct )
Planned(Additional 1cct )
490
80 400
840
900
Northern NCRECOLLECTOR
Kilinochchi
Chunnakam
Kilinochchi
Mannar
Vavuniya
Anuradhapura
Sampoor
HabaranaValachchanai
Bowatenna
Ukuwela
Pallokollo
Randenigala
RantembeKotmale
Badulla
Nuwara Eliya
Ampara
Vavunativu
Mahiyangane
Inginiyagala
Monaragala
Kukule
Deniyaya
Ambalangoda
GalleBeliatta
Maho
Puttalam
Madampe
Bolawatta
Kegalle
Horana
SamanalaWema
Balangoda
Ratnapura
Padukka
Hambantota
Pannipitiya
Thulhiriya
Kirindiwela
Kolonnawa
Biyagama
Kerawalapitiya
Kappalturai
Polonnaruwa
Naula
Tissamaharama
Suriyawewa
Nadukuda
Trincomalee
New Chulaw
Katunayake
Kalutara
Panadura
Puttalam
Matugama
Kurunegata
Canyon
Embilipitiya
Matara
LaxapanaWimalasurendra
Victoria
Kotugoda
Kerawalapitiya
Kirindiwela
Padukka
PannipitiyaWellawatta
Kelantissa
Port city
Port
Kollupitiya
Slave Island
Fort
Kotahena
Pettah Kolonnawa
Hunupitiya
Havelocktown
Dehiwala
Ratmalana
Athurugiriya
Battaramulla
Oruwala
SapugaskandaKelaniya
Aniyakanda
Maradana
Pottuvil
Siyambalanduwa
Uma oya
Kandy city
Pannala
Weligama
New habarana
Chemmany
Serunuwara
190
80
100
1390
130
170
170
40100
1300430
Veyangoda
Kotugoda
Pooneryn
300
540870
620
680
50
670 Mirigama330
600
190
Kinbathkumbura
140
150
210
640
230
Veyangoda
290(1)
270
(1)100
(1)370
Biyagamya
Sri Jayawardanapura
160
620
650
New anuradhapura
132kV Line
220kV Line
400kV Line
1
Northern NCRECOLLECTOR
Divided the bus
130
40
660
290
India – Sri Lanka HVDC Interconnection500MW
Polpitiya
Project on Electricity Sector Master Plan Study in Democratic Socialist Republic of Sri Lanka
Final Report
8-22
Figure 8-7 System Configuration in Scenario B (Power Flow in April 2040)
Scenario B Apr.
(Source: JICA Survey Team)
Chunnakam
Mannar
Vavuniya
Anuradhapura
Sampoor
HabaranaValachchanai
Bowatenna
Ukuwela
Pallokollo
Randenigala
RantembeKotmale
Badulla
Nuwara Eliya
Ampara
Vavunativu
MahiyanganeInginiyagala
Monaragala
Kukule
Deniyaya
Ambalangoda
GalleBeliatta
Maho
Puttalam
Madampe
Bolawatta
KinbathkumburaKegalle
Horana
Samanala Wema
Balangoda
Ratnapura
Padukka
Hambantota
Pannipitiya
Thulhiriya
Kirindiwela
Kolonnawa
Biyagama
Kerawalapitiya
Kappalturai
Eluwankurama
Polonnaruwa
Naula
Tissamaharama
Suriyawewa
Nandikadal
Nadukuda
Trincomalee
New Chulaw
Katunayake
Kalutara
Panadura
Puttalam
Matugama
Kurunegata
Canyon
Embilipitiya
Matara
LaxapanaWimalasurendra
Victoria
Kotugoda
Kerawalapitiya
Biyagamya
Kirindiwela
Padukka
PannipitiyaWellawatta
Kelantissa
Port city
Port
Kollupitiya
Slave Island
Fort
Kotahena
Pettah Kolonnawa
Hunupitiya
Havelocktown
Dehiwala
Ratmalana
Sri Jayawardanapura
Athurugiriya
Battaramulla
Oruwala
SapugaskandaKelaniya
Aniyakanda
Maradana
Pottuvil
Siyambalanduwa
Uma oya
Kandy city
Planned(Replaced to 2xZebra 2cct)
Under construction(UGC S.C.)
Under construction(LL-ACSR D.C.)
Planned(220kV D.C.)
Planned(LL-ACSR D.C.)
Planned(132kV 4cct or 230kV D.C.)
Planned(132kV additional cct orconductor enlargement )
Planned(132kV additional cct orconductor enlargement )
Pannala
Weligama
Planned(UGC S.C. )
Under construction(UGC S.C.)
Planned(UGC D.C. )
Polpitiya
New habarana
Planned(Additional 2xZebra 4cct)
New anuradhapura
Planned(Additional 2xZebra 4cct)
Chemmany
Serunuwara
80
100
50
100
30
80100
460
500350
Veyangoda
60
Planned(220kV additional 2cct)
Kotugoda
Pooneryn
50
Under construction(2xZebra D.C.)
310
570
440380
Planned(Additional 2xZebra 2cct)
Northern NCRECOLLECTOR
Kilinochchi

Project on Electricity Sector Master Plan Study in Democratic Socialist Republic of Sri Lanka
Final Report
8-23
Figure 8-8 System Configuration in Scenario B (Power Flow in August 2040)
Scenario B Aug.
(Source: JICA Survey Team)
Chunnakam
Mannar
Vavuniya
Anuradhapura
Sampoor
HabaranaValachchanai
Bowatenna
Ukuwela
Pallokollo
Randenigala
RantembeKotmale
Badulla
Nuwara Eliya
Ampara
Vavunativu
MahiyanganeInginiyagala
Monaragala
Kukule
Deniyaya
Ambalangoda
GalleBeliatta
Maho
Puttalam
Madampe
Bolawatta
KinbathkumburaKegalle
Horana
Samanala Wema
Balangoda
Ratnapura
Padukka
Hambantota
Pannipitiya
Thulhiriya
Kirindiwela
Kolonnawa
Biyagama
Kerawalapitiya
Kappalturai
Eluwankurama
Polonnaruwa
Naula
Tissamaharama
Suriyawewa
Nandikadal
Nadukuda
Trincomalee
New Chulaw
Katunayake
Kalutara
Panadura
Puttalam
Matugama
Kurunegata
Canyon
Embilipitiya
Matara
LaxapanaWimalasurendra
Victoria
Kotugoda
Kerawalapitiya
Biyagamya
Kirindiwela
Padukka
PannipitiyaWellawatta
Kelantissa
Port city
Port
Kollupitiya
Slave Island
Fort
Kotahena
Pettah Kolonnawa
Hunupitiya
Havelocktown
Dehiwala
Ratmalana
Sri Jayawardanapura
Athurugiriya
Battaramulla
Oruwala
SapugaskandaKelaniya
Aniyakanda
Maradana
Pottuvil
Siyambalanduwa
Uma oya
Kandy city
Planned(Replaced to 2xZebra 2cct)
Under construction(UGC S.C.)
Under construction(LL-ACSR D.C.)
Planned(220kV D.C.)
Planned(LL-ACSR D.C.)
Planned(132kV 4cct or 230kV D.C.)
Planned(132kV additional cct orconductor enlargement )
Planned(132kV additional cct orconductor enlargement )
Pannala
Weligama
Planned(UGC S.C. )
Under construction(UGC S.C.)
Planned(UGC D.C. )
Polpitiya
New habarana
Planned(Additional 2xZebra 4cct)
New anuradhapura
Planned(Additional 2xZebra 4cct)
Chemmany
Serunuwara
100
510
1,700
1,400
360
1,170450
60
270720
Veyangoda
300
Planned(220kV additional 2cct)
Kotugoda
Pooneryn
1,250
Under construction(2xZebra D.C.)
720
170
480730 Under construction
(400kV designed D.C.)
Planned(Additional 2xZebra 2cct)
Northern NCRECOLLECTOR
Kilinochchi
Chunnakam
Kilinochchi
Mannar
Vavuniya
Anuradhapura
Sampoor
HabaranaValachchanai
Bowatenna
Ukuwela
Pallokollo
Randenigala
RantembeKotmale
Badulla
Nuwara Eliya
Ampara
Vavunativu
Mahiyangane
Inginiyagala
Monaragala
Kukule
Deniyaya
Ambalangoda
GalleBeliatta
Maho
Puttalam
Madampe
Bolawatta
Kegalle
Horana
SamanalaWema
Balangoda
Ratnapura
Padukka
Hambantota
Pannipitiya
Thulhiriya
Kirindiwela
Kolonnawa
Biyagama
Kerawalapitiya
Kappalturai
Polonnaruwa
Naula
Tissamaharama
Suriyawewa
Nadukuda
Trincomalee
New Chulaw
Katunayake
Kalutara
Panadura
Puttalam
Matugama
Kurunegata
Canyon
Embilipitiya
Matara
LaxapanaWimalasurendra
Victoria
Kotugoda
Kerawalapitiya
Kirindiwela
Padukka
PannipitiyaWellawatta
Kelantissa
Port city
Port
Kollupitiya
Slave Island
Fort
Kotahena
Pettah Kolonnawa
Hunupitiya
Havelocktown
Dehiwala
Ratmalana
Athurugiriya
Battaramulla
Oruwala
SapugaskandaKelaniya
Aniyakanda
Maradana
Pottuvil
Siyambalanduwa
Uma oya
Kandy city
Pannala
Weligama
New habarana
Chemmany
Serunuwara
190
80
100
1390
130
170
170
40100
1300430
Veyangoda
Kotugoda
Pooneryn
300
540870
620
680
50
670 Mirigama330
600
190
Kinbathkumbura
140
150
210
640
230
Veyangoda
290(1)
270
(1)100
(1)370
Biyagamya
Sri Jayawardanapura
160
620
650
New anuradhapura
132kV Line
220kV Line
400kV Line
1
Northern NCRECOLLECTOR
Divided the bus
130
40
660
290
India – Sri Lanka HVDC Interconnection500MW
Polpitiya
Project on Electricity Sector Master Plan Study in Democratic Socialist Republic of Sri Lanka
Final Report
8-24
Figure 8-9 System Configuration in Scenario C (Power Flow in April 2040)
Chunnakam
Kilinochchi
Mannar
Vavuniya
Anuradhapura
Sampoor
HabaranaValachchanai
Bowatenna
Ukuwela
Pallokollo
Randenigala
RantembeKotmale
Badulla
Nuwara Eliya
Ampara
Vavunativu
Mahiyangane
Inginiyagala
Monaragala
Kukule
Deniyaya
Ambalangoda
GalleBeliatta
Maho
Puttalam
Madampe
Bolawatta
Kegalle
Horana
SamanalaWema
Balangoda
Ratnapura
Padukka
Hambantota
Pannipitiya
Thulhiriya
Kolonnawa
Biyagama
Kerawalapitiya
Kappalturai
Polonnaruwa
Naula
Tissamaharama
Suriyawewa
Nadukuda
Trincomalee
New Chulaw
Katunayake
Kalutara
Panadura
Puttalam
Matugama
Kurunegata
Canyon
Embilipitiya
Matara
LaxapanaWimalasurendra
Victoria
Kotugoda
Kerawalapitiya
Kirindiwela
Padukka
PannipitiyaWellawatta
Kelantissa
Port city
Port
Kollupitiya
Slave Island
Fort
Kotahena
Pettah Kolonnawa
Hunupitiya
Havelocktown
Dehiwala
Ratmalana
Athurugiriya
Battaramulla
Oruwala
SapugaskandaKelaniya
Aniyakanda
Maradana
Pottuvil
Siyambalanduwa
Uma oya
Kandy city
Pannala
Weligama
New habarana
Chemmany
Serunuwara
950
40
50
20
2030
550230
Veyangoda
Kotugoda
Pooneryn
410
30
340
340 Mirigama120
100
160
Kinbathkumbura
240
100
350
Veyangoda
(1)
(1)
Biyagamya
Sri Jayawardanapura
New anuradhapura
Kirindiwela
150
280
290
90540
650
300
580
240
310
20420
210530
600
290
20
310 290
132kV Line
220kV Line
400kV Line
132kV additional cct
220kV additional cct
132kV additional cct
Northern NCRECOLLECTOR
220kV additional cct
132kV additional cct
New 132kV line
New 220kV line
30
0
Polpitiya
Chunnakam
Kilinochchi
Mannar
Vavuniya
Anuradhapura
Sampoor
HabaranaValachchanai
Bowatenna
Ukuwela
Pallokollo
Randenigala
RantembeKotmale
Badulla
Nuwara Eliya
Ampara
Vavunativu
Mahiyangane
Inginiyagala
Monaragala
Kukule
Deniyaya
Ambalangoda
GalleBeliatta
Maho
Puttalam
Madampe
Bolawatta
Kegalle
Horana
SamanalaWema
Balangoda
Ratnapura
Padukka
Hambantota
Pannipitiya
Thulhiriya
Kirindiwela
Kolonnawa
Biyagama
Kerawalapitiya
Kappalturai
Polonnaruwa
Naula
Tissamaharama
Suriyawewa
Nadukuda
Trincomalee
New Chulaw
Katunayake
Kalutara
Panadura
Puttalam
Matugama
Kurunegata
Canyon
Embilipitiya
Matara
LaxapanaWimalasurendra
Victoria
Kotugoda
Kerawalapitiya
Kirindiwela
Padukka
PannipitiyaWellawatta
Kelantissa
Port city
Port
Kollupitiya
Slave Island
Fort
Kotahena
Pettah Kolonnawa
Hunupitiya
Havelocktown
Dehiwala
Ratmalana
Athurugiriya
Battaramulla
Oruwala
SapugaskandaKelaniya
Aniyakanda
Maradana
Pottuvil
Siyambalanduwa
Uma oya
Kandy city
Pannala
Weligama
New habarana
Chemmany
Serunuwara
190
80
100
1390
130
170
170
40100
1300430
Veyangoda
Kotugoda
Pooneryn
300
540870
620
680
50
670 Mirigama330
600
190
Kinbathkumbura
140
150
210
640
230
Veyangoda
290(1)
270
(1)100
(1)370
Biyagamya
Sri Jayawardanapura
160
620
650
New anuradhapura
132kV Line
220kV Line
400kV Line
1
Northern NCRECOLLECTOR
Divided the bus
130
40
660
290
India – Sri Lanka HVDC Interconnection500MW
Polpitiya
New 132kV line
Scenario C Apr.
(Source: JICA Survey Team)
Project on Electricity Sector Master Plan Study in Democratic Socialist Republic of Sri Lanka
Final Report
8-25
Figure 8-10 System Configuration in Scenario C (Power Flow in August 2040)
(Source: JICA Survey Team)
Chunnakam
Kilinochchi
Mannar
Vavuniya
Anuradhapura
Sampoor
HabaranaValachchanai
Bowatenna
Ukuwela
Pallokollo
Randenigala
RantembeKotmale
Badulla
Nuwara Eliya
Ampara
Vavunativu
Mahiyangane
Inginiyagala
Monaragala
Kukule
Deniyaya
Ambalangoda
GalleBeliatta
Maho
Puttalam
Madampe
Bolawatta
Kegalle
Horana
SamanalaWema
Balangoda
Ratnapura
Padukka
Hambantota
Pannipitiya
Thulhiriya
Kolonnawa
Biyagama
Kerawalapitiya
Kappalturai
Polonnaruwa
Naula
Tissamaharama
Suriyawewa
Nadukuda
Trincomalee
New Chulaw
Katunayake
Kalutara
Panadura
Puttalam
Matugama
Kurunegata
Canyon
Embilipitiya
Matara
LaxapanaWimalasurendra
Victoria
Kotugoda
Kerawalapitiya
Kirindiwela
Padukka
PannipitiyaWellawatta
Kelantissa
Port city
Port
Kollupitiya
Slave Island
Fort
Kotahena
Pettah Kolonnawa
Hunupitiya
Havelocktown
Dehiwala
Ratmalana
Athurugiriya
Battaramulla
Oruwala
SapugaskandaKelaniya
Aniyakanda
Maradana
Pottuvil
Siyambalanduwa
Uma oya
Kandy city
Pannala
Weligama
New habarana
Chemmany
Serunuwara
50
260
300
1560
130
240
240
15070
1200370
Veyangoda
Kotugoda
Pooneryn
430
550630
630
930
60
690 Mirigama260
820
260
Kinbathkumbura
220
110
330
660
150
Veyangoda
280340
(1)10
(1)300
Biyagamya
Sri Jayawardanapura
210
550
600
New anuradhapura
Kirindiwela
150
210
260
90
132kV Line
220kV Line
400kV Line
220kV additional cct
132kV additional cct
New 220kV line
Northern NCRECOLLECTOR
220kV additional cct
132kV additional cct
New 132kV line
132kV additional cct
900
430
Polpitiya
New 132kV line
Chunnakam
Kilinochchi
Mannar
Vavuniya
Anuradhapura
Sampoor
HabaranaValachchanai
Bowatenna
Ukuwela
Pallokollo
Randenigala
RantembeKotmale
Badulla
Nuwara Eliya
Ampara
Vavunativu
Mahiyangane
Inginiyagala
Monaragala
Kukule
Deniyaya
Ambalangoda
GalleBeliatta
Maho
Puttalam
Madampe
Bolawatta
Kegalle
Horana
SamanalaWema
Balangoda
Ratnapura
Padukka
Hambantota
Pannipitiya
Thulhiriya
Kirindiwela
Kolonnawa
Biyagama
Kerawalapitiya
Kappalturai
Polonnaruwa
Naula
Tissamaharama
Suriyawewa
Nadukuda
Trincomalee
New Chulaw
Katunayake
Kalutara
Panadura
Puttalam
Matugama
Kurunegata
Canyon
Embilipitiya
Matara
LaxapanaWimalasurendra
Victoria
Kotugoda
Kerawalapitiya
Kirindiwela
Padukka
PannipitiyaWellawatta
Kelantissa
Port city
Port
Kollupitiya
Slave Island
Fort
Kotahena
Pettah Kolonnawa
Hunupitiya
Havelocktown
Dehiwala
Ratmalana
Athurugiriya
Battaramulla
Oruwala
SapugaskandaKelaniya
Aniyakanda
Maradana
Pottuvil
Siyambalanduwa
Uma oya
Kandy city
Pannala
Weligama
New habarana
Chemmany
Serunuwara
190
80
100
1390
130
170
170
40100
1300430
Veyangoda
Kotugoda
Pooneryn
300
540870
620
680
50
670 Mirigama330
600
190
Kinbathkumbura
140
150
210
640
230
Veyangoda
290(1)
270
(1)100
(1)370
Biyagamya
Sri Jayawardanapura
160
620
650
New anuradhapura
132kV Line
220kV Line
400kV Line
1
Northern NCRECOLLECTOR
Divided the bus
130
40
660
290
India – Sri Lanka HVDC Interconnection500MW
Polpitiya
Scenario C Aug.
Project on Electricity Sector Master Plan Study in Democratic Socialist Republic of Sri Lanka
Final Report
8-26
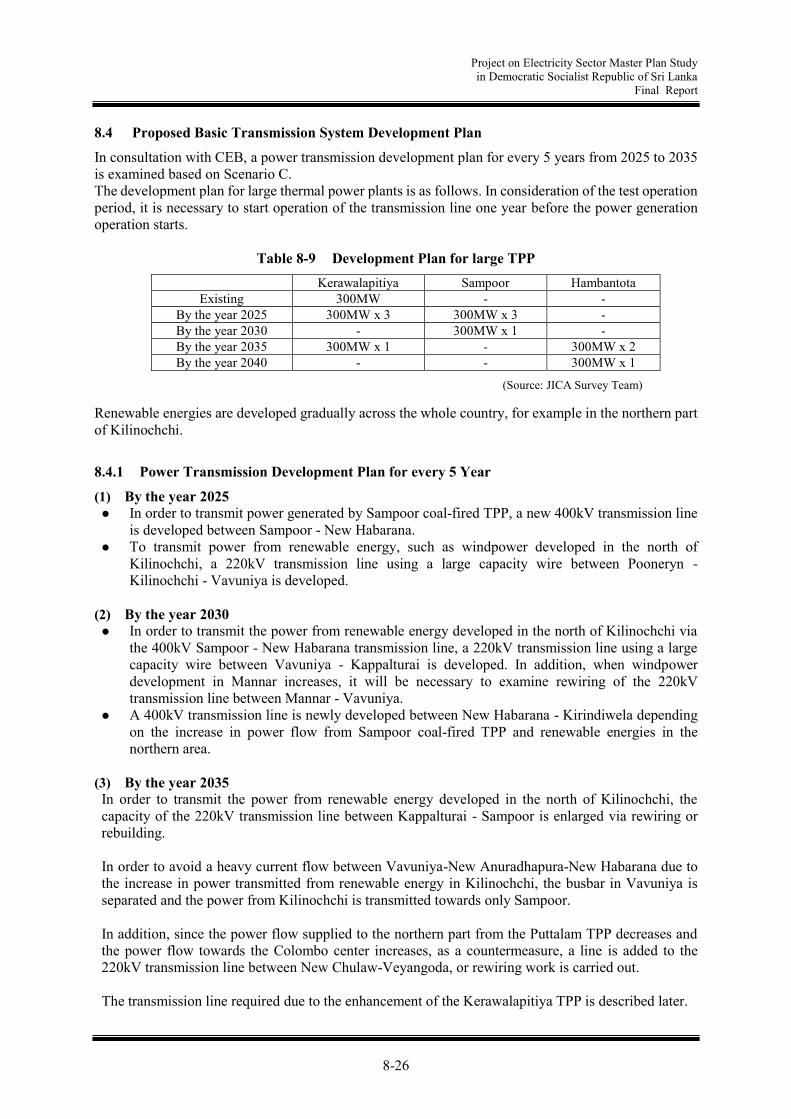
8.4 Proposed Basic Transmission System Development Plan
In consultation with CEB, a power transmission development plan for every 5 years from 2025 to 2035 is examined based on Scenario C. The development plan for large thermal power plants is as follows. In consideration of the test operation period, it is necessary to start operation of the transmission line one year before the power generation operation starts.
Table 8-9 Development Plan for large TPP Kerawalapitiya Sampoor Hambantota
Existing 300MW - - By the year 2025 300MW x 3 300MW x 3 - By the year 2030 - 300MW x 1 - By the year 2035 300MW x 1 - 300MW x 2 By the year 2040 - - 300MW x 1
Renewable energies are developed gradually across the whole country, for example in the northern part of Kilinochchi.
8.4.1 Power Transmission Development Plan for every 5 Year
(1) By the year 2025 In order to transmit power generated by Sampoor coal-fired TPP, a new 400kV transmission line
is developed between Sampoor - New Habarana. To transmit power from renewable energy, such as windpower developed in the north of
Kilinochchi, a 220kV transmission line using a large capacity wire between Pooneryn - Kilinochchi - Vavuniya is developed.
(2) By the year 2030 In order to transmit the power from renewable energy developed in the north of Kilinochchi via
the 400kV Sampoor - New Habarana transmission line, a 220kV transmission line using a large capacity wire between Vavuniya - Kappalturai is developed. In addition, when windpower development in Mannar increases, it will be necessary to examine rewiring of the 220kV transmission line between Mannar - Vavuniya.
A 400kV transmission line is newly developed between New Habarana - Kirindiwela depending on the increase in power flow from Sampoor coal-fired TPP and renewable energies in the northern area.
(3) By the year 2035 In order to transmit the power from renewable energy developed in the north of Kilinochchi, the capacity of the 220kV transmission line between Kappalturai - Sampoor is enlarged via rewiring or rebuilding. In order to avoid a heavy current flow between Vavuniya-New Anuradhapura-New Habarana due to the increase in power transmitted from renewable energy in Kilinochchi, the busbar in Vavuniya is separated and the power from Kilinochchi is transmitted towards only Sampoor.
In addition, since the power flow supplied to the northern part from the Puttalam TPP decreases and the power flow towards the Colombo center increases, as a countermeasure, a line is added to the 220kV transmission line between New Chulaw-Veyangoda, or rewiring work is carried out. The transmission line required due to the enhancement of the Kerawalapitiya TPP is described later.
(Source: JICA Survey Team)

Project on Electricity Sector Master Plan Study in Democratic Socialist Republic of Sri Lanka
Final Report
8-27
Figure 8-11 System Configuration in Scenario C (Power Flow in April 2025)
(Source: JICA Survey Team)
Chunnakam
Kilinochchi
Mannar
Vavuniya
Anuradhapura
Sampoor
HabaranaValachchanai
Bowatenna
Ukuwela
Pallokollo
Randenigala
RantembeKotmale
Badulla
Nuwara Eliya
Ampara
Vavunativu
Mahiyangane
Inginiyagala
Monaragala
Kukule
Deniyaya
Ambalangoda
GalleBeliatta
Maho
Puttalam
Madampe
Bolawatta
Kegalle
Horana
SamanalaWema
Balangoda
Ratnapura
Padukka
Hambantota
Pannipitiya
Thulhiriya
Kirindiwela
Kolonnawa
Biyagama
Kerawalapitiya
Kappalturai
Polonnaruwa
Naula
Tissamaharama
Suriyawewa
Nadukuda
Trincomalee
New Chulaw
Katunayake
Kalutara
Panadura
Puttalam
Matugama
Kurunegata
Canyon
Embilipitiya
Matara
LaxapanaWimalasurendra
Victoria
Kotugoda
Kerawalapitiya
Kirindiwela
Padukka
PannipitiyaWellawatta
Kelantissa
Port city
Port
Kollupitiya
Slave Island
Fort
Kotahena
Pettah Kolonnawa
Hunupitiya
Havelocktown
Dehiwala
Ratmalana
Athurugiriya
Battaramulla
Oruwala
SapugaskandaKelaniya
Aniyakanda
Maradana
Pottuvil
Siyambalanduwa
Uma oya
Kandy city
Pannala
Weligama
New habarana
New anuradhapura
Chemmany
Serunuwara210
300
780
8
0
70
50
250310
Veyangoda
Kotugoda
Northern NCRECOLLECTOR
Pooneryn
230
180
180
430
70
0
310
380 Mirigama240
40
200
Kinbathkumbura
320
350
300
310
240
Veyangoda
170(1)
190
(1)120
(1)60
Biyagamya
Sri Jayawardanapura
200
220
310
20
(1)
132kV Line
220kV Line
400kV LineLL-ACSR D.C.
200
90
Polpitiya
80
Chunnakam
Kilinochchi
Mannar
Vavuniya
Anuradhapura
Sampoor
HabaranaValachchanai
Bowatenna
Ukuwela
Pallokollo
Randenigala
RantembeKotmale
Badulla
Nuwara Eliya
Ampara
Vavunativu
Mahiyangane
Inginiyagala
Monaragala
Kukule
Deniyaya
Ambalangoda
GalleBeliatta
Maho
Puttalam
Madampe
Bolawatta
Kegalle
Horana
SamanalaWema
Balangoda
Ratnapura
Padukka
Hambantota
Pannipitiya
Thulhiriya
Kirindiwela
Kolonnawa
Biyagama
Kerawalapitiya
Kappalturai
Polonnaruwa
Naula
Tissamaharama
Suriyawewa
Nadukuda
Trincomalee
New Chulaw
Katunayake
Kalutara
Panadura
Puttalam
Matugama
Kurunegata
Canyon
Embilipitiya
Matara
LaxapanaWimalasurendra
Victoria
Kotugoda
Kerawalapitiya
Kirindiwela
Padukka
PannipitiyaWellawatta
Kelantissa
Port city
Port
Kollupitiya
Slave Island
Fort
Kotahena
Pettah Kolonnawa
Hunupitiya
Havelocktown
Dehiwala
Ratmalana
Athurugiriya
Battaramulla
Oruwala
SapugaskandaKelaniya
Aniyakanda
Maradana
Pottuvil
Siyambalanduwa
Uma oya
Kandy city
Pannala
Weligama
New habarana
Chemmany
Serunuwara
190
80
100
1390
130
170
170
40100
1300430
Veyangoda
Kotugoda
Pooneryn
300
540870
620
680
50
670 Mirigama330
600
190
Kinbathkumbura
140
150
210
640
230
Veyangoda
290(1)
270
(1)100
(1)370
Biyagamya
Sri Jayawardanapura
160
620
650
New anuradhapura
132kV Line
220kV Line
400kV Line
1
Northern NCRECOLLECTOR
Divided the bus
130
40
660
290
India – Sri Lanka HVDC Interconnection500MW
Polpitiya

Project on Electricity Sector Master Plan Study in Democratic Socialist Republic of Sri Lanka
Final Report
8-28
Figure 8-12 System Configuration in Scenario C (Power Flow in August 2025)
(Source: JICA Survey Team)
Chunnakam
Kilinochchi
Mannar
Vavuniya
Anuradhapura
Sampoor
HabaranaValachchanai
Bowatenna
Ukuwela
Pallokollo
Randenigala
RantembeKotmale
Badulla
Nuwara Eliya
Ampara
Vavunativu
Mahiyangane
Inginiyagala
Monaragala
Kukule
Deniyaya
Ambalangoda
GalleBeliatta
Maho
Puttalam
Madampe
Bolawatta
Kegalle
Horana
SamanalaWema
Balangoda
Ratnapura
Padukka
Hambantota
Pannipitiya
Thulhiriya
Kirindiwela
Kolonnawa
Biyagama
Kerawalapitiya
Kappalturai
Polonnaruwa
Naula
Tissamaharama
Suriyawewa
Nadukuda
Trincomalee
New Chulaw
Katunayake
Kalutara
Panadura
Puttalam
Matugama
Kurunegata
Canyon
Embilipitiya
Matara
LaxapanaWimalasurendra
Victoria
Kotugoda
Kerawalapitiya
Kirindiwela
Padukka
PannipitiyaWellawatta
Kelantissa
Port city
Port
Kollupitiya
Slave Island
Fort
Kotahena
Pettah Kolonnawa
Hunupitiya
Havelocktown
Dehiwala
Ratmalana
Athurugiriya
Battaramulla
Oruwala
SapugaskandaKelaniya
Aniyakanda
Maradana
Pottuvil
Siyambalanduwa
Uma oya
Kandy city
Pannala
Weligama
New habarana
New anuradhapura
Chemmany
Serunuwara300
300
760
130
170
170
170
380340
Veyangoda
Kotugoda
Northern NCRECOLLECTOR
Pooneryn
330
240
240
540
3
4
200
550 Mirigama270
40
0
Kinbathkumbura
120
340
160
330
380
Veyangoda
190(1)
190
(1)140
(1)40
Biyagamya
Sri Jayawardanapura
260
150
320
2
(1)
132kV Line
220kV Line
400kV LineLL-ACSR D.C.
200
90
Polpitiya
220
Chunnakam
Kilinochchi
Mannar
Vavuniya
Anuradhapura
Sampoor
HabaranaValachchanai
Bowatenna
Ukuwela
Pallokollo
Randenigala
RantembeKotmale
Badulla
Nuwara Eliya
Ampara
Vavunativu
Mahiyangane
Inginiyagala
Monaragala
Kukule
Deniyaya
Ambalangoda
GalleBeliatta
Maho
Puttalam
Madampe
Bolawatta
Kegalle
Horana
SamanalaWema
Balangoda
Ratnapura
Padukka
Hambantota
Pannipitiya
Thulhiriya
Kirindiwela
Kolonnawa
Biyagama
Kerawalapitiya
Kappalturai
Polonnaruwa
Naula
Tissamaharama
Suriyawewa
Nadukuda
Trincomalee
New Chulaw
Katunayake
Kalutara
Panadura
Puttalam
Matugama
Kurunegata
Canyon
Embilipitiya
Matara
LaxapanaWimalasurendra
Victoria
Kotugoda
Kerawalapitiya
Kirindiwela
Padukka
PannipitiyaWellawatta
Kelantissa
Port city
Port
Kollupitiya
Slave Island
Fort
Kotahena
Pettah Kolonnawa
Hunupitiya
Havelocktown
Dehiwala
Ratmalana
Athurugiriya
Battaramulla
Oruwala
SapugaskandaKelaniya
Aniyakanda
Maradana
Pottuvil
Siyambalanduwa
Uma oya
Kandy city
Pannala
Weligama
New habarana
Chemmany
Serunuwara
190
80
100
1390
130
170
170
40100
1300430
Veyangoda
Kotugoda
Pooneryn
300
540870
620
680
50
670 Mirigama330
600
190
Kinbathkumbura
140
150
210
640
230
Veyangoda
290(1)
270
(1)100
(1)370
Biyagamya
Sri Jayawardanapura
160
620
650
New anuradhapura
132kV Line
220kV Line
400kV Line
1
Northern NCRECOLLECTOR
Divided the bus
130
40
660
290
India – Sri Lanka HVDC Interconnection500MW
Polpitiya
Project on Electricity Sector Master Plan Study in Democratic Socialist Republic of Sri Lanka
Final Report
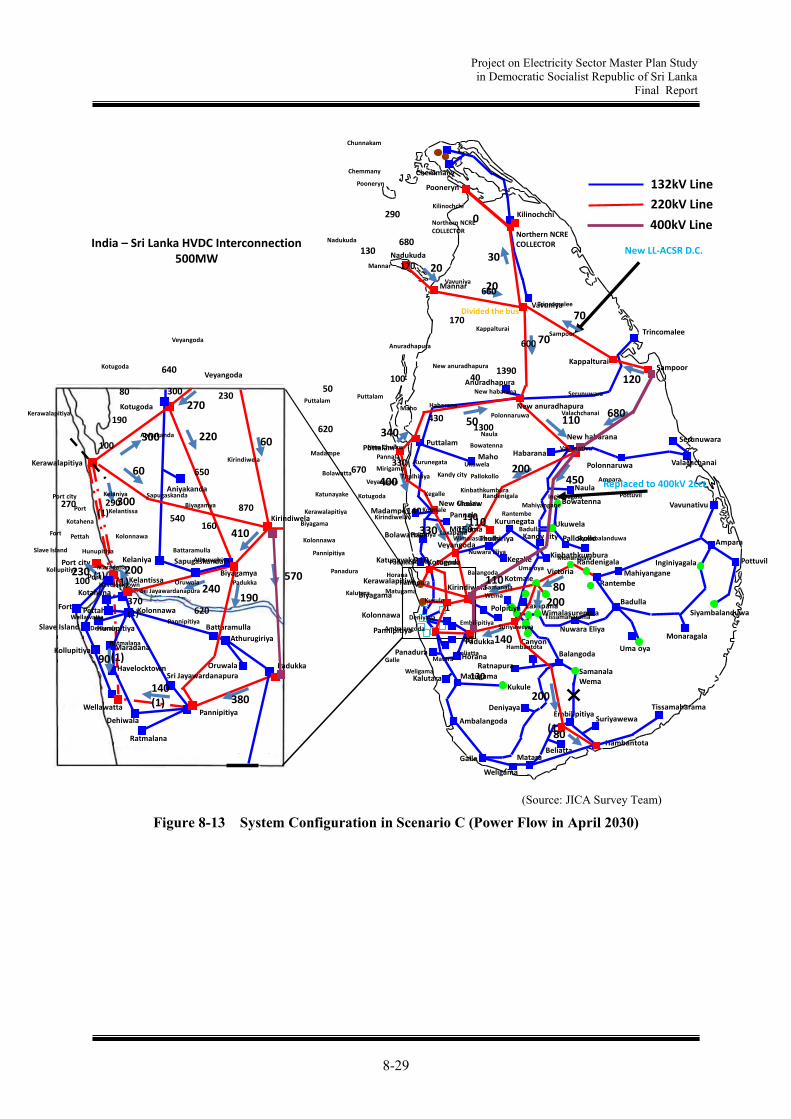
8-29
Figure 8-13 System Configuration in Scenario C (Power Flow in April 2030)
(Source: JICA Survey Team)
Kilinochchi
Mannar
Vavuniya
Anuradhapura
Sampoor
HabaranaValachchanai
Bowatenna
Ukuwela
Pallokollo
Randenigala
RantembeKotmale
Badulla
Nuwara Eliya
Ampara
Vavunativu
Mahiyangane
Inginiyagala
Monaragala
Kukule
Deniyaya
Ambalangoda
GalleBeliatta
Maho
Puttalam
Madampe
Bolawatta
Kegalle
Horana
SamanalaWema
Balangoda
Ratnapura
Padukka
Hambantota
Pannipitiya
Thulhiriya
Kirindiwela
Kolonnawa
Biyagama
Kerawalapitiya
Kappalturai
Polonnaruwa
Naula
Tissamaharama
Suriyawewa
Nadukuda
Trincomalee
New Chulaw
Katunayake
Kalutara
Panadura
Puttalam
Matugama
Kurunegata
Canyon
Embilipitiya
Matara
LaxapanaWimalasurendra
Victoria
Kotugoda
Kerawalapitiya
Kirindiwela
Padukka
PannipitiyaWellawatta
Kelantissa
Port city
Port
Kollupitiya
Slave Island
Fort
Kotahena
Pettah Kolonnawa
Hunupitiya
Havelocktown
Dehiwala
Ratmalana
Athurugiriya
Battaramulla
Oruwala
SapugaskandaKelaniya
Aniyakanda
Maradana
Pottuvil
Siyambalanduwa
Uma oya
Kandy city
Pannala
Weligama
New habarana
Chemmany
Serunuwara300
300
680
20
20
70
11050
450200
Veyangoda
Kotugoda
Pooneryn
220
240570
400
30
340
330 Mirigama110
120
80
Kinbathkumbura
200
140
270
60
Veyangoda
200(1)
230
(1)90
(1)140
Biyagamya
Sri Jayawardanapura
190
380
410
New anuradhapura
(1)
132kV Line
220kV Line
400kV Line
110
200
Replaced to 400kV 2cct
Northern NCRECOLLECTOR
New LL-ACSR D.C.
0
70
80
Polpitiya
60
Chunnakam
Kilinochchi
Mannar
Vavuniya
Anuradhapura
Sampoor
HabaranaValachchanai
Bowatenna
Ukuwela
Pallokollo
Randenigala
RantembeKotmale
Badulla
Nuwara Eliya
Ampara
Vavunativu
Mahiyangane
Inginiyagala
Monaragala
Kukule
Deniyaya
Ambalangoda
GalleBeliatta
Maho
Puttalam
Madampe
Bolawatta
Kegalle
Horana
SamanalaWema
Balangoda
Ratnapura
Padukka
Hambantota
Pannipitiya
Thulhiriya
Kirindiwela
Kolonnawa
Biyagama
Kerawalapitiya
Kappalturai
Polonnaruwa
Naula
Tissamaharama
Suriyawewa
Nadukuda
Trincomalee
New Chulaw
Katunayake
Kalutara
Panadura
Puttalam
Matugama
Kurunegata
Canyon
Embilipitiya
Matara
LaxapanaWimalasurendra
Victoria
Kotugoda
Kerawalapitiya
Kirindiwela
Padukka
PannipitiyaWellawatta
Kelantissa
Port city
Port
Kollupitiya
Slave Island
Fort
Kotahena
Pettah Kolonnawa
Hunupitiya
Havelocktown
Dehiwala
Ratmalana
Athurugiriya
Battaramulla
Oruwala
SapugaskandaKelaniya
Aniyakanda
Maradana
Pottuvil
Siyambalanduwa
Uma oya
Kandy city
Pannala
Weligama
New habarana
Chemmany
Serunuwara
190
80
100
1390
130
170
170
40100
1300430
Veyangoda
Kotugoda
Pooneryn
300
540870
620
680
50
670 Mirigama330
600
190
Kinbathkumbura
140
150
210
640
230
Veyangoda
290(1)
270
(1)100
(1)370
Biyagamya
Sri Jayawardanapura
160
620
650
New anuradhapura
132kV Line
220kV Line
400kV Line
1
Northern NCRECOLLECTOR
Divided the bus
130
40
660
290
India – Sri Lanka HVDC Interconnection500MW
Polpitiya

Project on Electricity Sector Master Plan Study in Democratic Socialist Republic of Sri Lanka
Final Report
8-30
Figure 8-14 System Configuration in Scenario C (Power Flow in August 2030)
(Source: JICA urvey Team)
Chunnakam
Kilinochchi
Mannar
Vavuniya
Anuradhapura
Sampoor
HabaranaValachchanai
Bowatenna
Ukuwela
Pallokollo
Randenigala
RantembeKotmale
Badulla
Nuwara Eliya
Ampara
Vavunativu
Mahiyangane
Inginiyagala
Monaragala
Kukule
Deniyaya
Ambalangoda
GalleBeliatta
Maho
Puttalam
Madampe
Bolawatta
Kegalle
Horana
SamanalaWema
Balangoda
Ratnapura
Padukka
Hambantota
Pannipitiya
Thulhiriya
Kirindiwela
Kolonnawa
Biyagama
Kerawalapitiya
Kappalturai
Polonnaruwa
Naula
Tissamaharama
Suriyawewa
Nadukuda
Trincomalee
New Chulaw
Katunayake
Kalutara
Panadura
Puttalam
Matugama
Kurunegata
Canyon
Embilipitiya
Matara
LaxapanaWimalasurendra
Victoria
Kotugoda
Kerawalapitiya
Kirindiwela
Padukka
PannipitiyaWellawatta
Kelantissa
Port city
Port
Kollupitiya
Slave Island
Fort
Kotahena
Pettah Kolonnawa
Hunupitiya
Havelocktown
Dehiwala
Ratmalana
Athurugiriya
Battaramulla
Oruwala
SapugaskandaKelaniya
Aniyakanda
Maradana
Pottuvil
Siyambalanduwa
Uma oya
Kandy city
Pannala
Weligama
New habarana
Chemmany
Serunuwara190
300
860
130
240
370
330
760270
Kotugoda
Pooneryn
250
290610
510
290
70
530 Mirigama190
110
130
Kinbathkumbura
160
110
400
190
Veyangoda
180(1)
220
(1)70
(1)160
Biyagamya
Sri Jayawardanapura
190
400
440
New anuradhapura
Veyangoda
30
(1)
132kV Line
220kV Line
400kV Line
Replaced to 400kV 2cct
50
100
Northern NCRECOLLECTOR
New LL-ACSR D.C.
140
160
30
Polpitiya
10
Chunnakam
Kilinochchi
Mannar
Vavuniya
Anuradhapura
Sampoor
HabaranaValachchanai
Bowatenna
Ukuwela
Pallokollo
Randenigala
RantembeKotmale
Badulla
Nuwara Eliya
Ampara
Vavunativu
Mahiyangane
Inginiyagala
Monaragala
Kukule
Deniyaya
Ambalangoda
GalleBeliatta
Maho
Puttalam
Madampe
Bolawatta
Kegalle
Horana
SamanalaWema
Balangoda
Ratnapura
Padukka
Hambantota
Pannipitiya
Thulhiriya
Kirindiwela
Kolonnawa
Biyagama
Kerawalapitiya
Kappalturai
Polonnaruwa
Naula
Tissamaharama
Suriyawewa
Nadukuda
Trincomalee
New Chulaw
Katunayake
Kalutara
Panadura
Puttalam
Matugama
Kurunegata
Canyon
Embilipitiya
Matara
LaxapanaWimalasurendra
Victoria
Kotugoda
Kerawalapitiya
Kirindiwela
Padukka
PannipitiyaWellawatta
Kelantissa
Port city
Port
Kollupitiya
Slave Island
Fort
Kotahena
Pettah Kolonnawa
Hunupitiya
Havelocktown
Dehiwala
Ratmalana
Athurugiriya
Battaramulla
Oruwala
SapugaskandaKelaniya
Aniyakanda
Maradana
Pottuvil
Siyambalanduwa
Uma oya
Kandy city
Pannala
Weligama
New habarana
Chemmany
Serunuwara
190
80
100
1390
130
170
170
40100
1300430
Veyangoda
Kotugoda
Pooneryn
300
540870
620
680
50
670 Mirigama330
600
190
Kinbathkumbura
140
150
210
640
230
Veyangoda
290(1)
270
(1)100
(1)370
Biyagamya
Sri Jayawardanapura
160
620
650
New anuradhapura
132kV Line
220kV Line
400kV Line
1
Northern NCRECOLLECTOR
Divided the bus
130
40
660
290
India – Sri Lanka HVDC Interconnection500MW
Polpitiya

Project on Electricity Sector Master Plan Study in Democratic Socialist Republic of Sri Lanka
Final Report
8-31
Figure 8-15 System Configuration in Scenario C (Power Flow in April 2035)
(Source: JICA Survey Team)
Chunnakam
Kilinochchi
Mannar
Vavuniya
Anuradhapura
Sampoor
HabaranaValachchanai
Bowatenna
Ukuwela
Pallokollo
Randenigala
RantembeKotmale
Badulla
Nuwara Eliya
Ampara
Vavunativu
Mahiyangane
Inginiyagala
Monaragala
Kukule
Deniyaya
Ambalangoda
GalleBeliatta
Maho
Puttalam
Madampe
Bolawatta
Kegalle
Horana
SamanalaWema
Balangoda
Ratnapura
Padukka
Hambantota
Pannipitiya
Thulhiriya
Kirindiwela
Kolonnawa
Biyagama
Kerawalapitiya
Kappalturai
Polonnaruwa
Naula
Tissamaharama
Suriyawewa
Nadukuda
Trincomalee
New Chulaw
Katunayake
Kalutara
Panadura
Puttalam
Matugama
Kurunegata
Canyon
Embilipitiya
Matara
LaxapanaWimalasurendra
Victoria
Kotugoda
Kerawalapitiya
Kirindiwela
Padukka
PannipitiyaWellawatta
Kelantissa
Port city
Port
Kollupitiya
Slave Island
Fort
Kotahena
Pettah Kolonnawa
Hunupitiya
Havelocktown
Dehiwala
Ratmalana
Athurugiriya
Battaramulla
Oruwala
SapugaskandaKelaniya
Aniyakanda
Maradana
Pottuvil
Siyambalanduwa
Uma oya
Kandy city
Pannala
Weligama
New habarana
Chemmany
Serunuwara
130
450
300
970
30
40
40
104
580220
Veyangoda
Kotugoda
Pooneryn
340
450680
440
20
300
370 Mirigama130
80
260
Kinbathkumbura
200
260
250
310
70
Veyangoda
210(1)
270
(1)20
(1)250
Biyagamya
Sri Jayawardanapura
220
470
560
New anuradhapura
Replace to LL-ACSR D.C.or Additional cct
132kV Line
220kV Line
400kV Line
Open 132kV Line
132kV additional cct
120
Northern NCRECOLLECTOR
132kV additional cctNew 220kV line
Divided the bus
110
5
20
0
220kV additional cct
Polpitiya
Chunnakam
Kilinochchi
Mannar
Vavuniya
Anuradhapura
Sampoor
HabaranaValachchanai
Bowatenna
Ukuwela
Pallokollo
Randenigala
RantembeKotmale
Badulla
Nuwara Eliya
Ampara
Vavunativu
Mahiyangane
Inginiyagala
Monaragala
Kukule
Deniyaya
Ambalangoda
GalleBeliatta
Maho
Puttalam
Madampe
Bolawatta
Kegalle
Horana
SamanalaWema
Balangoda
Ratnapura
Padukka
Hambantota
Pannipitiya
Thulhiriya
Kirindiwela
Kolonnawa
Biyagama
Kerawalapitiya
Kappalturai
Polonnaruwa
Naula
Tissamaharama
Suriyawewa
Nadukuda
Trincomalee
New Chulaw
Katunayake
Kalutara
Panadura
Puttalam
Matugama
Kurunegata
Canyon
Embilipitiya
Matara
LaxapanaWimalasurendra
Victoria
Kotugoda
Kerawalapitiya
Kirindiwela
Padukka
PannipitiyaWellawatta
Kelantissa
Port city
Port
Kollupitiya
Slave Island
Fort
Kotahena
Pettah Kolonnawa
Hunupitiya
Havelocktown
Dehiwala
Ratmalana
Athurugiriya
Battaramulla
Oruwala
SapugaskandaKelaniya
Aniyakanda
Maradana
Pottuvil
Siyambalanduwa
Uma oya
Kandy city
Pannala
Weligama
New habarana
Chemmany
Serunuwara
190
80
100
1390
130
170
170
40100
1300430
Veyangoda
Kotugoda
Pooneryn
300
540870
620
680
50
670 Mirigama330
600
190
Kinbathkumbura
140
150
210
640
230
Veyangoda
290(1)
270
(1)100
(1)370
Biyagamya
Sri Jayawardanapura
160
620
650
New anuradhapura
132kV Line
220kV Line
400kV Line
1
Northern NCRECOLLECTOR
Divided the bus
130
40
660
290
India – Sri Lanka HVDC Interconnection500MW
Polpitiya

Project on Electricity Sector Master Plan Study in Democratic Socialist Republic of Sri Lanka
Final Report
8-32
Figure 8-16 System Configuration in Scenario C (Power Flow in August 2035)
(Source: JICA Survey Team)
Chunnakam
Kilinochchi
Mannar
Vavuniya
Anuradhapura
Sampoor
HabaranaValachchanai
Bowatenna
Ukuwela
Pallokollo
Randenigala
RantembeKotmale
Badulla
Nuwara Eliya
Ampara
Vavunativu
Mahiyangane
Inginiyagala
Monaragala
Kukule
Deniyaya
Ambalangoda
GalleBeliatta
Maho
Puttalam
Madampe
Bolawatta
Kegalle
Horana
SamanalaWema
Balangoda
Ratnapura
Padukka
Hambantota
Pannipitiya
Thulhiriya
Kirindiwela
Kolonnawa
Biyagama
Kerawalapitiya
Kappalturai
Polonnaruwa
Naula
Tissamaharama
Suriyawewa
Nadukuda
Trincomalee
New Chulaw
Katunayake
Kalutara
Panadura
Puttalam
Matugama
Kurunegata
Canyon
Embilipitiya
Matara
LaxapanaWimalasurendra
Victoria
Kotugoda
Kerawalapitiya
Kirindiwela
Padukka
PannipitiyaWellawatta
Kelantissa
Port city
Port
Kollupitiya
Slave Island
Fort
Kotahena
Pettah Kolonnawa
Hunupitiya
Havelocktown
Dehiwala
Ratmalana
Athurugiriya
Battaramulla
Oruwala
SapugaskandaKelaniya
Aniyakanda
Maradana
Pottuvil
Siyambalanduwa
Uma oya
Kandy city
Pannala
Weligama
New habarana
Chemmany
Serunuwara
40
220
300
1390
130
170
170
11030
1010340
Veyangoda
Kotugoda
Pooneryn
310
460750
580
680
2
610 Mirigama240
600
160
Kinbathkumbura
110
130
200
500
210
Veyangoda
190(1)
270
(1)1
(1)270
Biyagamya
Sri Jayawardanapura
230
510
590
New anuradhapura
132kV Line
220kV Line
400kV Line
132kV additional cct
10
Northern NCRECOLLECTOR
Open 132kV Line
New 220kV line
Replace to LL-ACSR D.C.or Additional cct
132kV additional cct
Divided the bus
130
60
660
290
220kV additional cct
Polpitiya
Chunnakam
Kilinochchi
Mannar
Vavuniya
Anuradhapura
Sampoor
HabaranaValachchanai
Bowatenna
Ukuwela
Pallokollo
Randenigala
RantembeKotmale
Badulla
Nuwara Eliya
Ampara
Vavunativu
Mahiyangane
Inginiyagala
Monaragala
Kukule
Deniyaya
Ambalangoda
GalleBeliatta
Maho
Puttalam
Madampe
Bolawatta
Kegalle
Horana
SamanalaWema
Balangoda
Ratnapura
Padukka
Hambantota
Pannipitiya
Thulhiriya
Kirindiwela
Kolonnawa
Biyagama
Kerawalapitiya
Kappalturai
Polonnaruwa
Naula
Tissamaharama
Suriyawewa
Nadukuda
Trincomalee
New Chulaw
Katunayake
Kalutara
Panadura
Puttalam
Matugama
Kurunegata
Canyon
Embilipitiya
Matara
LaxapanaWimalasurendra
Victoria
Kotugoda
Kerawalapitiya
Kirindiwela
Padukka
PannipitiyaWellawatta
Kelantissa
Port city
Port
Kollupitiya
Slave Island
Fort
Kotahena
Pettah Kolonnawa
Hunupitiya
Havelocktown
Dehiwala
Ratmalana
Athurugiriya
Battaramulla
Oruwala
SapugaskandaKelaniya
Aniyakanda
Maradana
Pottuvil
Siyambalanduwa
Uma oya
Kandy city
Pannala
Weligama
New habarana
Chemmany
Serunuwara
190
80
100
1390
130
170
170
40100
1300430
Veyangoda
Kotugoda
Pooneryn
300
540870
620
680
50
670 Mirigama330
600
190
Kinbathkumbura
140
150
210
640
230
Veyangoda
290(1)
270
(1)100
(1)370
Biyagamya
Sri Jayawardanapura
160
620
650
New anuradhapura
132kV Line
220kV Line
400kV Line
1
Northern NCRECOLLECTOR
Divided the bus
130
40
660
290
India – Sri Lanka HVDC Interconnection500MW
Polpitiya

Project on Electricity Sector Master Plan Study in Democratic Socialist Republic of Sri Lanka
Final Report
8-33
8.4.2 System Status when the Output of a large Power Plant is the Maximum
The power plants of Kerawalapitiya, Hambantota, and Sampoor are far away in the west, the south, and the east of the national land, and when their respective outputs are at maximum, the output of other power plants is suppressed, and the power flow changes dramatically. Therefore, the impact of the power flow on the whole system is examined in each case. The simulation results are shown below.
Table 8-10 System Status when the Output of a large Power Plant is at Maximum
The place where the overloading under normal conditions occurs is between Biyagama and Kotugoda. As shown in the results of the examination of the transmission line around the Kerawalapitiya power station described later, it is possible to cope with this issue by increasing line capacity. In addition, 220kV Kelanitissa-Biyagama, and 132kV Weligama-Matara are overloaded at N-1 contingency. Regarding these sections, measures must be taken in terms of by increasing line capacity, constructing a new line, or operation by limiting the maximum output of the abovementioned power plants.
8.4.3 Fault Current
The three-phase short circuit fault currents of the 400kV and 220kV buses of the Sri Lanka electric power system in Scenario C are shown in Table 8-11. Calculations are carried out under the following conditions. Automatic sequencing fault calculation function of PSSE is used. Impedance of the generator is set to the subtransient reactance Xd'', and the voltage behind the
generator is calculated at 1 PU. All generators installed in the system in each year are being operated. In each year, the three phase short circuit fault current is within the specified 40kA or less. The maximum value is 39.9kA for the Kirindiwela 220kV bus in 2040, which is just under 40kA. However, in fact, since all of the installed generators do not operate at the same time, it is sufficiently below 40 kA, and there is no problem. The maximum value of the three phase short circuit fault current of the 132kV bus is 27.6kA at the Kolonawa bus bar in 2030. Therefore, the fault current for the Sri Lanka system is at a level where there is no problem.
(Source: JICA Survey Team)

Project on Electricity Sector Master Plan Study in Democratic Socialist Republic of Sri Lanka
Final Report
8-34
Table 8-11 Three-Phase Short Circuit Fault Currents in the Sri Lanka System
(Source: JICA Survey Team)
2025 2030 2035 2040 2025 2030 2035 2040
KIRIND-4 400 10.4 16.7 18.5 19.4 MIRI-D1 220 18.3 21.3 23.0 24.0
NEWHAB 400 9.4 14.8 15.8 16.3 MIRIGAMA-2 220 18.5 21.5 23.2 24.2
PADUKKA 400 10.2 15.3 16.9 17.8 NADUKUDA-2 220 5.1 6.1 6.3 5.8
PSPP400 400 - 15.9 17.1 17.7 NCHILAW-2 220 16.2 21.8 23.4 24.3
SAMPOOR 400 8.8 12.5 14.0 14.2 N-COLLECT 220 5.4 8.4 12.2 11.5
AMBALANGODA 220 - - 7.3 15.9 NEWANU-2 220 13.6 19.6 21.9 20.4
BIYAG-2 220 23.4 29.6 33.0 34.6 NEW-POLP 2 220 20.5 24.1 26.2 26.7
COL_K_220 220 19.4 23.5 25.4 27.1 NHAB-2 220 18.5 24.7 26.4 26.8
COL-L-2 220 20.2 24.4 26.3 28.6 PADUKKA-2 220 20.4 27.1 29.7 32.7
EMBILIPITIYA 220 6.6 9.9 14.0 15.9 PANNI-2 220 21.1 26.7 29.2 30.9
HAMBA-2 220 5.5 9.3 16.5 19.9 POONERYN 220 4.6 7.0 9.9 10.2
KALLADI 220 17.1 20.1 21.0 21.5 PORT CITY R1 220 19.9 24.0 25.9 28.1
KAPPAL-1 220 6.5 7.3 13.3 11.6 PUTTALAM-PS 220 18.4 21.4 22.3 22.7
KELAN-2 220 21.3 26.0 28.3 29.9 RAGALA_IB-2 220 17.7 19.2 20.1 20.5
KERAWALA_2 220 17.5 20.3 21.5 23.0 RANDE-2 220 13.1 14.2 14.7 15.0
KERAWALA_3 220 18.2 20.5 32.3 33.5 RANTE-2 220 13.2 14.3 14.8 15.1
KILINOCHCHI 220 5.4 8.4 12.2 11.5 SAMPOOR-1 220 10.0 12.2 16.0 17.5
KIRIND-2 220 24.0 32.2 38.4 39.9 UDAHA-2 220 19.9 24.5 26.6 28.1
KOTADENIY-2 220 12.9 14.3 15.1 15.5 UPPER-KOTH-2 220 14.9 15.7 16.4 16.5
KOTMA-2 220 23.4 25.6 27.6 28.1 VADAMARA 220 4.3 6.0 7.7 7.4
KOTUG-2 220 22.6 27.2 32.3 35.1 VAUNIYA-2 220 8.7 12.1 16.9 10.2
MANNAR S 220 4.7 5.6 5.8 5.3 VEYAN-2 220 24.0 29.9 33.6 36.0
MANNAR-2 220 5.7 7.1 7.5 6.6 VICTO-2 220 16.7 18.1 18.9 19.2
Bus NameVltage
(kV)
YearBus Name
Vltage
(kV)
YearVoltage Voltage

Project on Electricity Sector Master Plan Study in Democratic Socialist Republic of Sri Lanka
Final Report
8-35
8.4.4 System Stability at major Transmission Line Accident
(1) Stability of power system (a) Stability
An electric power system is required to be able to continue to supply stable power even if a disturbance such as a transmission line fault occurs in the system. Generators are required to continue operation while maintaining synchronization. After the clearance of the fault by the protection relay, the output and rotation speed of the generator, which will fluctuate due to the disturbance, usually converges to the value before the fault via the synchronizing power of the power system. However, for long-distance transmission lines that do not have a sufficient number of lines and voltage for the power flow, the reactance of the transmission line increases, the internal phase angle of the generator widens, and the synchronization power is not maintained. Even after the disturbance is stopped, the synchronous operation of the generator may not be recovered. In this case, the generator causes a step-out phenomenon and is separated from the electric power system in order to protect it. In this section, the stability of the power system model in Sri Lanka is calculated. Stability analysis is generally carried out by simulating the situation after occurrence of a three-phase short circuit fault of a transmission line for a few seconds. Specifically, after releasing the fault transmission line and clearing the fault at a specified time, it is checked whether or not vibrations such as the active power output and the internal phase angle of the generator have been eliminated.
(b) General response of synchronous generators during a system failure When a short circuit fault or a ground fault occurs in the transmission line near the generator, the surrounding voltage instantaneously drops and the active power output of the connected generator becomes almost zero. While the fault continues, the active power output becomes zero, but the generator is accelerated by the continuously supplied input energy. When the fault is cleared by the system’s protection relays, the system voltage recovers instantaneously and power is again supplied from the generator. At this time, due to the acceleration of the generator, the internal phase angle of the generator widens, and active power that is larger than that before the occurrence of the fault is output. After the clearance of the fault, the fluctuation of the output continues, but usually it will fall within the output before the occurrence of the fault, due to the synchronizing power of the generator and the power system.
Figure 8-17 Response of Synchronous Generators during a System Failure
(c) General response of windpower and solar power generators during a system failure
Solar power generators and almost all windpower generators are connected to a system via an AC/DC converter. If the AC voltage drops to nearly zero due to a fault in the power system or the like, the AC/DC converter stops because it cannot convert the power. However, when the fault on the AC side
Output before fault occurs
Clearance of fault (0.1s)
Output immediately after fault occurs
Output during fault occurrence: 0
Output after restoration of fault
Occurrence of fault
(Source: JICA Survey Team)

Project on Electricity Sector Master Plan Study in Democratic Socialist Republic of Sri Lanka
Final Report
8-36
is cleared and the voltage returns, the operation starts again and it normally returns to the original operation state. The figure below shows examples of fluctuations in active power (red line) and reactive power (green line) for solar power generation during a system failure. The restoration of output power is carried out after some time to protect the AC/DC converter. Immediately after the system failure, the voltage approaches nearly zero and the active power output becomes zero, but after the clearance of the fault, the active power output is restored in about 0.3 to 0.4 seconds. In addition, the reactive power is close to zero during normal operation, but shows a large value immediately after recovery of the voltage of the power system, after the clearance of the failure.
Figure 8-18 Response of Solar Power Generators during a System Failure
(2) Conditions of the stability analysis for Sri Lankan power system Stability analysis is carried out under the following conditions. Study scenario and year: Scenario C, the years of 2035 and 2040 Status of fault: three-phase short circuit fault at a single circuit of a transmission line Clearance of fault: 1 circuit section opening, clearance time: 0.1 seconds, reclosing: none Duration of simulation: 5 seconds after occurrence of fault System analysis tool: PSS/E ver 33.5 Generator models: The following models provided by CEB
Thermal unit: synchronous generator, cylindrical rotor model, AVR, Governor Hydro unit: synchronous generator, salient pole rotor model, AVR, governor Windpower, solar power: generator with AC/DC convertor
For a synchronous generator whose model is unknown, or biomass-fired TPP, a classical model using only inertial constants is used.
Occurrence of fault Clearance of
fault (0.1s)
Restoration of output (0.5s)
Red line: Active power Green line: Reactive power
(Source: JICA Survey Team)

Project on Electricity Sector Master Plan Study in Democratic Socialist Republic of Sri Lanka
Final Report
8-37
(3) Faulty section setting for the stability analysis At the section of the 400kV and 220kV transmission line shown in the following figure, the fault shown under the above conditions is set and the stability in each case is evaluated.
Figure 8-19 Faulty Section setting for the Stability Analysis
Kilinochchi
Mannar
Vavuniya 1
Anuradhapura
Sampoor
Habarana
Kappalturai
Nadukuda
Puttalam
New Chulaw
Veyangoda
Vavuniya 2
PSPP
Kirindiwela
Padukka
Ambalangoda
Embilipitiya
Hambantota
Mirigama
Polpitiya
Kotmale
[3] [7]
[1]
[2]
[5]
[4] [8]
[9]
[10]
[11]
[12]
[13]
[6]
(Source: JICA Survey Team)

Project on Electricity Sector Master Plan Study in Democratic Socialist Republic of Sri Lanka
Final Report
8-38
(4) Stability on the bulk power system in 2035 In each single contingency of sections [1] - [13], the stability of the system can be maintained in either case. Stability analysis results are shown in the table and the figure below.
Table 8-12 Stability on the Bulk Power System in 2035
No. Voltage From To Stability at single contingency
[1] 220 Kilinochchi Vavuniya 2 Stable [2] 220 Vavuniya 2 Kappalturai Stable [3] 400 Sampoor Habarana Stable [4] 400 Habarana PSPP Stable [5] 400 PSPP Kirindiwela Stable [6] 220 Vavuniya 1 Anuradhapura Stable [7] 220 Anuradhapura Puttalam Stable [8] 220 Puttalam New Chulaw Stable [9] 220 Anuradhapura Habarana Stable
[10] 220 Habarana Mirigama Stable [11] 220 Kotmale Kirindiwela Stable [12] 220 Polpitiya Embilipitiya Stable [13] 220 Hambantota Ambalangoda Stable
Figure 8-20 Fluctuation of Output at each single contingency of sections [1] - [13] in 2035 (Left: Sampoor TPP, Right: Puttalam TPP)
(5) Stability on the bulk power system in 2040 System stability cannot be maintained at a single contingency in section [1] or [2]. Stability analysis results are shown in the table and the figure below.
(Source: JICA Survey Team)
(Source: JICA Survey Team)

Project on Electricity Sector Master Plan Study in Democratic Socialist Republic of Sri Lanka
Final Report
8-39
Table 8-13 Stability on the Bulk Power System in 2040 No. Voltage From To Stability at single contingency [1] 220 Kilinochchi Vavuniya 2 Unstable (Oscillation instability) [2] 220 Vavuniya 2 Kappalturai Short period oscillation continuation [3] 400 Sampoor Habarana Stable [4] 400 Habarana PSPP Stable [5] 400 PSPP Kirindiwela Stable [6] 220 Vavuniya 1 Anuradhapura Stable [7] 220 Anuradhapura Puttalam Stable [8] 220 Puttalam New Chulaw Stable [9] 220 Anuradhapura Habarana Stable
[10] 220 Habarana Mirigama Stable [11] 220 Kotmale Kirindiwela Stable [12] 220 Polpitiya Embilipitiya Stable [13] 220 Hambantota Ambalangoda Stable
Figure 8-21 Stability when Fault occurs in Section [1] or [2] in 2040 (Output of Sampoor TPP, No. 1 Unit)
Figure 8-22 Stability when Fault occurs in Sections other than [1] or [2] in 2040 (Output of Sampoor TPP, No. 1 Unit)
If the power flow calculation is carried out under the conditions that one line of section [1] or [2] is disconnected, no convergent solution can be obtained in either case. For this reason, even if judged
When fault occurs in Section [1] When fault occurs in Section [2]
(Source: JICA Survey Team)
(Source: JICA Survey Team)
(Source: JICA Survey Team)
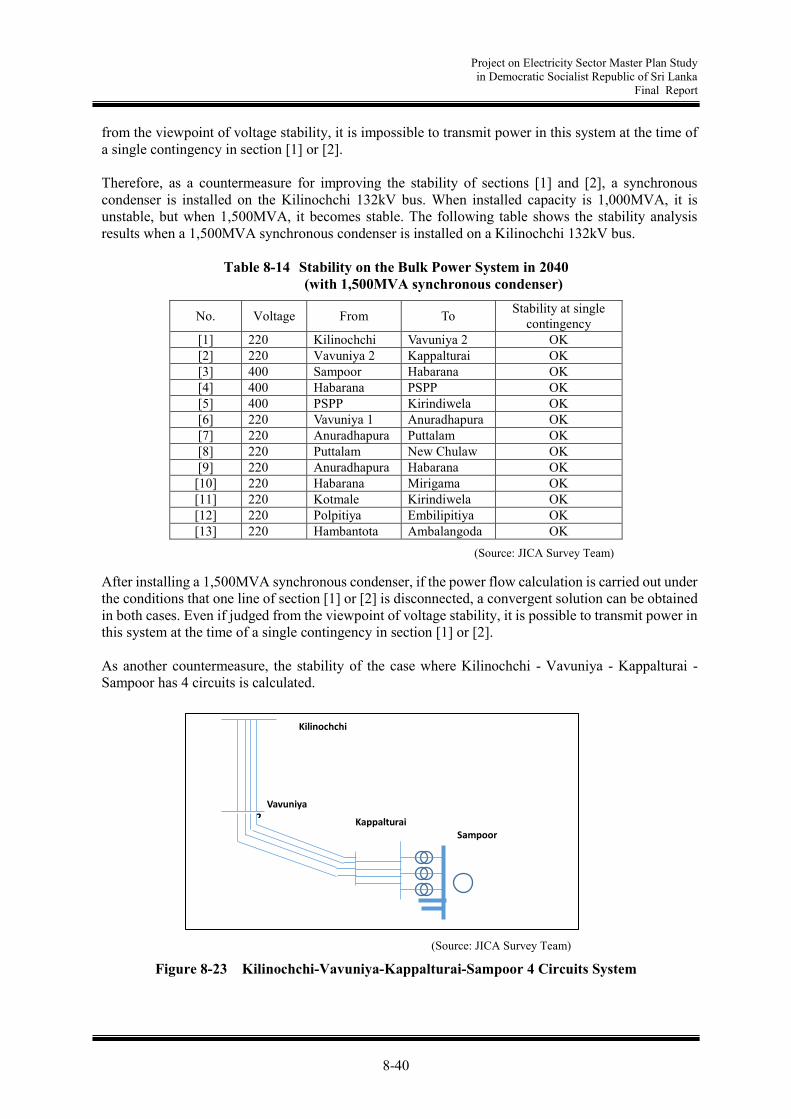
Project on Electricity Sector Master Plan Study in Democratic Socialist Republic of Sri Lanka
Final Report
8-40
from the viewpoint of voltage stability, it is impossible to transmit power in this system at the time of a single contingency in section [1] or [2]. Therefore, as a countermeasure for improving the stability of sections [1] and [2], a synchronous condenser is installed on the Kilinochchi 132kV bus. When installed capacity is 1,000MVA, it is unstable, but when 1,500MVA, it becomes stable. The following table shows the stability analysis results when a 1,500MVA synchronous condenser is installed on a Kilinochchi 132kV bus.
Table 8-14 Stability on the Bulk Power System in 2040 (with 1,500MVA synchronous condenser)
No. Voltage From To Stability at single contingency
[1] 220 Kilinochchi Vavuniya 2 OK [2] 220 Vavuniya 2 Kappalturai OK [3] 400 Sampoor Habarana OK [4] 400 Habarana PSPP OK [5] 400 PSPP Kirindiwela OK [6] 220 Vavuniya 1 Anuradhapura OK [7] 220 Anuradhapura Puttalam OK [8] 220 Puttalam New Chulaw OK [9] 220 Anuradhapura Habarana OK
[10] 220 Habarana Mirigama OK [11] 220 Kotmale Kirindiwela OK [12] 220 Polpitiya Embilipitiya OK [13] 220 Hambantota Ambalangoda OK
After installing a 1,500MVA synchronous condenser, if the power flow calculation is carried out under the conditions that one line of section [1] or [2] is disconnected, a convergent solution can be obtained in both cases. Even if judged from the viewpoint of voltage stability, it is possible to transmit power in this system at the time of a single contingency in section [1] or [2]. As another countermeasure, the stability of the case where Kilinochchi - Vavuniya - Kappalturai - Sampoor has 4 circuits is calculated.
Figure 8-23 Kilinochchi-Vavuniya-Kappalturai-Sampoor 4 Circuits System
Kilinochchi
Sampoor Kappalturai
Vavuniya 2
(Source: JICA Survey Team)
(Source: JICA Survey Team)

Project on Electricity Sector Master Plan Study in Democratic Socialist Republic of Sri Lanka
Final Report
8-41
Stability analysis results are shown in the table and the figure below. It becomes stable at the time of single contingency in all sections, [1] to [13].
Table 8-15 Stability on the Bulk Power System in 2040 (with Kilinochchi-Vavuniya 2-Kappalturai-Sampoor 4 circuits)
No. Voltage From To Stability at single contingency
[1] 220 Kilinochchi Vavuniya 2 OK [2] 220 Vavuniya 2 Kappalturai OK [3] 400 Sampoor Habarana OK [4] 400 Habarana PSPP OK [5] 400 PSPP Kirindiwela OK [6] 220 Vavuniya 1 Anuradhapura OK [7] 220 Anuradhapura Puttalam OK [8] 220 Puttalam New Chulaw OK [9] 220 Anuradhapura Habarana OK
[10] 220 Habarana Mirigama OK [11] 220 Kotmale Kirindiwela OK [12] 220 Polpitiya Embilipitiya OK [13] 220 Hambantota Ambalangoda OK
Figure 8-24 Stability with Kilinochchi-Vavuniya 2-Kappalturai-Sampoor 4 Circuits in 2040 (Output of Sampoor TPP)
After installing an additional 2 circuits, if the power flow calculation is carried out under the conditions that one line of section [1] or [2] is disconnected, a convergent solution can be obtained in both cases. Even if judged from the viewpoint of voltage stability, it is possible to transmit power in this system at the time of a single contingency in section [1] or [2].
(6) Conclusion Stability of the power system until 2035 is maintained at the time of a single line fault. In 2040, the stability of the power system is maintained during a single line fault in sections
other than the northern Kilinochchi-Vavuniya 2 and Vavuniya 2-Kappalturai. In 2040, power flow from the northern Kilinochchi area is large, and it becomes unstable during
a single line fault at Kilinochchi-Vavuniya 2, or Vavuniya 2-Kappalturai. In 2040, it is necessary to improve the stability in the north of Kilinochchi, and the following
measures are possible. With any of the following measures, the stability of the electric power
(Source: JICA Survey Team)
(Source: JICA Survey Team)

Project on Electricity Sector Master Plan Study in Democratic Socialist Republic of Sri Lanka
Final Report
8-42
system in 2040 is maintained during a single line fault in all sections of the 400kV, 220kV transmission line. Two routes (4 circuits) of transmission line between Kilinochchi-Vavuniya 2-Kappalturai-
Sampoor are installed. A 1,500MVA synchronous condenser is installed on a Kilinochchi 132kV bus.
Considering the system stability at the time of a transmission line fault, in the case of installing two routes of transmission line between Kilinochchi-Vavuniya 2-Kappalturai-Sampoor, the system diagram in 2040 in Scenario C is as follows.
Figure 8-25 System Configuration in Scenario C after Consideration of System Stability (Power Flow in April 2040)
(Source: JICA Survey Team)
Chunnakam
Kilinochchi
Mannar
Vavuniya
Anuradhapura
Sampoor
HabaranaValachchanai
Bowatenna
Ukuwela
Pallokollo
Randenigala
RantembeKotmale
Badulla
Nuwara Eliya
Ampara
Vavunativu
Mahiyangane
Inginiyagala
Monaragala
Kukule
Deniyaya
Ambalangoda
GalleBeliatta
Maho
Puttalam
Madampe
Bolawatta
Kegalle
Horana
SamanalaWema
Balangoda
Ratnapura
Padukka
Hambantota
Pannipitiya
Thulhiriya
Kolonnawa
Biyagama
Kerawalapitiya
Kappalturai
Polonnaruwa
Naula
Tissamaharama
Suriyawewa
Nadukuda
Trincomalee
New Chulaw
Katunayake
Kalutara
Panadura
Puttalam
Matugama
Kurunegata
Canyon
Embilipitiya
Matara
LaxapanaWimalasurendra
Victoria
Kotugoda
Kerawalapitiya
Kirindiwela
Padukka
PannipitiyaWellawatta
Kelantissa
Port city
Port
Kollupitiya
Slave Island
Fort
Kotahena
Pettah Kolonnawa
Hunupitiya
Havelocktown
Dehiwala
Ratmalana
Athurugiriya
Battaramulla
Oruwala
SapugaskandaKelaniya
Aniyakanda
Maradana
Pottuvil
Siyambalanduwa
Uma oya
Kandy city
Pannala
Weligama
New habarana
Chemmany
Serunuwara
950
40
50
20
2030
550230
Veyangoda
Kotugoda
Pooneryn
410
30
340
340 Mirigama120
100
160
Kinbathkumbura
240
100
350
Veyangoda
(1)
(1)
Biyagamya
Sri Jayawardanapura
New anuradhapura
Kirindiwela
150
280
290
90540
650
300
580
240
310
20420
210530
600
290
20
310 290
132kV Line
220kV Line
400kV Line
132kV additional cct
220kV additional cct
132kV additional cct
Northern NCRECOLLECTOR
220kV additional cct
132kV additional cct
New 132kV line
New 220kV line
30
0
Polpitiya
Chunnakam
Kilinochchi
Mannar
Vavuniya
Anuradhapura
Sampoor
HabaranaValachchanai
Bowatenna
Ukuwela
Pallokollo
Randenigala
RantembeKotmale
Badulla
Nuwara Eliya
Ampara
Vavunativu
Mahiyangane
Inginiyagala
Monaragala
Kukule
Deniyaya
Ambalangoda
GalleBeliatta
Maho
Puttalam
Madampe
Bolawatta
Kegalle
Horana
SamanalaWema
Balangoda
Ratnapura
Padukka
Hambantota
Pannipitiya
Thulhiriya
Kirindiwela
Kolonnawa
Biyagama
Kerawalapitiya
Kappalturai
Polonnaruwa
Naula
Tissamaharama
Suriyawewa
Nadukuda
Trincomalee
New Chulaw
Katunayake
Kalutara
Panadura
Puttalam
Matugama
Kurunegata
Canyon
Embilipitiya
Matara
LaxapanaWimalasurendra
Victoria
Kotugoda
Kerawalapitiya
Kirindiwela
Padukka
PannipitiyaWellawatta
Kelantissa
Port city
Port
Kollupitiya
Slave Island
Fort
Kotahena
Pettah Kolonnawa
Hunupitiya
Havelocktown
Dehiwala
Ratmalana
Athurugiriya
Battaramulla
Oruwala
SapugaskandaKelaniya
Aniyakanda
Maradana
Pottuvil
Siyambalanduwa
Uma oya
Kandy city
Pannala
Weligama
New habarana
Chemmany
Serunuwara
190
80
100
1390
130
170
170
40100
1300430
Veyangoda
Kotugoda
Pooneryn
300
540870
620
680
50
670 Mirigama330
600
190
Kinbathkumbura
140
150
210
640
230
Veyangoda
290(1)
270
(1)100
(1)370
Biyagamya
Sri Jayawardanapura
160
620
650
New anuradhapura
132kV Line
220kV Line
400kV Line
1
Northern NCRECOLLECTOR
Divided the bus
130
40
660
290
India – Sri Lanka HVDC Interconnection500MW
Polpitiya
New 132kV line

Project on Electricity Sector Master Plan Study in Democratic Socialist Republic of Sri Lanka
Final Report
8-43
Figure 8-26 System Configuration in Scenario C after Consideration of System Stability (Power Flow in August 2040)
Scenario C Aug.
(Source: JICA Survey Team)
Chunnakam
Kilinochchi
Mannar
Vavuniya
Anuradhapura
Sampoor
HabaranaValachchanai
Bowatenna
Ukuwela
Pallokollo
Randenigala
RantembeKotmale
Badulla
Nuwara Eliya
Ampara
Vavunativu
Mahiyangane
Inginiyagala
Monaragala
Kukule
Deniyaya
Ambalangoda
GalleBeliatta
Maho
Puttalam
Madampe
Bolawatta
Kegalle
Horana
SamanalaWema
Balangoda
Ratnapura
Padukka
Hambantota
Pannipitiya
Thulhiriya
Kolonnawa
Biyagama
Kerawalapitiya
Kappalturai
Polonnaruwa
Naula
Tissamaharama
Suriyawewa
Nadukuda
Trincomalee
New Chulaw
Katunayake
Kalutara
Panadura
Puttalam
Matugama
Kurunegata
Canyon
Embilipitiya
Matara
LaxapanaWimalasurendra
Victoria
Kotugoda
Kerawalapitiya
Kirindiwela
Padukka
PannipitiyaWellawatta
Kelantissa
Port city
Port
Kollupitiya
Slave Island
Fort
Kotahena
Pettah Kolonnawa
Hunupitiya
Havelocktown
Dehiwala
Ratmalana
Athurugiriya
Battaramulla
Oruwala
SapugaskandaKelaniya
Aniyakanda
Maradana
Pottuvil
Siyambalanduwa
Uma oya
Kandy city
Pannala
Weligama
New habarana
Chemmany
Serunuwara
50
260
300
1560
130
240
240
15070
1200370
Veyangoda
Kotugoda
Pooneryn
430
550630
630
930
60
690 Mirigama260
820
260
Kinbathkumbura
220
110
330
660
150
Veyangoda
280340
(1)10
(1)300
Biyagamya
Sri Jayawardanapura
210
550
600
New anuradhapura
Kirindiwela
150
210
260
90
132kV Line
220kV Line
400kV Line
132kV additional cct
New 220kV line
Northern NCRECOLLECTOR
220kV additional cct
132kV additional cct
New 132kV line
132kV additional cct
900
430
Polpitiya
Chunnakam
Kilinochchi
Mannar
Vavuniya
Anuradhapura
Sampoor
HabaranaValachchanai
Bowatenna
Ukuwela
Pallokollo
Randenigala
RantembeKotmale
Badulla
Nuwara Eliya
Ampara
Vavunativu
Mahiyangane
Inginiyagala
Monaragala
Kukule
Deniyaya
Ambalangoda
GalleBeliatta
Maho
Puttalam
Madampe
Bolawatta
Kegalle
Horana
SamanalaWema
Balangoda
Ratnapura
Padukka
Hambantota
Pannipitiya
Thulhiriya
Kirindiwela
Kolonnawa
Biyagama
Kerawalapitiya
Kappalturai
Polonnaruwa
Naula
Tissamaharama
Suriyawewa
Nadukuda
Trincomalee
New Chulaw
Katunayake
Kalutara
Panadura
Puttalam
Matugama
Kurunegata
Canyon
Embilipitiya
Matara
LaxapanaWimalasurendra
Victoria
Kotugoda
Kerawalapitiya
Kirindiwela
Padukka
PannipitiyaWellawatta
Kelantissa
Port city
Port
Kollupitiya
Slave Island
Fort
Kotahena
Pettah Kolonnawa
Hunupitiya
Havelocktown
Dehiwala
Ratmalana
Athurugiriya
Battaramulla
Oruwala
SapugaskandaKelaniya
Aniyakanda
Maradana
Pottuvil
Siyambalanduwa
Uma oya
Kandy city
Pannala
Weligama
New habarana
Chemmany
Serunuwara
190
80
100
1390
130
170
170
40100
1300430
Veyangoda
Kotugoda
Pooneryn
300
540870
620
680
50
670 Mirigama330
600
190
Kinbathkumbura
140
150
210
640
230
Veyangoda
290(1)
270
(1)100
(1)370
Biyagamya
Sri Jayawardanapura
160
620
650
New anuradhapura
132kV Line
220kV Line
400kV Line
1
Northern NCRECOLLECTOR
Divided the bus
130
40
660
290
India – Sri Lanka HVDC Interconnection500MW
Polpitiya
New 132kV line
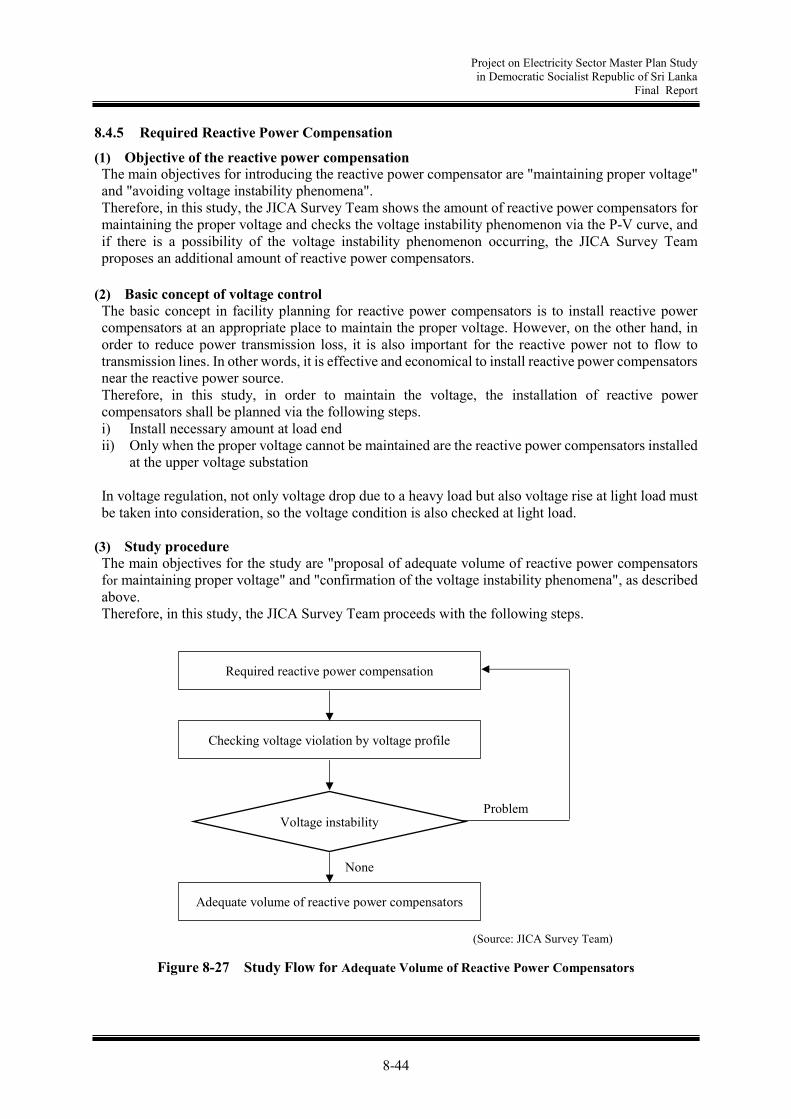
Project on Electricity Sector Master Plan Study in Democratic Socialist Republic of Sri Lanka
Final Report
8-44
8.4.5 Required Reactive Power Compensation
(1) Objective of the reactive power compensation The main objectives for introducing the reactive power compensator are "maintaining proper voltage" and "avoiding voltage instability phenomena". Therefore, in this study, the JICA Survey Team shows the amount of reactive power compensators for maintaining the proper voltage and checks the voltage instability phenomenon via the P-V curve, and if there is a possibility of the voltage instability phenomenon occurring, the JICA Survey Team proposes an additional amount of reactive power compensators.
(2) Basic concept of voltage control The basic concept in facility planning for reactive power compensators is to install reactive power compensators at an appropriate place to maintain the proper voltage. However, on the other hand, in order to reduce power transmission loss, it is also important for the reactive power not to flow to transmission lines. In other words, it is effective and economical to install reactive power compensators near the reactive power source. Therefore, in this study, in order to maintain the voltage, the installation of reactive power compensators shall be planned via the following steps. i) Install necessary amount at load end ii) Only when the proper voltage cannot be maintained are the reactive power compensators installed
at the upper voltage substation In voltage regulation, not only voltage drop due to a heavy load but also voltage rise at light load must be taken into consideration, so the voltage condition is also checked at light load.
(3) Study procedure The main objectives for the study are "proposal of adequate volume of reactive power compensators for maintaining proper voltage" and "confirmation of the voltage instability phenomena", as described above. Therefore, in this study, the JICA Survey Team proceeds with the following steps.
Figure 8-27 Study Flow for Adequate Volume of Reactive Power Compensators
Required reactive power compensation
Checking voltage violation by voltage profile
Voltage instability
Adequate volume of reactive power compensators
Problem
None
(Source: JICA Survey Team)
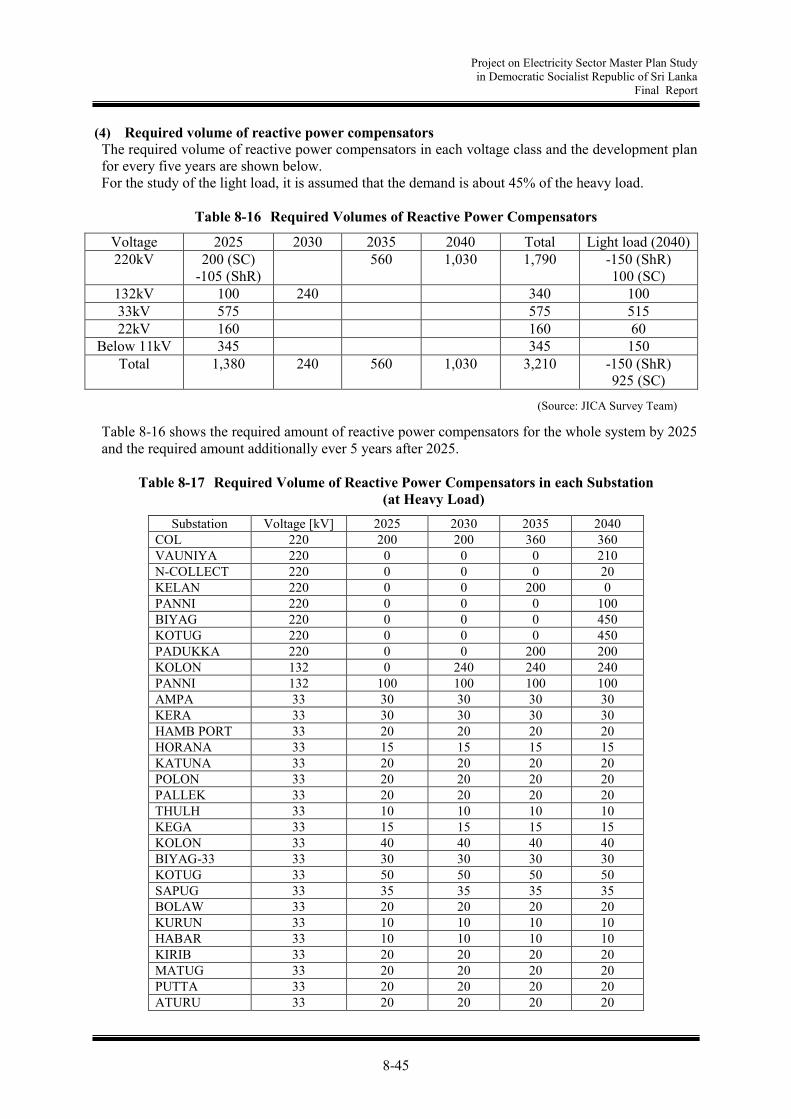
Project on Electricity Sector Master Plan Study in Democratic Socialist Republic of Sri Lanka
Final Report
8-45
(4) Required volume of reactive power compensators The required volume of reactive power compensators in each voltage class and the development plan for every five years are shown below. For the study of the light load, it is assumed that the demand is about 45% of the heavy load.
Table 8-16 Required Volumes of Reactive Power Compensators
Voltage 2025 2030 2035 2040 Total Light load (2040) 220kV 200 (SC)
-105 (ShR) 560 1,030 1,790 -150 (ShR)
100 (SC) 132kV 100 240 340 100 33kV 575 575 515 22kV 160 160 60
Below 11kV 345 345 150 Total 1,380 240 560 1,030 3,210 -150 (ShR)
925 (SC) Table 8-16 shows the required amount of reactive power compensators for the whole system by 2025 and the required amount additionally ever 5 years after 2025.
Table 8-17 Required Volume of Reactive Power Compensators in each Substation (at Heavy Load)
Substation Voltage [kV] 2025 2030 2035 2040 COL 220 200 200 360 360 VAUNIYA 220 0 0 0 210 N-COLLECT 220 0 0 0 20 KELAN 220 0 0 200 0 PANNI 220 0 0 0 100 BIYAG 220 0 0 0 450 KOTUG 220 0 0 0 450 PADUKKA 220 0 0 200 200 KOLON 132 0 240 240 240 PANNI 132 100 100 100 100 AMPA 33 30 30 30 30 KERA 33 30 30 30 30 HAMB PORT 33 20 20 20 20 HORANA 33 15 15 15 15 KATUNA 33 20 20 20 20 POLON 33 20 20 20 20 PALLEK 33 20 20 20 20 THULH 33 10 10 10 10 KEGA 33 15 15 15 15 KOLON 33 40 40 40 40 BIYAG-33 33 30 30 30 30 KOTUG 33 50 50 50 50 SAPUG 33 35 35 35 35 BOLAW 33 20 20 20 20 KURUN 33 10 10 10 10 HABAR 33 10 10 10 10 KIRIB 33 20 20 20 20 MATUG 33 20 20 20 20 PUTTA 33 20 20 20 20 ATURU 33 20 20 20 20
(Source: JICA Survey Team)

Project on Electricity Sector Master Plan Study in Democratic Socialist Republic of Sri Lanka
Final Report
8-46
Substation Voltage [kV] 2025 2030 2035 2040 PANAD 33 20 20 20 20 K-NIYA 33 20 20 20 20 AMBALA 33 10 10 10 10 PANNAL 33 20 20 20 20 ANIYA 33 20 20 20 20 GALLE 33 30 30 30 30 PORT CITY R 22 160 160 160 160 COL 11 305 305 305 305 GALLE 5.9 40 40 40 40 Total 1,380 1,620 2,180 3,210
Table 8-18 Required Volume of Reactive Power Compensators in each Substation (at Light Load)
Substation Voltage [kV] 2040 KOTMA 220 -150 VAUNIYA 220 90 N-COLLECT 220 10 PANNI 132 100 KERA 33 10 HAMB PORT 33 5 THULH 33 10 KURUN 33 10 HABAR 33 10 AMBALA 33 10 HORANA 33 15 POLON 33 15 KEGA 33 15 KATUNA 33 20 PALLEK 33 20 KOLON 33 40 KOTU_NEW 33 20 BOLAW 33 20 KIRIB 33 20 MATUG 33 20 PUTTA 33 20 ATURU 33 20 PANAD 33 20 K-NIYA 33 20 PANNAL 33 20 ANIYA 33 20 AMPA 33 25 BIYAG 33 20 KOTUG 33 30 GALLE 33 25 SAPUG 33 35 PORT CITY R1 22 30 PORT CITY R2 22 30 COL 11 150
Total -150 (ShR), 925 (SC)
(Source: JICA Survey Team)
(Source: JICA Survey Team)
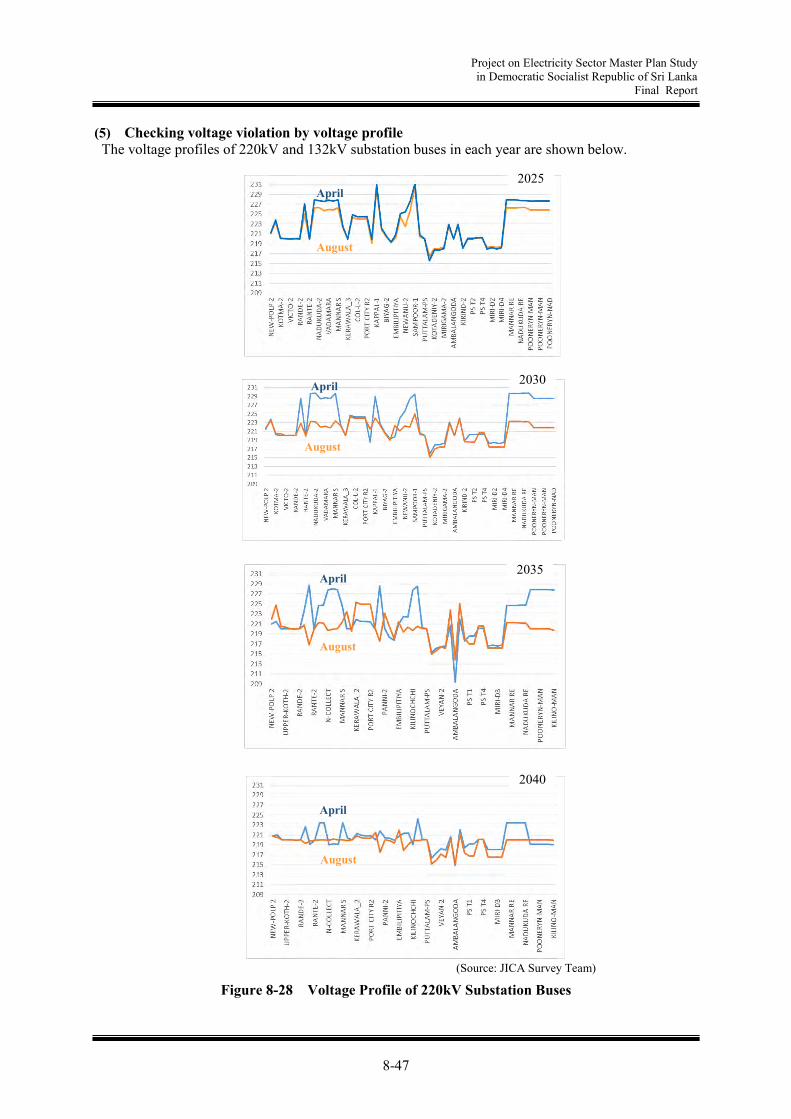
Project on Electricity Sector Master Plan Study in Democratic Socialist Republic of Sri Lanka
Final Report
8-47
(5) Checking voltage violation by voltage profile The voltage profiles of 220kV and 132kV substation buses in each year are shown below.
Figure 8-28 Voltage Profile of 220kV Substation Buses
April
August
2025
April
August
2030
April
August
2035
April
August
2040
(Source: JICA Survey Team)

Project on Electricity Sector Master Plan Study in Democratic Socialist Republic of Sri Lanka
Final Report
8-48
Figure 8-29 Voltage Profile of 132kV Substation Buses
(6) Confirmation of voltage instability phenomenon Voltage instability phenomenon on a 132kV bus is analyzed via the P-V curve. In creating the P-V curve, a method to uniformly increase the total load being carried out at TEPCO is used.
April
August
2025
April
August
2030
April
August
2035
April
August
2040
(Source: JICA Survey Team)

Project on Electricity Sector Master Plan Study in Democratic Socialist Republic of Sri Lanka
Final Report
8-49
Here, the cases of a typical 132kV busbar in the Colombo, South and Central areas are studied as an example. The voltage instability phenomenon occurs due to a rapid increase of demand in a short time (about several hours) with an insufficient amount of reactive power compensators, and voltage instability is evaluated by the P-margin. In this study, the P-margin in 2025 is smaller than in the other years, but even a substation with a small P-margin has a P-margin of about 1.6GW, which is 40% of the whole demand (4GW). In general, it can be considered that the maximum demand does not rise by as much as 40% in about several hours. Therefore, there is sufficient P-margin in 2025 and it can be considered that the voltage instability phenomenon will not occur.
Figure 8-30 Typical 132kV Substations
(Source: JICA Survey Team)

Project on Electricity Sector Master Plan Study in Democratic Socialist Republic of Sri Lanka
Final Report
8-50
(a) 2025 (b) 2040
Figure 8-31 P-V curve at 132kV Busbar in each Substation
マージン P-Margin
Critical point
(Source: JICA Survey Team)
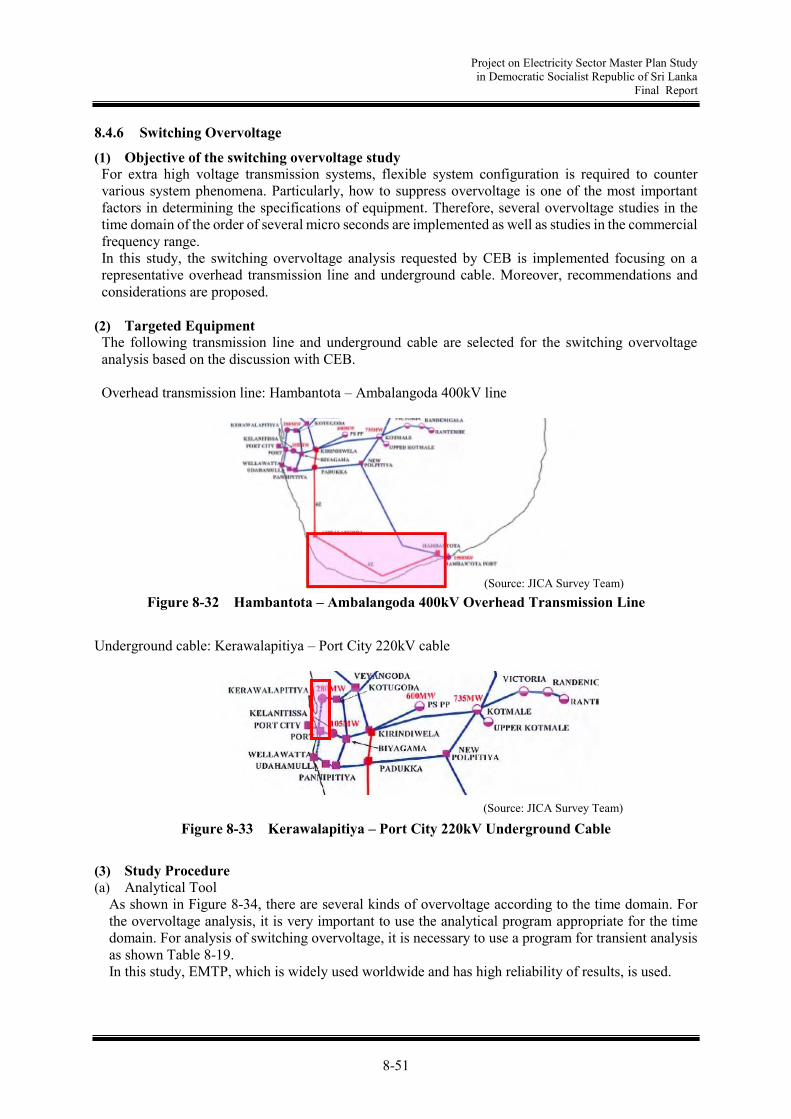
Project on Electricity Sector Master Plan Study in Democratic Socialist Republic of Sri Lanka
Final Report
8-51
8.4.6 Switching Overvoltage
(1) Objective of the switching overvoltage study For extra high voltage transmission systems, flexible system configuration is required to counter various system phenomena. Particularly, how to suppress overvoltage is one of the most important factors in determining the specifications of equipment. Therefore, several overvoltage studies in the time domain of the order of several micro seconds are implemented as well as studies in the commercial frequency range. In this study, the switching overvoltage analysis requested by CEB is implemented focusing on a representative overhead transmission line and underground cable. Moreover, recommendations and considerations are proposed.
(2) Targeted Equipment The following transmission line and underground cable are selected for the switching overvoltage analysis based on the discussion with CEB. Overhead transmission line: Hambantota – Ambalangoda 400kV line
Figure 8-32 Hambantota – Ambalangoda 400kV Overhead Transmission Line
Underground cable: Kerawalapitiya – Port City 220kV cable
Figure 8-33 Kerawalapitiya – Port City 220kV Underground Cable
(3) Study Procedure (a) Analytical Tool
As shown in Figure 8-34, there are several kinds of overvoltage according to the time domain. For the overvoltage analysis, it is very important to use the analytical program appropriate for the time domain. For analysis of switching overvoltage, it is necessary to use a program for transient analysis as shown Table 8-19. In this study, EMTP, which is widely used worldwide and has high reliability of results, is used.
(Source: JICA Survey Team)
(Source: JICA Survey Team)
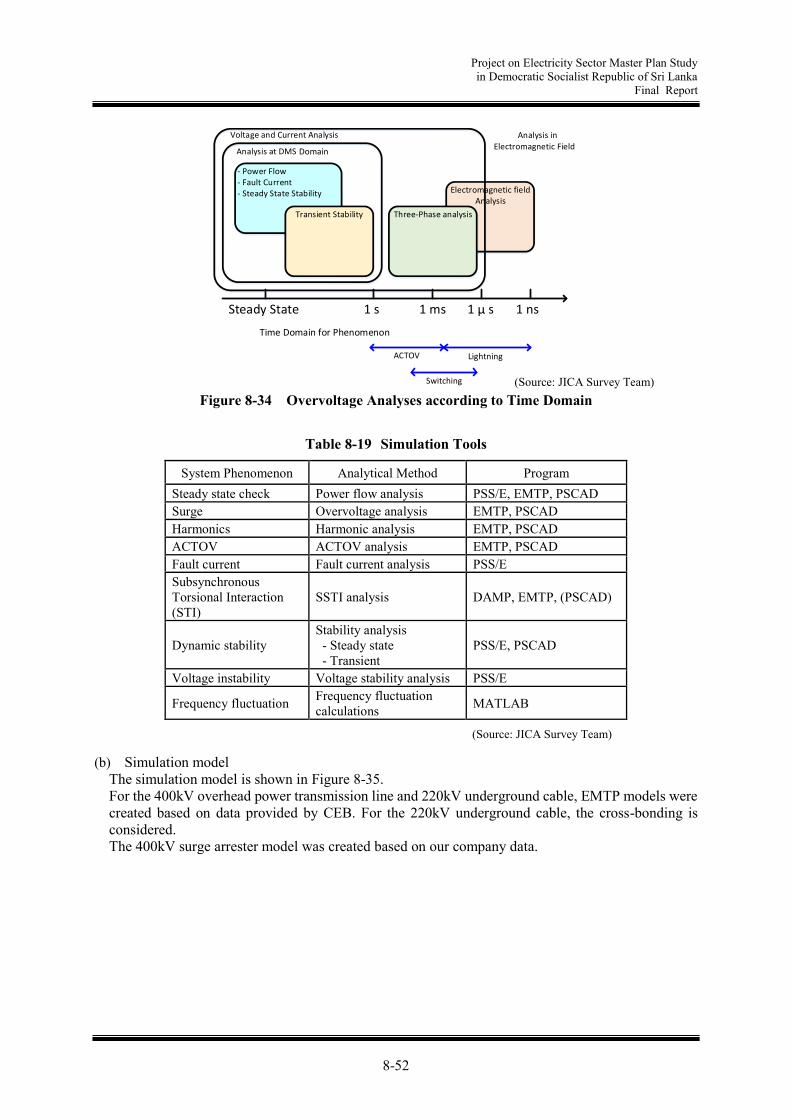
Project on Electricity Sector Master Plan Study in Democratic Socialist Republic of Sri Lanka
Final Report
8-52
Steady State 1 s 1 ms 1 µ s 1 ns
Time Domain for Phenomenon
- Power Flow- Fault Current- Steady State Stability
Transient Stability
Analysis at DMS Domein
Electromagnetic field Analysis
Voltage and Current Analysis Analysis in
Electromagnetic Field
Three-Phase analysis
ACTOV Lighting
Switching
Figure 8-34 Overvoltage Analyses according to Time Domain
Table 8-19 Simulation Tools
System Phenomenon Analytical Method Program Steady state check Power flow analysis PSS/E, EMTP, PSCAD Surge Overvoltage analysis EMTP, PSCAD Harmonics Harmonic analysis EMTP, PSCAD ACTOV ACTOV analysis EMTP, PSCAD Fault current Fault current analysis PSS/E Subsynchronous Torsional Interaction (STI)
SSTI analysis DAMP, EMTP, (PSCAD)
Dynamic stability Stability analysis - Steady state - Transient
PSS/E, PSCAD
Voltage instability Voltage stability analysis PSS/E
Frequency fluctuation Frequency fluctuation calculations MATLAB
(b) Simulation model
The simulation model is shown in Figure 8-35. For the 400kV overhead power transmission line and 220kV underground cable, EMTP models were created based on data provided by CEB. For the 220kV underground cable, the cross-bonding is considered. The 400kV surge arrester model was created based on our company data.
(Source: JICA Survey Team)
(Source: JICA Survey Team)
Domain
Lightningin

Project on Electricity Sector Master Plan Study in Democratic Socialist Republic of Sri Lanka
Final Report
8-53
(a) 220kV Underground Cable Model (Kerawalapitiya – Port City)
(b) 400kV Overhead Transmission Line Model (Hambantota – Ambalangoda)
(c) V-I Characteristics of 400kV Surge Arrester
Figure 8-35 EMTP Simulation Models (Source: JICA Survey Team)

Project on Electricity Sector Master Plan Study in Democratic Socialist Republic of Sri Lanka
Final Report
8-54
(4) Analytical Results Switching was done 100 times with a statistics switch. The results are shown in Table 8-20.
Table 8-20 Switching Overvoltage
220kV Underground Cable (Kerawalapitiya – Port City)
400kV Overhead Transmission Line (Hambantota – Ambalangoda)
Peak-voltage [V] Frequency Peak-voltage [V] Frequency 216,000 0 Less than 963,175 37 225,000 1 979,500 0 234,000 1 995,825 2 243,000 0 1,012,150 0 252,000 0 1,028,475 2 261,000 1 1,044,800 2 270,000 0 1,061,125 1 279,000 1 1,077,450 1 288,000 1 1,093,775 1 297,000 4 1,110,100 3 306,000 1 1,126,425 7 315,000 1 1,142,750 16 324,000 5 1,159,075 10 333,000 4 1,175,400 6 342,000 9 1,191,725 3 351,000 11 1,208,050 0 360,000 26 1,224,375 4 369,000 15 1,240,700 2 378,000 9 1,257,025 1 387,000 4 1,273,350 0 396,000 3 1,289,675 1 405,000 1 1,306,000 0 414,000 2 1,322,325 1
(Source: JICA Survey Team)
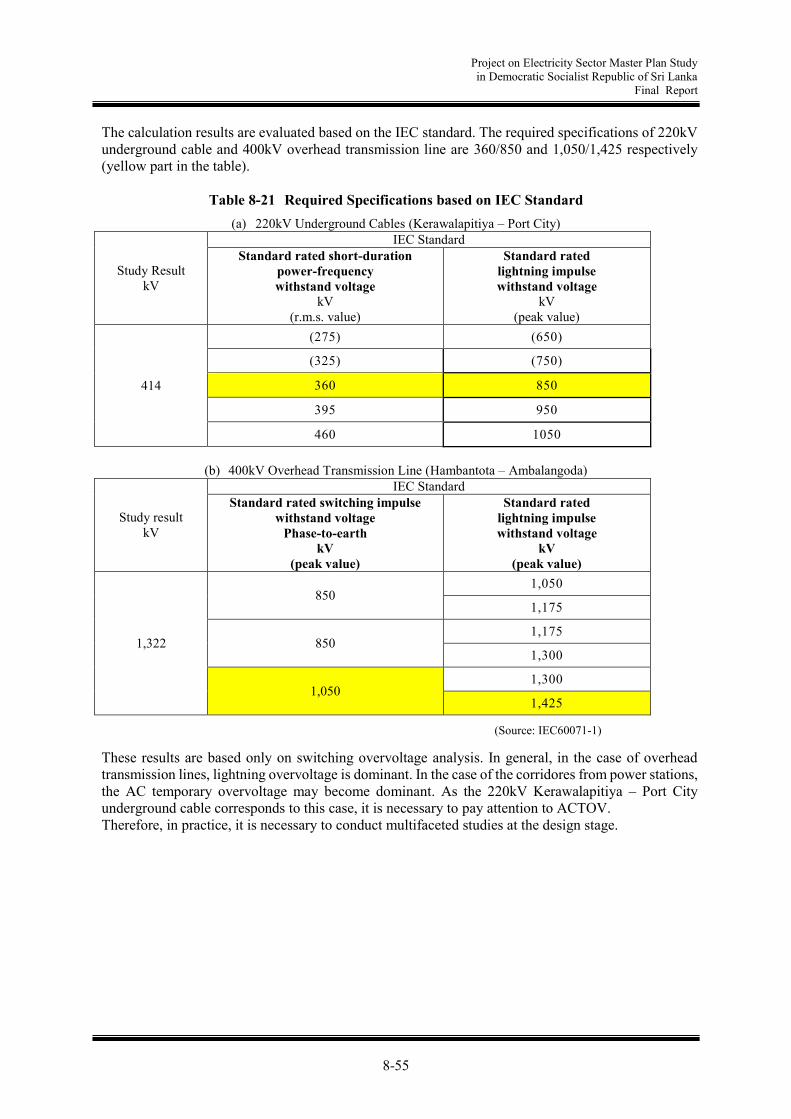
Project on Electricity Sector Master Plan Study in Democratic Socialist Republic of Sri Lanka
Final Report
8-55
The calculation results are evaluated based on the IEC standard. The required specifications of 220kV underground cable and 400kV overhead transmission line are 360/850 and 1,050/1,425 respectively (yellow part in the table).
Table 8-21 Required Specifications based on IEC Standard (a) 220kV Underground Cables (Kerawalapitiya – Port City)
Study Result kV
IEC Standard Standard rated short-duration
power-frequency withstand voltage
kV (r.m.s. value)
Standard rated lightning impulse withstand voltage
kV (peak value)
414
(275) (650)
(325) (750)
360 850
395 950
460 1050
(b) 400kV Overhead Transmission Line (Hambantota – Ambalangoda)
Study result kV
IEC Standard Standard rated switching impulse
withstand voltage Phase-to-earth
kV (peak value)
Standard rated lightning impulse withstand voltage
kV (peak value)
1,322
850 1,050
1,175
850 1,175
1,300
1,050 1,300
1,425 These results are based only on switching overvoltage analysis. In general, in the case of overhead transmission lines, lightning overvoltage is dominant. In the case of the corridores from power stations, the AC temporary overvoltage may become dominant. As the 220kV Kerawalapitiya – Port City underground cable corresponds to this case, it is necessary to pay attention to ACTOV. Therefore, in practice, it is necessary to conduct multifaceted studies at the design stage.
(Source: IEC60071-1)
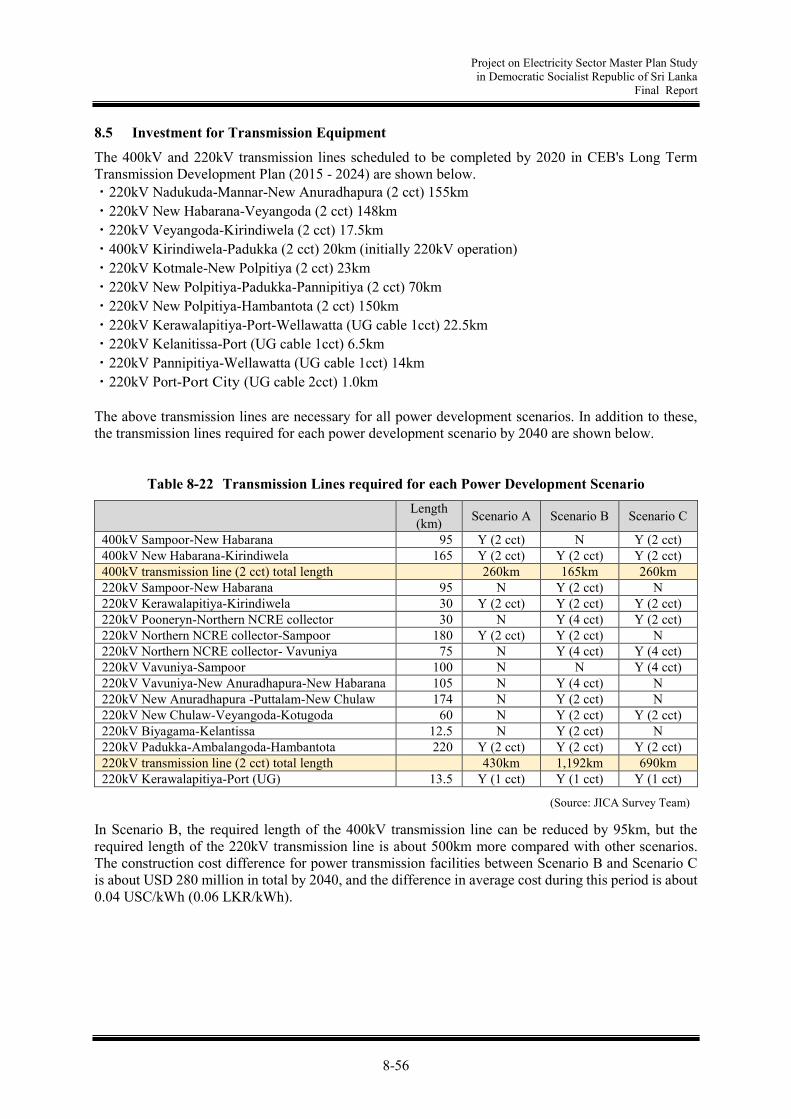
Project on Electricity Sector Master Plan Study in Democratic Socialist Republic of Sri Lanka
Final Report
8-56
8.5 Investment for Transmission Equipment
The 400kV and 220kV transmission lines scheduled to be completed by 2020 in CEB's Long Term Transmission Development Plan (2015 - 2024) are shown below. ・220kV Nadukuda-Mannar-New Anuradhapura (2 cct) 155km ・220kV New Habarana-Veyangoda (2 cct) 148km ・220kV Veyangoda-Kirindiwela (2 cct) 17.5km ・400kV Kirindiwela-Padukka (2 cct) 20km (initially 220kV operation) ・220kV Kotmale-New Polpitiya (2 cct) 23km ・220kV New Polpitiya-Padukka-Pannipitiya (2 cct) 70km ・220kV New Polpitiya-Hambantota (2 cct) 150km ・220kV Kerawalapitiya-Port-Wellawatta (UG cable 1cct) 22.5km ・220kV Kelanitissa-Port (UG cable 1cct) 6.5km ・220kV Pannipitiya-Wellawatta (UG cable 1cct) 14km ・220kV Port-Port City (UG cable 2cct) 1.0km The above transmission lines are necessary for all power development scenarios. In addition to these, the transmission lines required for each power development scenario by 2040 are shown below.
Table 8-22 Transmission Lines required for each Power Development Scenario
Length (km) Scenario A Scenario B Scenario C
400kV Sampoor-New Habarana 95 Y (2 cct) N Y (2 cct) 400kV New Habarana-Kirindiwela 165 Y (2 cct) Y (2 cct) Y (2 cct) 400kV transmission line (2 cct) total length 260km 165km 260km 220kV Sampoor-New Habarana 95 N Y (2 cct) N 220kV Kerawalapitiya-Kirindiwela 30 Y (2 cct) Y (2 cct) Y (2 cct) 220kV Pooneryn-Northern NCRE collector 30 N Y (4 cct) Y (2 cct) 220kV Northern NCRE collector-Sampoor 180 Y (2 cct) Y (2 cct) N 220kV Northern NCRE collector- Vavuniya 75 N Y (4 cct) Y (4 cct) 220kV Vavuniya-Sampoor 100 N N Y (4 cct) 220kV Vavuniya-New Anuradhapura-New Habarana 105 N Y (4 cct) N 220kV New Anuradhapura -Puttalam-New Chulaw 174 N Y (2 cct) N 220kV New Chulaw-Veyangoda-Kotugoda 60 N Y (2 cct) Y (2 cct) 220kV Biyagama-Kelantissa 12.5 N Y (2 cct) N 220kV Padukka-Ambalangoda-Hambantota 220 Y (2 cct) Y (2 cct) Y (2 cct) 220kV transmission line (2 cct) total length 430km 1,192km 690km 220kV Kerawalapitiya-Port (UG) 13.5 Y (1 cct) Y (1 cct) Y (1 cct)
In Scenario B, the required length of the 400kV transmission line can be reduced by 95km, but the required length of the 220kV transmission line is about 500km more compared with other scenarios. The construction cost difference for power transmission facilities between Scenario B and Scenario C is about USD 280 million in total by 2040, and the difference in average cost during this period is about 0.04 USC/kWh (0.06 LKR/kWh).
(Source: JICA Survey Team)

Project on Electricity Sector Master Plan Study in Democratic Socialist Republic of Sri Lanka
Final Report
8-57
Based on the above-mentioned conditions, investment for transmission equipment by each scenario is studied by using the unit price list shown in Table 8-23.
Table 8-23 Unit Price List
Equipment Construction Cost
Overhead Transmission Line
230kV D/C (Twin Conductor) 0.63 MUSD/km/2cct 400kV D/C (Quad Conductor) 0.87 MUSD/km/2cct
Underground Cable 230kV 2 MUSD/km/1cct 400kV 4 MUSD/km/1cct
Substation 400kV/230kV (3x 750MW, GIS) 80.3 MUSD Reactive Power Compensation 230kV Shunt Capacitor 0.029 MUSD/Mvar
Reference: Final Report of JICA Research on revised Master Plan in Bangladesh The results are shown in Table 8-24 and Figure 8-36.
Table 8-24 Trends of Capital Investment
Regarding the power transmission route from Kirindiwela to Kerawalapitiya, from the viewpoint of economy, it is assumed that overhead transmission lines are used up to the suburbs of Colombo, and the inside of Colombo city is to be underground transmission lines. In addition to this, it is necessary to install additional transformers at 220/132kV substations and extend the 132kV transmission lines/substations, but the necessary timing is almost the same for each scenario, because it depends on the increase in regional demand.
(Source: JICA Survey Team)
(Source: JICA Survey Team)

Project on Electricity Sector Master Plan Study in Democratic Socialist Republic of Sri Lanka
Final Report
8-58
Figure 8-36 Illustration of the Capital Investment Trend
(Source: JICA Survey Team)

Project on Electricity Sector Master Plan Study in Democratic Socialist Republic of Sri Lanka
Final Report
8-59
8.6 Transmission System from Kerawalapitiya TPP
At present, there is one 300MW Combined Cycle Generator unit in Kerawalapitiya TPP. There is a future expansion plan for a one unit generation facility in this TPP, and the transmission system from the Kerawalapitiya TPP is examined. Currently, there are the following transmission lines and transformers. Kerawalapitiya – Kotugoda 220kV Transmission lines 2 cct (Existing) Kerawalapitiya – Port 220kV Underground cables 1cct (Under construction) Kerawalapitiya 220/33kV Transformers 200MVA x1 (Under construction) As of January 2018, one 220kV underground cable route from Kerawalapitiya TPP to Colombo city is under construction. With the expansion of Kerawalapitiya TPP in the future, power flow will increase on this route and capacity will be overloaded at single line contingency. For this reason, it is necessary to install an additional route. Therefore, two 220kV cable routes are examined in addition to the one route under construction. In addition to the above, when installing additional underground cables, the additional route selected will be different from the underground cable route under construction, but it may not be possible to secure an appropriately sized route for the underground cables because the surrounding area is overcrowded. In this case, there is another plan to install the second route through the seabed outside the port. It is considered that the likelihood of a plan to install a submarine cable is fairly high, because a Japanese company has recently installed a 230kV AC undersea cable, which is almost the same capacity as that for the additional cable33. (1) In Case of Kerawalapitiya 300MW x 2 Units An additional unit will be installed in 2019 and the total capacity will become 300MW x 2 units. At this time, Kerawalapitiya – Port 220kV underground cable and Kerawalapitiya 220/33kV transformer, which are under construction, will be completed. As shown in the following figure, Kerawalapitiya – Port 220kV underground cable 1 cct becomes overloaded due to power flow under normal operation when Kerawalapitiya – Kotugoda transmission line and Kerawalapitiya – Port underground cable are connected with Kerawalapitiya TPP and used at the same time.
33 Example: Installation of 230kV undersea cable which is the same capacity level
AC 230kV undersea cable project in San Francisco bay in the US Total length 13.5km (Route length 4.5km) July in 2015
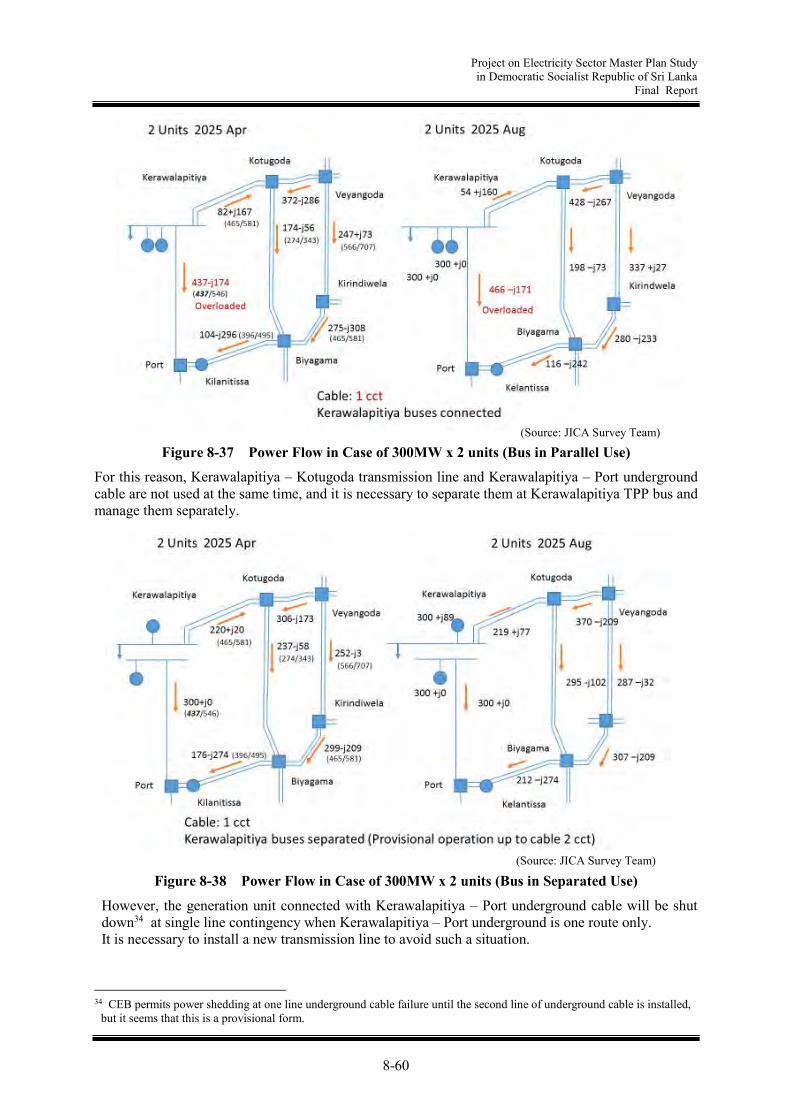
Project on Electricity Sector Master Plan Study in Democratic Socialist Republic of Sri Lanka
Final Report
8-60
Figure 8-37 Power Flow in Case of 300MW x 2 units (Bus in Parallel Use)
For this reason, Kerawalapitiya – Kotugoda transmission line and Kerawalapitiya – Port underground cable are not used at the same time, and it is necessary to separate them at Kerawalapitiya TPP bus and manage them separately.
Figure 8-38 Power Flow in Case of 300MW x 2 units (Bus in Separated Use)
However, the generation unit connected with Kerawalapitiya – Port underground cable will be shut down34 at single line contingency when Kerawalapitiya – Port underground is one route only. It is necessary to install a new transmission line to avoid such a situation.
34 CEB permits power shedding at one line underground cable failure until the second line of underground cable is installed,
but it seems that this is a provisional form.
(Source: JICA Survey Team)
(Source: JICA Survey Team)
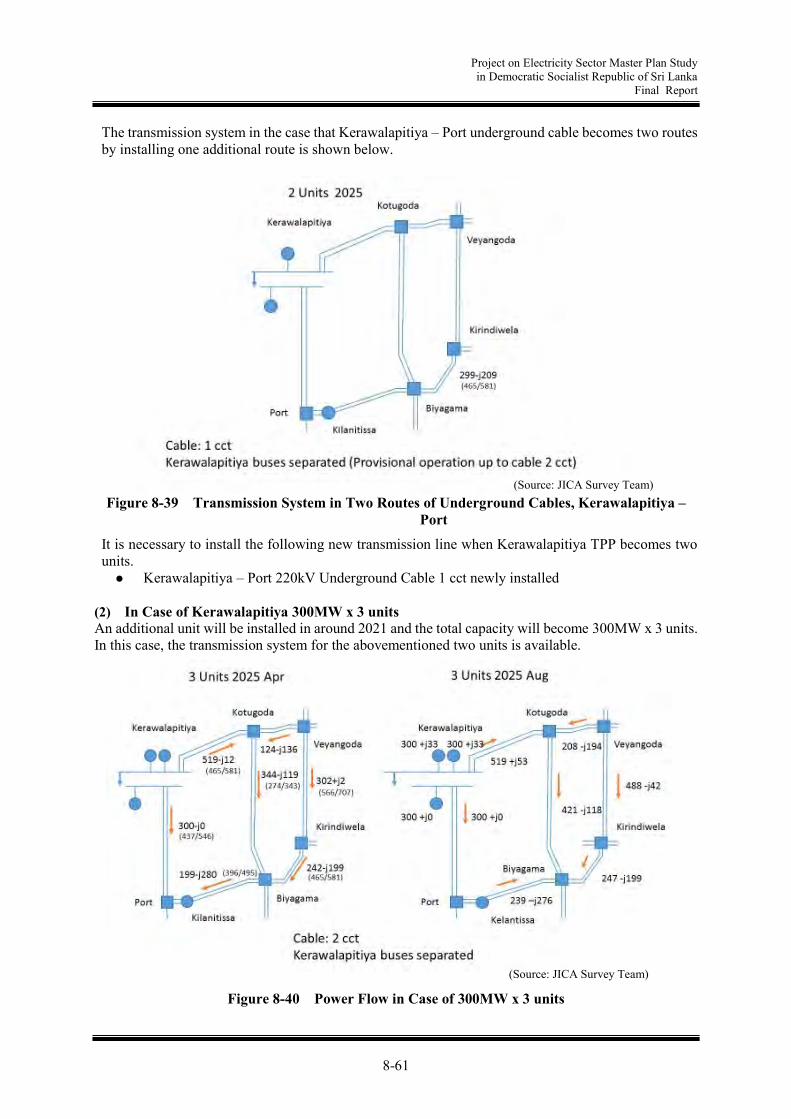
Project on Electricity Sector Master Plan Study in Democratic Socialist Republic of Sri Lanka
Final Report
8-61
The transmission system in the case that Kerawalapitiya – Port underground cable becomes two routes by installing one additional route is shown below.
Figure 8-39 Transmission System in Two Routes of Underground Cables, Kerawalapitiya – Port
It is necessary to install the following new transmission line when Kerawalapitiya TPP becomes two units. Kerawalapitiya – Port 220kV Underground Cable 1 cct newly installed
(2) In Case of Kerawalapitiya 300MW x 3 units An additional unit will be installed in around 2021 and the total capacity will become 300MW x 3 units. In this case, the transmission system for the abovementioned two units is available.
Figure 8-40 Power Flow in Case of 300MW x 3 units
(Source: JICA Survey Team)
(Source: JICA Survey Team)
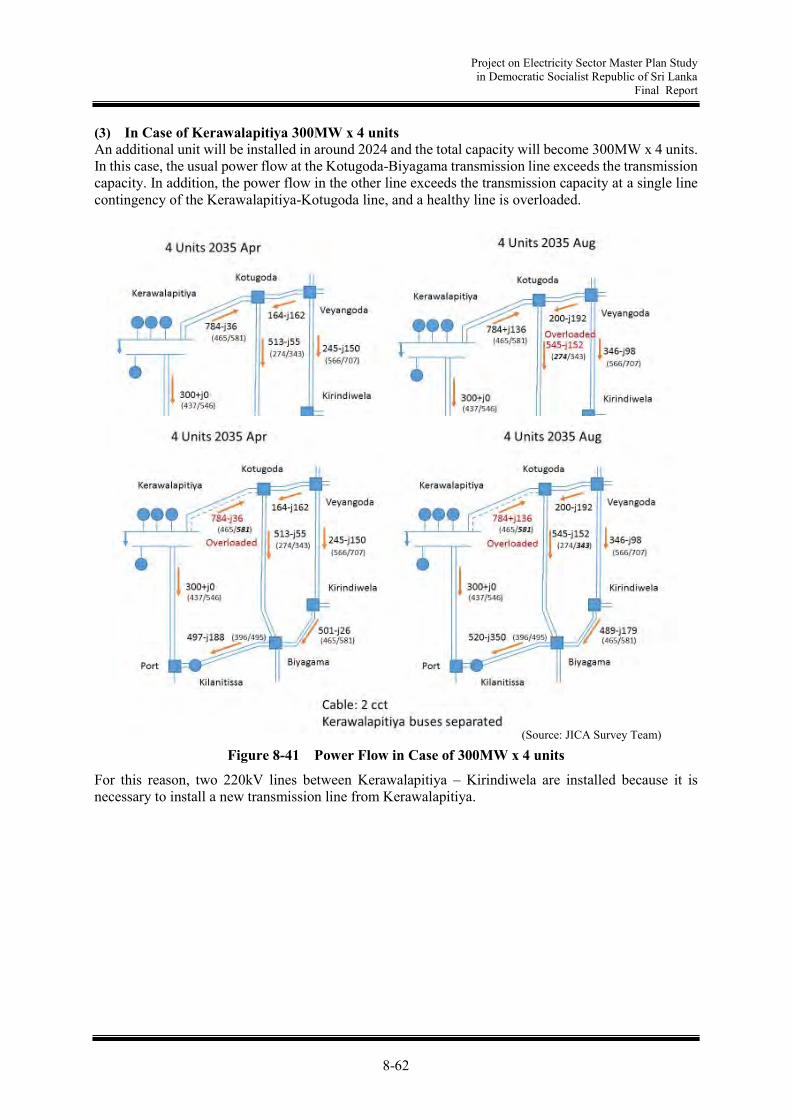
Project on Electricity Sector Master Plan Study in Democratic Socialist Republic of Sri Lanka
Final Report
8-62
(3) In Case of Kerawalapitiya 300MW x 4 units An additional unit will be installed in around 2024 and the total capacity will become 300MW x 4 units. In this case, the usual power flow at the Kotugoda-Biyagama transmission line exceeds the transmission capacity. In addition, the power flow in the other line exceeds the transmission capacity at a single line contingency of the Kerawalapitiya-Kotugoda line, and a healthy line is overloaded.
Figure 8-41 Power Flow in Case of 300MW x 4 units
For this reason, two 220kV lines between Kerawalapitiya – Kirindiwela are installed because it is necessary to install a new transmission line from Kerawalapitiya.
(Source: JICA Survey Team)
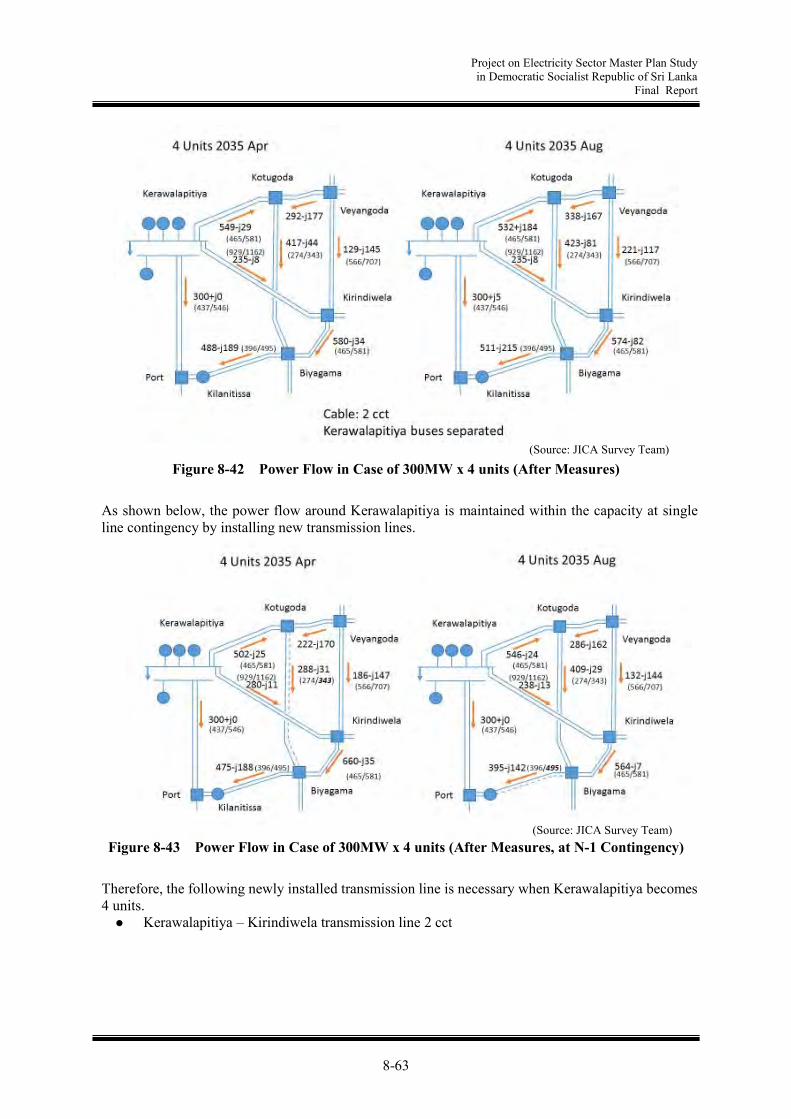
Project on Electricity Sector Master Plan Study in Democratic Socialist Republic of Sri Lanka
Final Report
8-63
Figure 8-42 Power Flow in Case of 300MW x 4 units (After Measures)
As shown below, the power flow around Kerawalapitiya is maintained within the capacity at single line contingency by installing new transmission lines. Figure 8-43 Power Flow in Case of 300MW x 4 units (After Measures, at N-1 Contingency)
Therefore, the following newly installed transmission line is necessary when Kerawalapitiya becomes 4 units. Kerawalapitiya – Kirindiwela transmission line 2 cct
(Source: JICA Survey Team)
(Source: JICA Survey Team)

Project on Electricity Sector Master Plan Study in Democratic Socialist Republic of Sri Lanka
Final Report
8-64
(4) In Case of Kerawalapitiya 300MW x 5 units An additional unit will be installed in around 2033 and the total capacity will become 300MW x 5 units. In this case, the usual power flow at the Kotugoda-Biyagama transmission line exceeds the transmission capacity. In addition, the power flow in the other line exceeds the transmission capacity at a single line contingency of Kerawalapitiya-Kotugoda and a healthy line is overloaded.
Figure 8-44 Power Flow in Case of 300MW x 5 units
This countermeasure is as follows: New transmission line from Kerawalapitiya is installed additionally.
Otherwise Improvement of transmission capacity via replacement of the existing transmission lines or
reconstruction. It is considered that there is a fully possibility of reconstruction or replacement of transmission lines to improve the transmission capacity because three routes of 6 x 220kV transmission lines have already been connected to Kerawalapitiya in this phase.
(Source: JICA Survey Team)

Project on Electricity Sector Master Plan Study in Democratic Socialist Republic of Sri Lanka
Final Report
8-65
For this reason, new transmission lines are not constructed anymore when the fifth unit starts operation, and it is proposed that transmission capacity for the 220kV transmission lines around Kerawalapitiya, such as Kerawalapitiya-Kotugoda, Biyagama-Kelanitissa, etc., should be increased. However, it is a very rare case in which the power flow exceeds the transmission capacity and is overloaded at a single line contingency of Kerawalapitiya-Kotugoda, because 300MW x 5 units operate at full load and all units of Puttalam TPP stop in this situation. Therefore, a countermeasure at the operating side should be considered in order to refrain from the abovementioned extreme operation.
(5) In Case of Kerawalapitiya 300MW x 2 units, 500MW x 1 unit If one unit of 500MW is installed in around 2021, the total capacity will become 300MW x 2 units and 500MW x 1 unit. If all units operate at full load, the power flow at the other lines will exceed the transmission capacity and become overloaded at a single line contingency of Kerawalapitiya-Kotugoda. Therefore, it is necessary to install a new transmission line from Kerawalapitiya, and two 220kV transmission lines between Kerawalapitiya–Kirindiwela.
Figure 8-45 Power Flow in Case of 300MW x 2 units and 500MW x 1 unit
However, when it is assumed that the maximum power system capacity is approximately 3,000MW and the minimum is approximately 1,200MW in 2021, and that the upper limitation of the 500MW unit operating range is 15% of power system capacity, the operating range becomes from 440MW to 180MW and the output should be suppressed in most of the time zones. For this reason, delaying the period for constructing two 220kV transmission lines between Kerawalapitiya–Kirindiwela is considered by limiting the power flow in Kerawalapitiya-Kirindiwela to approximately 580MVA.
(Source: JICA Survey Team)

Project on Electricity Sector Master Plan Study in Democratic Socialist Republic of Sri Lanka
Final Report
8-66
Figure 8-46 Power Flow in Case of 300MW x 2 units and 500MW x 1 unit (Output Suppression)
(6) In Case of Kerawalapitiya 300MW x 2 units and 500MW x 2 units If one unit of 500MW is installed in around 2033, the total capacity will become 300MW x 2 units and 500MW x 2 units. In this case, the usual power flow between Kotugoda-Biyagama will exceed the transmission capacity.
Figure 8-47 Power Flow in Case of 300MW x 2 units and 500MW x 2 units
Power flow under normal operation exceeds transmission capacity in the case where 300MW x 2 units and 500MW x 2 units operate at full load in Kerawalapitiya, and 275MW x 3 units operate at full load in Puttalam TPP. In addition, power flow in the other line exceeds transmission capacity and is overloaded at a single line contingency of Kerawalapitiya-Kotugoda. This situation is similar to the case of Kerawalapitiya TPP with 300MW x 5 units at full load operation.
(Source: JICA Survey Team)
(Source: JICA Survey Team)
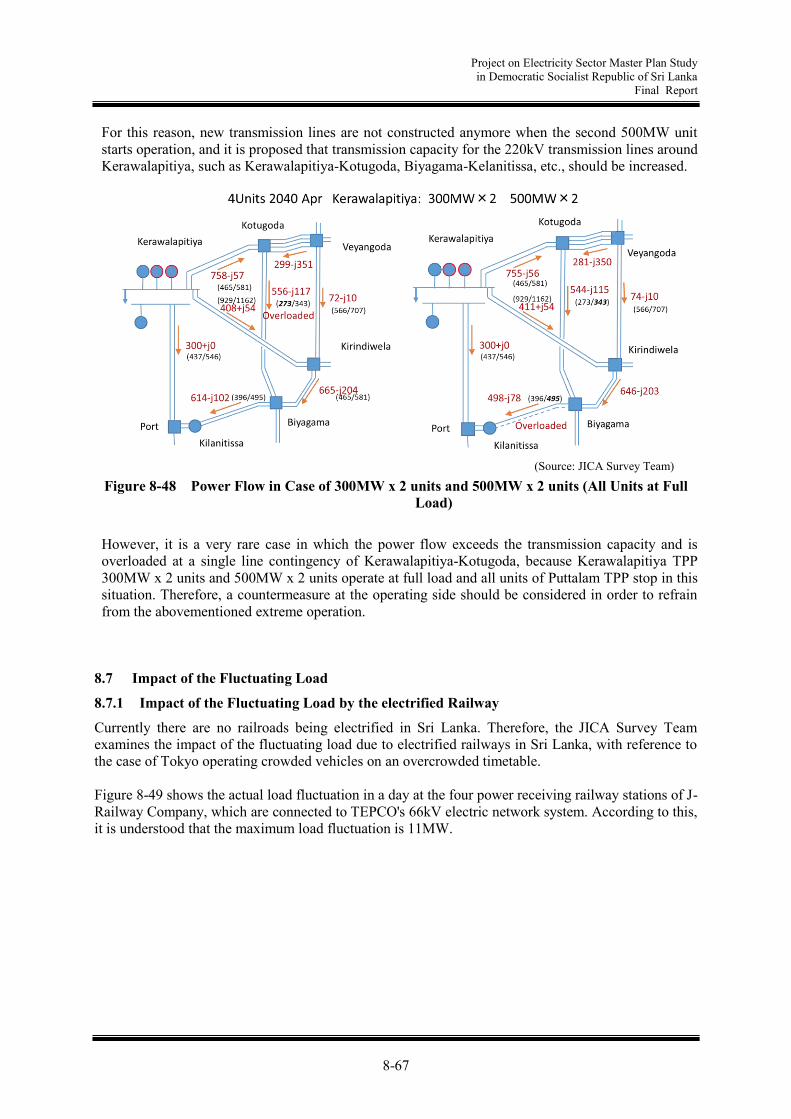
Project on Electricity Sector Master Plan Study in Democratic Socialist Republic of Sri Lanka
Final Report
8-67
For this reason, new transmission lines are not constructed anymore when the second 500MW unit starts operation, and it is proposed that transmission capacity for the 220kV transmission lines around Kerawalapitiya, such as Kerawalapitiya-Kotugoda, Biyagama-Kelanitissa, etc., should be increased.
Figure 8-48 Power Flow in Case of 300MW x 2 units and 500MW x 2 units (All Units at Full Load)
However, it is a very rare case in which the power flow exceeds the transmission capacity and is overloaded at a single line contingency of Kerawalapitiya-Kotugoda, because Kerawalapitiya TPP 300MW x 2 units and 500MW x 2 units operate at full load and all units of Puttalam TPP stop in this situation. Therefore, a countermeasure at the operating side should be considered in order to refrain from the abovementioned extreme operation.
8.7 Impact of the Fluctuating Load
8.7.1 Impact of the Fluctuating Load by the electrified Railway
Currently there are no railroads being electrified in Sri Lanka. Therefore, the JICA Survey Team examines the impact of the fluctuating load due to electrified railways in Sri Lanka, with reference to the case of Tokyo operating crowded vehicles on an overcrowded timetable. Figure 8-49 shows the actual load fluctuation in a day at the four power receiving railway stations of J-Railway Company, which are connected to TEPCO's 66kV electric network system. According to this, it is understood that the maximum load fluctuation is 11MW.
(Source: JICA Survey Team)

Project on Electricity Sector Master Plan Study in Democratic Socialist Republic of Sri Lanka
Final Report
8-68
Figure 8-49 Actual Railway Load Fluctuation in a Day
As examples of load fluctuations other than J-Railway Company, K-Railway Company is 10.6MW and O-Railway Company is 16MW, and the power factor is almost 1.0 in either case. The maximum electricity load for a crowded 10-car train is about 6MW, and one power receiving station supplies power to three stations and a 4 to 5 km route distance on average. As mentioned above, the maximum fluctuation range even at the power receiving station of a railroad that is operating very crowded trains on an overcrowded timetable is about 16MW (power factor 1.0), and there are no problems caused by these fluctuations. Assuming that the maximum load fluctuation range is the same level even in Sri Lanka, the simulation results for the change in voltage at the FORT substation (COL F-11) are shown in Figure 8-50, when the load suddenly increases by 16MW at the FORT substation.
Figure 8-50 Impact of the Fluctuating Load due to the electrified Railway
It is thought that the voltage fluctuation is a drop of 0.3 kV (from 10.9 kV to 10.6 kV, 0.03 p.u.), which is not a serious problem level.
(Source: JICA Survey Team)
(Source: JICA Survey Team)

Project on Electricity Sector Master Plan Study in Democratic Socialist Republic of Sri Lanka
Final Report
8-69
8.7.2 Impact of the Fluctuating Solar Power Output
The amount of solar power is still small in Sri Lanka. Therefore, as in the previous section, the JICA Survey Team examines the impact of solar power output fluctuation in Sri Lanka with reference to TEPCO's case, where a large amount of solar power has already been introduced. TEPCO assumed the output of all solar power generation from the actual solar radiation performance for one year. Among this, the output fluctuation results for 600 seconds before and after the time when the maximum deviation occurred are shown in Figure 8-51. (Total electricity generation of solar power at this time is 14,200MW.)
Figure 8-51 Actual Solar Power Output Fluctuation (Example from TEPCO)
It is estimated that the maximum change is 2,260MW/7 minutes (16% of power generation per 7 minutes) and the maximum change rate is 700MW/1 minute (5% of power generation per 1 minute) from TEPCO's actual data. The maximum value of solar power generation for Scenario B in 2040 is 1,600MW. Therefore, assuming that the same degree of change will also occur in Sri Lanka, the change amount is estimated as 256MW/7 minutes (= 1,600MW × 16%). If there is a change of 5%/1 minute in the solar power generation, the solar power generation change amount for Scenario B in 2040 is 80MW/1 minute (= 1,600MW × 5%). The system scale in the daytime in 2040, which is a situation where solar power generation is close to full output, is around 6,000MW. In addition, since many hydro power plants are operating in the daytime, the power system characteristics are assumed to be 10%MW/Hz. Under such circumstances, even when a power generation fluctuation of 80MW occurs in a very short time of less than 1 second, the frequency change is about 0.13Hz (= 80MW/6000MW/10%MW/Hz) and this is well within the allowable range.
3σ fluctuation 527.1MW
2σ -272.0MW
Short period variation
(Source: JICA Survey Team)
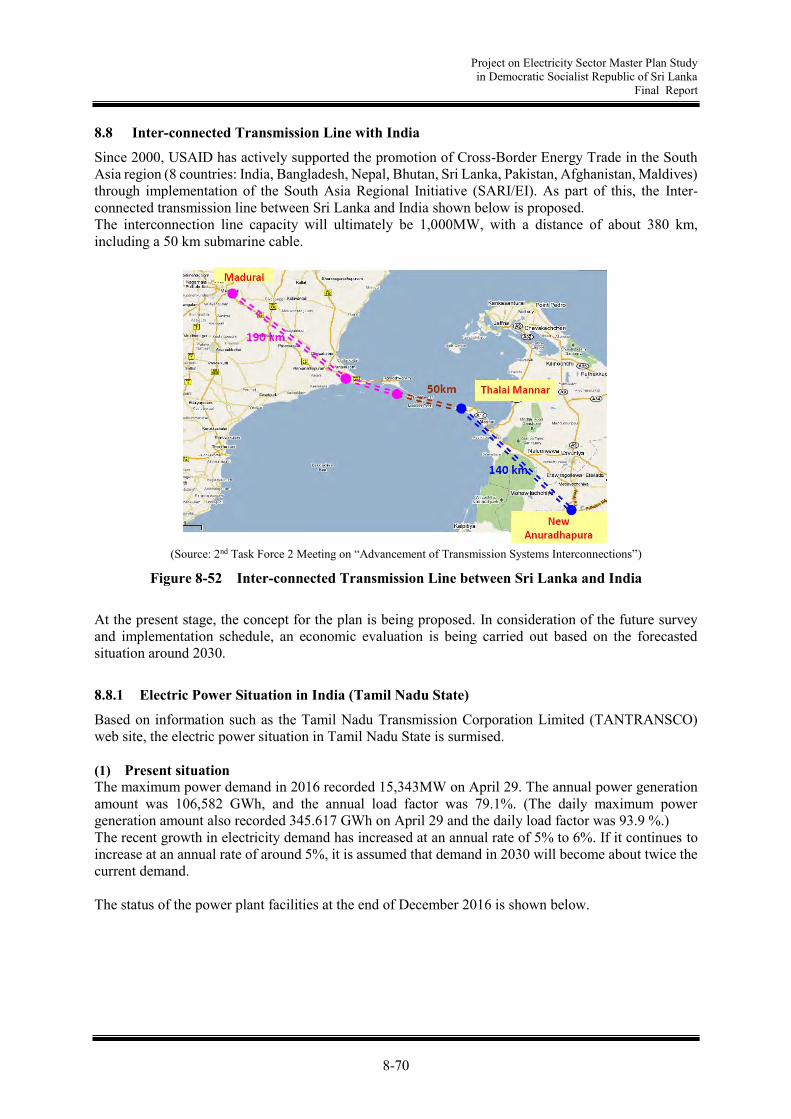
Project on Electricity Sector Master Plan Study in Democratic Socialist Republic of Sri Lanka
Final Report
8-70
8.8 Inter-connected Transmission Line with India
Since 2000, USAID has actively supported the promotion of Cross-Border Energy Trade in the South Asia region (8 countries: India, Bangladesh, Nepal, Bhutan, Sri Lanka, Pakistan, Afghanistan, Maldives) through implementation of the South Asia Regional Initiative (SARI/EI). As part of this, the Inter-connected transmission line between Sri Lanka and India shown below is proposed. The interconnection line capacity will ultimately be 1,000MW, with a distance of about 380 km, including a 50 km submarine cable.
Figure 8-52 Inter-connected Transmission Line between Sri Lanka and India
At the present stage, the concept for the plan is being proposed. In consideration of the future survey and implementation schedule, an economic evaluation is being carried out based on the forecasted situation around 2030.
8.8.1 Electric Power Situation in India (Tamil Nadu State)
Based on information such as the Tamil Nadu Transmission Corporation Limited (TANTRANSCO) web site, the electric power situation in Tamil Nadu State is surmised. (1) Present situation The maximum power demand in 2016 recorded 15,343MW on April 29. The annual power generation amount was 106,582 GWh, and the annual load factor was 79.1%. (The daily maximum power generation amount also recorded 345.617 GWh on April 29 and the daily load factor was 93.9 %.) The recent growth in electricity demand has increased at an annual rate of 5% to 6%. If it continues to increase at an annual rate of around 5%, it is assumed that demand in 2030 will become about twice the current demand. The status of the power plant facilities at the end of December 2016 is shown below.
(Source: 2nd Task Force 2 Meeting on “Advancement of Transmission Systems Interconnections”)
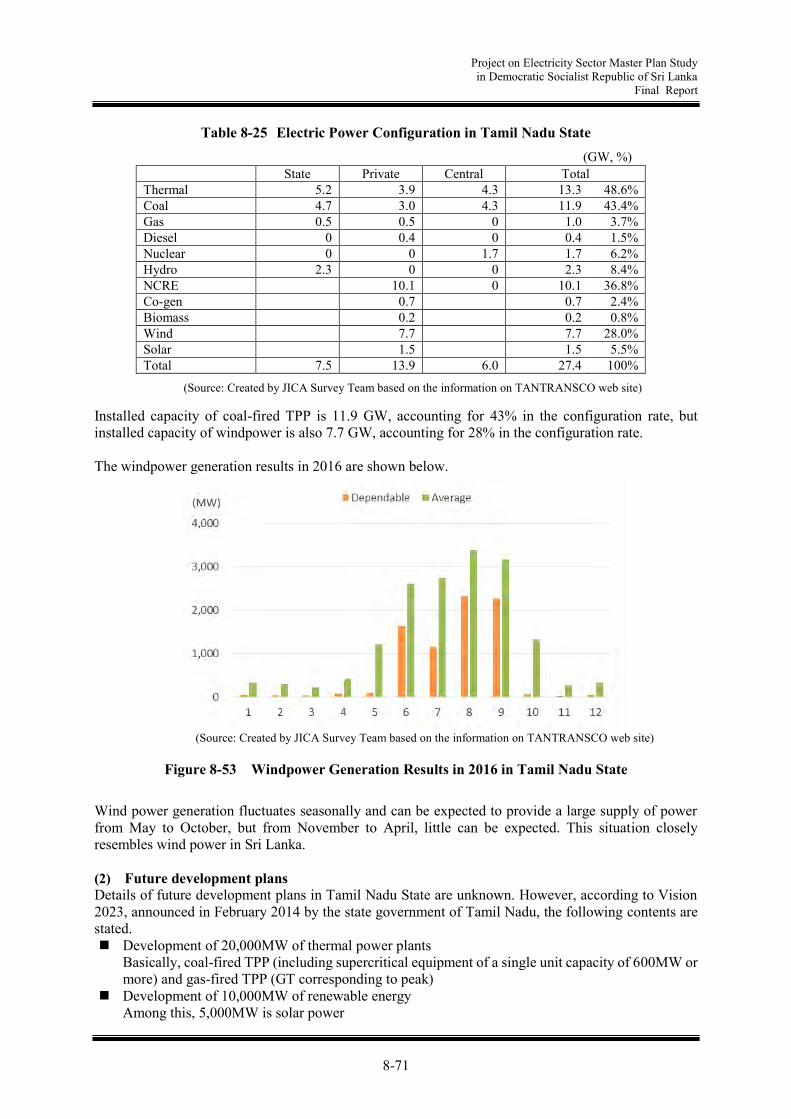
Project on Electricity Sector Master Plan Study in Democratic Socialist Republic of Sri Lanka
Final Report
8-71
(GW, %)
Table 8-25 Electric Power Configuration in Tamil Nadu State
State Private Central Total
Thermal 5.2 3.9 4.3 13.3 48.6% Coal 4.7 3.0 4.3 11.9 43.4% Gas 0.5 0.5 0 1.0 3.7% Diesel 0 0.4 0 0.4 1.5% Nuclear 0 0 1.7 1.7 6.2% Hydro 2.3 0 0 2.3 8.4% NCRE 10.1 0 10.1 36.8% Co-gen 0.7 0.7 2.4% Biomass 0.2 0.2 0.8% Wind 7.7 7.7 28.0% Solar 1.5 1.5 5.5% Total 7.5 13.9 6.0 27.4 100%
Installed capacity of coal-fired TPP is 11.9 GW, accounting for 43% in the configuration rate, but installed capacity of windpower is also 7.7 GW, accounting for 28% in the configuration rate. The windpower generation results in 2016 are shown below.
Figure 8-53 Windpower Generation Results in 2016 in Tamil Nadu State
Wind power generation fluctuates seasonally and can be expected to provide a large supply of power from May to October, but from November to April, little can be expected. This situation closely resembles wind power in Sri Lanka. (2) Future development plans Details of future development plans in Tamil Nadu State are unknown. However, according to Vision 2023, announced in February 2014 by the state government of Tamil Nadu, the following contents are stated. Development of 20,000MW of thermal power plants
Basically, coal-fired TPP (including supercritical equipment of a single unit capacity of 600MW or more) and gas-fired TPP (GT corresponding to peak)
Development of 10,000MW of renewable energy Among this, 5,000MW is solar power
(Source: Created by JICA Survey Team based on the information on TANTRANSCO web site)
(Source: Created by JICA Survey Team based on the information on TANTRANSCO web site)
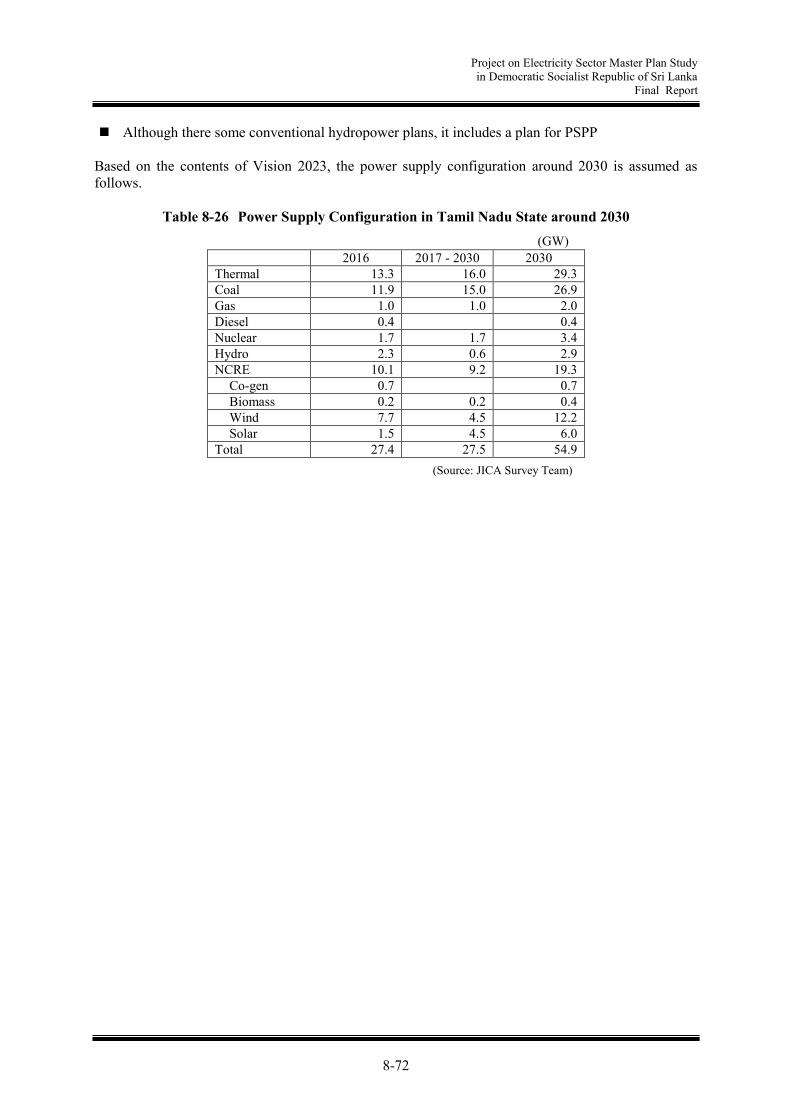
Project on Electricity Sector Master Plan Study in Democratic Socialist Republic of Sri Lanka
Final Report
8-72
(GW)
Although there some conventional hydropower plans, it includes a plan for PSPP Based on the contents of Vision 2023, the power supply configuration around 2030 is assumed as follows.
Table 8-26 Power Supply Configuration in Tamil Nadu State around 2030
2016 2017 - 2030 2030 Thermal 13.3 16.0 29.3 Coal 11.9 15.0 26.9 Gas 1.0 1.0 2.0 Diesel 0.4 0.4 Nuclear 1.7 1.7 3.4 Hydro 2.3 0.6 2.9 NCRE 10.1 9.2 19.3
Co-gen 0.7 0.7 Biomass 0.2 0.2 0.4 Wind 7.7 4.5 12.2 Solar 1.5 4.5 6.0
Total 27.4 27.5 54.9
(Source: JICA Survey Team)
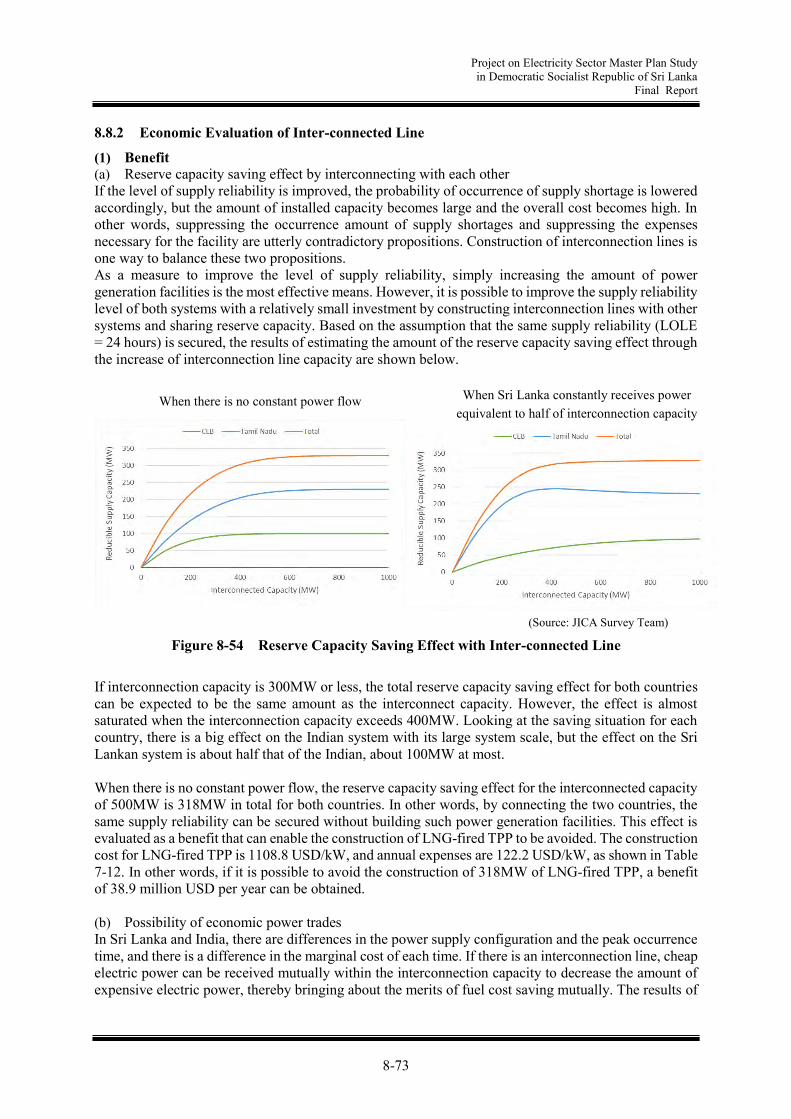
Project on Electricity Sector Master Plan Study in Democratic Socialist Republic of Sri Lanka
Final Report
8-73
8.8.2 Economic Evaluation of Inter-connected Line
(1) Benefit (a) Reserve capacity saving effect by interconnecting with each other If the level of supply reliability is improved, the probability of occurrence of supply shortage is lowered accordingly, but the amount of installed capacity becomes large and the overall cost becomes high. In other words, suppressing the occurrence amount of supply shortages and suppressing the expenses necessary for the facility are utterly contradictory propositions. Construction of interconnection lines is one way to balance these two propositions. As a measure to improve the level of supply reliability, simply increasing the amount of power generation facilities is the most effective means. However, it is possible to improve the supply reliability level of both systems with a relatively small investment by constructing interconnection lines with other systems and sharing reserve capacity. Based on the assumption that the same supply reliability (LOLE = 24 hours) is secured, the results of estimating the amount of the reserve capacity saving effect through the increase of interconnection line capacity are shown below.
Figure 8-54 Reserve Capacity Saving Effect with Inter-connected Line
If interconnection capacity is 300MW or less, the total reserve capacity saving effect for both countries can be expected to be the same amount as the interconnect capacity. However, the effect is almost saturated when the interconnection capacity exceeds 400MW. Looking at the saving situation for each country, there is a big effect on the Indian system with its large system scale, but the effect on the Sri Lankan system is about half that of the Indian, about 100MW at most. When there is no constant power flow, the reserve capacity saving effect for the interconnected capacity of 500MW is 318MW in total for both countries. In other words, by connecting the two countries, the same supply reliability can be secured without building such power generation facilities. This effect is evaluated as a benefit that can enable the construction of LNG-fired TPP to be avoided. The construction cost for LNG-fired TPP is 1108.8 USD/kW, and annual expenses are 122.2 USD/kW, as shown in Table 7-12. In other words, if it is possible to avoid the construction of 318MW of LNG-fired TPP, a benefit of 38.9 million USD per year can be obtained. (b) Possibility of economic power trades In Sri Lanka and India, there are differences in the power supply configuration and the peak occurrence time, and there is a difference in the marginal cost of each time. If there is an interconnection line, cheap electric power can be received mutually within the interconnection capacity to decrease the amount of expensive electric power, thereby bringing about the merits of fuel cost saving mutually. The results of
When there is no constant power flow When Sri Lanka constantly receives power equivalent to half of interconnection capacity
(Source: JICA Survey Team)

Project on Electricity Sector Master Plan Study in Democratic Socialist Republic of Sri Lanka
Final Report
8-74
estimating the amount of the fuel cost saving effect through the increase of interconnection line capacity are shown below.
Figure 8-55 Fuel Cost Saving Effect with Inter-connected Line
Although the above graph only describes CEB, similar benefits are also generated on the Indian side, as it is calculated that the benefits arising from the fuel cost saving effect will be divided into both systems evenly. This effect also shows the same tendency as the reserve capacity saving effect, and when the interconnection capacity exceeds 400MW, the effect is almost saturated. If the loss is large, there is no merit in power interchange unless there is a difference in fuel cost considering losses. Therefore, as the loss increases, the amount of power trade decreases and the benefit also decreases. The frequency distribution of power trades (case where the loss is 0.2 USC/kWh) when the interconnection capacity is 500MW is shown below.
Figure 8-56 Frequency Distribution of Power Trades (Interconnection Capacity: 500MW)
Basically, the marginal cost on the Indian side is cheaper than that on the Sri Lankan side, so the time for electricity sending to the Indian side is very small, and the time for purchasing electricity from the Indian side is very large.
(Source: JICA Survey Team)
(Source: JICA Survey Team)

Project on Electricity Sector Master Plan Study in Democratic Socialist Republic of Sri Lanka
Final Report
8-75
(c) Frequency Adjustment with the Use of AC/DC Convertor An AC/DC convertor easily and rapidly controls power flow. Thus, by monitoring frequency on one side of the grid and quickly adjusting the power flow according to the variance between the monitored frequency and the defined frequency standard, frequency stabilization can be very easily achieved. A specific illustration of control is given in the following figure.
Figure 8-57 Illustration of Frequency Control with HVDC
When frequency rises in Sri Lanka due to the surplus in supply capacity, the supply capacity from India shall be lowered. When the frequency drops due to the lack of supply capacity, the supply capacity from India shall be increased. To avoid fluctuation of the receiving capacity, as long as the monitored frequency stays within a certain dead band near the 50 Hz standard, the receiving capacity stays constant. Because this is a very simple controlling module, only small additional investment is required. However, in order to accommodate this controlling module, the following points should be taken into consideration. Fluctuation in power flow at the AC/DC convertor induces frequency fluctuation in India.
Therefore, Sri Lanka needs India’s consent for the controlling scheme. As applicable conditions, the size of the other network is sufficiently large and frequency fluctuation due to the fluctuation of power flow at the convertor would be rather small. In this case, the size of the Indian South grid is more than 5 times that of the Sri Lankan grid. As long as the upper limitation of fluctuation is clearly defined, it is possible to regulate the frequency fluctuation in relation to the power flow fluctuation at the convertor.
Because it is not possible to receive more power than the HVDC capacity, the operational capacity has already got some margin for adjustment in the case of frequency drop to boost receiving capacity from India.
When receiving capacity varies due to frequency fluctuation, the actual energy received faces deviation from the contracted capacity, and hence incurs a penalty. To avoid the penalty payment, within the contracted time zone (15 minutes), some manipulation to balance actual and contracted capacity is required.
(d) CO2 emission reduction effect By constantly receiving electricity from India, it is possible to reduce CO2 emissions per unit of electricity demand in Sri Lanka. For example, when constantly receiving 270MW of electricity from India in 2030 as per the Scenario C development proposal shown in Figure 7-39, the CO2 emissions per kWh will decrease from 0.44 kg-CO2/kWh to 0.37 kg-CO2/kWh. If the amount of electricity received from India is electric power via a surplus in renewable energy, reduction can be achieved on a global scale, but if it is electric power from coal-fired TPP, considering the loss at the interconnecting transmission lines, CO2 emissions will increase on a global scale.
HVDC
India Sri Lanka
P (control)
f (monitoring) P
P
f + - 50Hz
Control unit (Source: JICA Survey Team)
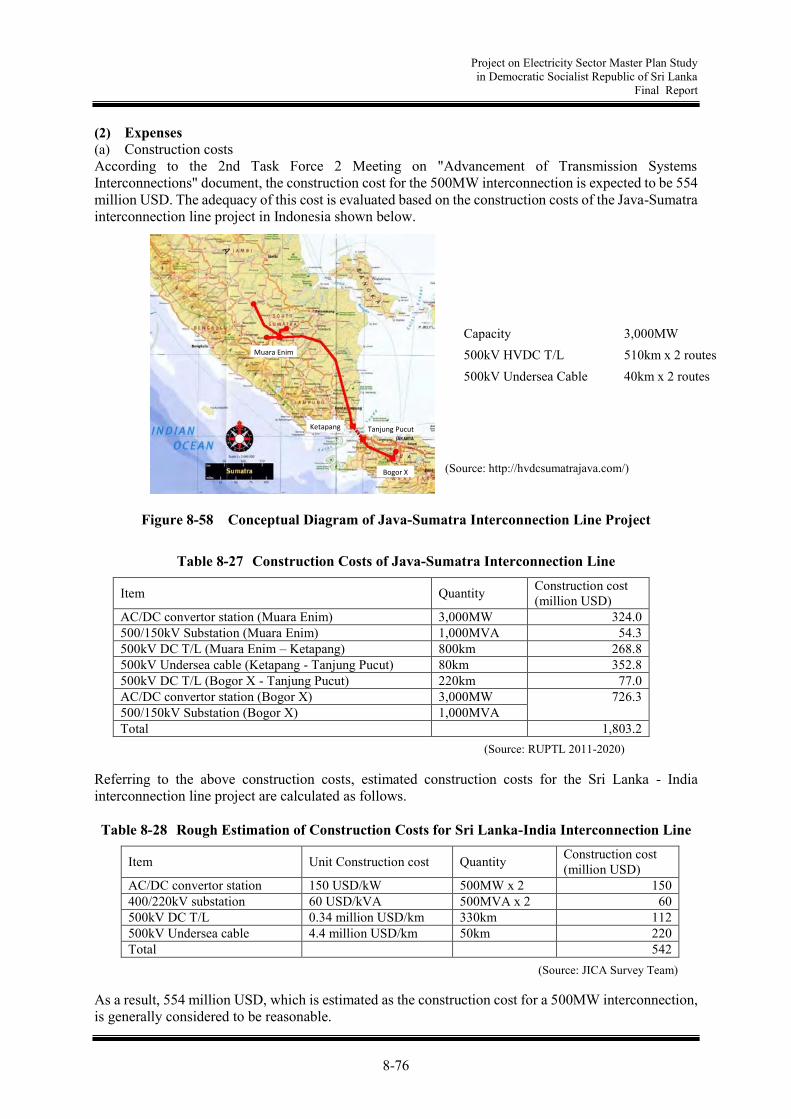
Project on Electricity Sector Master Plan Study in Democratic Socialist Republic of Sri Lanka
Final Report
8-76
(Source: RUPTL 2011-2020)
Muara Enim
Ketapang Tanjung Pucut
Bogor X
(2) Expenses (a) Construction costs According to the 2nd Task Force 2 Meeting on "Advancement of Transmission Systems Interconnections" document, the construction cost for the 500MW interconnection is expected to be 554 million USD. The adequacy of this cost is evaluated based on the construction costs of the Java-Sumatra interconnection line project in Indonesia shown below.
Figure 8-58 Conceptual Diagram of Java-Sumatra Interconnection Line Project
Table 8-27 Construction Costs of Java-Sumatra Interconnection Line
Item Quantity Construction cost (million USD)
AC/DC convertor station (Muara Enim) 3,000MW 324.0 500/150kV Substation (Muara Enim) 1,000MVA 54.3 500kV DC T/L (Muara Enim – Ketapang) 800km 268.8 500kV Undersea cable (Ketapang - Tanjung Pucut) 80km 352.8 500kV DC T/L (Bogor X - Tanjung Pucut) 220km 77.0 AC/DC convertor station (Bogor X) 3,000MW 726.3 500/150kV Substation (Bogor X) 1,000MVA Total 1,803.2
Referring to the above construction costs, estimated construction costs for the Sri Lanka - India interconnection line project are calculated as follows. Table 8-28 Rough Estimation of Construction Costs for Sri Lanka-India Interconnection Line
Item Unit Construction cost Quantity Construction cost (million USD)
AC/DC convertor station 150 USD/kW 500MW x 2 150 400/220kV substation 60 USD/kVA 500MVA x 2 60 500kV DC T/L 0.34 million USD/km 330km 112 500kV Undersea cable 4.4 million USD/km 50km 220 Total 542
As a result, 554 million USD, which is estimated as the construction cost for a 500MW interconnection, is generally considered to be reasonable.
Capacity 3,000MW 500kV HVDC T/L 510km x 2 routes 500kV Undersea Cable 40km x 2 routes
(Source: http://hvdcsumatrajava.com/)
(Source: JICA Survey Team)
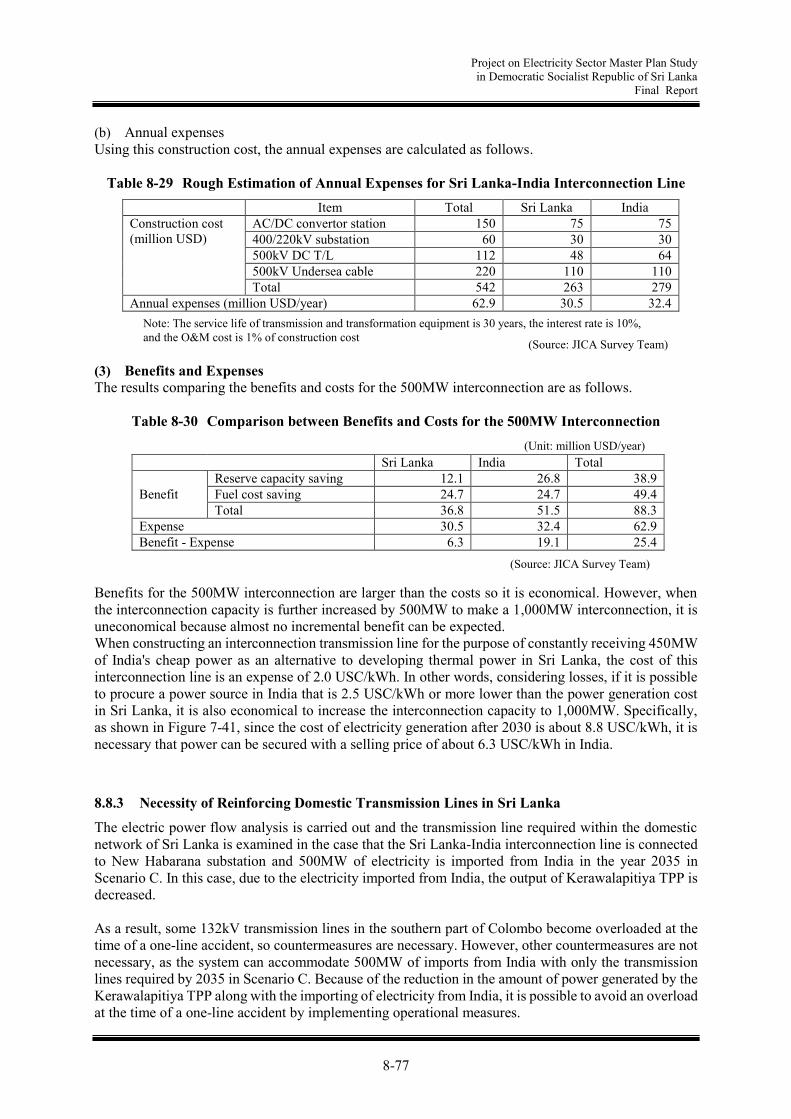
Project on Electricity Sector Master Plan Study in Democratic Socialist Republic of Sri Lanka
Final Report
8-77
(b) Annual expenses Using this construction cost, the annual expenses are calculated as follows.
Table 8-29 Rough Estimation of Annual Expenses for Sri Lanka-India Interconnection Line Item Total Sri Lanka India Construction cost (million USD)
AC/DC convertor station 150 75 75 400/220kV substation 60 30 30 500kV DC T/L 112 48 64 500kV Undersea cable 220 110 110 Total 542 263 279
Annual expenses (million USD/year) 62.9 30.5 32.4 (3) Benefits and Expenses The results comparing the benefits and costs for the 500MW interconnection are as follows.
Table 8-30 Comparison between Benefits and Costs for the 500MW Interconnection
Sri Lanka India Total
Benefit Reserve capacity saving 12.1 26.8 38.9 Fuel cost saving 24.7 24.7 49.4 Total 36.8 51.5 88.3
Expense 30.5 32.4 62.9 Benefit - Expense 6.3 19.1 25.4
Benefits for the 500MW interconnection are larger than the costs so it is economical. However, when the interconnection capacity is further increased by 500MW to make a 1,000MW interconnection, it is uneconomical because almost no incremental benefit can be expected. When constructing an interconnection transmission line for the purpose of constantly receiving 450MW of India's cheap power as an alternative to developing thermal power in Sri Lanka, the cost of this interconnection line is an expense of 2.0 USC/kWh. In other words, considering losses, if it is possible to procure a power source in India that is 2.5 USC/kWh or more lower than the power generation cost in Sri Lanka, it is also economical to increase the interconnection capacity to 1,000MW. Specifically, as shown in Figure 7-41, since the cost of electricity generation after 2030 is about 8.8 USC/kWh, it is necessary that power can be secured with a selling price of about 6.3 USC/kWh in India.
8.8.3 Necessity of Reinforcing Domestic Transmission Lines in Sri Lanka
The electric power flow analysis is carried out and the transmission line required within the domestic network of Sri Lanka is examined in the case that the Sri Lanka-India interconnection line is connected to New Habarana substation and 500MW of electricity is imported from India in the year 2035 in Scenario C. In this case, due to the electricity imported from India, the output of Kerawalapitiya TPP is decreased. As a result, some 132kV transmission lines in the southern part of Colombo become overloaded at the time of a one-line accident, so countermeasures are necessary. However, other countermeasures are not necessary, as the system can accommodate 500MW of imports from India with only the transmission lines required by 2035 in Scenario C. Because of the reduction in the amount of power generated by the Kerawalapitiya TPP along with the importing of electricity from India, it is possible to avoid an overload at the time of a one-line accident by implementing operational measures.
Note: The service life of transmission and transformation equipment is 30 years, the interest rate is 10%, and the O&M cost is 1% of construction cost
(Unit: million USD/year)
(Source: JICA Survey Team)
(Source: JICA Survey Team)

Project on Electricity Sector Master Plan Study in Democratic Socialist Republic of Sri Lanka
Final Report
8-78
2035 (In the case of importing 500MW via Sri Lanka - India Interconnection line.)
Figure 8-59 Power Flow Situation in case of Importing 500MW via Sri Lanka - India Interconnection Line
Chunnakam
Kilinochchi
Mannar
Vavuniya
Anuradhapura
Sampoor
HabaranaValachchanai
Bowatenna
Ukuwela
Pallokollo
Randenigala
RantembeKotmale
Badulla
Nuwara Eliya
Ampara
Vavunativu
Mahiyangane
Inginiyagala
Monaragala
Kukule
Deniyaya
Ambalangoda
GalleBeliatta
Maho
Puttalam
Madampe
Bolawatta
Kegalle
Horana
SamanalaWema
Balangoda
Ratnapura
Padukka
Hambantota
Pannipitiya
Thulhiriya
Kirindiwela
Kolonnawa
Biyagama
Kerawalapitiya
Kappalturai
Polonnaruwa
Naula
Tissamaharama
Suriyawewa
Nadukuda
Trincomalee
New Chulaw
Katunayake
Kalutara
Panadura
Puttalam
Matugama
Kurunegata
Canyon
Embilipitiya
Matara
LaxapanaWimalasurendra
Victoria
Kotugoda
Kerawalapitiya
Kirindiwela
Padukka
PannipitiyaWellawatta
Kelantissa
Port city
Port
Kollupitiya
Slave Island
Fort
Kotahena
Pettah Kolonnawa
Hunupitiya
Havelocktown
Dehiwala
Ratmalana
Athurugiriya
Battaramulla
Oruwala
SapugaskandaKelaniya
Aniyakanda
Maradana
Pottuvil
Siyambalanduwa
Uma oya
Kandy city
Pannala
Weligama
New habarana
Chemmany
Serunuwara
190
80
100
1390
130
170
170
40100
1300430
Veyangoda
Kotugoda
Pooneryn
300
540870
620
680
50
670 Mirigama330
600
190
Kinbathkumbura
140
150
210
640
230
Veyangoda
290(1)
270
(1)100
(1)370
Biyagamya
Sri Jayawardanapura
160
620
650
New anuradhapura
132kV Line
220kV Line
400kV Line
1
Northern NCRECOLLECTOR
Divided the bus
130
40
660
290
India – Sri Lanka HVDC Interconnection500MW
Polpitiya
(Source: JICA Survey Team)

Project on Electricity Sector Master Plan Study in Democratic Socialist Republic of Sri Lanka
Final Report
9-1
Chapter 9. Distribution Development Plan
9.1 Present Distribution System Situation in Sri Lanka
The survey team investigated the operational results (System loss rate, reliability indices, etc.) of each distribution company and review improvement schemes for them. Based upon the findings, we review the distribution master plan for each district and make suggestions about the planning and operation methods. Furthermore, we investigated the possibility of introducing smart grid technologies in the future. In Sri Lanka, CEB’s distribution division (DDs: Distribution Division 1 to 4) and LECO (Lanka Electricity Company (Private) Limited) are registered as the distribution licensees. Since each company operates independently, we conducted surveys for each through interviews and site surveys. The supply areas and general characteristics of each company are shown below.
Table 9-1 General Characteristics of Each Company Company
- Province Area (km2)
Load Density (Kwh/km2)
Electrification Rate (%)
DD1 26,810 121 92 CC 37 35,919 99 NWP 7,756 150 95 NCP 10,472 42 92 NP 8,545 35 79
DD2 17,639 204 96 WPN 1,387 1,377 100 CP 6,472 175 98 EP 9,780 57 88
DD3 14,215 138 96 WPS2 1,200 1003 99 Sab. 4,465 67 99 Uva 8,550 53 95
DD4 6,870 225 100 WPS1 1,230 502 100 SP 5,640 165 100
LECO 396 3446 100 (Source: CEB and LECO data as of 2015)
As shown in Table 9-1, electricity demand in Sri Lanka is concentrated around Colombo city, while the density is small in the northern and eastern areas of the country. Moreover, since the governmental policy has been focused on rural electrification in recent years, the electrification rate is approaching 100% in most areas. However, the rate is not so high in the Northern Province and Eastern Province due to the civil war that ended in 2009.
Figure 9-1 Supply Area of Each Company
(Source: CEB Annual Report 2013)
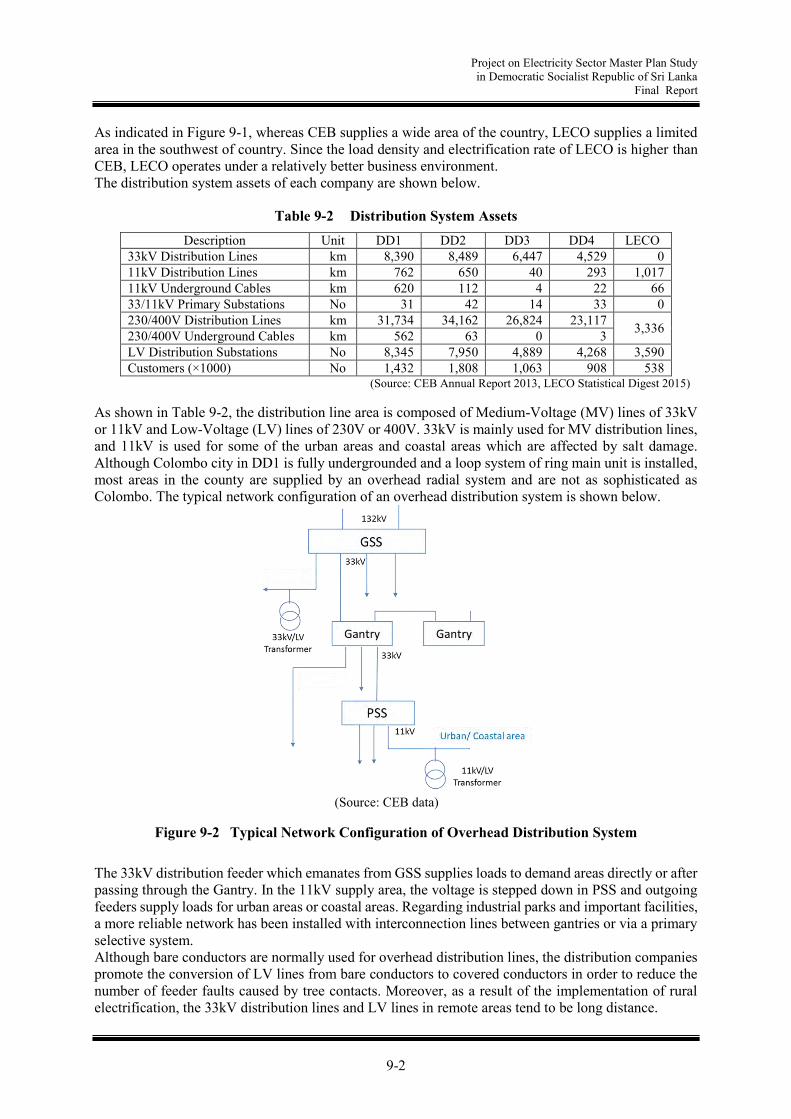
Project on Electricity Sector Master Plan Study in Democratic Socialist Republic of Sri Lanka
Final Report
9-2
As indicated in Figure 9-1, whereas CEB supplies a wide area of the country, LECO supplies a limited area in the southwest of country. Since the load density and electrification rate of LECO is higher than CEB, LECO operates under a relatively better business environment. The distribution system assets of each company are shown below.
Table 9-2 Distribution System Assets
Description Unit DD1 DD2 DD3 DD4 LECO 33kV Distribution Lines km 8,390 8,489 6,447 4,529 0 11kV Distribution Lines km 762 650 40 293 1,017 11kV Underground Cables km 620 112 4 22 66 33/11kV Primary Substations No 31 42 14 33 0 230/400V Distribution Lines km 31,734 34,162 26,824 23,117 3,336 230/400V Underground Cables km 562 63 0 3 LV Distribution Substations No 8,345 7,950 4,889 4,268 3,590 Customers (×1000) No 1,432 1,808 1,063 908 538
(Source: CEB Annual Report 2013, LECO Statistical Digest 2015)
As shown in Table 9-2, the distribution line area is composed of Medium-Voltage (MV) lines of 33kV or 11kV and Low-Voltage (LV) lines of 230V or 400V. 33kV is mainly used for MV distribution lines, and 11kV is used for some of the urban areas and coastal areas which are affected by salt damage. Although Colombo city in DD1 is fully undergrounded and a loop system of ring main unit is installed, most areas in the county are supplied by an overhead radial system and are not as sophisticated as Colombo. The typical network configuration of an overhead distribution system is shown below.
(Source: CEB data)
Figure 9-2 Typical Network Configuration of Overhead Distribution System
The 33kV distribution feeder which emanates from GSS supplies loads to demand areas directly or after passing through the Gantry. In the 11kV supply area, the voltage is stepped down in PSS and outgoing feeders supply loads for urban areas or coastal areas. Regarding industrial parks and important facilities, a more reliable network has been installed with interconnection lines between gantries or via a primary selective system. Although bare conductors are normally used for overhead distribution lines, the distribution companies promote the conversion of LV lines from bare conductors to covered conductors in order to reduce the number of feeder faults caused by tree contacts. Moreover, as a result of the implementation of rural electrification, the 33kV distribution lines and LV lines in remote areas tend to be long distance.

Project on Electricity Sector Master Plan Study in Democratic Socialist Republic of Sri Lanka
Final Report
9-3
LECO is supplied from PSS of CEB and 11kV distribution lines are used for MV. Since its supply area is mainly located in southwestern coastal cities, problems such as long distance feeders do not occur.
9.2 Basic policy for distribution system enhancement
We investigated the operational results (System loss rate, reliability indices, etc.) of distribution companies and reviewed the basic policy for system loss reduction and reliability improvement.
9.2.1 Present policy for system loss reduction
The trends in the transmission and distribution losses of CEB and distribution losses in each company area are shown below.
As shown in Figure 9-3, power system losses have dramatically reduced in the last ten years. Moreover, these figures show that the majority of system loss occurs in the distribution system (e.g. 9.6% out of 10.8% were distribution losses in 2013). Each distribution company analyzes MV system losses by using system analysis software (SynerGEE, PSS/ADPT) and has identified its value as roughly 2%. From this analysis, most losses are caused by LV distribution losses and non-technical losses. Although some distribution companies have estimated these values, they have not been quantitatively analyzed.
The countermeasures which are required, from interviews with each company, are shown below.
<DD1> Distribution loss is about 9% in total (2015). The breakdown is that the loss in the MV system (33
kV, 11 kV) is about 2%, the loss in the LV system is about 5%, and the non-technical loss is about 2%.
In the LV system, voltage drops and system losses have not yet been analyzed with analysis software.
As a measure against non-technical loss, automatic meter reading with a communication function (AMR) has been conducted for large-scale customers and each meter is regularly checked. In addition, DD1 plans to install meters to all distribution transformers (DT) over the next three years with ADB funds. It is currently in the phase of bidding. DD1 specifies transformers with larger losses than customer meters, and there is a policy to reduce non-technical losses.
In NP and NCP, the voltage drop is relatively large because MV and LV distribution lines are quite long. In these provinces, voltage improvement via automatic voltage regulators (SVR) is implemented. However, there are only three places in DD1, one of which has not yet started
9.510.0 9.8
10.49.6
4.7
DD1 DD2 DD3 DD4 CEB LECO
Distribution Losses(%)FY 2013
17.316.6
15.715.0 14.6
13.5
11.7
10.7 10.8 10.510.0
2005 2007 2009 2011 2013 2015
Trans. & Distri. Losses(%)
Figure 9-4 Distribution Losses
(Source: CEB & LECO data) (Source: CEB Statistical Digest 2005-2015)
Figure 9-3 Trend in Trans. & Distri. Losses

Project on Electricity Sector Master Plan Study in Democratic Socialist Republic of Sri Lanka
Final Report
9-4
operation. For the city and surrounding areas, MV loss reduction by upgrading 11kV to 33kV has been
planned. <DD2> Distribution loss was 11% in 2015. In terms of technical breakdown, the technical loss is 2% for
MV distribution lines and 5% for LV distribution lines, and the non-technical loss is around 4%. Of the non-technical losses, the ratio of theft is about 1%, which is not so high.
To reduce the loss in LV distribution lines, it is planned to eliminate long-distance power distribution lines by making three-phase LV single-phase wires and installing new transformers. However, due to a lack of budget, the plan has not been fully implemented.
As for the LV distribution lines, investigation using system analysis software has not been conducted. Therefore, there are plans to make use of SynerGEE, which is currently used in the MV distribution system, for the LV system analysis.
For the urban areas of 11kV, where the power demand is growing, there are plans to boost medium voltage from 11 kV to 33 kV in order to improve system loss.
<DD3> Distribution loss has been improved to about 8% in total. Among this, the loss in MV distribution
lines is 2.3%, the technical loss in LV distribution lines is 3%, and the non-technical loss is also about 3%.
As measures against technical loss, new expansion of GSS and PSS, increase in capacity of overload distribution transformers, and new split distribution lines are normally planned. In addition, it is also planned to make the electric wire thicker. There is another plan to properly deal with long-distance LV distribution loss by rearranging the transformers in an appropriate manner.
The non-technical loss issue receives support from the Energy Management Team. Meters with a communication function are installed at large customers, and the condition of the instruments and the amount of usage are checked to see if there is any fraud.
For the purpose of load management of pole transformers and loss reduction, there are plans to install meters with a communication function at all secondary DTs.
<DD4> The distribution loss in 2014 was 9.2%. There is a goal to reduce distribution losses to 6% within
10 years. Of the losses, MV system loss is 2%, and LV and non-technical losses are 7%. However, the breakdown of the 7% has not yet been analyzed.
As measures to reduce the technical loss, three-phase LV single-phase distribution lines and new substations are planned. For the non-technical loss, automatic meter reading for large customers and periodic inspection of meters are carried out. In addition, in order to prevent theft, seals for meters are being implemented.
In order to reduce loss by implementing load control for the distribution transformers, DD4 started to install DT meters experimentally at two or three places. However, the meters do not have a communication function.
<LECO> In LECO, distribution loss is 3.76% (2015). Loss is smaller compared with the DDs. Energy loss is calculated by attaching a meter to the distribution transformer in order to improve
the distribution losses. When the loss is large, checking the meters at each customer makes it possible to discover faults or theft.
LECO wants to reduce the distribution loss by boosting the MV distribution line from 11 kV to 33 kV. However, as the received voltage from CEB has been determined, the plan has not been realized as of now.
Countermeasures are being considered for when the operation rate of distribution transformers exceeds 65%. Control is being carried out under stricter conditions than the regulation stipulated
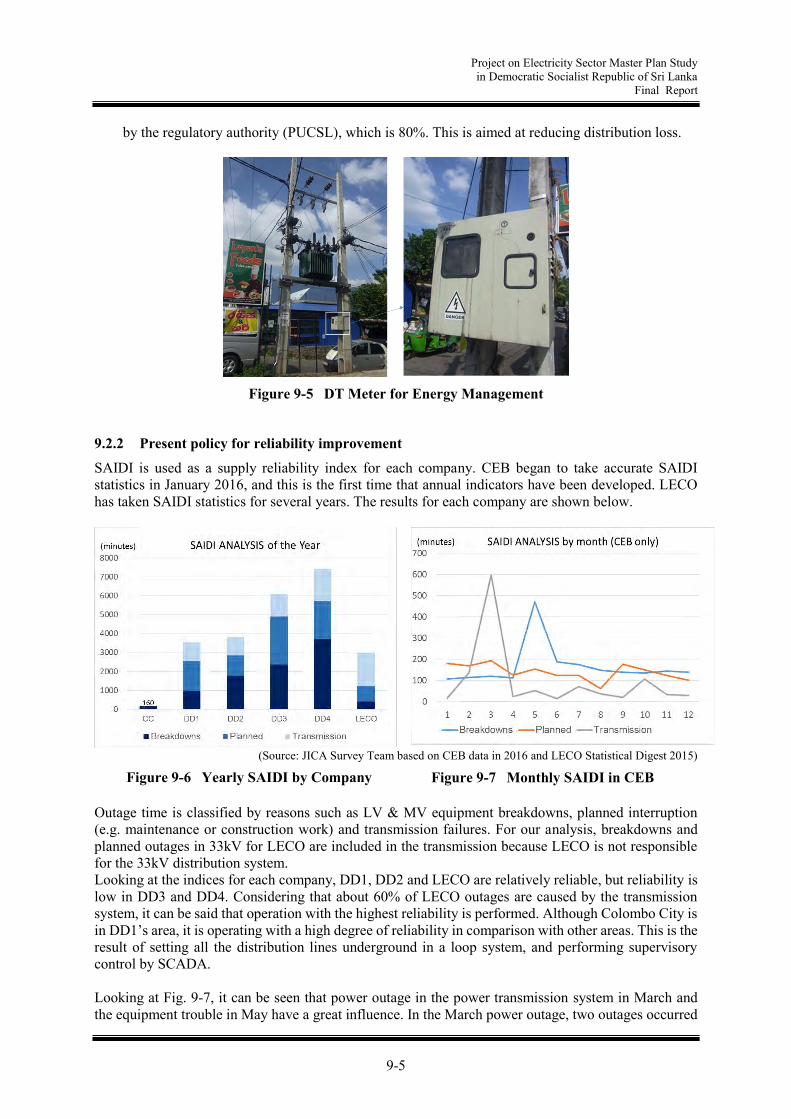
Project on Electricity Sector Master Plan Study in Democratic Socialist Republic of Sri Lanka
Final Report
9-5
by the regulatory authority (PUCSL), which is 80%. This is aimed at reducing distribution loss.
Figure 9-5 DT Meter for Energy Management
9.2.2 Present policy for reliability improvement
SAIDI is used as a supply reliability index for each company. CEB began to take accurate SAIDI statistics in January 2016, and this is the first time that annual indicators have been developed. LECO has taken SAIDI statistics for several years. The results for each company are shown below.
(Source: JICA Survey Team based on CEB data in 2016 and LECO Statistical Digest 2015)
Outage time is classified by reasons such as LV & MV equipment breakdowns, planned interruption (e.g. maintenance or construction work) and transmission failures. For our analysis, breakdowns and planned outages in 33kV for LECO are included in the transmission because LECO is not responsible for the 33kV distribution system. Looking at the indices for each company, DD1, DD2 and LECO are relatively reliable, but reliability is low in DD3 and DD4. Considering that about 60% of LECO outages are caused by the transmission system, it can be said that operation with the highest reliability is performed. Although Colombo City is in DD1’s area, it is operating with a high degree of reliability in comparison with other areas. This is the result of setting all the distribution lines underground in a loop system, and performing supervisory control by SCADA. Looking at Fig. 9-7, it can be seen that power outage in the power transmission system in March and the equipment trouble in May have a great influence. In the March power outage, two outages occurred
Figure 9-6 Yearly SAIDI by Company Figure 9-7 Monthly SAIDI in CEB

Project on Electricity Sector Master Plan Study in Democratic Socialist Republic of Sri Lanka
Final Report
9-6
in the power transmission system, and distribution companies were greatly affected. In May, large-scale blackouts occurred due to natural disasters, mainly in DD2 and DD4. In order to reduce the power outage time, measures for each target factor are necessary. For example, in order to reduce power outages in the event of equipment trouble, effective measures are to introduce distribution automation systems and fault indicators for early recovery of accidents, and to improve aspects of the equipment to reduce some kinds of equipment failure. In order to reduce the effect of planned outages, networking of the power grid that reduces the outage area/section is effective as well. The countermeasures which are required from interviews with each company are shown below. <DD1> Covering of LV naked wires is 10% complete as of present. All new LV distribution lines are covered
conductors. The overhead distribution system in CEB is basically radial. In the industrial areas, power supply by
dedicated line or by main and reserve lines are employed based on the requests from large customers. In this case, additional necessary expenses are borne by the customer.
Auto Reclosers are installed on the Gantry and 33 kV distribution lines. The reclosers and relays of GSS are coordinated in protection. When a distribution accident occurs, the recloser on the power supply side of the accident point opens, and the accident point is separated. The maximum number of reclosers to be installed in one feeder is three, and beyond that, protection coordination becomes difficult.
Figure 9-8 Auto Recloser Installed on the Gantry
Regarding overhead MV lines, accident current passing indicators (FI: Fault indicator) of pole
mounted type are installed on utility poles. However, they are susceptible to the influence of magnetic fields from the low voltage line and the transformer, so the detection accuracy is low.
Fault detection for a distribution accident is roughly performed via customer calls and the fault indicator (FI) which is attached to the overhead distribution line. After that, a visual inspection is done. As for underground cable, a fault point exploration device is used to find the accident point.
The above device detects the fault point based on the time difference between the magnetic field generated by the surge and the arc sound of the fault point. Since it is difficult to detect the arc sound during the daytime due to the considerable noise in towns, fault point searching is generally conducted at night.

Project on Electricity Sector Master Plan Study in Democratic Socialist Republic of Sri Lanka
Final Report
9-7
For a distribution line accident, there is one engineer in charge of each area in all 30 areas. Accident causes are normally categorized into 17 categories. However, detailed analyses of failures and countermeasures have not been made.
As a countermeasure against salt damage in the coastal areas, DD1 is conducting 11 kV distribution utilizing 33 kV insulators. However, DD1 recognize that this is not a fundamental solution. For this reason, countermeasures such as replacement with salt resistant insulators, periodic cleaning of insulators, and special painting are planned.
In order to reduce construction interruptions, DD1 performs hot-line work using hot sticks only for 33kV steel tower maintenance work (the tool is manufactured by A. B. Chance, USA).
<DD2> Currently, the overhead MV system is basically radial. However, there is a policy to increase the
loop system according to the importance of the supply area. Industrial parks and major cities are designated as important areas, and reliability is decided according to the area’s needs.
An auto recloser is installed on the overhead 33 kV distribution lines, with at most two units per feeder.
In many cases, accident points at distribution lines are recognized by power interruption notifications from customers. The call center operates on a 24-hour basis. After receiving a customer’s call, the call center informs the area office and the restoration group located at each local office performs the restoration work.
Detecting the accident point is done by visual inspection. When an accident point is found, the accident section is separated by the line switch on the power supply side of the accident point, and power restoration is carried out in the healthy section. Depending on the length of the distribution line, it can take a long time to find the accident point.
FIs (NortRoll made) are installed at 15 to 20% of the overhead power distribution lines. Both conductor-attached type and pole-mounted type are used. Some FIs have a communication function and it is possible to remotely monitor the status.
Figure 9-9 Fault indicator for overhead distribution lines
<DD3> As an improvement for power supply reliability, expansion of the installation of FIs and auto
reclosers is planned. FIs are conductor-attached type. Some FIs have a communication function and can monitor the status remotely.
Since the auto recloser needs protection coordination with the substation CB, it is normally installed in one place on the Gantry. As for the long-distance feeders, up to two reclosers are installed per feeder.

Project on Electricity Sector Master Plan Study in Democratic Socialist Republic of Sri Lanka
Final Report
9-8
LV distribution lines are planned to be replaced with covered wires, and all newly installed wires are covered conductor.
FIs are preferentially installed at some places where tree contacts are frequent and distances of distribution lines are long.
Regarding causes of accidents, tree contacts with bare conductors are dominant; other causes are blown fuses and bad weather (heavy rain due to the monsoon from May to September, equipment failure due to strong winds and thunder in the central mountain area throughout the year).
As a measure against lightning strikes, Arresters are installed on the primary side of each transformer (DT) and on the pull-in pole of large customers. In some cases, due to lightning strikes of IKL 100, equipment failures may occur.
DD3 does not perform direct live line work by hot stick. Therefore, when maintenance or new power supply work is conducted, distribution lines at the site are stopped and construction work is carried out during an outage.
Figure 9-10 Distribution Transformer (DT) and Arrester
To improve reliability, Vegetation Management (tree cutting) is carried out. Depending on the
growth of trees, they are cut about three times a year. The separation from trees is set to 5 feet at LV lines and 15 feet at MV lines.
For large-scale customers such as some big factories, power supply reliability is increased by supply from a main & reserve line (by two parallel lines) due to customer requests.
<DD4> In a distribution accident, the target distribution line is identified by customer calls. The call center
then contacts the area office. The recovery team normally detects accident points by visual inspection.
The main reason for distribution line accidents is tree contacts, which are a problem especially in rural areas where the length of distribution lines is long. For this reason, according to the patrol provision of PUCSL, tree patrols are conducted twice to four times a year.
DD4 is working on replacing LV bare conductors with covered ones to reduce the number of outages due to trees. There are plans to replace every bare conductor with covered wires within five years.
Measures for grid side enhancement, installing grid interconnections, have not been carried out because they are expensive. We are taking measures on the equipment side mainly by installing an auto recloser or a manual load break switch. These devices do not have a communication function, and are operated in a standalone manner.

Project on Electricity Sector Master Plan Study in Democratic Socialist Republic of Sri Lanka
Final Report
9-9
Installation places for auto reclosers are determined by the length of the distribution line and the frequency of accidents. Up to two are installed in total, one for the Gantry and one for the distribution line. GSS relays and reclosers are set to be coordinated.
<LECO> SAIDI/SAIFI statistics are well managed. In the results for 2015, SAIDI is 50.55h and SAIFI is 91
times. Of these, about 60% are outages due to the CEB system with a higher voltage level. The overhead distribution system is an open loop system interconnected with other distribution
lines. MV distribution lines are operated at 50% of normal occupancy rate. However, since the operation rate of the higher voltage system is already large, it is sometimes impossible to switch the load.
The length of the distribution lines is generally about 3 km. A manual LBS is installed every 1 km, and 3 to 6 are installed per distribution line. In the event of a power outage, the accident section is separated and power is transmitted in the healthy section. Although an auto recloser is installed on the 33 kV Gantry, one is not installed in the 11 kV distribution line.
An FI is installed in the distribution line, and information is sent to the control center via wireless communication.
When distribution line faults are reported by customer calls, field-workers look for the fault point using FI and visual inspections. Although fault points are relatively easily found due to the short length of distribution lines, it takes a long time to reach the site because they don’t use emergency vehicles to avoid traffic congestion.
The major causes of distribution line accidents are vehicle collisions with utility poles, third party causes (contact with heavy machinery at construction sites, etc.), and animal and tree contacts with the overhead wires.
9.3 Review of Distribution System Master Plan
Each distribution company formulates a “Medium Voltage Distribution System Development Plan”, which is expected to be reviewed once every two years as a 10 year rolling plan. The reviews are carried out at Provincial level by computer modelling and network analysis using computer software such as SynerGEE, and by load forecasting methodology based on a combination of two approaches (Top down and Bottom up) as below. After the computer software identifies future violation points (voltage drop, overloading, etc.) in the distribution system, countermeasures are planned.
Figure 9-11 Demand Forecasting Methodology
(Source: JICA Survey Team)
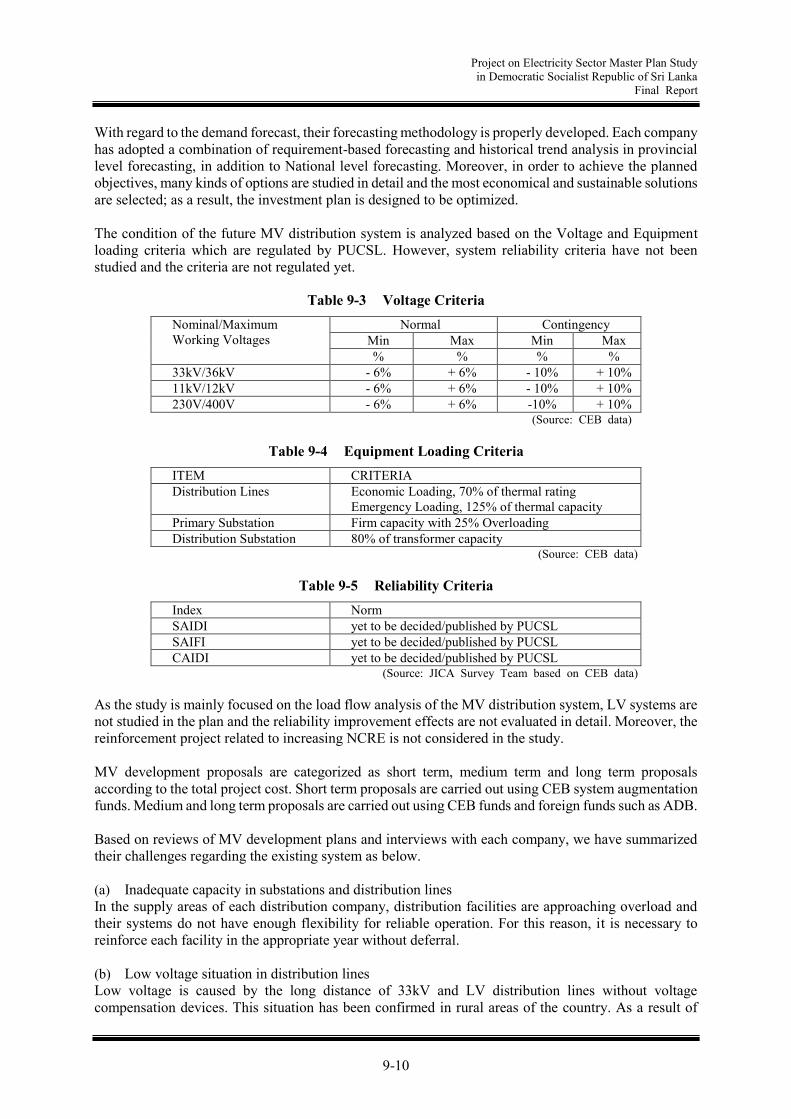
Project on Electricity Sector Master Plan Study in Democratic Socialist Republic of Sri Lanka
Final Report
9-10
With regard to the demand forecast, their forecasting methodology is properly developed. Each company has adopted a combination of requirement-based forecasting and historical trend analysis in provincial level forecasting, in addition to National level forecasting. Moreover, in order to achieve the planned objectives, many kinds of options are studied in detail and the most economical and sustainable solutions are selected; as a result, the investment plan is designed to be optimized. The condition of the future MV distribution system is analyzed based on the Voltage and Equipment loading criteria which are regulated by PUCSL. However, system reliability criteria have not been studied and the criteria are not regulated yet.
Table 9-3 Voltage Criteria Nominal/Maximum Working Voltages
Normal Contingency Min Max Min Max % % % %
33kV/36kV - 6% + 6% - 10% + 10% 11kV/12kV - 6% + 6% - 10% + 10% 230V/400V - 6% + 6% -10% + 10%
(Source: CEB data)
Table 9-4 Equipment Loading Criteria ITEM CRITERIA Distribution Lines Economic Loading, 70% of thermal rating
Emergency Loading, 125% of thermal capacity Primary Substation Firm capacity with 25% Overloading Distribution Substation 80% of transformer capacity
(Source: CEB data)
Table 9-5 Reliability Criteria Index Norm SAIDI yet to be decided/published by PUCSL SAIFI yet to be decided/published by PUCSL CAIDI yet to be decided/published by PUCSL
(Source: JICA Survey Team based on CEB data) As the study is mainly focused on the load flow analysis of the MV distribution system, LV systems are not studied in the plan and the reliability improvement effects are not evaluated in detail. Moreover, the reinforcement project related to increasing NCRE is not considered in the study. MV development proposals are categorized as short term, medium term and long term proposals according to the total project cost. Short term proposals are carried out using CEB system augmentation funds. Medium and long term proposals are carried out using CEB funds and foreign funds such as ADB. Based on reviews of MV development plans and interviews with each company, we have summarized their challenges regarding the existing system as below. (a) Inadequate capacity in substations and distribution lines In the supply areas of each distribution company, distribution facilities are approaching overload and their systems do not have enough flexibility for reliable operation. For this reason, it is necessary to reinforce each facility in the appropriate year without deferral. (b) Low voltage situation in distribution lines Low voltage is caused by the long distance of 33kV and LV distribution lines without voltage compensation devices. This situation has been confirmed in rural areas of the country. As a result of
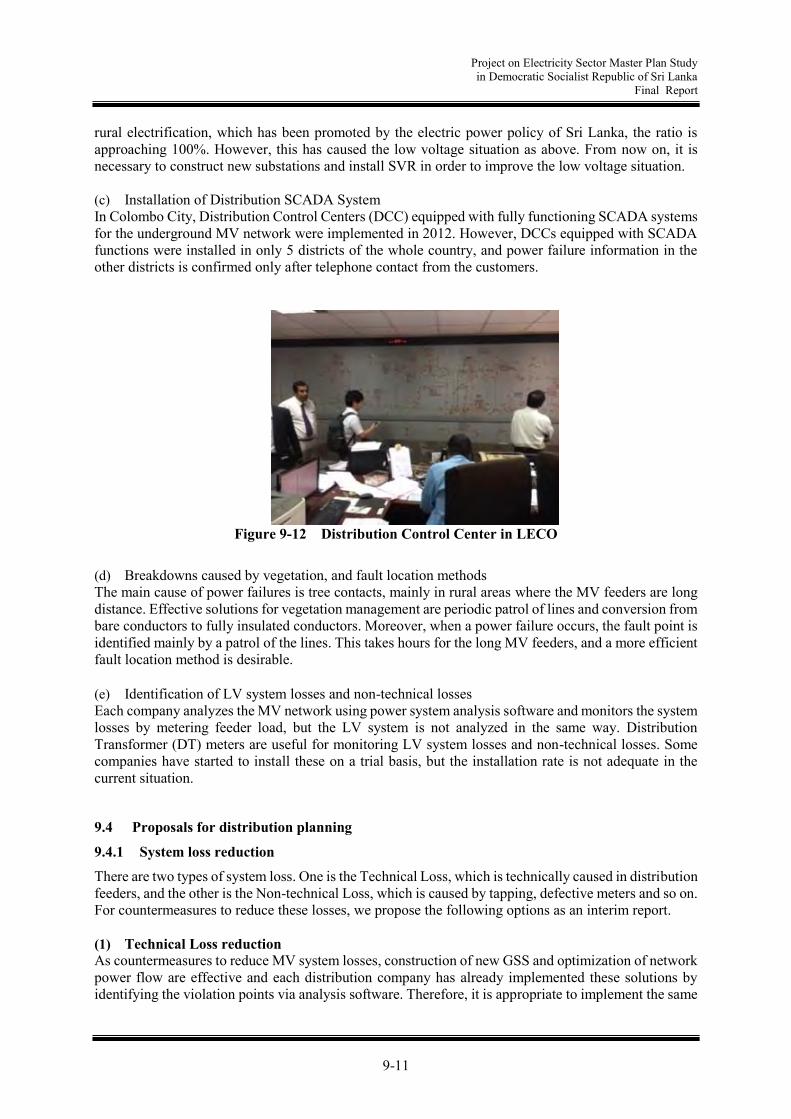
Project on Electricity Sector Master Plan Study in Democratic Socialist Republic of Sri Lanka
Final Report
9-11
rural electrification, which has been promoted by the electric power policy of Sri Lanka, the ratio is approaching 100%. However, this has caused the low voltage situation as above. From now on, it is necessary to construct new substations and install SVR in order to improve the low voltage situation. (c) Installation of Distribution SCADA System In Colombo City, Distribution Control Centers (DCC) equipped with fully functioning SCADA systems for the underground MV network were implemented in 2012. However, DCCs equipped with SCADA functions were installed in only 5 districts of the whole country, and power failure information in the other districts is confirmed only after telephone contact from the customers.
Figure 9-12 Distribution Control Center in LECO
(d) Breakdowns caused by vegetation, and fault location methods The main cause of power failures is tree contacts, mainly in rural areas where the MV feeders are long distance. Effective solutions for vegetation management are periodic patrol of lines and conversion from bare conductors to fully insulated conductors. Moreover, when a power failure occurs, the fault point is identified mainly by a patrol of the lines. This takes hours for the long MV feeders, and a more efficient fault location method is desirable. (e) Identification of LV system losses and non-technical losses Each company analyzes the MV network using power system analysis software and monitors the system losses by metering feeder load, but the LV system is not analyzed in the same way. Distribution Transformer (DT) meters are useful for monitoring LV system losses and non-technical losses. Some companies have started to install these on a trial basis, but the installation rate is not adequate in the current situation.
9.4 Proposals for distribution planning
9.4.1 System loss reduction
There are two types of system loss. One is the Technical Loss, which is technically caused in distribution feeders, and the other is the Non-technical Loss, which is caused by tapping, defective meters and so on. For countermeasures to reduce these losses, we propose the following options as an interim report. (1) Technical Loss reduction As countermeasures to reduce MV system losses, construction of new GSS and optimization of network power flow are effective and each distribution company has already implemented these solutions by identifying the violation points via analysis software. Therefore, it is appropriate to implement the same
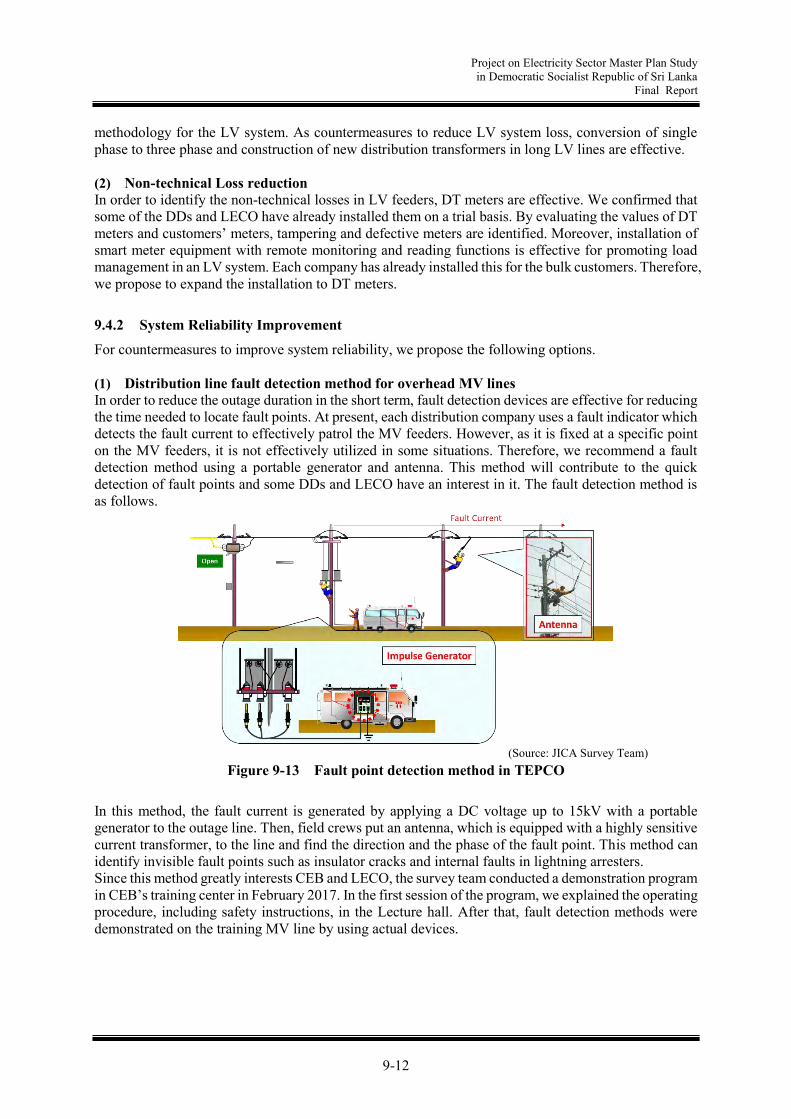
Project on Electricity Sector Master Plan Study in Democratic Socialist Republic of Sri Lanka
Final Report
9-12
methodology for the LV system. As countermeasures to reduce LV system loss, conversion of single phase to three phase and construction of new distribution transformers in long LV lines are effective. (2) Non-technical Loss reduction In order to identify the non-technical losses in LV feeders, DT meters are effective. We confirmed that some of the DDs and LECO have already installed them on a trial basis. By evaluating the values of DT meters and customers’ meters, tampering and defective meters are identified. Moreover, installation of smart meter equipment with remote monitoring and reading functions is effective for promoting load management in an LV system. Each company has already installed this for the bulk customers. Therefore, we propose to expand the installation to DT meters.
9.4.2 System Reliability Improvement
For countermeasures to improve system reliability, we propose the following options.
(1) Distribution line fault detection method for overhead MV lines In order to reduce the outage duration in the short term, fault detection devices are effective for reducing the time needed to locate fault points. At present, each distribution company uses a fault indicator which detects the fault current to effectively patrol the MV feeders. However, as it is fixed at a specific point on the MV feeders, it is not effectively utilized in some situations. Therefore, we recommend a fault detection method using a portable generator and antenna. This method will contribute to the quick detection of fault points and some DDs and LECO have an interest in it. The fault detection method is as follows.
Figure 9-13 Fault point detection method in TEPCO
In this method, the fault current is generated by applying a DC voltage up to 15kV with a portable generator to the outage line. Then, field crews put an antenna, which is equipped with a highly sensitive current transformer, to the line and find the direction and the phase of the fault point. This method can identify invisible fault points such as insulator cracks and internal faults in lightning arresters. Since this method greatly interests CEB and LECO, the survey team conducted a demonstration program in CEB’s training center in February 2017. In the first session of the program, we explained the operating procedure, including safety instructions, in the Lecture hall. After that, fault detection methods were demonstrated on the training MV line by using actual devices.
(Source: JICA Survey Team)

Project on Electricity Sector Master Plan Study in Democratic Socialist Republic of Sri Lanka
Final Report
9-13
Figure 9-14 Workshop in Lecture hall Figure 9-15 Demonstration in Training Field
In addition, in this demonstration, together with the charging device, technical introductions on overcurrent indicators and enclosed cutouts made in Japan were also introduced. Questionnaires were given to the participants and the following results were obtained. The participants of the workshop were engineers from the planning and development department of each company.
Table 9-6 Questionnaire for the Workshop & Demonstration Question Device Score Q.1 How interested are you in each device?
(low = 1, high = 5) Fault Point Detector 4.0 Fault Indicator 3.7 Enclosed Cutout 4.3
Q.2 What was the most impressive device/tool? Fault Point Detector 14/38 Enclosed Cutout 10/38
Q.3 How did you understand the fault detection method in Japan? (poorly = 1, fully understood = 5)
4.2
Q.4 Is it possible to introduce the fault point detection in Sri Lanka at the moment? (not possible = 1, possible = 5)
3.8
Total Participants: 58, Effective Replies: 38
As shown in Table 9-6, participants evaluated the fault point detector highly. However, some participants pointed out the insufficiency of the applied voltage for the 33kV system, which might result in undetectable situations with regard to high resistance ground faults and internal faults in lightning arresters. In order to introduce this device, it is necessary to verify the technical issues which may arise from using this equipment. First, DC 15kV is less than the rated voltage of 33kV distribution lines. In general, the cause of distribution line faults comes from a permanent ground fault in which the electrical circuit is connected to ground through fault points such as tree contacts, equipment failure, salt contamination, etc. In this case, the fault current depends on the resistance of the fault point, so the detection capacity of fault locators does not depend on the distribution voltage. Therefore, it is highly likely that this equipment can be applied for a permanent ground fault at a 33kV distribution line, but verification on real lines is also required.
(Source: JICA Survey Team)

Project on Electricity Sector Master Plan Study in Democratic Socialist Republic of Sri Lanka
Final Report
9-14
Second, the detectable range of this ground fault detector is approximately 30 km from the DC pulse injection point. In the CEB's 33kV distribution lines, there are some long lines that are over 100km. In such cases, it is necessary to take countermeasures which divide such feeders into 30km or less by installing some section switches. For distribution lines with high frequency of accidents, it is effective to use the fault current indicator (FCI) that can detect the fault current together with the fault detection device for more actual location to be detected as well. Third, safety concerns was raised by CEB because the LV side of distribution lines is also energized through a distribution transformer when applying DC voltage to an MV line. In Japan, we do not take safety measures such as opening the transformer primary side when applying pulse into the MV line. This is because it is the DC pulse, and the apply time is very short from 10 to 500 ms, and also the secondary current is very small due to the internal resistance of the transformer. Therefore, there is no adverse effect on the transformer and the secondary side. In order to introduce this device, it is necessary to implement a pilot project with cost-benefit analysis in the actual field in order to identify the suitable DC voltage to be applied, ground fault detection range, safety measures and other issues. (2) Introduction of Enclosed Cutouts Generally, a cutout is installed on the primary side of a distribution transformer in order to disconnect it from the MV distribution line. In Sri Lanka, open type is adopted for cutouts, and the structure of the fuse holder is exposed as below. An enclosed cutout is adopted in Japan, and the structure of the fuse holder is concealed with the insulator. The main benefit of an enclosed cutout is a reduction in the number of equipment breakdowns by preventing tree contacts and salt contamination. Since there are many coastal and forest areas in Sri Lanka, the introduction of enclosed cutouts would be effective. However, since this product isn’t currently manufactured for 33kV, we propose to focus on 11kV distribution lines. In addition, a detailed study should be carried out with CEB regarding the installation, maintenance and operation before adopting these devices in the field. Moreover, a comparative study should also be implemented to assess other devices such as a polymer fuse cutout.
Figure 9-16 Comparison of Cutout Structures
(3) Distribution automation with sequential fault location methods As a measure for improving reliability, it is considered desirable to introduce Japan's timed delivery method in accordance with the Western-style reclose method. This is a method where the automatic switchgear controls are based on the following logic.
(Source: JICA Survey Team)

Project on Electricity Sector Master Plan Study in Democratic Socialist Republic of Sri Lanka
Final Report
9-15
(a) When the power supply is lost, all of the switches open automatically. (b) When a switch detects voltage in its supply side after (a), it counts 7 seconds and closes
automatically. (c) If a fault occurs again within 5 seconds of (b), the switch regards its load side as a fault area and
remains open (lockout). In this method, protection coordination is characterized by simple time setting alone. It is more effective in connecting a plurality of automatic switches in series and has high expandability for long distance distribution lines. However, since reclosers have already been installed in most of the Gantries, by applying this method on the load side of the recloser, it will be a more effective facility configuration method as it utilizes the existing facilities. Moreover, by applying this method on the load side of the recloser, the number of operation times for the circuit breaker at the substation is the same as before the introduction of the proposed method. Therefore, it has no effect on the lifetime of the circuit breaker.
Figure 9-17 Fault Location Methods
When applying this to CEB distribution lines, it is also necessary to establish a time setting related to the length of the distribution line and to verify its effects, such as proper operation. Confirmation of the coordination verification is also important for practical application in protection relays at substations with the proposed system. (4) Upgrade to Multi-Divided and Multi-Connected distribution network Distribution networks in Sri Lanka are normally composed of a radial system. In order to improve system reliability, it is effective to upgrade to a loop system. However, double the capacity of new feeders is required because a loop system needs to ensure enough capacity to support tie feeders in a contingency situation. This leads to an increase in investment. As a measure to solve this problem, we recommend the Multi-Divided and Multi-Connected network, which is widely adopted in Japan. In it, MV feeders are divided into 3 sections. The normal operation rate is 75% and it is more efficient than a loop system. Therefore, this leads to system reliability improvements with moderate investment. However, as a result of interviews with DDs, it was confirmed that there are cases in which land acquisition and tree cutting are rejected by landowners when planning interconnection lines. For this reason, it is necessary to carefully examine the routes of distribution lines.
(Source: JICA Survey Team)

Project on Electricity Sector Master Plan Study in Democratic Socialist Republic of Sri Lanka
Final Report
9-16
(5) Conversion from bare to covered conductors in MV lines For reduction of failures caused by vegetation, it is effective to convert bare conductors to insulated conductors in the MV systems of mountainous areas because power outages in the MV system affect a large number of customers. Recently, in the forest reserve areas where cleaning of ay leaves is restricted in DD4, an MV line of about 5km has been constructed with partially insulated conductors for the first time in Sri Lanka. However, some technical issues should be considered before it is introduced. First, CEB uses aerial bundled cables for insulated conductors, and this gives rise to some technical issues such as the need for special connection materials and construction methods, and inductive interference on tele-communication lines due to the large slack of wires. In Japan, we use covered electric wires separated one by one, and we do not have much difference in construction and materials from bare electric wires, so we would like to propose this method. Second, insulated conductors tend to be torn off by lightning due to their high insulation level. Therefore, some countermeasures should be applied such as installation of clamp insulators with an arcing-horn function, and arrester built-in transformers and overhead ground wires. Third, when insulated conductors are installed in coastal areas, they tend to deteriorate due to the saline effect. This issue can be solved by introducing salt resistant-type insulated wires or limiting the conversion area to non-coastal areas.
Figure 9-18 Typical distribution line in Japan
(6) Indirect hot-line work to reduce planned outages In the long term, a reduction in planned outages caused by construction and maintenance work at MV lines is required to improve system reliability. In Japan, most distribution work for MV lines is implemented by indirect hot-line work to reduce planned outages while securing the safety of workers. Although some companies have already adopted this method only for maintenance work at distribution towers, it is necessary to expand adoption to other distribution work. Therefore, it is required to introduce tools such as hot sticks for 11kV and 33kV overhead lines, bypass cables, temporary transformers and bypass switches for hot-line work. Furthermore, it is necessary to standardize the design of hot-line work and the construction method, and to develop an operation manual that includes a safety policy and inspection standards. An example of non-interruption work in Japan is shown below.
(Source: JICA Survey Team)

Project on Electricity Sector Master Plan Study in Democratic Socialist Republic of Sri Lanka
Final Report
9-17
Figure 9-19 Example of non-interruption distribution work method in Japan
9.4.3 Study on the installation of smart grid technology
For smart grid technology, our survey focuses on SCADA, Smart meters and EMS (Energy Management System), and investigates the current situation for each technology and future possibilities for introduction. As for the development of SCADA and smart meters, CEB is requesting cooperation from other countries on technical and financial aspects. Currently, CEB is requesting financial support from AFD (Agence Française de Développement = France Development Agency). (1) SCADA (a) Current Situation In Sri Lanka, a Distribution Control Center (DCC) equipped with fully functioning SCADA systems was introduced for the first time in 2009. At that time, micro SCADA, which is a software product by NortRoll, was introduced to DD1’s North Western Province, North Central Province and North Province. Each DCC has a separate installation of NortRoll SCADA software, and they operate as three independent systems. However, as the SCADA system does not support industry standards such as IEC protocols, DCCs perform only remote operation and monitoring of Load Break Switches (LBS), which is provided by the specific manufacturers. Auto Reclosers and other LBS in the network are not directly connected to the SCADA. Conversely, Colombo city in DD1 and Kandy city in DD2, which introduced DCCs in recent years, are designed with high versatility and all the remote devices such as switches and FIs are directly connected to the SCADA system. The present status of DCC development as of 2016 is shown in the table below.
Table 9-7 Existing DCCs in Each Company
Company Province Present Status of DCC Development SCADA System
DD1
NWP Fully functioning NortRoll, micro-SCADA NCP Fully functioning " NP Fully functioning "
CC Fully functioning Siemens, Spectrum Power 4.5
WPN Fully functioning ICONICS, Genisis64
(Source: JICA Survey Team)

Project on Electricity Sector Master Plan Study in Democratic Socialist Republic of Sri Lanka
Final Report
9-18
DD2 CP
Fully functioning (Kandy) GE, ifix At development stage (Others)
EP At design stage ICONICS, Genisis64
DD3 WPS2 Fully functioning GE, ifix Sab Fully functioning NortRoll, micro-SCADA Uva At design stage GE, ifix
DD4 WPS1 At design stage SP At study stage
LECO At development stage (Source: CEB document)
(b) Proposal As shown in Table 9-7, SCADA systems from different manufacturers are used in each distribution company, and the functions and extensibility of the systems differ. For example, WPS2 in DD3 have built a highly scalable system with ifix, and it supports multiple protocols. However, EP in DD2 have developed a system with WSOS version 5, which supports only a specific vendor’s switch. The SCADA architecture in WPS 2 is shown below.
(Source: CEB document)
Figure 9-20 SCADA Architecture in WPS2
From the above reasons, it is necessary to study optimum SCADA systems, communication methods and automation equipment in the whole of Sri Lanka. The following points need to be considered. ・Replacement of existing protocols which do not directly support the industry standards. ・Designing of SCADA with open platform communication (OPC) that cables the exchange of data
between multi-vendor devices and controls applications without proprietary restrictions. (2) Smart Meters (a) Current Situation Electricity customers are basically categorized into retail customers, whose contract demand is less than 42kVA, and bulk customers, whose contract demand is more than 42kVA. Distribution companies have installed Static Meters for remote meter reading for bulk customers, but the meters for retail customers are the electro-mechanical type, which are not equipped with a remote communication facility. Although distribution companies plan to replace the meters of retail customers with the Static Meters, there are big differences in the development of smart meters between CEB and LECO.
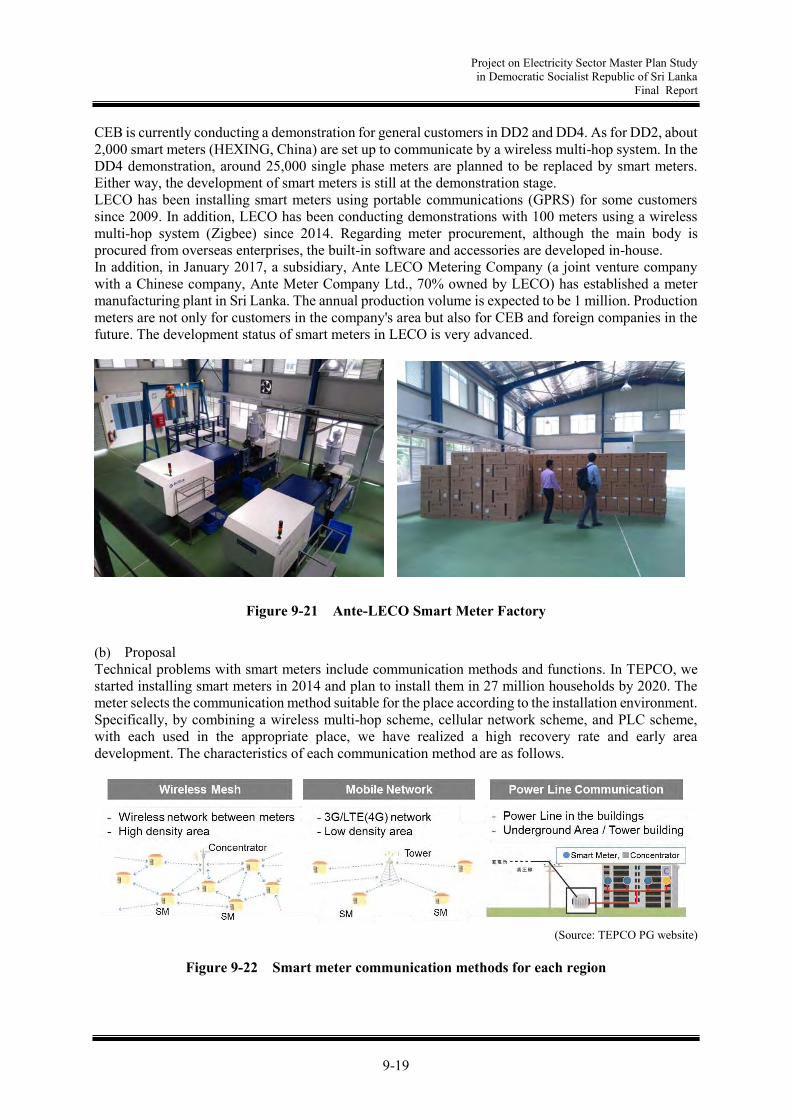
Project on Electricity Sector Master Plan Study in Democratic Socialist Republic of Sri Lanka
Final Report
9-19
CEB is currently conducting a demonstration for general customers in DD2 and DD4. As for DD2, about 2,000 smart meters (HEXING, China) are set up to communicate by a wireless multi-hop system. In the DD4 demonstration, around 25,000 single phase meters are planned to be replaced by smart meters. Either way, the development of smart meters is still at the demonstration stage. LECO has been installing smart meters using portable communications (GPRS) for some customers since 2009. In addition, LECO has been conducting demonstrations with 100 meters using a wireless multi-hop system (Zigbee) since 2014. Regarding meter procurement, although the main body is procured from overseas enterprises, the built-in software and accessories are developed in-house. In addition, in January 2017, a subsidiary, Ante LECO Metering Company (a joint venture company with a Chinese company, Ante Meter Company Ltd., 70% owned by LECO) has established a meter manufacturing plant in Sri Lanka. The annual production volume is expected to be 1 million. Production meters are not only for customers in the company's area but also for CEB and foreign companies in the future. The development status of smart meters in LECO is very advanced.
Figure 9-21 Ante-LECO Smart Meter Factory
(b) Proposal Technical problems with smart meters include communication methods and functions. In TEPCO, we started installing smart meters in 2014 and plan to install them in 27 million households by 2020. The meter selects the communication method suitable for the place according to the installation environment. Specifically, by combining a wireless multi-hop scheme, cellular network scheme, and PLC scheme, with each used in the appropriate place, we have realized a high recovery rate and early area development. The characteristics of each communication method are as follows.
(Source: TEPCO PG website)
Figure 9-22 Smart meter communication methods for each region

Project on Electricity Sector Master Plan Study in Democratic Socialist Republic of Sri Lanka
Final Report
9-20
The most commonly used method is the wireless multi-hop method. In this method, a plurality of meter information is aggregated into concentrators by radio communication between meters and then communicated to a data center. The advantage of this method is that it can aggregate up to 100 data points. By reducing the number of communication points, communication cost can be reduced. The next common method is a cellular network, and it is applied in suburbs and mountainous areas. Although this method has good communication conditions, communication is one by one, so the number of communication points increases and the cost increases accordingly. According to an interview conducted by the JICA survey team, in the case of the wireless multi-hop scheme (Zigbee), the initial cost is about 6,000 LKR and the monthly usage fee is about 0.5 LKR. In contrast, in the case of the cellular network, the initial cost is about 3,000 LKR and the monthly usage fee is about 5 LKR. For this reason, although the initial cost is higher for the wireless system, the total amount of initial and running costs will be higher for the cellular network system after five years have passed. A power line carrier system has not been introduced in Sri Lanka at this time. However, this scheme is effective for places where multiple smart meters are concentrated, like high-rise apartments. Currently, construction of high-rise apartments is proceeding mainly in the area around Colombo, so application of a PLC scheme may be effective in these areas. In terms of the functions of a smart meter, the following three points are desirable.
• Sending of periodic amounts of electric energy to the server • Remote control of built-in switchgear & limitation of usage according to contract capacity • Monitoring of voltage, current, and switch conditions
Figure 9-23 Smart Meter and Conventional meter
(3) EMS (a) Current Situation When renewable energy is connected at a high ratio to the system capacity, the frequency of the entire system fluctuates due to output fluctuation from the renewable energy. There is also the problem that the power quality deteriorates. EMS is a system that can maximize the output of renewable energy while maintaining power quality by controlling wind power and solar power generation, and storage batteries. The government of Sri Lanka is planning to drastically increase renewable energy capacity by 2040 with NCREs such as mini-hydro, solar and wind. As NCREs of 10MW or less are directly connected to the distribution system, EMS is required for the system.
Table 9-8 Wind-Solar Hybrid Systems in Jaffna Number of Customers 800 persons Wind Turbines 20kW Solar PV system 46kW

Project on Electricity Sector Master Plan Study in Democratic Socialist Republic of Sri Lanka
Final Report
9-21
Battery system 110kWh/52kW Diesel generator 30kW
(Source: CEB Document) Currently, no commercial EMS system has been installed in Sri Lanka, but CEB has great interest in the system. (b) Proposal In Japan, an EMS demonstration using an independent small network is being carried out in island areas. An outline of the demonstration system currently being conducted in Niijima is shown below.
Figure 9-24 EMS demonstration system on Niijima Island
Since Sri Lanka has few island areas, there is little need to apply the above system as it is. However, there is a demand for improving reliability by constructing a micro grid for some customers. Although supply reliability in Sri Lanka is still not of a particularly high standard, reliable power supply is required for military facilities, hospitals, large commercial facilities, and so on. Moreover, in recent years, solar power generation has been rapidly increasing at customers’ premises on the basis of a governmental promotion policy for renewable energy. For this reason, an independent operation system using renewable energy is required at times of grid power failure.
(Source: JICA Survey Team)
Project on Electricity Sector Master Plan Study in Democratic Socialist Republic of Sri Lanka
Final Report
10-1
Chapter 10. System Operation
10.1 Present Power System Situation
The JICA Survey Team visited the system control center in Colombo belonging to CEB and checked the present system operation situation based on provided documents, data and interviews. Below are photos of the system control center.
Figure 10-1 Building and inside operator room of system control center
10.1.1 Demand and Supply Operation
(1) Demand Records Annual peak demands for the most recent three years are shown below. All of them were recorded at lighting time.
Table 10-1 Annual peak demands of most recent three years and date and time of occurrence
Daily load curves for one day at peak demand last year are shown below. Features of a typical daily load curve are the following: Around 3:00 Minimum demand in the day 4:30 to 6:00 Increasing massively until the peak in the morning Around 11:30 Peak demand in the daytime 12:00 to 13:00 A small drop during lunch time Around 15:00 A small rise to about the same demand as the peak in the daytime 16:00 to 16:30 After working hours, demand drops temporarily 19:00 to 19:30 Peak demand in the day during lighting time Around 20:00 Decreasing massively after the peak
2013 April 8th 19:00 2164.2 MW
2014 May 19th 19:30 2151.7 MW
2015 September 22th 19:00 2283.4 MW
Year TotalMonth Date Time
(Source: CEB data)

Project on Electricity Sector Master Plan Study in Democratic Socialist Republic of Sri Lanka
Final Report
10-2
Figure 10-2 Daily load curve for one day at peak demand last year (22nd Sep in 2015)
(2) Frequency Records Frequency records around the peak demand last year are shown below. Demand during this period from 6pm to 10pm fluctuated from 1700MW to 2300MW and then to 1500MW.
Figure 10-3 Frequency records around peak demand last year (from 6pm to 10pm on 22nd Sep in 2015)
(Source: CEB data)
(Source: CEB data)
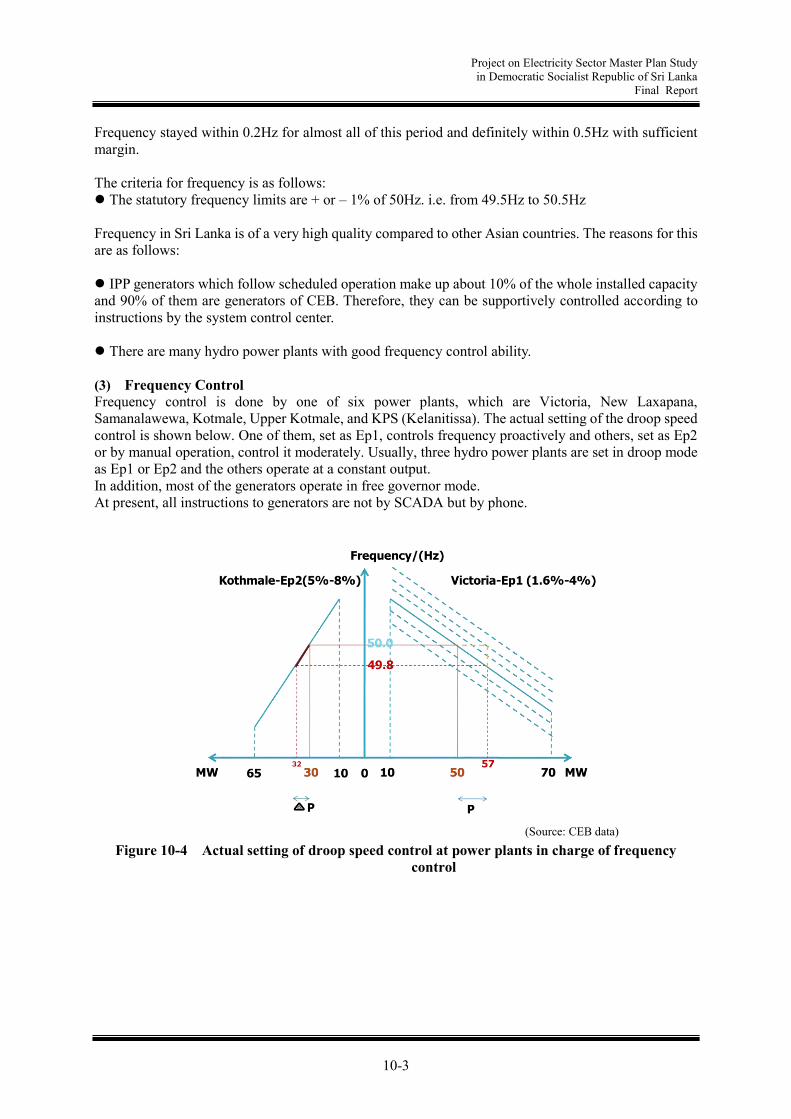
Project on Electricity Sector Master Plan Study in Democratic Socialist Republic of Sri Lanka
Final Report
10-3
Frequency stayed within 0.2Hz for almost all of this period and definitely within 0.5Hz with sufficient margin. The criteria for frequency is as follows: The statutory frequency limits are + or – 1% of 50Hz. i.e. from 49.5Hz to 50.5Hz Frequency in Sri Lanka is of a very high quality compared to other Asian countries. The reasons for this are as follows: IPP generators which follow scheduled operation make up about 10% of the whole installed capacity and 90% of them are generators of CEB. Therefore, they can be supportively controlled according to instructions by the system control center. There are many hydro power plants with good frequency control ability.
(3) Frequency Control Frequency control is done by one of six power plants, which are Victoria, New Laxapana, Samanalawewa, Kotmale, Upper Kotmale, and KPS (Kelanitissa). The actual setting of the droop speed control is shown below. One of them, set as Ep1, controls frequency proactively and others, set as Ep2 or by manual operation, control it moderately. Usually, three hydro power plants are set in droop mode as Ep1 or Ep2 and the others operate at a constant output. In addition, most of the generators operate in free governor mode. At present, all instructions to generators are not by SCADA but by phone.
Figure 10-4 Actual setting of droop speed control at power plants in charge of frequency control
(Source: CEB data)
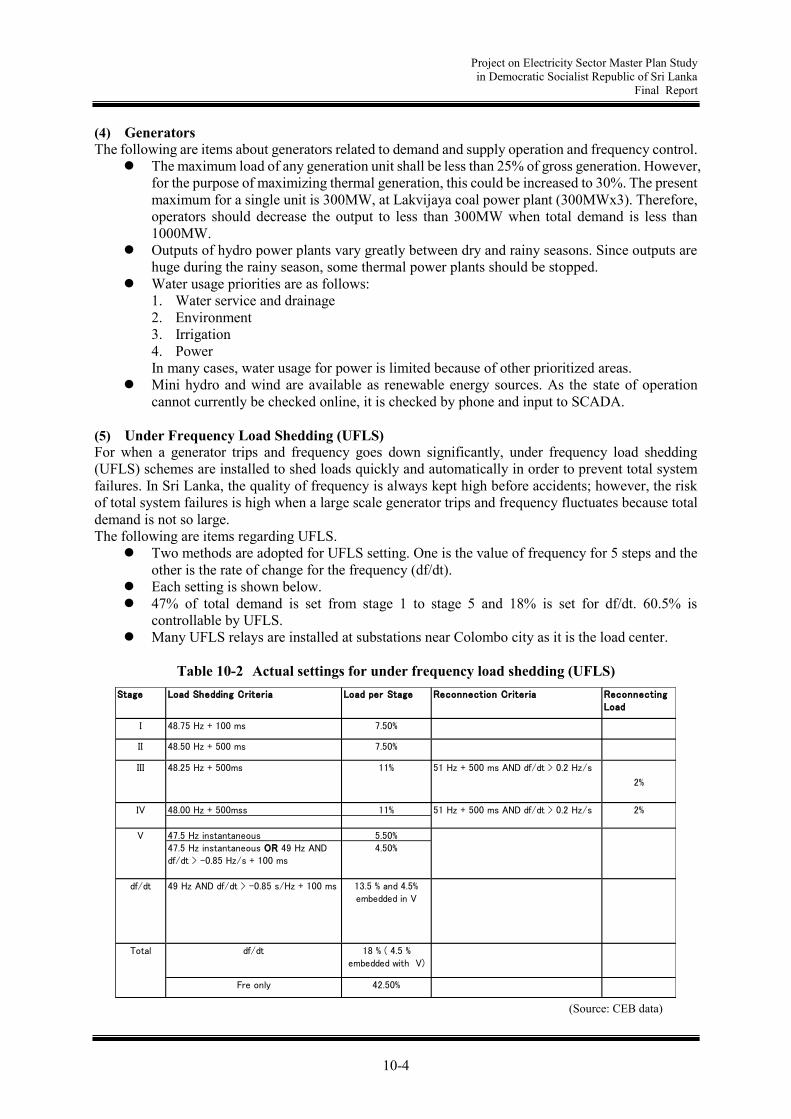
Project on Electricity Sector Master Plan Study in Democratic Socialist Republic of Sri Lanka
Final Report
10-4
(4) Generators The following are items about generators related to demand and supply operation and frequency control.
The maximum load of any generation unit shall be less than 25% of gross generation. However, for the purpose of maximizing thermal generation, this could be increased to 30%. The present maximum for a single unit is 300MW, at Lakvijaya coal power plant (300MWx3). Therefore, operators should decrease the output to less than 300MW when total demand is less than 1000MW.
Outputs of hydro power plants vary greatly between dry and rainy seasons. Since outputs are huge during the rainy season, some thermal power plants should be stopped.
Water usage priorities are as follows: 1. Water service and drainage 2. Environment 3. Irrigation 4. Power In many cases, water usage for power is limited because of other prioritized areas.
Mini hydro and wind are available as renewable energy sources. As the state of operation cannot currently be checked online, it is checked by phone and input to SCADA.
(5) Under Frequency Load Shedding (UFLS) For when a generator trips and frequency goes down significantly, under frequency load shedding (UFLS) schemes are installed to shed loads quickly and automatically in order to prevent total system failures. In Sri Lanka, the quality of frequency is always kept high before accidents; however, the risk of total system failures is high when a large scale generator trips and frequency fluctuates because total demand is not so large. The following are items regarding UFLS.
Two methods are adopted for UFLS setting. One is the value of frequency for 5 steps and the other is the rate of change for the frequency (df/dt).
Each setting is shown below. 47% of total demand is set from stage 1 to stage 5 and 18% is set for df/dt. 60.5% is
controllable by UFLS. Many UFLS relays are installed at substations near Colombo city as it is the load center.
Table 10-2 Actual settings for under frequency load shedding (UFLS)
I 48.75 Hz + 100 ms 7.50%
II 48.50 Hz + 500 ms 7.50%
48.25 Hz + 500ms 11%
48.00 Hz + 500mss 11%
47.5 Hz instantaneous 5.50%47.5 Hz instantaneous OR 49 Hz ANDdf/dt > -0.85 Hz/s + 100 ms
4.50%
df/dt 18 % ( 4.5 %embedded with V)
Fre only 42.50%
III 51 Hz + 500 ms AND df/dt > 0.2 Hz/s
2%
Stage Load Shedding Criteria Load per Stage Reconnection Criteria ReconnectingLoad
Total
IV 51 Hz + 500 ms AND df/dt > 0.2 Hz/s 2%
V
df/dt 49 Hz AND df/dt > -0.85 s/Hz + 100 ms 13.5 % and 4.5%embedded in V
(Source: CEB data)
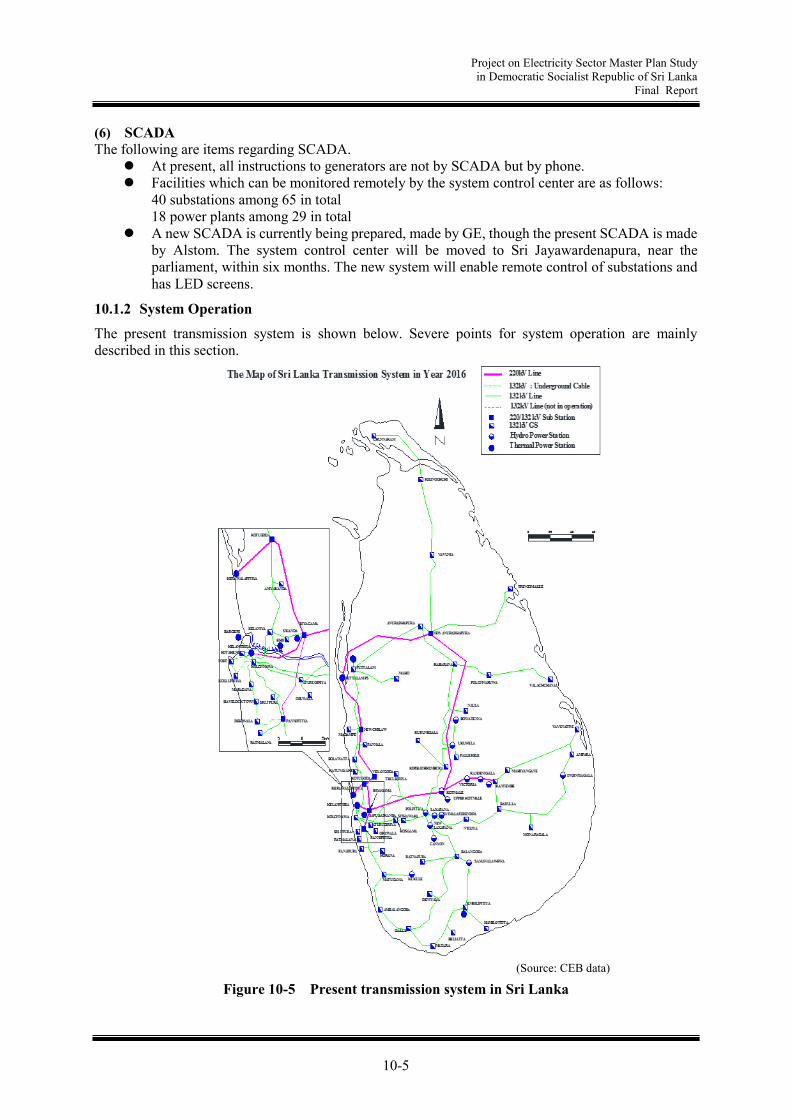
Project on Electricity Sector Master Plan Study in Democratic Socialist Republic of Sri Lanka
Final Report
10-5
(6) SCADA The following are items regarding SCADA.
At present, all instructions to generators are not by SCADA but by phone. Facilities which can be monitored remotely by the system control center are as follows:
40 substations among 65 in total 18 power plants among 29 in total
A new SCADA is currently being prepared, made by GE, though the present SCADA is made by Alstom. The system control center will be moved to Sri Jayawardenapura, near the parliament, within six months. The new system will enable remote control of substations and has LED screens.
10.1.2 System Operation
The present transmission system is shown below. Severe points for system operation are mainly described in this section.
Figure 10-5 Present transmission system in Sri Lanka
(Source: CEB data)
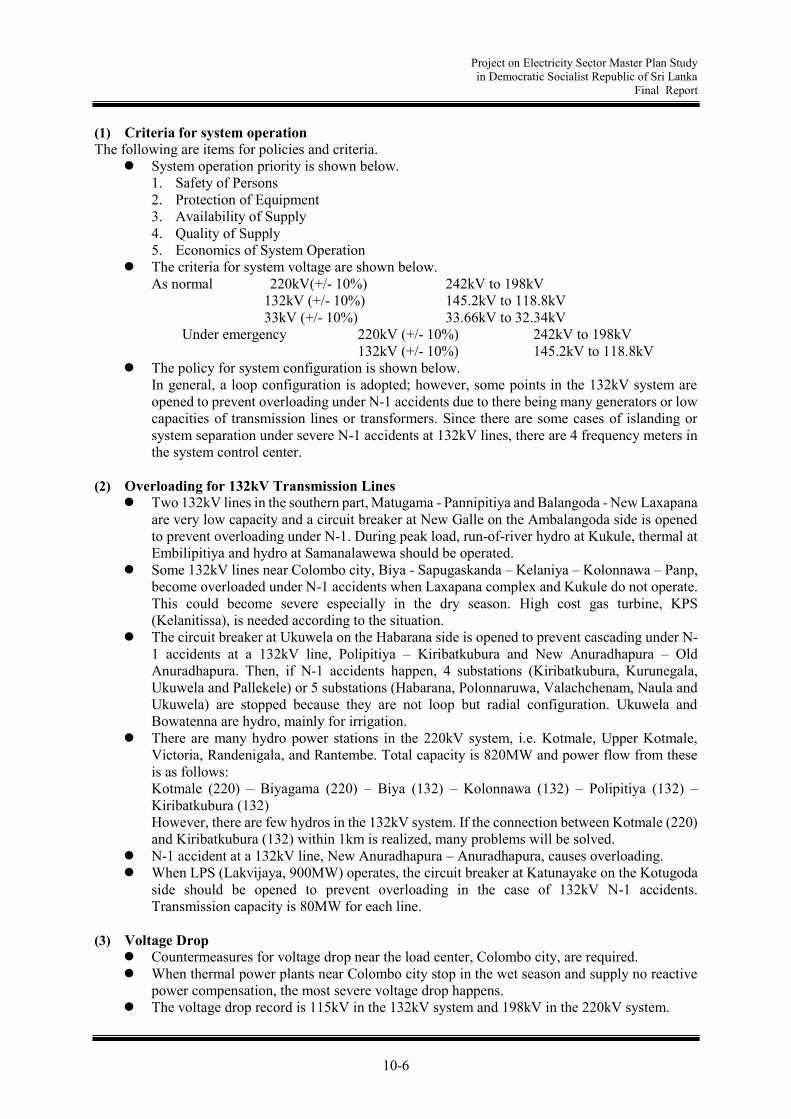
Project on Electricity Sector Master Plan Study in Democratic Socialist Republic of Sri Lanka
Final Report
10-6
(1) Criteria for system operation The following are items for policies and criteria.
System operation priority is shown below. 1. Safety of Persons 2. Protection of Equipment 3. Availability of Supply 4. Quality of Supply 5. Economics of System Operation
The criteria for system voltage are shown below. As normal 220kV(+/- 10%) 242kV to 198kV
132kV (+/- 10%) 145.2kV to 118.8kV 33kV (+/- 10%) 33.66kV to 32.34kV
Under emergency 220kV (+/- 10%) 242kV to 198kV 132kV (+/- 10%) 145.2kV to 118.8kV The policy for system configuration is shown below.
In general, a loop configuration is adopted; however, some points in the 132kV system are opened to prevent overloading under N-1 accidents due to there being many generators or low capacities of transmission lines or transformers. Since there are some cases of islanding or system separation under severe N-1 accidents at 132kV lines, there are 4 frequency meters in the system control center.
(2) Overloading for 132kV Transmission Lines Two 132kV lines in the southern part, Matugama - Pannipitiya and Balangoda - New Laxapana
are very low capacity and a circuit breaker at New Galle on the Ambalangoda side is opened to prevent overloading under N-1. During peak load, run-of-river hydro at Kukule, thermal at Embilipitiya and hydro at Samanalawewa should be operated.
Some 132kV lines near Colombo city, Biya - Sapugaskanda – Kelaniya – Kolonnawa – Panp, become overloaded under N-1 accidents when Laxapana complex and Kukule do not operate. This could become severe especially in the dry season. High cost gas turbine, KPS (Kelanitissa), is needed according to the situation.
The circuit breaker at Ukuwela on the Habarana side is opened to prevent cascading under N-1 accidents at a 132kV line, Polipitiya – Kiribatkubura and New Anuradhapura – Old Anuradhapura. Then, if N-1 accidents happen, 4 substations (Kiribatkubura, Kurunegala, Ukuwela and Pallekele) or 5 substations (Habarana, Polonnaruwa, Valachchenam, Naula and Ukuwela) are stopped because they are not loop but radial configuration. Ukuwela and Bowatenna are hydro, mainly for irrigation.
There are many hydro power stations in the 220kV system, i.e. Kotmale, Upper Kotmale, Victoria, Randenigala, and Rantembe. Total capacity is 820MW and power flow from these is as follows: Kotmale (220) – Biyagama (220) – Biya (132) – Kolonnawa (132) – Polipitiya (132) – Kiribatkubura (132) However, there are few hydros in the 132kV system. If the connection between Kotmale (220) and Kiribatkubura (132) within 1km is realized, many problems will be solved.
N-1 accident at a 132kV line, New Anuradhapura – Anuradhapura, causes overloading. When LPS (Lakvijaya, 900MW) operates, the circuit breaker at Katunayake on the Kotugoda
side should be opened to prevent overloading in the case of 132kV N-1 accidents. Transmission capacity is 80MW for each line.
(3) Voltage Drop Countermeasures for voltage drop near the load center, Colombo city, are required. When thermal power plants near Colombo city stop in the wet season and supply no reactive
power compensation, the most severe voltage drop happens. The voltage drop record is 115kV in the 132kV system and 198kV in the 220kV system.
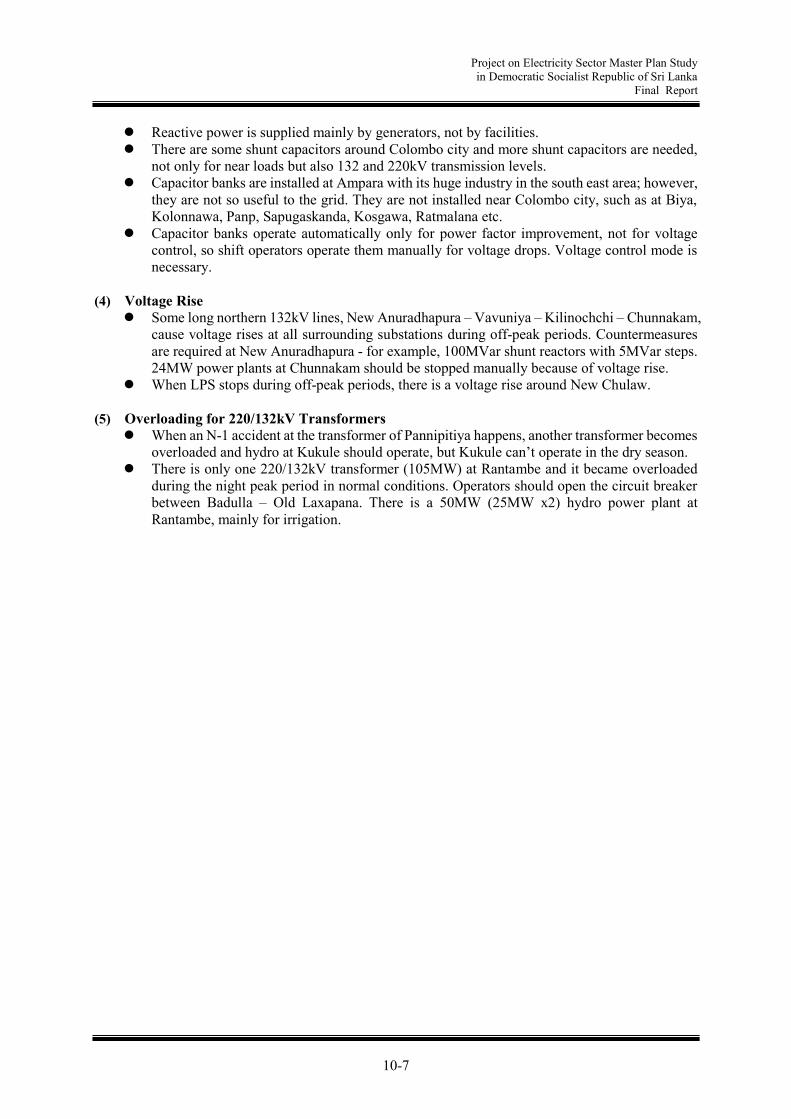
Project on Electricity Sector Master Plan Study in Democratic Socialist Republic of Sri Lanka
Final Report
10-7
Reactive power is supplied mainly by generators, not by facilities. There are some shunt capacitors around Colombo city and more shunt capacitors are needed,
not only for near loads but also 132 and 220kV transmission levels. Capacitor banks are installed at Ampara with its huge industry in the south east area; however,
they are not so useful to the grid. They are not installed near Colombo city, such as at Biya, Kolonnawa, Panp, Sapugaskanda, Kosgawa, Ratmalana etc.
Capacitor banks operate automatically only for power factor improvement, not for voltage control, so shift operators operate them manually for voltage drops. Voltage control mode is necessary.
(4) Voltage Rise
Some long northern 132kV lines, New Anuradhapura – Vavuniya – Kilinochchi – Chunnakam, cause voltage rises at all surrounding substations during off-peak periods. Countermeasures are required at New Anuradhapura - for example, 100MVar shunt reactors with 5MVar steps. 24MW power plants at Chunnakam should be stopped manually because of voltage rise.
When LPS stops during off-peak periods, there is a voltage rise around New Chulaw.
(5) Overloading for 220/132kV Transformers When an N-1 accident at the transformer of Pannipitiya happens, another transformer becomes
overloaded and hydro at Kukule should operate, but Kukule can’t operate in the dry season. There is only one 220/132kV transformer (105MW) at Rantambe and it became overloaded
during the night peak period in normal conditions. Operators should open the circuit breaker between Badulla – Old Laxapana. There is a 50MW (25MW x2) hydro power plant at Rantambe, mainly for irrigation.
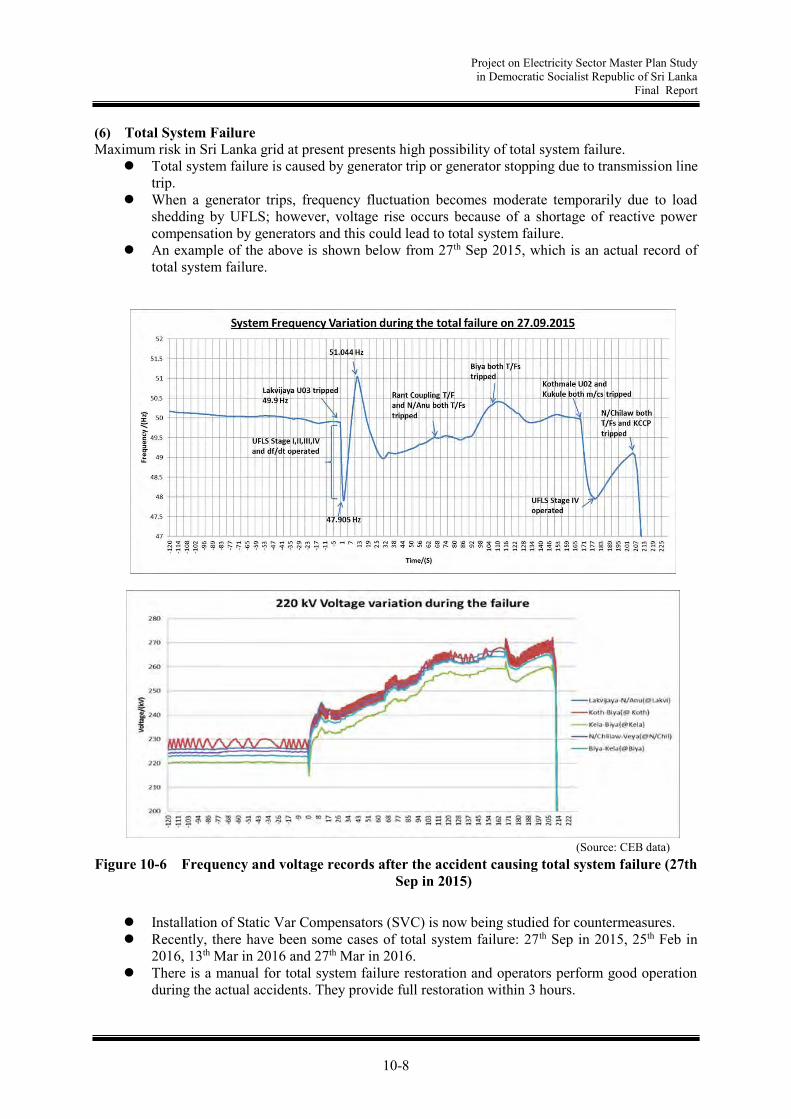
Project on Electricity Sector Master Plan Study in Democratic Socialist Republic of Sri Lanka
Final Report
10-8
(6) Total System Failure Maximum risk in Sri Lanka grid at present presents high possibility of total system failure.
Total system failure is caused by generator trip or generator stopping due to transmission line trip.
When a generator trips, frequency fluctuation becomes moderate temporarily due to load shedding by UFLS; however, voltage rise occurs because of a shortage of reactive power compensation by generators and this could lead to total system failure.
An example of the above is shown below from 27th Sep 2015, which is an actual record of total system failure.
Figure 10-6 Frequency and voltage records after the accident causing total system failure (27th Sep in 2015)
Installation of Static Var Compensators (SVC) is now being studied for countermeasures. Recently, there have been some cases of total system failure: 27th Sep in 2015, 25th Feb in
2016, 13th Mar in 2016 and 27th Mar in 2016. There is a manual for total system failure restoration and operators perform good operation
during the actual accidents. They provide full restoration within 3 hours.
(Source: CEB data)

Project on Electricity Sector Master Plan Study in Democratic Socialist Republic of Sri Lanka
Final Report
10-9
Black start generators are shown below. They are tested once a month and can be started up within 15 minutes after the accident.
1. Kelanitissa GT 16MW x4 2. New Laxapana 3. Victoria, Kotmale, Mahaweli 4. Samanalawewa
10.1.3 Personnel in System Control Center
The head of the system control center is the Deputy General Manager (DGM) and there are three groups. Each of their roles are shown below. Each group has one chief engineer (CE) and two or three electrical engineers (EE). There are 25 members in total including 16 shift operators.
Operations Planning Group (OP) Weekly dispatch planning
System Operations Group (SO) Day to day dispatch planning Interruption planning in transmission lines Operation of transmission system Dispatching of power plants (operators belong to this group)
Operation Audit Group (CE) Review of the operation Analysis of generation and transmission data
Documentation for management decision making Each squad of shift operators consists of two electrical engineers and two assistants. There are five squads and three shifts. There are 10 electrical engineers and six assistants in total. The structure of the system control center is shown below.
Figure 10-7 Structure of system control center
(Source: CEB data)

Project on Electricity Sector Master Plan Study in Democratic Socialist Republic of Sri Lanka
Final Report
10-10
10.2 Recommendations for improvements regarding system operation
An evaluation of the current power system operation from all the information above is given below. The quality of frequency is kept at a high level compared to other developing Asian countries. There are clearly many voltage control issues, especially for low voltage around Colombo city
and high voltage around the northern part with its long transmission lines. Because reactive power supply is mainly from generators in service, when important generators are stopped there could be severe voltage issues. In the worst cases there have been total system blackouts when generators tripped.
Routes of transmission lines and numbers of transformers are small and capacities are also insufficient, so there is a high possibility of overloading of facilities when normal or N-1 contingencies happen.
System operation for contingencies, including total blackouts, is quick and accurate. There is little room for improvement.
The biggest risk is total system failure because of overloading and/or voltage uncontrollability. Recommendations for fundamental improvements regarding system operation are shown below, considering the opinion of the System Control Center.
Installation of new transmission lines and transformers with sufficient capacity, properly based on an accurate demand forecast when the transmission development plan is created.
Installation of reactive power supply facilities such as shunt capacitors, shunt reactors, SVC and STATCOM based on a study of voltage control to change the current situation, which depends heavily on generators, when the transmission development plan is created.
These studies are considered and reflected in Chapter 8 “Transmission Development Plan”.
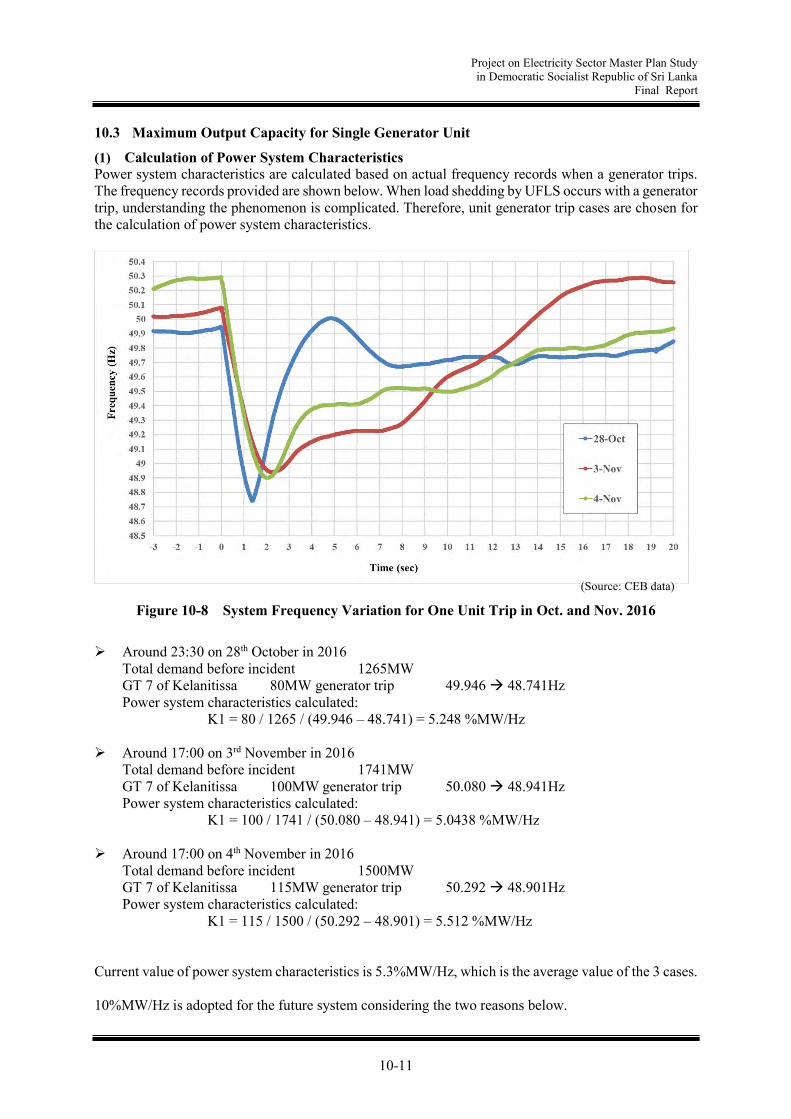
Project on Electricity Sector Master Plan Study in Democratic Socialist Republic of Sri Lanka
Final Report
10-11
10.3 Maximum Output Capacity for Single Generator Unit
(1) Calculation of Power System Characteristics Power system characteristics are calculated based on actual frequency records when a generator trips. The frequency records provided are shown below. When load shedding by UFLS occurs with a generator trip, understanding the phenomenon is complicated. Therefore, unit generator trip cases are chosen for the calculation of power system characteristics.
Figure 10-8 System Frequency Variation for One Unit Trip in Oct. and Nov. 2016
Around 23:30 on 28th October in 2016
Total demand before incident 1265MW GT 7 of Kelanitissa 80MW generator trip 49.946 48.741Hz Power system characteristics calculated:
K1 = 80 / 1265 / (49.946 – 48.741) = 5.248 %MW/Hz Around 17:00 on 3rd November in 2016
Total demand before incident 1741MW GT 7 of Kelanitissa 100MW generator trip 50.080 48.941Hz Power system characteristics calculated:
K1 = 100 / 1741 / (50.080 – 48.941) = 5.0438 %MW/Hz Around 17:00 on 4th November in 2016
Total demand before incident 1500MW GT 7 of Kelanitissa 115MW generator trip 50.292 48.901Hz Power system characteristics calculated:
K1 = 115 / 1500 / (50.292 – 48.901) = 5.512 %MW/Hz
Current value of power system characteristics is 5.3%MW/Hz, which is the average value of the 3 cases. 10%MW/Hz is adopted for the future system considering the two reasons below.
(Source: CEB data)
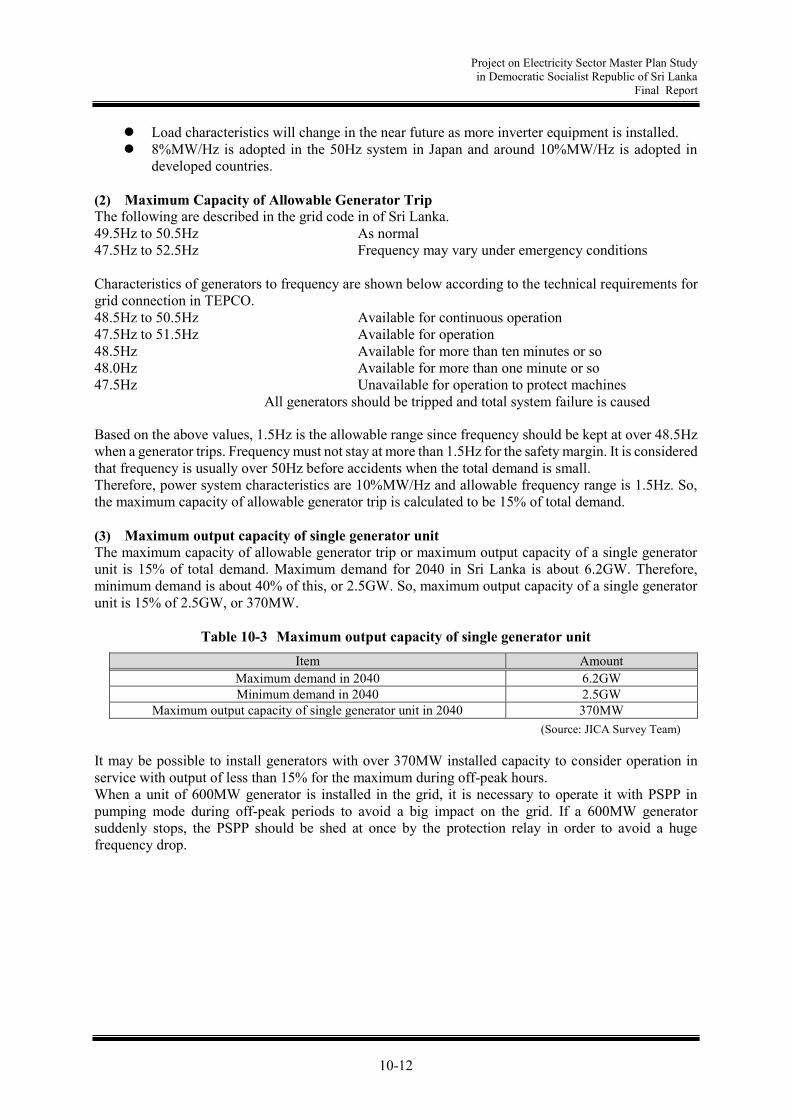
Project on Electricity Sector Master Plan Study in Democratic Socialist Republic of Sri Lanka
Final Report
10-12
Load characteristics will change in the near future as more inverter equipment is installed. 8%MW/Hz is adopted in the 50Hz system in Japan and around 10%MW/Hz is adopted in
developed countries. (2) Maximum Capacity of Allowable Generator Trip The following are described in the grid code in of Sri Lanka. 49.5Hz to 50.5Hz As normal 47.5Hz to 52.5Hz Frequency may vary under emergency conditions Characteristics of generators to frequency are shown below according to the technical requirements for grid connection in TEPCO. 48.5Hz to 50.5Hz Available for continuous operation 47.5Hz to 51.5Hz Available for operation 48.5Hz Available for more than ten minutes or so 48.0Hz Available for more than one minute or so 47.5Hz Unavailable for operation to protect machines
All generators should be tripped and total system failure is caused Based on the above values, 1.5Hz is the allowable range since frequency should be kept at over 48.5Hz when a generator trips. Frequency must not stay at more than 1.5Hz for the safety margin. It is considered that frequency is usually over 50Hz before accidents when the total demand is small. Therefore, power system characteristics are 10%MW/Hz and allowable frequency range is 1.5Hz. So, the maximum capacity of allowable generator trip is calculated to be 15% of total demand. (3) Maximum output capacity of single generator unit The maximum capacity of allowable generator trip or maximum output capacity of a single generator unit is 15% of total demand. Maximum demand for 2040 in Sri Lanka is about 6.2GW. Therefore, minimum demand is about 40% of this, or 2.5GW. So, maximum output capacity of a single generator unit is 15% of 2.5GW, or 370MW.
Table 10-3 Maximum output capacity of single generator unit Item Amount
Maximum demand in 2040 6.2GW Minimum demand in 2040 2.5GW
Maximum output capacity of single generator unit in 2040 370MW It may be possible to install generators with over 370MW installed capacity to consider operation in service with output of less than 15% for the maximum during off-peak hours. When a unit of 600MW generator is installed in the grid, it is necessary to operate it with PSPP in pumping mode during off-peak periods to avoid a big impact on the grid. If a 600MW generator suddenly stops, the PSPP should be shed at once by the protection relay in order to avoid a huge frequency drop.
(Source: JICA Survey Team)

Project on Electricity Sector Master Plan Study in Democratic Socialist Republic of Sri Lanka
Final Report
11-1
Chapter 11. Long-term Investment Planning
11.1 Premises for Capital Raising
The power industry in Sri Lanka needs capital investment for the power generating sector and transmission and distribution sector. Assuming that there will be no large-scale sector reform and that CEB will remain as it is now, CEB will have the responsibility for investment in transmission and distribution facilities. (Some states and regions in the United States of America adopt notions of Independent System Operator or Regional Transmission Organization, but these will not apply to Sri Lanka.) There are some choices regarding capital sources for power generating facilities such as CEB itself, Independent Power Producers (IPP), and Joint Ventures (JV). In this chapter, the merits and demerits of these forms of organization and capital sources are examined. As its basic policy for financing, Public Utilities Commission of Sri Lanka (PUCSL) says in its General Policy Guidelines (2009), “Private sector participation will be welcome in generation projects, but the major source of funds for all transmission and distribution development will be from international/bilateral donor agencies. Major hydro power generation will be under the auspices of the GOSL.” For hydro power generation, it is assumed that major dams will be used not only for power generation but also for irrigation, forestry, and other purposes.)
11.1.1 Transmission and Distribution System
(1) Transmission The Transmission sector is under the monopoly of CEB, and CEB should be responsible for investment in transmission facilities. It is desirable that CEB possesses all the facilities as it will operate and manage the assets. Since CEB’s current financial status makes it difficult to raise the necessary funds within its budget for the moment, it will have to rely for most of the funds on assistance from governmental budget or support from donor institutions. The Asian Development Bank (ADB) and JICA have already provided loans. While maintenance and improvement work for the transmission system are financed by CEB internally, CEB relies on donors for the construction of new transmission lines. LTTDP 2015-2024 shows the total investment requirements by foreign and domestic currencies. Most of these funds will be loaned from the Government, with most relying on loans from international/bilateral donors. (2) Distribution The Distribution sector is operated and managed by CEB’s four distribution sectors, i.e., DD1-4, and CEB’s subsidiary, Lanka Electricity Company (LECO). Similar to the transmission system, investment in the distribution sector will be made by CEB and LECO. LECO is a 100% subsidiary of LECO and manages its accounting independently. It raises funds by itself. DD1-4, CEB’s distribution sectors, manage small and short-term repair work with CEB’s internal funds; their fund for long-term and large-scale investments is loaned from governmental budget or donor institutions since CEB’s current financial status makes it difficult to raise the necessary funds within its budget for the moment as PUCSL mentions in the above General Policy Guidelines that the major source of funds for all transmission and distribution development will be from international/bilateral donor agencies.. Since Sri Lanka's electrification is near 100%, no new major distribution line project is currently planned. Most of the distribution work is for maintenance or improvements. Costs for Low Voltage (LV) distribution lines are borne by CEB. Only 20% of the necessary amount has been secured, and thus the work is delayed. Costs for Middle Voltage (MV) lines are usually financed by donor institutions. CEB recently relies on ADB for finance.
Project on Electricity Sector Master Plan Study in Democratic Socialist Republic of Sri Lanka
Final Report
11-2
11.1.2 Generation System
In contrast to the transmission and distribution systems, CEB will be required to explore fund raising to minimize its own funds, or governmental assistance. (Again, PUCSL says, “Private sector participation will be welcome in generation projects.”) For hydro power generation, the GOSL will provide the funds for investment as CEB will own and operate the generating facilities. It is not financially viable for IPPs, as large-scale dams are multi-purposed and pumped storage power plants are for load adjustment during on- and off- peak times. Mini-hydro power generation is regarded as a renewable energy source like biomass, wind power and solar, and is subject to a feed-in-tariff (FIT). Regarding renewable energy projects with more than 10MW capacity, to which FIT is not applied, private investors/operators will evaluate the profitability based on generating costs, and will develop them as IPP if profitability is expected. For thermal power generating facilities that are comparatively larger in capacity and require larger capital investment, there are a few financing options, including CEB’s own funds (= Assistance from GOSL), independent power producers (IPP), joint ventures (JV), and public-private partnerships (PPP). The following section examines the characteristics of these business types.
11.2 Financial Support by Other Donors
Japan, the World Bank, and the ADB are the main ODA suppliers to Sri Lanka. Japan’s ODA to Sri Lanka was 323 million USD, followed by IDAs (mainly WB) at 174, ADB Special Fund at 109, Korea at 52, the US at 49, EU institutes at 41, and Australia at 40, in 2013.
11.2.1 ADB
(1) Policy Assistance For policy assistance, ADB evaluates the 5-year Country Partner Strategy (CPS), but the main issues have shifted from infrastructure (expansion of transmission & distribution system) to i) clean and sustainable generation (renewables) and ii) energy efficiency (conservation, introduction of smart meters etc.). ADB provided support through technical assistance (TA) on “Renewable Energy Master Plan” in 2014, but the report has not been made public due to a change of governmental administration. (2) Distribution Project ADB currently provides loans directly to CEB on a distribution project and renewables project. For the distribution project, ADB provides support for the project to increase the electrification rate from 98% to 100%, and provided a loan of 115 million USD directly to CEB in July 2016 with GOSL’s guarantee. Since the financial situation of CEB has worsened, ADB requested the setting of financial targets in the financial covenant. In the loan for the Electricity Supply Reliability Improvement Project, CEB exercised debt restructuring in 2014. With this as the background, ADB set Financial Targets as below for CEB in the financial covenant of the Loan Agreement for the above project. The Ministry of Finance of Sri Lanka also set an upper limit for loans to CEB.
Table 11-1 Financial Targets in ADB Loan Project Indicator Target
Current ratio 2018: 90%, 2019: 95%, 2020: 100% Debt to Equity Ratio 100%
(Source: Information provided by the ADB)
As described in 9.4.3, ADB has been sponsoring DD-1’s demonstration project of an island micro-grid system using a simple EMS (battery inverter system by SMA, Germany) in Eluvaitive Island, Jaffna.
Project on Electricity Sector Master Plan Study in Democratic Socialist Republic of Sri Lanka
Final Report
11-3
This demonstration research was a grant-type cooperation. As a next step, ADB plans to introduce a hybrid system using wind, solar, battery and diesel generation in surrounding three islands, i.e., Delft, Analaitivu, and Nainativu. Out of 6 MUD for this system, 2 MUSD will be a grant from Japan Fund for Poverty Reduction (JFPR) while the other 4 MUSD will be a loan from ADB. (3) Generation Project For support for renewable energy, ADB has provided a loan for Mannar Wind Farm. ADB approved a USD200 million loan to support the project in order to construct a total of 375MW of wind power generating facilities. CEB informed ADB of its intention to own the first 100MW, which will consist of four areas of 25MW, and the project will enjoy the merits of a feed-in-tariff with a cap amount of 12 cents/kWh. According to ADB, the Bank will not support generation projects that are financially viable. The above loan to Mannar wind Firm is regarded exceptional as this is the first large-scale renewable energy project. (ADB will see to what extent CEB can absorb the cost in a project as large as 100MW.) ADB in general will not provide finance to future LNG-fired TPP; however, there remains possibility of providing loans for fuel supply facilities and for fuel conversion of existing oil-fired TPPs. (4) International Transmission Line between Sri Lanka and India ADB has reached agreement with the governments of Sri Lanka and India on 10 MUSD loan to the detailed design of this project. While this work will be carried out using GOSL’s loaned money, ADB will provide loan to both governments for construction work. Sri Lanka’s representative party is MPRE and Indian counterpart will be Power Grid Co. of India. The consultant is not yet procured now, but the procurement of the consultant will start in 2018. Upon the detailed design is completed, ADB plans to provide loan for construction to both countries for unless serious problems arise. (5) Loan Conditions ADB’s loan conditions will differ by fund. Its general loan conditions are a 20-25 year repayment period with grace period of 5 years, with the interest rate of LIBOR+40bps+10bps. The other type will use an ADB Special Fund and its loan conditions are a 25-year repayment period with an interest rate of 2% (fixed). Under the current financial market situation, where 6-monthly JPY and USD LIBOR are about 0.01% and 1.29% respectively, the former loans seem preferable. While ADB loans have preferable conditions, ADB has requested a governmental guarantee when they are given to CEB directly. ADB also has a policy to limit its loans in the generation field to renewable energy, with no more going to thermal power. The main target of ADB loans will be transmission and distribution in future.
11.2.2 World Bank
The World Bank has been supporting the power sector policy making, for example by evaluating the LTGEP 2015-2034. As a part of this type of support, the World Bank develops the training program for operators of OPTGEN, which is an alternative power development planning tool replacing WASP. The World Bank will not, in principle, provide direct loan to individual projects in Sri Lanka. However, CEB expects the Bank’s loan to be provided for infrastructure (land reclamation, construction of access transmission line etc.) for the Solar Farm (100MW) in Siyambalanduwa, the south-east part of the country.

Project on Electricity Sector Master Plan Study in Democratic Socialist Republic of Sri Lanka
Final Report
11-4
11.3 Business Formation for Generating System (Ownership)
The Sri Lankan electric power system adopts the single buyer model, monopolized by CEB, but the generation sector has been liberalized. In addition to CEB, the major operator, the sector accepts generation by IPPs. Furthermore, a joint venture (JV) in which CEB and another corporation jointly invest has recently been established.
11.3.1 CEB Ownership
Until recently, CEB has constructed, owned, and operated all the generating facilities. There is an option for CEB to continue to do so for some generating facilities in future. The most serious issue for CEB in financing generating facilities by itself is the lack of funds and thus it has to rely on assistance from the GOSL. GOSL will also rely on international/bilateral donor agencies as the governmental budget is limited. As CEB itself is to receive loans from donors or governmental assistance, its debt will increase on its balance sheet. Although these ODA loan conditions are much more preferable than loans from commercial banks, ODA loans will be a burden to CEB’s finance. Therefore, GOSL places a priority on hydro generation, which is not financially viable for the private sector, and leaves thermal power generation to the private sector. Apart from ODA loans, there is an option to use an export credit scheme provided by Export Credit Agencies (ECA). The interest rate is higher than for ODA loans, but ECA enables earlier decisions on financing. Some critics say that it will be more costly if CEB constructs the plant. However, if part of the ODA loan is used to hire an independent and neutral consultant, the consultant will monitor all the processes of designing, bidding and construction supervision, which will avoid unreasonably high construction costs.
11.3.2 Independent Power Producer (IPP)
As PUCSL welcomes private sector participation in generation projects, IPP projects will increase or will become a major business pattern. Since IPP projects are developed, financed and operated by private businesses, CEB will have only to bear the cost of power purchase. CEB has so far signed power purchase agreements (PPA) for 11 projects with IPPs. (One of them is a 15MW diesel generator with a 2 year contract period.) The list of these IPP projects is shown in Table 11-2. The seven IPP projects for which a PPA contract has been completed adopted a contract pattern based on Minimum Guaranteed Energy Amount (MGEA). For these projects, CEB had to pay the minimum amount (in kWh) as contracted, even if the actual generation was less than the contracted amount because its operation/dispatching orders. Most of these projects were small, up to 15MW, and their availability was assumed at around 80%. Currently, four (4) IPP projects are ongoing. Out of them, three (3) projects, for which the PPA agreements have been rather recently signed, are not based on MGEA but on availability. Since an availability-based contract is for keeping the plant ready to operate at full capacity, the capacity charge is set at a higher rate than that for an MGEA-based contract. This pattern of PPA is applied to CCGT with larger unit capacity, and the plants are expected to work as base-load generation. Availability is usually set at 90%. According to CEB, future IPP projects will be larger scale with availability-based PPA.

Project on Electricity Sector Master Plan Study in Democratic Socialist Republic of Sri Lanka
Final Report
11-5
Table 11-2 IPP Projects in Sri Lanka
(Source: Information provided by the CEB)
(4 ongoing IPP projects are: ASIA Power, Northern Power, AES, and West Coast.) Among many thermal projects to be constructed in future, the project of “1x 300MW Natural gas fired combined cycle power plant – Western Region” is scheduled to start operation in 2019. For this project, the Ministry of Power & Renewable Energy (MPRE) published a Request for Proposals for international competitive bidding on 15 November 2016. This plant will be a multi-fuel combined cycle plant. The fuel will be heavy oil etc. for the time being and will be switched to natural gas when Sri Lanka’s first LNG terminal becomes available in the Colombo area. For CEB, one of the major merits of introducing IPP is to evade a huge amount of initial capital investment. CEB does not have to increase its assets on the balance sheet either. (The investment can be “Off-Balanced”.) However, CEB will have to make regular payments according to the PPA. In general, the business risks that the private sector can take are different from those that the governmental capital can bear. Since CEB will be required to purchase power at a price that includes IPP’s business risk, it may cost much depending on the contract conditions, particularly if the competition during the bidding process does not work effectively. When larger thermal plants are developed as IPPs, CEB and the IPP operator will sign the PPA based on availability. If renewable energy generation grows at a high rate as examined in Scenario B, these IPP’s generation will be restricted by dispatch orders, and the merits of base-load IPP will not be achieved. Despite a high capacity charge (according to the PPA), CEB may receive less energy generated. Regarding renewable energy power generation, most of the projects will be developed by IPPs. Power from renewable energy will be purchased based on Standard Power Purchase Agreement (SPPA) set by PUCSL depending on renewable energy sources. The long-term feed-in tariff and its price are advantageous for IPP.
11.3.3 Joint Venture (JV)
Sri Lanka’s Electricity Act 2009 stipulates in Article 9 that either CEB or a local authority, or a company incorporated under the Companies Act, is eligible to apply for the issue of a generation license over and above the generation capacity of 25MW and that the number of governmental shares for such a company shall be determined by the Secretary to the Treasury with the concurrence of the Ministry (of Power). (For reference, IPP is a case in which the government holds a zero percent share.) The JV is a special purpose company (SPC) that CEB sets up with private companies to generate electricity. According to CEB, the governmental share will be at least 50% because CEB may naturally wish to control management of the JV.
LakdhanaviASIA
Power
Colombo
PowerACE Matara ACE Horana
ACE
Embilipitiy
Haladhana
vi
Northern
PowerAES West Coast Aggreko
Commercial Operation
DateNov. 1997 Jun 1998 Jul 2000 Mar 2002 Dec 2002 Apr 2016 Dec 2004 Dec 2007 Oct 2003 May 2010 Jan 2010
End Date Nov. 2012 Jun 2018 Jul 2015 Mar 2012 Dec 2012 Apf 2017 Dec 2014 Dec 2019 Oct 2023 May 2035 Dec 2012
Contract Period (years) 15 20 15 12 10 1 10 10 20 25 2
LocationSapugaska
nda
Sapugaska
nda
Colombo
PortMatara Horana
Embilipitiy
aPuttalam
Chunnaka
mKelanitissa
Kerawalapi
tiya
Chunnaka
m
Free Start/Stops per YearNo charges
on Start & 240 Starts
80
Start/Stops160 Stops 160 Stops 200 Stops 50 Stops
No
start/Stop No No n.a.
Guaranteed/Installed
Capacity (MW)22.5 51 60 20 20 100 100 6.5 163.5 270 15
MGEA (per year) (GWh) 156 330 420 167 167 698 698 n.a. n.a. n.a. n.a.
Efficiency 37.30%
FuelHvy
Furnace Oil
Hvy
Furnace Oil
Hvy
Furnace Oil
Hvy
Furnace Oil
Hvy
Furnace Oil
Hvy
Furnace Oil
Hvy
Furnace Oil
Hvy
Furnace Oil
Auto
Diesel
Hvy
Furnace Oil
Auto
Diesel
Availability Factor (%)
(Note 1)79% 74% 80% 95% 95% 80% 80% n.z. n.a. n.a. n.a.

Project on Electricity Sector Master Plan Study in Democratic Socialist Republic of Sri Lanka
Final Report
11-6
The first and the only JV is Trincomalee Power Company (TPC). This company is a special purpose company (SPC) established by CEB and Indian NTPC with equal equity portions in the contract and it operates a thermal power plant in Sampur, Trincomalee Bay. The original plan was to construct two 250MW coal-fired power plants, starting operation in 2021 and 2022 respectively. Out of the total cost of TPC, the equity will be 30%, and the remaining 70% is financed by loans. The Sri Lankan and Indian governments had agreed that CEB’s equity (15% of total cost) was to be financed by the Indian government. As a result of Sri Lanka’s Supreme Court judgment, the Sampur coal-fired power plant project was canceled in September 2016. Therefore, the treatment of TPC seems ambiguous. CEB expects to introduce a similar pattern in future JV projects. Namely, CEB’s capital investment in SPC will be financed by a loan from a (bilateral) donor agency. Furthermore, private enterprises who join the EPC contract should bring their own financial aid schemes. (For example, if a Japanese trading company manufacturer joins the EPC, they are expected to organize the buyer’s credit of JBIC etc.) Through this scheme, even if a JV cannot benefit from a pure type of ODA, it will be able to use a soft loan from export credit agencies in each donor country. The JV is invested in by a Sri Lankan governmental organization (CEB) and foreign company, but the organization is a special purpose company (SPC) for power generation. The SPC will set the selling price so it is profitable. In this regard, JV and IPP are quite similar. A PA will be signed between the JV and CEB and it will have two portions, i.e., fixed/capacity charge and energy/variable charge. Since the SPC is to be operated based on non/limited-recourse project finance, it will have no impact on CEB’s balance sheet. The main financial burden for CEB is investment in the SPC. In power wholesale, CEB exists on both sides, seller and purchaser. CEB thinks the past IPP price too high, but the purchase price from the JV will be influenced by fuel prices and availability of the plant. Since there is no precedent case for JV and the project team could not obtain detailed information on TPC, the progress of TPC and the PPA with CEB is yet to be seen. However, it is considered that TPC will reimburse the loans with power sales revenue. CEB will also need to repay the loan from the Indian government for CEB equity, and its source will be the dividend from SPC. In any case, the JV is a kind of IPP, and thus the merits and demerits of IPP will apply to JV while the extent of impact may vary.
11.3.4 Public Private Partnership (PPP)
PPP is a scheme to target the efficient and effective management of public works/enterprises via partnership between public and private sectors. It utilizes the funds and know-how of the private sector to fulfill public services. (Private Finance Initiative (PFI), which is mainly led by the private sector in the design, construction and operation of public infrastructure, is a typical PPP form. Other options include DBO (Design-build-operate) and comprehensive assignment to private sector.) The Finance Commission of Sri Lanka (which supervises the finances of the national and local governments) classifies PPP in its “Public Private Partnership Approach: Theory and Practice”. IPP, including BOT and BOO, is regarded as a PPP because the private sector develops the generation which the government and CEB need. The JV mentioned above is a type of PPP because CEB (public) and the private sector co-invest in the JV company. Another possible PPP case would be infrastructure for an LNG project. In the case of building an LNG power plant in Sri Lanka, the private sector will be responsible for constructing and operating the power plant, but basic infrastructure like an LNG terminal (jetty, tank, gasification, pipeline etc.) could be developed by PPP. Since the LNG infrastructure will be used not only by one power plant but also other plants that will be fueled by the LNG facility, the related IPPs, CEB, and Ceylon Petroleum Corporation (CPC), which is responsible for LNG imports and thus should play a core role in the project, would join the PPP. Some LNG-based natural gas-fired power plants already exist and more are planned near Colombo. While they will burn heavy oil and other petroleum-based fuel for the time being, they will switch the fuel to LNG (natural gas) when the LNG infrastructure facilities become available in the near future. These power plants will be owned by IPP or JV, or even possibly by CEB, but LNG infrastructure such as the jetty at Colombo port, LNG gasification facilities, and natural gas pipelines to each power plant,

Project on Electricity Sector Master Plan Study in Democratic Socialist Republic of Sri Lanka
Final Report
11-7
will be operated by PPP, the equity for which will be capitalized by CEB, IPPs, CPC and other related organizations. The major merit for IPP operators is that IPPs will not be required to possess LNG receiving facilities themselves. (It is not reasonable to request existing generators to bear a part of the costs of infrastructure for fuel conversion.) ODA agencies have come to consider supporting PPP-based infrastructure projects. For example, JICA develops such programs as Viability Gap Funding, Contingent Credit Enhancement Facility for PPP Infrastructure Development (CCEF-PPP), and Equity Back Finance (EBF). In particular, with EBF framework, JICA loan will cover the capital investment by developing country’s government or governmentally-owned corporation that co-invest in a SPC for PPP infrastructure business with a Japanese company if the Japanese company takes part in operation of the SPC. For the loan to be provided in Sri Lanka, for example, the infrastructure business needs to be invested both by a Japanese company and by Sri Lanka Government or governmental organization, and the back finance by commercial banks cannot be organized because of Sri Lanka’s country risk etc. The loan condition of EBF is the same as the general JICA loan in terms of interest rate and repayment and grace periods.
11.4 Possible Fund Sources for CEB Ownership
When CEB needs to invest in generating and transmission & distribution facilities, it will depend on assistance from GOSL. GOSL will also rely on donor agencies. Depending on the business patterns described in 11.3, the available funding options may differ. Major fund sources are explained below. These types of ODA assistance can be applied to CEB/GOSL investments in transmission & distribution projects as well as power plant projects.
11.4.1 Use of Loans by ODA Agencies
ODA Agencies include multi-national/international development banks like the World Bank and ADB and each DAC country’s agencies, like Japan’s JICA. The majority of loans to Sri Lanka were provided through bilateral ODA. In particular, the country’s power sector has relied greatly on Japanese ODA. It is thought that Japanese loans will continue to be utilized. As an example of bilateral ODA assistance, if GOSL relies on a Japanese ODA loan for future generation fund sources, the following conditions will apply according to “Major Terms and Conditions of the Japanese ODA Loans” (JICA) as of March 2017. + Loan Amount: 85% of the total project cost. Remaining 15% will be CEB equity. + Currency: Japanese Yen (JPY) + Interest Rate: 1.40% (Fixed Rate) for Middle-Income Country, Standard + Repayment Period: 25 years (Grace Period: 7 years) + Repayment Method: Equal Principal Payment (every 6 months) + Options for Variable Interest Rates: JPY LIBOR+15bp (30 year repayment with 10 year grace
period) etc. + Procurement: Untied. JPY Loans to the Sri Lankan power sector in the recent past include the following projects: + National Transmission and Distribution Network Development and Efficiency Improvement
Project: Approved amount of 24,930million yen, date of E/N on 19 June 2015; + Greater Colombo Transmission and Distribution Loss Reduction Project: 15,941 million yen, 14
March 2013; and,

Project on Electricity Sector Master Plan Study in Democratic Socialist Republic of Sri Lanka
Final Report
11-8
+ Habarana Veyangoda Transmission Line Project: 9,573 million yen, 28 March 2012. For the above three projects, “Preferential Terms (fixed rate)” in the Japanese ODA Loans Terms & Conditions Table were applied: Repayment period of 40 years, Grace period of 10 years, interest rate of 0.3%. Even if the Preferential Terms may not apply to the future power projects, the above loan conditions are still very advantageous compared with commercial banks’ interest, which is around 12%. While the JICA loan is received by GOSL and transferred to CEB. During this process, additional interest may be imposed; however, since CEB’s financial conditions are weak, GOSL has not imposed such additional interest for the moment. In applying for ODA Loans, the following issues should be considered: + It is GOSL’s policy to minimize external debt. GOSL will need to consider the limit of the country’s
loan amounts. Furthermore, a direct loan to CEB will require GOSL’s guarantee. + As PUCSL intends to utilize donor funds in the transmission and distribution field while expecting
IPPs in the generation field, priority for future ODA loans will be given to transmission and distribution.
+ Some donor countries may be reluctant to provide loans for coal-fired power plants. (On the other hand, ECA’s buyer’s credit states that a sub-critical coal-fired plant up to 300MW is eligible according to OECA Arrangement.)
+ Bilateral ODA Loans need the agreement of both donor and recipient countries. First, GOSL engages the donor country, then an Exchange Note will be signed, then the loan agreement will be signed by GOSL’s Ministry of Finance and the Donor’s ODA agency. If no feasibility study (FS) was done for the project, it could take as many as two years for the period of FS study and the period from the recipient country’s request through signing of loan agreement. It is necessary to have enough time before construction starts.
11.4.2 Utilization of Export Credit Agency’s Financial Assistance
As mentioned above, an ODA loan needs rather complicated process and much time. If CEB cannot wait for an OEA loan, or if by some reason an ODA loan cannot be provided, CEB may consider utilizing ECA export loans. If CEB decides to import power equipment from one of the donor countries, it may be possible to receive an export loan from the donor country’s ECA. (For example, if a Japanese manufacturer is selected as a machinery and equipment provider, Japan’s JBIC will provide export credit with commercial banks on condition that Nippon Export and Investment Insurance (NEXI)’s Buyer’s Credit Insurance is carried.) Conditions for export credit (e.g. Interest and eligibility) are the same as far as the donor country is a member of the OECD because for these countries, ECA support is based on the Arrangement on Officially Supported Export Credits. It is noted that the Chinese Exim’s conditions may differ because China is not an OECD member. Taking the example of Japanese ECA, which is the Japan Bank of International Cooperation (JBIC), JBIC’s conditions on Buyer’s Credit are shown below. JBIC does not provide loans alone but co-finances with commercial banks. In receiving the buyer’s credit, the importer (CEB) must also bear the cost of buyer’s credit insurance for Japan’s NEXI on the portion of commercial banks’ loans. Outlines of JBIC’s Buyer’s Credit and NEXI’s Buyer’s Credit Insurance are shown below: (1) JBIC’s Buyer’s Credit + Loan Amount: To be determined based on the OECD Arrangement for Officially Supported Export
Credits. Should not exceed the value of an export contract. + Loan Structure: Co-finance with commercial banks (JBIC/Commercial Bank = 60/40)
Project on Electricity Sector Master Plan Study in Democratic Socialist Republic of Sri Lanka
Final Report
11-9
+ Currency: USD + Interest Rate: 5.70 % (USD CIRR 3.11% + Risk Premium 2.59%, as of June 2017) (Risk Premium
is calculated by JBIC Risk premium calculation sheet based on the category of the recipient country, and buyers etc.)
+ Repayment Period: 12 years (10 years for sub-critical coal-fired plant) + Repayment Method: Equal Principal Payment (every 6 months). + Other: Commercial Bank loan to be covered by NEXI Buyer’s Credit Insurance. JBIC will require
GOSL’s governmental guarantee as a pre-condition upon providing buyer’s credit. (2) NEXI’s Buyer’s Credit Insurance (for Commercial Bank Loan) + Insurance Amount: Political risk = 97.5% of commercial bank loan amount; Commercial Risk =
95% of commercial bank loan amount. + Insurance Premium: Commercial bank loan amount x 13.107% (Insurance premium rate is
calculated by NEXI premium rate calculation URL. As of June 2017) + Payment Method: Lump-sum payment at first drawdown. In general, once the exporter (manufacturer) is determined, GOSL’s governmental guarantee is issued and the co-finance scheme is set up, and the Buyer’s Credit is provided in a shorter time than ODA loans.

Project on Electricity Sector Master Plan Study in Democratic Socialist Republic of Sri Lanka
Final Report
11-10
11.5 Comparison of Finance for Generation Facility
11.5.1 Comparative Case Study
It is assumed that IPP, private operators, will own most of the thermal power generation facilities and sell the generated power to CEB. However, relying wholly on IPP may lead to the concern of power shortage because there is no guarantee that the generation facility is constructed when CEB needs. Therefore, JICA Survey Team considered a possibility that CEB will own and operate coal-fired TPP, and developed a comparison study of CEB’s cost bearing for the following cases.
Table 11-3 Comparative Case Study for Financing Case Conditions Case 1 CEB will own and construct the plant.
CEB will borrow the full amount of construction cost from commercial banks. (Reference) CEB will use such a high concessionality level as ODA loan for 85% of the construction cost. Case 2 A SPC will be established as JV entity, in which CEB will invest 50% of the capital. The SPC
will own and operate the plant. CEB will pay the capacity charge to the SPC for 20 years after the commencement of operation. 15% of the construction cost will be invested by CEB. The capital for the investment will be fully loaned. The amount of the capacity charge will be set at a level to assure that the SPC’s IRR will be 11.5%.35 As a BOT contract, the facility will be transferred to CEB after 20 years of operation.
(Reference) The portion of CEB’s investment in the above case will be loaned by Equity Back Finance. Case 3 IPP will own and operate the plant.
CEB will pay the capacity charge to the IPP for 20 years after the commencement of operation. The amount of the capacity charge will be set at a level to assure that the IPP’s IRR will be 11.5%. As a BOT contract, the facility will be transferred to CEB after 20 years of operation.
11.5.2 Conditions of Examination
The comparative study assumes that the following coal-fired TPP (300MW unit) will be constructed.
Table 11-4 Conditions of Examination Construction Cost 536.4 million USD Construction cost per kW: 1,788 USD/kW Construction Period
4 years Cost Allocation: 20% for the first year, 30% for the second year, 30% for the third year, and 20% for the fourth year.
Operating Years 30 years
35 Average value of Average Weighted Prime Lending Rate from January to March 2017 (Central Bank of Sri Lanka)
(Source: JICA Survey Team)
(Source: JICA Survey Team)

Project on Electricity Sector Master Plan Study in Democratic Socialist Republic of Sri Lanka
Final Report
11-11
11.5.3 Result of Comparative Study
(1) Case 1: CEB will own and construct the plant. CEB will construct the power plant by borrowing all the construction cost from commercial banks and so on. Since no revenue is expected for 4 years of construction period, the interest and capital repayment during this period will be covered by the added borrowings of the same interest rate. After the fifth year when the plant starts operation, CEB can expect revenue from operating sales. The revenue is assumed to be the same as the payment to IPP (in later case) without return portion, which is 104 MUSD/year. Therefore, if the revenue exceeds the expenses after fifth years, no additional borrowing is needed, but if the expense exceeds the revenue, the difference needs to be covered by the additional loan at the same interest The following figures show the total annual borrowings and expenses (interest and capital repayment) with interest rates of 16%, 14%, 12% and 10%.
Figure 11-1 Annual Borrowings and Expenses (interest and capital repayment) (Case 1)
If the interest rate for the borrowing is 16%, the burden for interest is large and the net borrowing will continue to increase, which will lead to a complete failure of the business. If the interest rate is 14%, the borrowings will not increase but not decrease, which will result in the failure of business. At 12%, the borrowings will be fully repaid after 17 years of operation, and at 10%, after 13 years of operation. The following figures show the situation of cash flow for each case. The plus side indicates the revenue (cash-in) and the minus side indicates the expense (cash-out).
Total borrowing Outgoings (Repayment + Interest)
(Source: JICA Survey Team)

Project on Electricity Sector Master Plan Study in Democratic Socialist Republic of Sri Lanka
Final Report
11-12
Figure 11-2 Comparison of Cash Flow (Case 1)
For reference, the following figure show the cash flow when 85% of the construction cost is covered by ODA loan etc. with high concessionality level (interest rate 2%, repayment period of 25 years, and grace period of 7 years). The remaining 15% will be financed by commercial loan at 16% interest rate.
Figure 11-3 Cash Flow (Case 1: ODA loan case)
(Source: JICA Survey Team)
(Source: JICA Survey Team)

Project on Electricity Sector Master Plan Study in Democratic Socialist Republic of Sri Lanka
Final Report
11-13
Since the interest rate is low and 7 years are given for grace period, it will be rather easy for CEB to repay the loan even if the remaining 15% of the construction cost is financed by commercial banks at an interest rate of 16%. (2) Case 2: CEB will establish a SPC with other business entity, and the SPC will own and
construct the plant.
CEB will establish an SPC with other business entity, and the SPC will own and construct a power plant. When establishing the SPC, CEB will borrow from commercial banks etc. for the full portion of its capital investment, i.e. 15% of the total construction cost, which is 50% of total equity of 30%. Since no revenue is expected for 4 years of construction period, the interest and capital repayment during this period will be covered by the added borrowings of the same interest rate. After the fifth year when the plant starts operation, CEB will pay to the SPC for power purchase, which amounts to 133.7 MUSD per year. (The SPC is treated similar to an IPP in the latter case.) The return on investment will be set at 5.4% of the construction cost. (If 30% of the equity is invested, ROE will be 18%.) The proportional portion of the return on investment will be CEB’s income. After 20 years of operation, the power plant facility will be transferred to and owned by CEB. The following figures show the total annual borrowings and expenses (interest and capital repayment) with interest rates of 16%, 14%, 12%, 10% and 8%.
Figure 11-4 Annual Borrowings and Expenses (Interest and Capital Repayment) (Case 2)
If the interest rate is 14%, CEB will not be able to repay the borrowed money even after the operation period is over. At 12%, the borrowings will be repaid after 30 years of operation. At 10%, it will take 19 years, and at 8%, it will take 14 years. Cash flow comparison for each case is shown below:
Total borrowing Outgoings (Repayment + Interest)
(Source: JICA Survey Team)
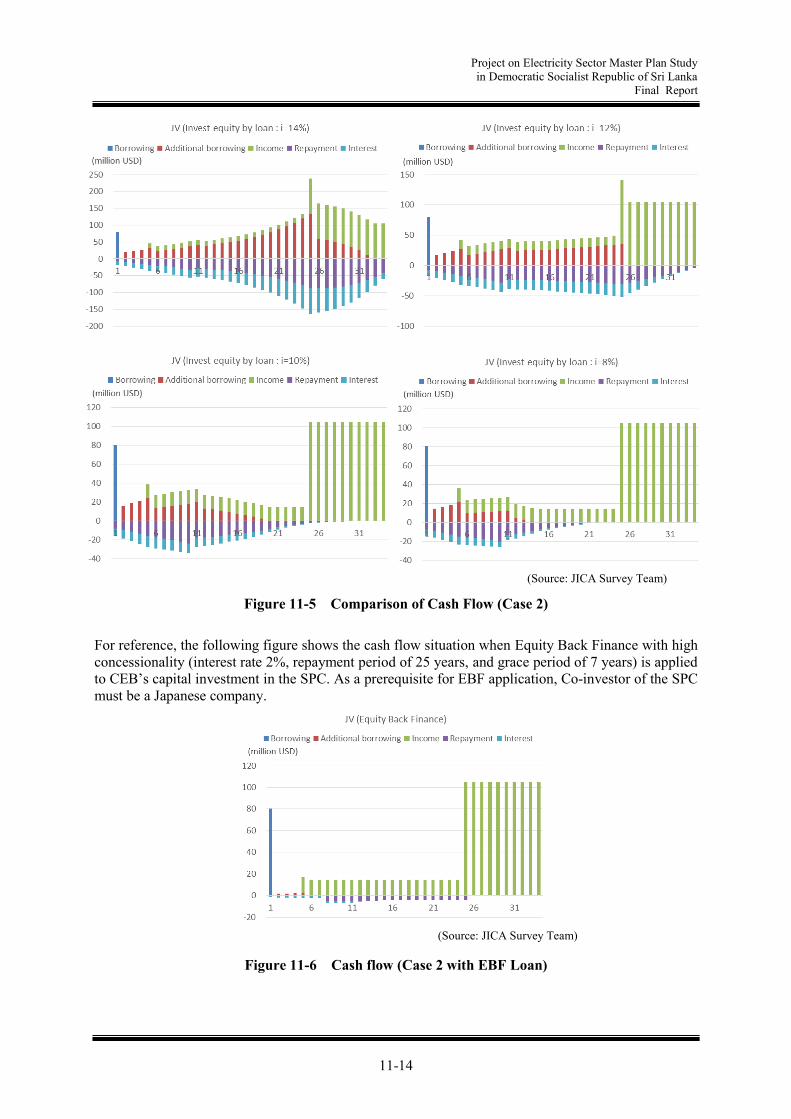
Project on Electricity Sector Master Plan Study in Democratic Socialist Republic of Sri Lanka
Final Report
11-14
Figure 11-5 Comparison of Cash Flow (Case 2)
For reference, the following figure shows the cash flow situation when Equity Back Finance with high concessionality (interest rate 2%, repayment period of 25 years, and grace period of 7 years) is applied to CEB’s capital investment in the SPC. As a prerequisite for EBF application, Co-investor of the SPC must be a Japanese company.
Figure 11-6 Cash flow (Case 2 with EBF Loan)
(Source: JICA Survey Team)
(Source: JICA Survey Team)
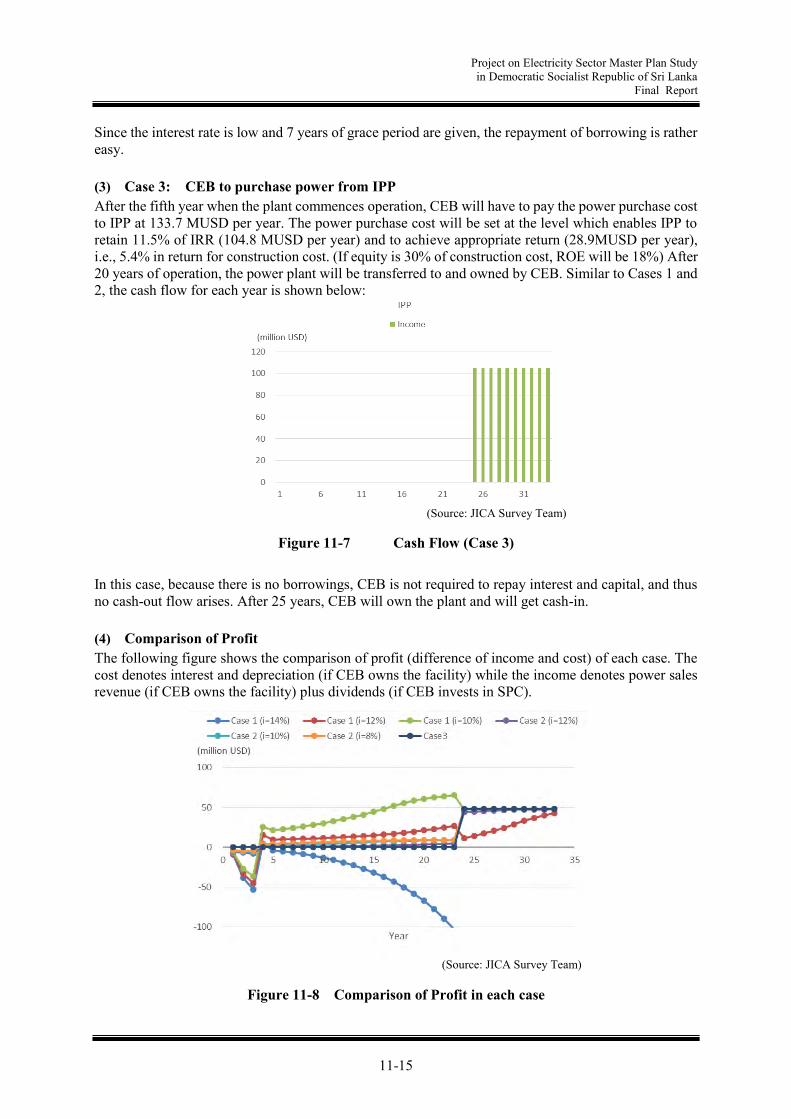
Project on Electricity Sector Master Plan Study in Democratic Socialist Republic of Sri Lanka
Final Report
11-15
Since the interest rate is low and 7 years of grace period are given, the repayment of borrowing is rather easy. (3) Case 3: CEB to purchase power from IPP After the fifth year when the plant commences operation, CEB will have to pay the power purchase cost to IPP at 133.7 MUSD per year. The power purchase cost will be set at the level which enables IPP to retain 11.5% of IRR (104.8 MUSD per year) and to achieve appropriate return (28.9MUSD per year), i.e., 5.4% in return for construction cost. (If equity is 30% of construction cost, ROE will be 18%) After 20 years of operation, the power plant will be transferred to and owned by CEB. Similar to Cases 1 and 2, the cash flow for each year is shown below:
Figure 11-7 Cash Flow (Case 3)
In this case, because there is no borrowings, CEB is not required to repay interest and capital, and thus no cash-out flow arises. After 25 years, CEB will own the plant and will get cash-in. (4) Comparison of Profit The following figure shows the comparison of profit (difference of income and cost) of each case. The cost denotes interest and depreciation (if CEB owns the facility) while the income denotes power sales revenue (if CEB owns the facility) plus dividends (if CEB invests in SPC).
Figure 11-8 Comparison of Profit in each case
(Source: JICA Survey Team)
(Source: JICA Survey Team)
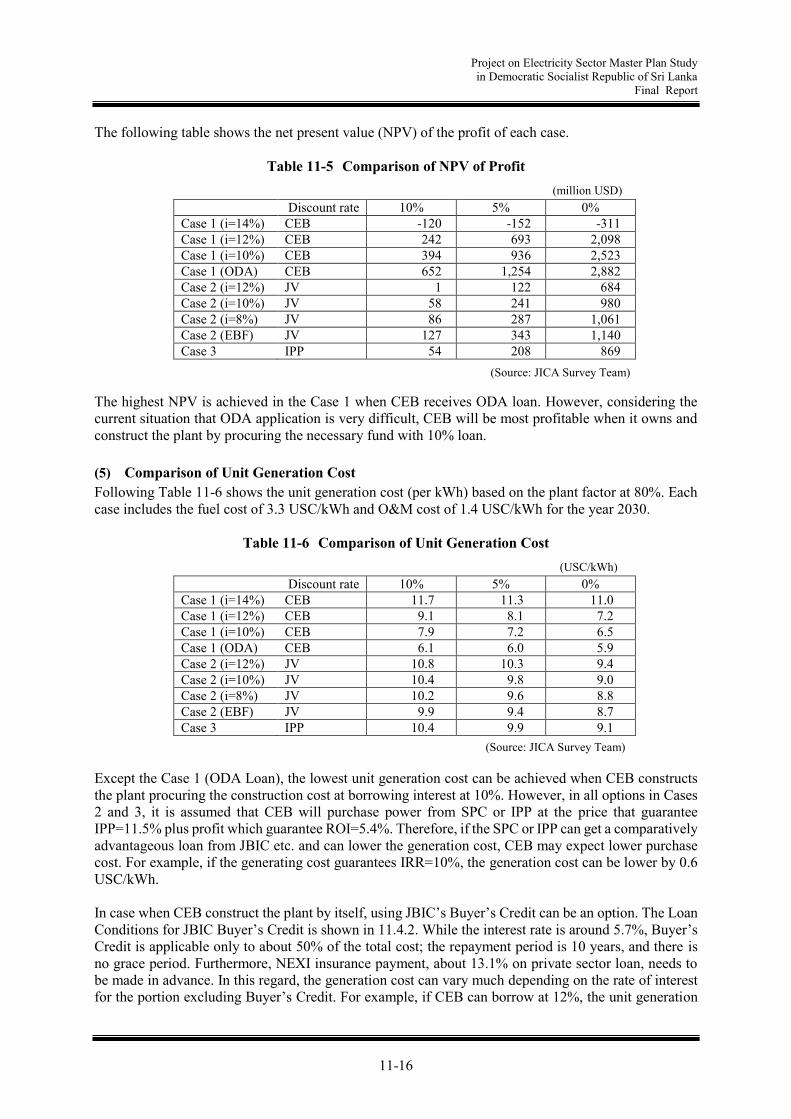
Project on Electricity Sector Master Plan Study in Democratic Socialist Republic of Sri Lanka
Final Report
11-16
The following table shows the net present value (NPV) of the profit of each case.
Table 11-5 Comparison of NPV of Profit
Discount rate 10% 5% 0% Case 1 (i=14%) CEB -120 -152 -311 Case 1 (i=12%) CEB 242 693 2,098 Case 1 (i=10%) CEB 394 936 2,523 Case 1 (ODA) CEB 652 1,254 2,882 Case 2 (i=12%) JV 1 122 684 Case 2 (i=10%) JV 58 241 980 Case 2 (i=8%) JV 86 287 1,061 Case 2 (EBF) JV 127 343 1,140 Case 3 IPP 54 208 869
The highest NPV is achieved in the Case 1 when CEB receives ODA loan. However, considering the current situation that ODA application is very difficult, CEB will be most profitable when it owns and construct the plant by procuring the necessary fund with 10% loan. (5) Comparison of Unit Generation Cost Following Table 11-6 shows the unit generation cost (per kWh) based on the plant factor at 80%. Each case includes the fuel cost of 3.3 USC/kWh and O&M cost of 1.4 USC/kWh for the year 2030.
Table 11-6 Comparison of Unit Generation Cost
Discount rate 10% 5% 0% Case 1 (i=14%) CEB 11.7 11.3 11.0 Case 1 (i=12%) CEB 9.1 8.1 7.2 Case 1 (i=10%) CEB 7.9 7.2 6.5 Case 1 (ODA) CEB 6.1 6.0 5.9 Case 2 (i=12%) JV 10.8 10.3 9.4 Case 2 (i=10%) JV 10.4 9.8 9.0 Case 2 (i=8%) JV 10.2 9.6 8.8 Case 2 (EBF) JV 9.9 9.4 8.7 Case 3 IPP 10.4 9.9 9.1
Except the Case 1 (ODA Loan), the lowest unit generation cost can be achieved when CEB constructs the plant procuring the construction cost at borrowing interest at 10%. However, in all options in Cases 2 and 3, it is assumed that CEB will purchase power from SPC or IPP at the price that guarantee IPP=11.5% plus profit which guarantee ROI=5.4%. Therefore, if the SPC or IPP can get a comparatively advantageous loan from JBIC etc. and can lower the generation cost, CEB may expect lower purchase cost. For example, if the generating cost guarantees IRR=10%, the generation cost can be lower by 0.6 USC/kWh. In case when CEB construct the plant by itself, using JBIC’s Buyer’s Credit can be an option. The Loan Conditions for JBIC Buyer’s Credit is shown in 11.4.2. While the interest rate is around 5.7%, Buyer’s Credit is applicable only to about 50% of the total cost; the repayment period is 10 years, and there is no grace period. Furthermore, NEXI insurance payment, about 13.1% on private sector loan, needs to be made in advance. In this regard, the generation cost can vary much depending on the rate of interest for the portion excluding Buyer’s Credit. For example, if CEB can borrow at 12%, the unit generation
(million USD)
(USC/kWh)
(Source: JICA Survey Team)
(Source: JICA Survey Team)

Project on Electricity Sector Master Plan Study in Democratic Socialist Republic of Sri Lanka
Final Report
11-17
cost will be 8.6 USC/kWh, which is about 0.5USC/kWh lower than the case without using Buyer’s Credit.
(Reference) Examination in case of LNG Power Plant The JICA Survey Team made a comparison study also for LNG-fired TPP. The construction cost of LNG-fired TPP is 332.6 MUSD, and the construction period is 3 years. The following Table 11-7 shows the unit generation cost (USC per kWh) when the plant is operated at plant factor at 80%. Each case includes the fuel cost of 8.4 USC/kWh and O&M cost of 0.6 USC/kWh for the year 2030.
Table 11-7 Comparison of Unit Generation Cost (LNG-fired TPP)
Discount rate 10% 5% 0% Case 1 (i=14%) CEB 15.0 16.0 17.6 Case 1 (i=12%) CEB 12.3 12.0 11.6 Case 1 (i=10%) CEB 11.2 10.8 10.4 Case 1 (ODA) CEB 9.7 9.7 9.6 Case 2 (i=12%) JV 12.4 12.1 11.6 Case 2 (i=10%) JV 12.2 11.9 11.4 Case 2 (i=8%) JV 12.1 11.8 11.4 Case 2 (EBF) JV 12.0 11.7 11.3 Case 3 IPP 12.3 12.1 11.6
The same tendency is observed: Except for the Case 1 (ODA Loan), the lowest unit generating cost can be achieved when CEB construct the plant by itself procuring the necessary funds at interest rate at 10%.
(Source: JICA Survey Team)
(USC/kWh)

Project on Electricity Sector Master Plan Study in Democratic Socialist Republic of Sri Lanka
Final Report
11-18
11.6 Long-term Investment Plan
This section examines the factors of capital investment: transmission, distribution, and generation. The results will be integrated to each Scenario and explained in 11.6.4. Generation projects except hydro and back-up gas-turbine will be constructed and operated by IPP. Therefore CEB will not bear the capital investment for these generation facilities.
11.6.1 Transmission Planning (This section will be reconsidered later)
It is necessary to examine the investment for transmission in two patterns; (1) capital investment in proportion to incremental power demand (2) capital investment required for the specific projects examined. According to PUCSL, capital investment in transmission facility will rely on ODA loan. While each loan agreement will be signed between GOSL and donors such as ADB and JICA, we here examine the amount necessary to disburse each year. (1) Capital Investment in proportion to incremental power demand Capital investment for transmission system at or lower than 132kV is assumed to increase in proportion to the power demand increase. Based on the capital investment of transmission system listed in LTTDP 2015-2024, excluding the investment amount for 220kV or higher voltage and considering the power demand increase, the capital investment per incremental power demand is calculated at 0.29 MUSD/MW. By multiplying this amount by annual demand increase that is led by Table 5-15 Peak Demand Estimate in Chapter 5, the annual capital investment in transmission is estimated in Table 11-8.
Table 11-8 Investment in Transmission System
Year Peak Demand (MW) Base case
Incremental Demand (MW)
Annual Investment Cost (MUSD)
2016 2,369 --- 2017 2,491 122 35 2018 2,639 148 43 2019 2,798 159 46 2020 2,955 157 46 2021 3,112 157 46 2022 3,267 155 45 2023 3,422 155 45 2024 3,577 155 45 2025 3,730 153 44 2026 3,883 153 44 2027 4,035 152 44 2028 4,187 152 44 2029 4,333 146 42 2030 4,505 172 50 2031 4,677 172 50 2032 4,849 172 50 2033 5,021 172 50 2034 5,193 172 50 2035 5,365 172 50 2036 5,536 171 50 2037 5,708 172 50 2038 5,879 171 50 2039 6,051 172 50 2040 6,222 171 50
(Source: JICA Survey Team)

Project on Electricity Sector Master Plan Study in Democratic Socialist Republic of Sri Lanka
Final Report
11-19
(2) Capital Investment Required for the Specific Projects Examined This Master Plan Study examines several transmission facilities, including substation, reactive power capacitors, and transmission lines which should be constructed in and after 2025. This Study estimates the construction cost is divided in three years (construction period) for transmission lines and substations, in five years for reactive power capacitors. The investment amount for these specific projects is shown in Table 11-9.
Table 11-9 Investment in Specific Projects Examined
(Source: JICA Survey Team)
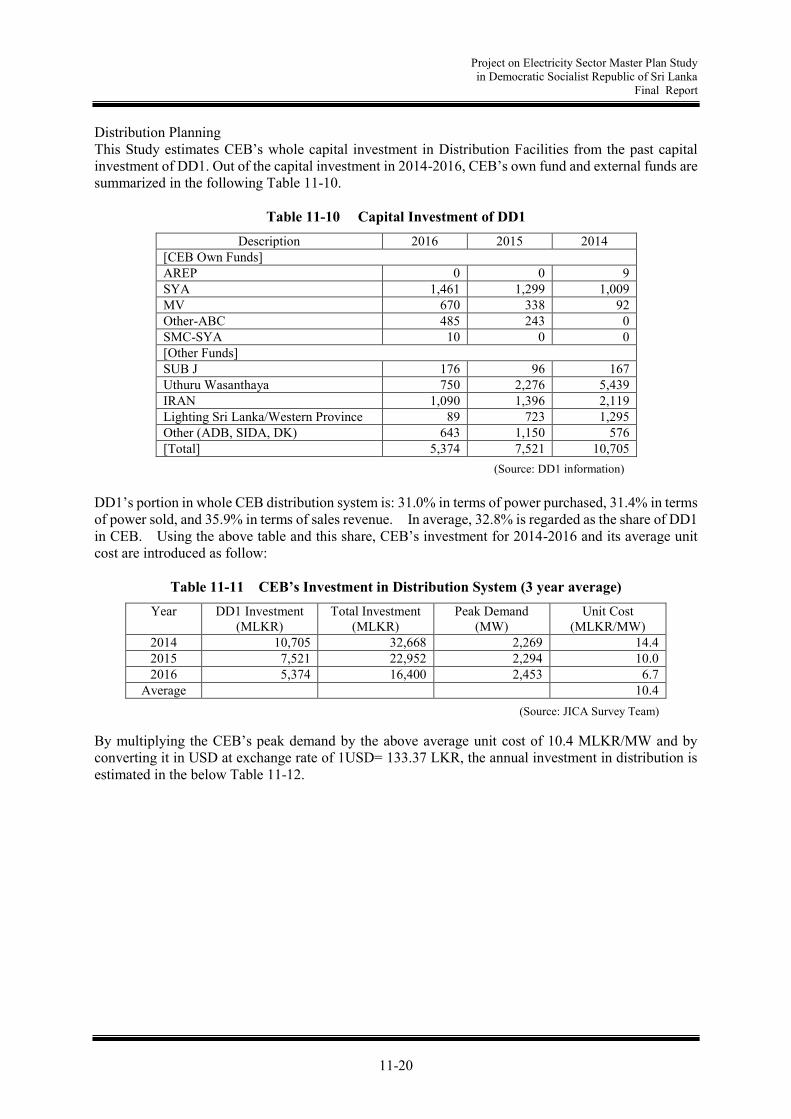
Project on Electricity Sector Master Plan Study in Democratic Socialist Republic of Sri Lanka
Final Report
11-20
Distribution Planning This Study estimates CEB’s whole capital investment in Distribution Facilities from the past capital investment of DD1. Out of the capital investment in 2014-2016, CEB’s own fund and external funds are summarized in the following Table 11-10.
Table 11-10 Capital Investment of DD1 Description 2016 2015 2014
[CEB Own Funds] AREP 0 0 9 SYA 1,461 1,299 1,009 MV 670 338 92 Other-ABC 485 243 0 SMC-SYA 10 0 0 [Other Funds] SUB J 176 96 167 Uthuru Wasanthaya 750 2,276 5,439 IRAN 1,090 1,396 2,119 Lighting Sri Lanka/Western Province 89 723 1,295 Other (ADB, SIDA, DK) 643 1,150 576 [Total] 5,374 7,521 10,705
(Source: DD1 information) DD1’s portion in whole CEB distribution system is: 31.0% in terms of power purchased, 31.4% in terms of power sold, and 35.9% in terms of sales revenue. In average, 32.8% is regarded as the share of DD1 in CEB. Using the above table and this share, CEB’s investment for 2014-2016 and its average unit cost are introduced as follow:
Table 11-11 CEB’s Investment in Distribution System (3 year average) Year DD1 Investment
(MLKR) Total Investment
(MLKR) Peak Demand
(MW) Unit Cost
(MLKR/MW) 2014 10,705 32,668 2,269 14.4 2015 7,521 22,952 2,294 10.0 2016 5,374 16,400 2,453 6.7
Average 10.4 By multiplying the CEB’s peak demand by the above average unit cost of 10.4 MLKR/MW and by converting it in USD at exchange rate of 1USD= 133.37 LKR, the annual investment in distribution is estimated in the below Table 11-12.
(Source: JICA Survey Team)

Project on Electricity Sector Master Plan Study in Democratic Socialist Republic of Sri Lanka
Final Report
11-21
Table 11-12 Investment in Distribution System
Year Peak Demand (MW)
Annual Investment (MLKR)
Annual Investment (MUSD)
2016 2,369 --- 2017 2,491 25,817 194 2018 2,639 27,351 205 2019 2,798 28,999 217 2020 2,955 30,626 230 2021 3,112 32,253 242 2022 3,267 33,859 254 2023 3,422 35,466 266 2024 3,577 37,072 278 2025 3,730 38,658 290 2026 3,883 40,244 302 2027 4,035 41,819 314 2028 4,187 43,394 325 2029 4,333 44,908 337 2030 4,505 46,690 350 2031 4,677 48,473 363 2032 4,849 50,255 377 2033 5,021 52,038 390 2034 5,193 53,821 404 2035 5,365 55,603 417 2036 5,536 57,376 430 2037 5,708 59,158 444 2038 5,879 60,930 457 2039 6,051 62,713 470 2040 6,222 64,485 484
(Source: JICA Survey Team)

Project on Electricity Sector Master Plan Study in Democratic Socialist Republic of Sri Lanka
Final Report
11-22
11.6.2 Power Plant Planning
The following Table 11-13 shows the unit construction cost (USD/kW) of coal-fired TPP, LNG-fired TPP, Back-up Gas Turbine, Pumped Storage Hydro Power Plant and Renewable energies as well as the construction cost of LNG terminal.
Table 11-13 Conditions for Capital Investment for Generation Facilities
Construction cost Share of construction cost Remarks -1 yr -2 yrs -3 yrs -4 yrs -5 yrs -6 yrs Coal-fired TPP 1,788 USD/kW 20% 30% 30% 20% Table 7-9 LNG-fired TPP 1,109 USD/kW 10% 70% 20% Table 7-9 LNG Facility 484 million USD 20% 30% 30% 20% Table 4-14 Back-Up GT 501 USD/kW 100% Table 7-9 PSPP 1,063 USD/kW 10% 20% 20% 20% 20% 10% Chapter 7.2.1 Hydro 2,000 USD/kW 10% 70% 20% Mini-hydro 2,000 USD/kW 100% Wind 1,820 USD/kW 100% Table 7-14 Solar 700 USD/kW 100% Table 7-14 Biomass 1,685 USD/kW 100% LTGEP
The capital investment for generation facilities based on the power development plan is calculated in the following Table 11-14.
Table 11-14 Capital Investment for Generation Facilities
(in MUSD)
Scenario A 2017 2018 2019 2020 2021 2022 2023 2024 2025 2026 2027 2028 2029 2030 2031 2032 2033 2034 2035 2036 2037 2038 2039 2040 Total
Coal-fired TPP 0 107 268 429 536 429 375 268 268 268 161 215 268 322 268 215 161 268 268 161 215 161 268 268 6,169
LNG-fired TPP 299 266 33 0 0 0 0 0 0 0 0 0 0 67 233 33 0 0 0 0 0 0 0 0 932
LNG Facility 98 146 146 98 0 0 0 0 0 0 0 0 0 0 0 0 0 0 0 0 0 0 0 0 488
Back-Up GT 18 0 0 0 0 0 0 0 0 0 0 0 0 0 50 0 50 0 50 0 50 0 50 0 268
PSPP 0 0 0 0 0 0 0 0 0 0 0 0 0 0 0 0 0 0 0 0 0 0 0 0 0
Hydro 37 21 31 99 14 0 0 0 0 0 0 0 0 0 0 0 0 0 0 0 0 0 0 0 203
Mini-hydro 40 40 40 40 40 40 40 40 40 40 40 40 40 20 20 20 20 20 20 20 20 20 20 20 740
Wind 91 91 55 55 55 55 55 55 55 55 55 55 55 55 55 55 91 91 91 91 91 91 91 91 1,674
Solar 14 14 14 28 28 28 28 28 35 35 35 35 35 35 70 70 70 70 70 70 70 70 70 70 1,092
Biomass 0 0 0 0 0 0 0 34 0 0 0 0 34 0 0 0 0 34 0 0 0 0 34 0 135
[TOTAL] 597 686 588 749 673 552 498 425 398 398 291 344 432 498 696 392 392 483 499 342 446 342 533 449 11,700
Scenario B 2017 2018 2019 2020 2021 2022 2023 2024 2025 2026 2027 2028 2029 2030 2031 2032 2033 2034 2035 2036 2037 2038 2039 2040
Coal-fired TPP 0 0 0 0 0 0 0 0 0 0 0 0 0 0 0 0 0 0 0 0 0 0 0 0 0
LNG-fired TPP 299 266 100 299 266 100 299 266 33 0 0 0 0 67 299 266 100 233 33 67 233 100 233 100 3,660
LNG Facility 98 146 146 98 98 146 146 98 0 0 0 0 0 0 0 98 146 146 98 0 0 0 0 0 1,464
Back-Up GT 18 0 0 0 0 0 0 0 0 0 50 0 50 0 50 0 50 0 50 0 50 0 50 0 368
PSPP 0 0 0 0 21 64 106 128 128 106 64 21 0 0 0 0 0 0 0 0 0 0 0 0 638
Hydro 37 21 31 99 14 0 0 0 0 0 0 0 0 0 0 0 0 0 0 0 0 0 0 0 203
Mini-hydro 40 40 40 40 40 40 40 40 40 40 40 40 40 20 20 20 20 20 20 20 20 20 20 20 740
Wind 91 91 127 182 182 182 182 182 364 364 364 364 364 364 364 364 364 364 364 364 364 546 546 546 7,589
Solar 35 35 35 35 35 35 42 70 70 70 70 70 70 70 70 70 70 70 70 70 70 70 70 70 1,442
Biomass 0 0 0 0 0 0 0 34 0 0 0 0 34 0 0 0 0 34 0 0 0 0 34 0 135
[TOTAL] 618 600 480 753 656 567 816 817 635 580 588 495 558 521 804 818 750 867 635 521 737 736 953 736 16,239
Scenario C 2017 2018 2019 2020 2021 2022 2023 2024 2025 2026 2027 2028 2029 2030 2031 2032 2033 2034 2035 2036 2037 2038 2039 2040
Coal-fired TPP 0 107 268 322 375 268 161 107 0 0 107 161 268 268 161 107 0 107 161 161 107 0 107 161 3,487
LNG-fired TPP 299 266 33 0 67 233 33 0 0 0 0 0 0 67 233 33 67 233 33 0 0 67 233 33 1,930
LNG Facility 98 146 146 98 0 0 0 0 0 0 0 0 0 0 0 98 146 146 98 0 0 0 0 0 976
Back-Up GT 18 0 0 0 0 0 0 0 0 0 50 0 50 0 50 0 50 0 50 0 50 0 50 0 368
PSPP 0 0 0 0 21 64 106 128 128 106 64 21 0 0 0 0 0 0 0 0 0 0 0 0 638
Hydro 37 21 31 99 14 0 0 0 0 0 0 0 0 0 0 0 0 0 0 0 0 0 0 0 203
Mini-hydro 40 40 40 40 40 40 40 40 40 40 40 40 40 20 20 20 20 20 20 20 20 20 20 20 740
Wind 55 91 91 91 91 91 91 91 91 182 182 182 182 182 182 182 182 182 182 182 182 182 182 182 3,513
Solar 35 35 35 35 35 35 35 35 70 70 70 70 70 70 70 70 70 70 70 70 70 70 70 70 1,400
Biomass 0 0 0 0 0 0 0 34 0 0 0 0 34 0 0 0 0 34 0 0 0 0 34 0 135
[TOTAL] 581 600 377 363 268 463 306 327 329 398 406 313 376 339 555 403 535 685 453 272 322 339 589 305 9,902
(Source: JICA Survey Team)
(Source: JICA Survey Team)
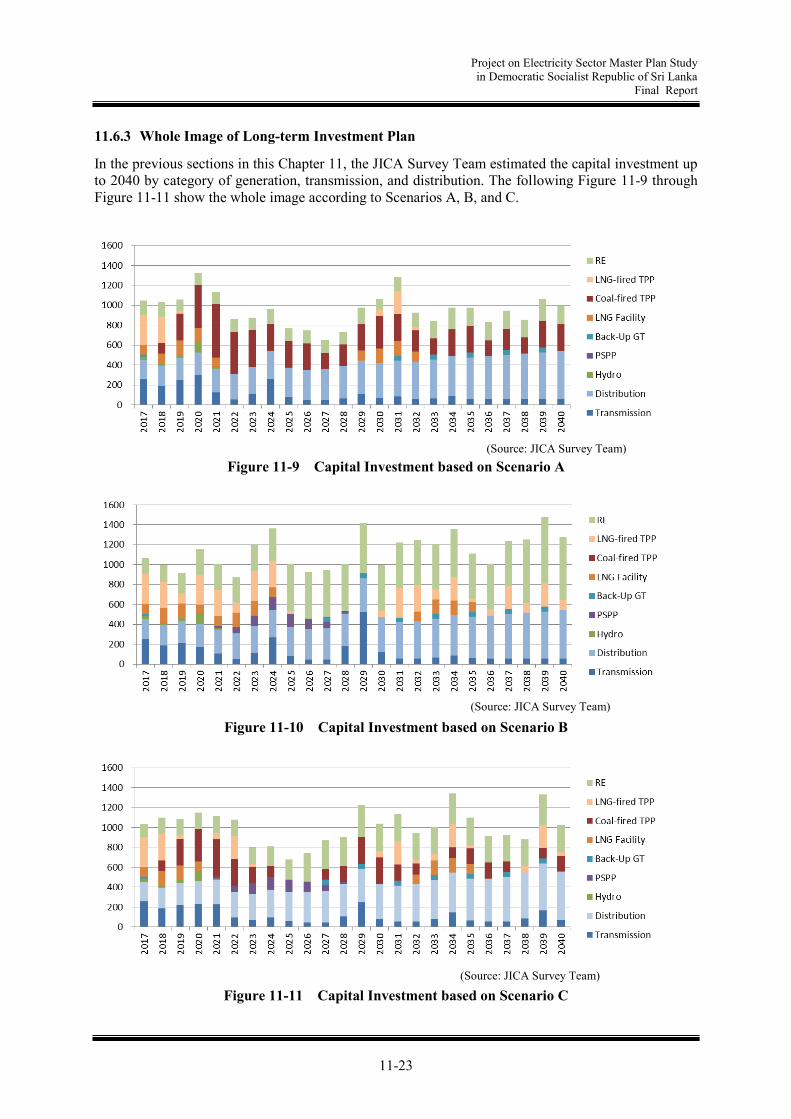
Project on Electricity Sector Master Plan Study in Democratic Socialist Republic of Sri Lanka
Final Report
11-23
11.6.3 Whole Image of Long-term Investment Plan
In the previous sections in this Chapter 11, the JICA Survey Team estimated the capital investment up to 2040 by category of generation, transmission, and distribution. The following Figure 11-9 through Figure 11-11 show the whole image according to Scenarios A, B, and C.
Figure 11-9 Capital Investment based on Scenario A
Figure 11-10 Capital Investment based on Scenario B
Figure 11-11 Capital Investment based on Scenario C
(Source: JICA Survey Team)
(Source: JICA Survey Team)
(Source: JICA Survey Team)

Project on Electricity Sector Master Plan Study in Democratic Socialist Republic of Sri Lanka
Final Report
11-24
These capital investment deployments are the investment plan that the whole Sri Lanka’s power sector should bear. Regarding the Scenario B, the total amount of investment from 2017 through 2040 is about 10% larger than other two Scenarios because the capital investment in renewable energies is larger. Since the construction of renewable energies and thermal power plants will be owned and constructed by IPP, the construction cost is not included in CEB’s capital investment. On the other hand, CEB will have to bear the cost of power purchase for long term, since CEB is required to purchase power from these generation facilities based on PPA. CEB should bear the capital investment for transmission and distribution systems, PSPP, and back-up gas turbine, and the amount is about half of the total investment. For this portion, there is little difference among Scenarios.

Project on Electricity Sector Master Plan Study in Democratic Socialist Republic of Sri Lanka
Final Report
12-1
Chapter 12. Economic and Financial Analysis
12.1 Review of Financial Position of CEB
The Study reviewed the financial conditions of CEB based on financial statements for the period from 2008 to the latest financial year. The items reviewed are as follows:
Balance sheet analysis: analyzing financial stability, including liquidity, capital to asset ratio, debt ratio, debt capacity, etc.
Income statement analysis: analyzing profitability, including balance between operating income and power supply cost, balance between tariff and unit cost of power supply (kWh), retained earnings for long-term investment
In Sri Lanka, the Sri Lanka Financial Reporting Standards (SLFRS) have been aligned with the International Financial Reporting Standard (IFRS) since 2012. The financial statements starting from January 1, 2012 needed to have applied the new SLFRS. Therefore, the financial statements of CEB from the financial year of 2012 have been prepared in accordance with the new SLFRS and the financial data before and after 2012 cannot be precisely compared. However, the computed figures for the year 2011 were restated as per the SLFRS convergence requests. CEB enjoyed exemptions of 1st time adoption, where the Assets are not at fair value; part of the Assets, such as vehicles, was recorded to the MG and other asset categories were considered deemed cost basis. The earlier indexing revaluation was stopped and the policy of the Property, Plan & Equipment was stood as cost base from the year 2012 onwards. The requirements of LKAS 19: Employee Benefits and LKAS 23: Borrowing Costs were also applied. In addition, the financial transactions and the financial assets and liabilities recognized after the beginning of 2011 have not been re-recognized. Hence, a certain tendency for the financial situation of CEB for the period from 2008 to 2015 can be indicated. Table 12-1 shows the profitability of CEB based on their income statements for the period from 2008 to 2015. The sales revenue has increased by 2014 because of the increase in the sales volume of electricity and electricity sales amount. On the other hand, the cost of sales has fluctuated by year due to the fluctuation of fuel costs. Until 2014, the sales revenue has been below the cost of sales for most years and an operating loss and loss before tax including financial cost have been recorded almost every year. In 2013, a surplus was recorded because of the dramatic reduction of fuel costs and the revised electricity tariff.
Table 12-1 Profitability of CEB (Rs. Million)
2008 2009 2010 2011 2012 2013 2014 2015* Revenue 111,287 110,518 121,862 132,460 163,513 194,147 202,645 188,684 Cost of Sales -145,712 -118,186 -116,168 -151,448 -222,419 -165,509 -213,646 -168,308 Gross Profit/Loss -34,425 -7,668 5,694 -18,988 -58,906 28,638 -11,001 20,376 Administrative Expenses -1,487 -2,870 -1,851 -1,636 -2,997 -2,556 -3,146 -4,202
Other income 3,580 3,412 3,062 3,810 4,225 5,107 5,870 8,292 Operating Profit/Loss -32,332 -7,126 6,905 -16,814 -57,678 31,189 -8,277 24,466
Financial Profit/Loss -1,537 -2,212 -2,047 -3,371 -3,769 -8,924 -6,726 -4,700
Profit before Tax -33,869 -9,338 4,858 -20,185 -61,447 22,265 -15,003 19,766 (Source: CEB, “Annual Report” (2008, 2009, 2010, 2011, 2012, 2013), Data provided by CEB)
Note: Figures for 2015 are provisional and can be confidential before officially approved.

Project on Electricity Sector Master Plan Study in Democratic Socialist Republic of Sri Lanka
Final Report
12-2
Table 12-2 shows the financial position of CEB for the period from 2008 to 2015. Non-current assets have accounted for the majority of CEB’s total assets and have been mainly composed of power supply facilities. While the power demand has been growing, non-current assets have been increasing year by year due to the expansion of capital investment in power facilities. The capital investments have been financed by loans from international donors and domestic banks as well as CEB’s own capital. However, it was difficult for CEB to accumulate retained earnings for capital investment due to the loss after tax. Therefore, capital injection from the government budget has covered for the necessary capital investments36. In addition, a debt equity swap was dealt in 2014. As a result, 161,707 million Rs. was capitalized. This means that the government has assumed CEB’s long-term debts.
Table 12-2 Balance Sheet of CEB (Rs. million)
2008 2009 2010 2011 2012 2013 2014 2015* Total Assets 465,296 516,021 605,422 661,333 727,728 746,759 764,185 775,420 Non-current assets 409,193 462,919 496,047 550,520 627,695 654,315 690,998 706,489
Current assets 56,102 53,337 109,319 110,812 101,295 91,423 72,163 67,906 Cash 774 585 1,547 1,479 2,571 2,043 1,543 675 Non-current liabilities 110,419 141,883 229,128 281,842 393,073 430,008 307,329 308,639
Current liabilities 84,700 98,930 93,663 122,026 137,356 89,651 79,153 55,046
Capital and reserves 270,176 275,208 282,631 257,464 197,300 227,098 377,703 411,736
(Source: CEB, “Annual Report” (2008, 2009, 2010, 2011, 2012, 2013), Data provided by CEB) Note: Figures for 2015 are provisional and can be confidential before officially approved.
(Source: CEB, “Annual Report” (2008, 2009, 2010, 2011, 2012, 2013), Data provided by CEB)
Figure 12-1 Debts and equity of CEB
36 The total amount of capital injection from the government budget is 1,063 million Rs. for 2016.
0
100,000
200,000
300,000
400,000
500,000
600,000
700,000
800,000
2008 2009 2010 2011 2012 2013 2014 2015
270,176 275,208 282,631 257,464197,300 227,098
377,703 411,736
110,419141,883
229,128 281,842 393,073
430,008
307,329308,639
84,70098,930
93,663122,026
137,35689,651
79,15355,046
Equity and reserves Non current liabilities Current liabilities
(Rs. million)
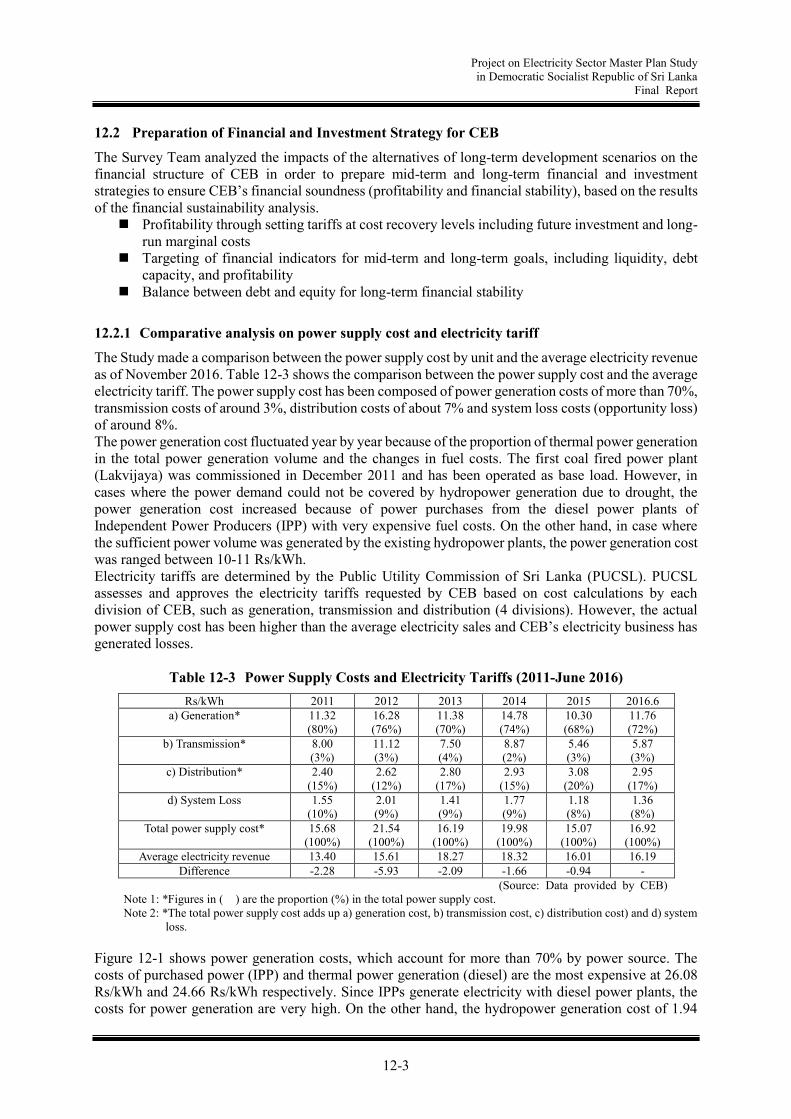
Project on Electricity Sector Master Plan Study in Democratic Socialist Republic of Sri Lanka
Final Report
12-3
12.2 Preparation of Financial and Investment Strategy for CEB
The Survey Team analyzed the impacts of the alternatives of long-term development scenarios on the financial structure of CEB in order to prepare mid-term and long-term financial and investment strategies to ensure CEB’s financial soundness (profitability and financial stability), based on the results of the financial sustainability analysis.
Profitability through setting tariffs at cost recovery levels including future investment and long-run marginal costs
Targeting of financial indicators for mid-term and long-term goals, including liquidity, debt capacity, and profitability
Balance between debt and equity for long-term financial stability
12.2.1 Comparative analysis on power supply cost and electricity tariff
The Study made a comparison between the power supply cost by unit and the average electricity revenue as of November 2016. Table 12-3 shows the comparison between the power supply cost and the average electricity tariff. The power supply cost has been composed of power generation costs of more than 70%, transmission costs of around 3%, distribution costs of about 7% and system loss costs (opportunity loss) of around 8%. The power generation cost fluctuated year by year because of the proportion of thermal power generation in the total power generation volume and the changes in fuel costs. The first coal fired power plant (Lakvijaya) was commissioned in December 2011 and has been operated as base load. However, in cases where the power demand could not be covered by hydropower generation due to drought, the power generation cost increased because of power purchases from the diesel power plants of Independent Power Producers (IPP) with very expensive fuel costs. On the other hand, in case where the sufficient power volume was generated by the existing hydropower plants, the power generation cost was ranged between 10-11 Rs/kWh. Electricity tariffs are determined by the Public Utility Commission of Sri Lanka (PUCSL). PUCSL assesses and approves the electricity tariffs requested by CEB based on cost calculations by each division of CEB, such as generation, transmission and distribution (4 divisions). However, the actual power supply cost has been higher than the average electricity sales and CEB’s electricity business has generated losses.
Table 12-3 Power Supply Costs and Electricity Tariffs (2011-June 2016) Rs/kWh 2011 2012 2013 2014 2015 2016.6
a) Generation* 11.32 (80%)
16.28 (76%)
11.38 (70%)
14.78 (74%)
10.30 (68%)
11.76 (72%)
b) Transmission* 8.00 (3%)
11.12 (3%)
7.50 (4%)
8.87 (2%)
5.46 (3%)
5.87 (3%)
c) Distribution* 2.40 (15%)
2.62 (12%)
2.80 (17%)
2.93 (15%)
3.08 (20%)
2.95 (17%)
d) System Loss 1.55 (10%)
2.01 (9%)
1.41 (9%)
1.77 (9%)
1.18 (8%)
1.36 (8%)
Total power supply cost* 15.68 (100%)
21.54 (100%)
16.19 (100%)
19.98 (100%)
15.07 (100%)
16.92 (100%)
Average electricity revenue 13.40 15.61 18.27 18.32 16.01 16.19 Difference -2.28 -5.93 -2.09 -1.66 -0.94 -
(Source: Data provided by CEB) Note 1: *Figures in ( ) are the proportion (%) in the total power supply cost. Note 2: *The total power supply cost adds up a) generation cost, b) transmission cost, c) distribution cost) and d) system
loss.
Figure 12-1 shows power generation costs, which account for more than 70% by power source. The costs of purchased power (IPP) and thermal power generation (diesel) are the most expensive at 26.08 Rs/kWh and 24.66 Rs/kWh respectively. Since IPPs generate electricity with diesel power plants, the costs for power generation are very high. On the other hand, the hydropower generation cost of 1.94

Project on Electricity Sector Master Plan Study in Democratic Socialist Republic of Sri Lanka
Final Report
12-4
Rs/kWh which does not require fuel cost is the least and the power generation cost by coal fired power plant of 6.8 Rs/kWh is the second least. While the shares in the power generation volume by power source have fluctuated year by year, the share of diesel power generation by both CEB and IPPs is more than 40% as of December 2016. This high cost power generation of diesel power plants is a major factor in reducing the profitability of CEB. Although ensuring the power generation volume by hydropower plants at the lease cost can be essential to reduce and stabilize the power generation cost, the hydropower generation volume is affected by volume of rainfalls and is subordinated in water use than other purposes of drinking water and irrigation water. In addition, since there is no feasible plan for expansion of hydropower generation, the increase in the hydropower generation cannot be expected. Therefore, the issues in power development are introduction of coal-fired power generation at cheaper cost and reduction of power generation cost by renewable energies in order to stabilize and reduce the generation cost in future.
Figure 12-2 Power Generation Cost by Power Source
0
5
10
15
20
25
30
Thermal (Diesel) Thermal (Coal) Hydro Purchased power Renewable energy
24.66
6.8
1.94
26.08
16.94
Rp./kWh
(Source: Data provided by CEB)
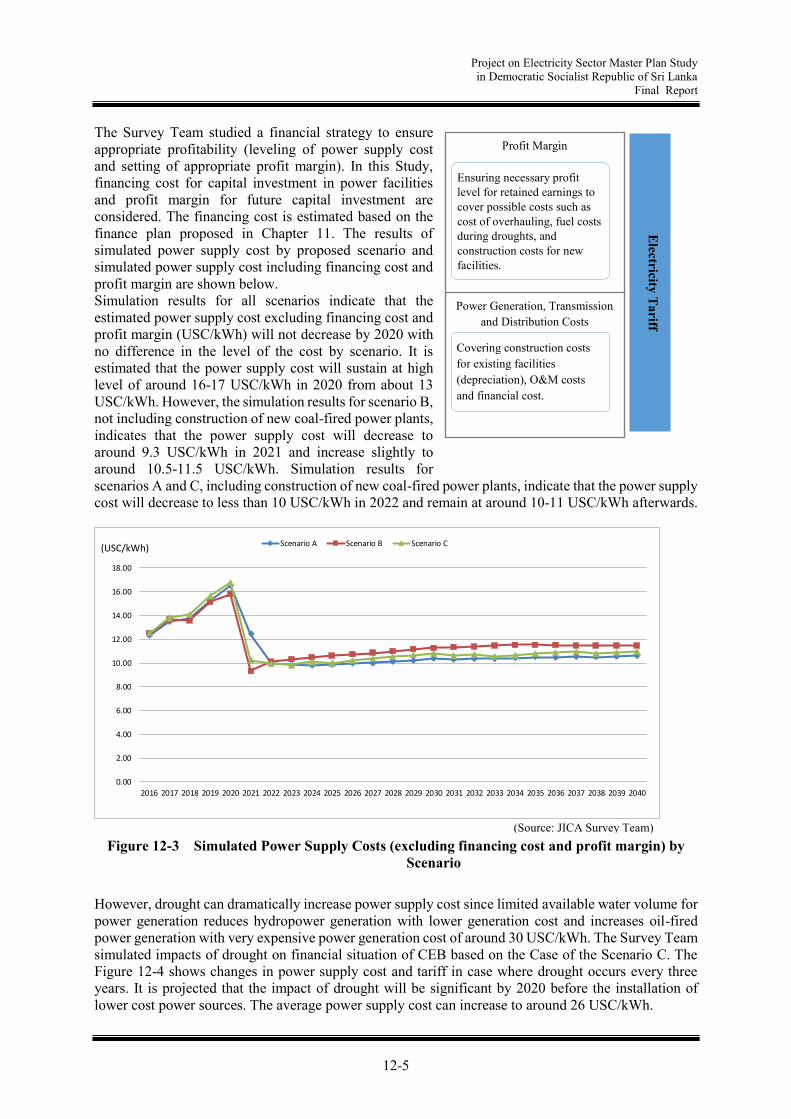
Project on Electricity Sector Master Plan Study in Democratic Socialist Republic of Sri Lanka
Final Report
12-5
The Survey Team studied a financial strategy to ensure appropriate profitability (leveling of power supply cost and setting of appropriate profit margin). In this Study, financing cost for capital investment in power facilities and profit margin for future capital investment are considered. The financing cost is estimated based on the finance plan proposed in Chapter 11. The results of simulated power supply cost by proposed scenario and simulated power supply cost including financing cost and profit margin are shown below. Simulation results for all scenarios indicate that the estimated power supply cost excluding financing cost and profit margin (USC/kWh) will not decrease by 2020 with no difference in the level of the cost by scenario. It is estimated that the power supply cost will sustain at high level of around 16-17 USC/kWh in 2020 from about 13 USC/kWh. However, the simulation results for scenario B, not including construction of new coal-fired power plants, indicates that the power supply cost will decrease to around 9.3 USC/kWh in 2021 and increase slightly to around 10.5-11.5 USC/kWh. Simulation results for scenarios A and C, including construction of new coal-fired power plants, indicate that the power supply cost will decrease to less than 10 USC/kWh in 2022 and remain at around 10-11 USC/kWh afterwards.
Figure 12-3 Simulated Power Supply Costs (excluding financing cost and profit margin) by Scenario
However, drought can dramatically increase power supply cost since limited available water volume for power generation reduces hydropower generation with lower generation cost and increases oil-fired power generation with very expensive power generation cost of around 30 USC/kWh. The Survey Team simulated impacts of drought on financial situation of CEB based on the Case of the Scenario C. The Figure 12-4 shows changes in power supply cost and tariff in case where drought occurs every three years. It is projected that the impact of drought will be significant by 2020 before the installation of lower cost power sources. The average power supply cost can increase to around 26 USC/kWh.
0.00
2.00
4.00
6.00
8.00
10.00
12.00
14.00
16.00
18.00
2016 2017 2018 2019 2020 2021 2022 2023 2024 2025 2026 2027 2028 2029 2030 2031 2032 2033 2034 2035 2036 2037 2038 2039 2040
Scenario A Scenario B Scenario C
Power Generation, Transmission and Distribution Costs
Profit Margin E
lectricity Tariff
Ensuring necessary profit level for retained earnings to cover possible costs such as cost of overhauling, fuel costs during droughts, and construction costs for new facilities.
Covering construction costs for existing facilities (depreciation), O&M costs and financial cost.
(USC/kWh)
(Source: JICA Survey Team)
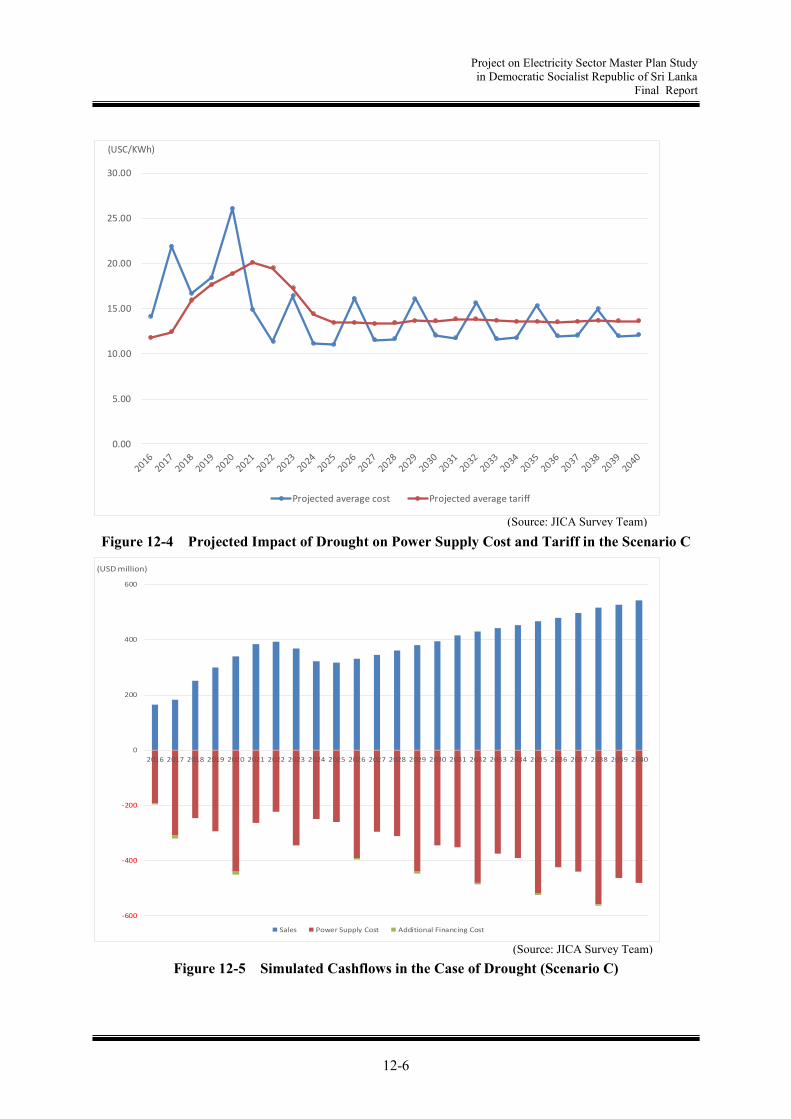
Project on Electricity Sector Master Plan Study in Democratic Socialist Republic of Sri Lanka
Final Report
12-6
Figure 12-4 Projected Impact of Drought on Power Supply Cost and Tariff in the Scenario C
Figure 12-5 Simulated Cashflows in the Case of Drought (Scenario C)
0.00
5.00
10.00
15.00
20.00
25.00
30.00
(USC/KWh)
Projected average cost Projected average tariff
-600
-400
-200
0
200
400
600
2016 2017 2018 2019 2020 2021 2022 2023 2024 2025 2026 2027 2028 2029 2030 2031 2032 2033 2034 2035 2036 2037 2038 2039 2040
(USD million)
Sales Power Supply Cost Additional Financing Cost
(Source: JICA Survey Team)
(Source: JICA Survey Team)

Project on Electricity Sector Master Plan Study in Democratic Socialist Republic of Sri Lanka
Final Report
12-7
On the other hand, in accordance with the tariff formula regulated by PUCSL, unexpected increases in power supply cost caused by drought cannot timely reflect in the tariff which is revised every six months based on the past power supply cost and the projected investment cost. Namely, a time lag to reflect the increases in the power supply cost caused by drought in the revised tariff can generate losses of power supply operation by CEB (Figure 12-5)
Figure 12-6 Projected Profit/Loss and Working Capital to be required in the Case of Drought (Scenario C)
In order to cover cash shortage caused by the loss, CEB needs to finance working capital by commercial loans which can be quite costly. In particular for the period until 2021, the amount of working capital to be financed by short-term loans can increase in order to cover losses by operation and financing cost (interest payment). In case where the drought occurs in 2017 and 2020, the short-term loans for working capital can increase to approximately 300 million USD in 2020.
12.2.2 Tariff Collection
As of May 2016, the tariff collection rate reached 96.3%, which can be sufficiently high. Although further improvement is required in order to attain 100%, the issue of tariff collection cannot be considered a serious factor affecting the financial position of CEB.
12.2.3 Financial Soundness of CEB
The current ratio is one of the financial indicators for assessing solvency, in particular for short-term debt (current assets including cash and asset high liquidity to current liabilities). In general, the desirable level of the current ratio is 2.00 times to current liabilities. Namely, twice the amount of current assets to current liabilities is required. In the case of CEB, the current ratio has been improved though it has been around 100% at most, which cannot be sufficiently sound. The capital ratio and debt to equity ratio are indicators for assessing financial leverage and risk to total debt including non-current liabilities. In particular, the capital ratio indicates solvency to total debt by capital. Both indicators deteriorated by 2012. This was because of the significant increase in long-term debt since 2010. The debt to equity ratio reached 268.8% in 2012 and improved to 88.3% in 2015 due to the debt equity swap and the reduction of long term debt in 2014 as mentioned above. The capital
-200
-100
0
100
200
300
400
(USD million)
Surpuls/Loss Working capital required
(Source: JICA Survey Team)

Project on Electricity Sector Master Plan Study in Democratic Socialist Republic of Sri Lanka
Final Report
12-8
ratio decreased to 27.1% in 2012 and improved to 53.1% in 2015 because of the increased equity due to the debt equity swap in 2014.
(Source: CEB, “Annual Report” (2008, 2009, 2010, 2011, 2012, 2013), Data provided by CEB)
Figure 12-7 Current Ratio and Debt to Equity Ratio
(Source: CEB, “Annual Report” (2008, 2009, 2010, 2011, 2012, 2013), Data provided by CEB)
Figure 12-8 Capital Ratio
66.2%53.9%
116.7%
90.8%73.7%
102.0%91.2%
123.4%72.2%
87.5%
114.2%
156.9%
268.8%
228.8%
102.3%88.3%
0.0%
50.0%
100.0%
150.0%
200.0%
250.0%
300.0%
2008 2009 2010 2011 2012 2013 2014 2015
Current Ratio (Current Assets/Current Liabilities) Debt to Equity Ratio
58.1%
53.3%
46.7%
38.9%
27.1%30.4%
49.4%53.1%
0.0%
10.0%
20.0%
30.0%
40.0%
50.0%
60.0%
70.0%
2008 2009 2010 2011 2012 2013 2014 2015
Capital Ratio (Capital/Total Assets)

Project on Electricity Sector Master Plan Study in Democratic Socialist Republic of Sri Lanka
Final Report
12-9
The ADB approved “Supporting Electricity Supply Reliability Improvement” in July 2016 and the borrower of the approved loan is CEB. As conditionality, the loan agreement includes a financial covenant to set the financial monitoring indicators for CEB. (refer to Table 11-1)
12.3 Financial Sustainability Analysis of CEB
12.3.1 Calculation of Long-Run Marginal Cost (LRMC)
The Survey Team calculated LRMC based on the construction costs for additional facilities for power generation, transmission and distribution in order to meet power demand at peak hours and unit costs for additional costs for fuel, O&M and transmission and distribution loss to be included in the energy cost for power negation. The estimated LRMC is 48.12 USC/kWh, which does not differ by scenario since LRMC is a cost to cope with the increase in peak demand. In Sri Lanka, power supply for the increase in the peak demand is by oil or gas fired power plant which are currently operated by IPP. The power purchase cost from IPPs accounts for the largest portion in additional costs for power generation under the current situation. It is expected that the peak demand will be basically supplied by IPPs. Therefore, LRMC is derived from the power purchase cost from IPPs and transmission and distribution cost required additionally.
Table 12-4 Long Run Marginal Cost
Assumption
Generation Power Purchase 44.41 USC/kWh Fuel cost: 30.86USC/kWh Capacity Charge: 13.50 USC/kWh
Transmission Capital Investment 0.24 USC/kWh Investment cost (1kWh) in transmission system based on the planned capital investment of 595 million USD.
O&M cost 0.28 USC/kWh Estimated cost based on actual cost by 2016
Distribution Capital Investment 0.89 USC/kWh Estimated based on the actual investment cost in 2013
O&M cost 1.48 USC/kWh Estimated cost based on actual cost by 2016
System loss 0.87 USC/kWh Estimated cost based on actual cost by 2016
LRMC 48.12 USC/kWh
12.3.2 Impacts of Scenarios on Balance Sheet
This study simulated the impacts of capital investment on CEB’s financial statements as a Single Operator of Transmission Network in Sri Lanka. The simulations show changes in assets (property, plants and equipment) through capital investment in power facilities and non-current liabilities through capital investment, changes in additional cost to transmission cost, and cashflows of transmission network operation in the case of the Scenario C. In order to meet the growing power demand, more capital investment on expansion of the transmission networks will be required besides incremental investment. Since property and equipment of transmission networks are depreciated for the long term of 35-40 years, the assets increase more than the non current liabilities to finance capital investment by debts.
(Source: JICA Survey Team)

Project on Electricity Sector Master Plan Study in Democratic Socialist Republic of Sri Lanka
Final Report
12-10
Figure 12-9 Impact of Capital Investment for Transmission Network on Assets and Liabilities
of CEB in the Scenario C
However, debt financing for capital investment requires additional cost for transmission due to the interest payment on loans. In particular, in case of use of commercial loans, the financing cost can be high at 10-16% which can be differed by each commercial bank. It is projected that the additional cost for financing is 0.11-0.12 USC/kWh for the period from 2018 to 2021 and increase to 0.14-0.17 for the period from 2026 to 2040.
Figure 12-10 Impact of Capital Investment for Transmission Network on Average Additional Cost to be required
The debt financing also will bring about negative cashflow since the amount of repayment and interest payment will be accumulated year by year but the inflows of depreciation and profit margin are limited though after the inflows of long-term loans for the period from 2017 to 2024. As mentioned above, the annual depreciation cost for investment in transmission facilities can be relatively small due to the longer depreciation period. On the other hand, the repayment periods of long-term loans can be shorter: the repayment period for ODA loans of 25 years and the ones for commercial loans of 10 years. The negative cashflow can bring about more cost for financing working capital to cover the repayment and interest payment of loans. The current level of profit margin of around 16.5 million USD per annum on average,
0
200
400
600
800
1,000
1,200
1,400
1,600
1,800
USD miollion
Asset Debt
(Source: JICA Survey Team)
(Source: JICA Survey Team)

Project on Electricity Sector Master Plan Study in Democratic Socialist Republic of Sri Lanka
Final Report
12-11
which is 2% of the operational assets for transmission, may partly cover the incremental cost of around 47 million USD per annum on average but may bring about an annual cashflow shortage.
Figure 12-11 Impact of Capital Investment for Transmission Network on Cashflow (Case of
Profit Margin at 2% of Operational Assets)
The figure 12-12 show a simulation of profit margin required to cover capital investment by retained earnings of CEB. For the simulation, it is assumed that the profit margin derived from 3.5% of the total operational assets. In this case, for the first 9 years from 2017 to 2025, CEB needs to bear an increasingly heavy burden of repayments and interest payments on long-term debts for the capital investment for the transmission networks to meet the growing power demand, even though the profit margin increases from the current level of 2% of the operational assets to 3.5%. However, afterwards, the cash inflows from depreciation and profit margin may generate a surplus of cashflows and the surplus may enable CEB to cover the capital investments better, perhaps at least incremental ones. This can reduce the debt financing and the financing cost. It is anticipated that the repayments and interest payments will decrease from 2026. After the year 2035, an annual cashflow shortage may not be generated. Namely, CEB can improve its financial position through a reduction of debt financing.
(Source: JICA Survey Team)

Project on Electricity Sector Master Plan Study in Democratic Socialist Republic of Sri Lanka
Final Report
12-12
Figure 12-12 Required Profit Margin to Cover Capital Investment by Retained Earnings (Return on Operational Assets of 3.5%)
12.3.3 Proposal of Investment Plan
Based on the above analysis, the JICA Survey Team proposes options for CEB in order to improve financial position and financial sustainability. It is essential to discuss the following recommendations with PUCSL who determines the Return on Assets level and the electricity tariff level since they require an increase in the electricity tariff. (1) Increase in own capital for the transmission division via increased return on assets While CEB’s Generation Division enables avoidance of additional funding for capital investment through greater participation by IPP for the construction of new power generation facilities for the future, its Transmission Division, as a single buyer, needs to make capital investments for the future and ensure funding. The current Return on Assets level of 2% has not been a serious issue so far because concessional loans with low interest rates from JICA and ADB have been utilized for capital investments on the transmission network. However, it is expected that CEB will not use such ODA loans with low interest rates in the near future. On the other hand, CEB needs to implement construction of transmission lines and substations in a timely manner, in accordance with the construction schedules for power generation facilities. Therefore, it is inevitable that CEB’s Transmission Division will implement capital investment using its own capital or take on commercial loans at some point in time. CEB is required to expand its capital investment in transmission facilities to meet the growing power demand. However, the increase in debt finance for capital investment in transmission facilities, including substations and transmission lines, can increase the financial burden for CEB. Therefore, CEB should prepare a financial source other than loans, which can be costly. Because the current Return on Assets level of 2% on the operational assets has not been sufficient to cover the incremental investment, it is necessary for CEB to increase its own funds. In order to cover the incremental investment by the own fund, CEB requires to accumulate retained earnings from the appropriate profit margin on the transmission tariff. Based on the simulation above, the profit margin of 3.5% on the operational assets can mostly cover the projected incremental cost and reduce debt finance for the capital investment. If the profit margin of 5% on the operational assets enables CEB to make capital investment by retained earnings after 2026. If the profit margin is set to
(Source: JICA Survey Team)

Project on Electricity Sector Master Plan Study in Democratic Socialist Republic of Sri Lanka
Final Report
12-13
3.5% on the operational assets, it is necessary to increase the electricity tariff by about 0.06LKR/kWh over the present level, and when the profit margin on the operational assets is 5%, it is necessary to increase the electricity tariff by about 0.12LKR/kWh. In the case where its own capital increases via the increased Return on Assets, it is expected that the electricity tariff will be reduced in the long-run because of the reduced interest payments on the capital investment in future, though the electricity tariff will increase in the short term. (2) Necessity of ensuring profit margin to deal with dramatic increase in power supply costs
due to drought As mentioned above, CEB’s profitability can be fragile to fluctuation of power supply cost, in particular, by expensive fuel cost for oil-fired power generation in case of water shortage for hydropower generation. Since there is a lag between timing of sharp increase in power generation cost and for revision of electricity tariff and it is not possible to perfectly reflect the increased power generation cost into the tariff, CEB always needs to face financial difficulties to fill the gap between the electricity tariff and the actual power supply cost. CEB requires short-term loans to cover loss by the operation under the situation where the actual power supply cost is higher than the electricity tariff. In order to avoid or mitigate impacts of fluctuation of power supply cost, in particular by water shortage for power generation, it is proposed to introduce setting a profit margin for preparation of cost escalation by water shortage. The profit margin enables CEB to compensate possible loss by a lag between the electricity tariff and the actual cost when drought occurs. The profit margin can be 7.5% for the period from 2018 to 2021 and 3% afterwards to minimize negative financial impact by drought. However, in the case where the Return on Assets is increased, the profit margin can be used for purposes other than the increased power supply costs because there are no limits on the use of proceeds. In order to properly manage the use of proceeds, a mechanism to provide for droughts, which is reserved as a cost and used for this limited purpose when a drought occurs, can be considered as an alternative.
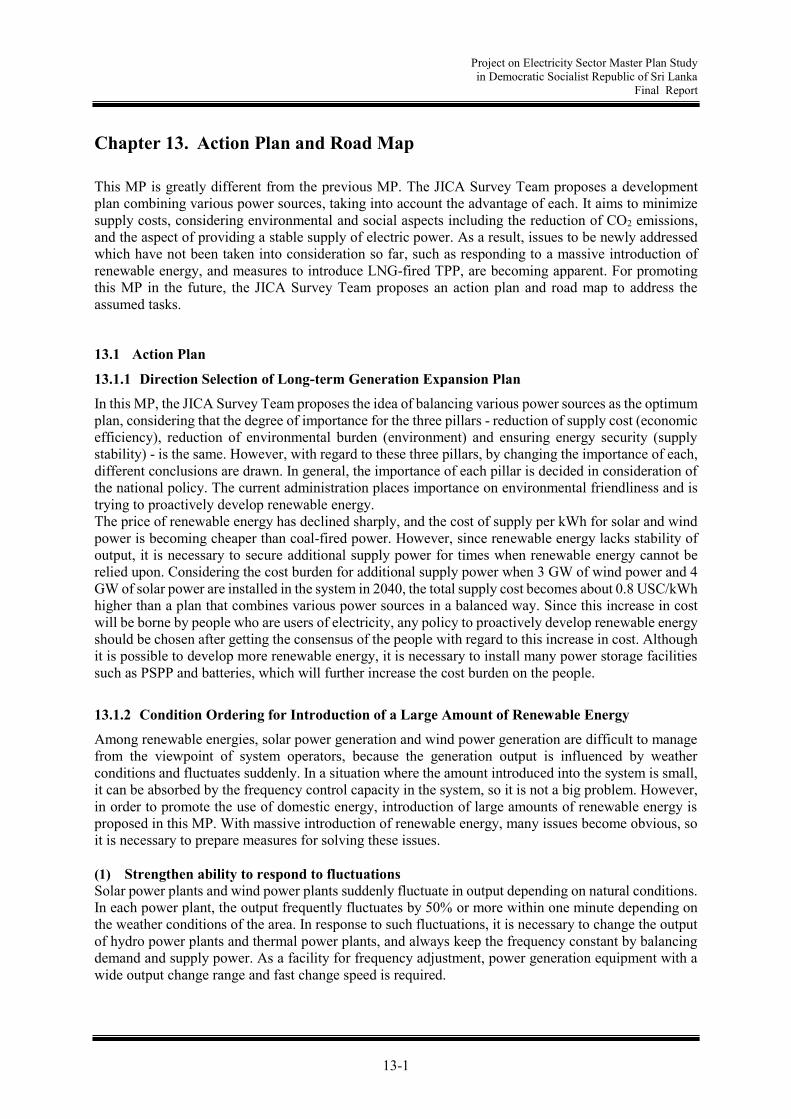
Project on Electricity Sector Master Plan Study in Democratic Socialist Republic of Sri Lanka
Final Report
13-1
Chapter 13. Action Plan and Road Map This MP is greatly different from the previous MP. The JICA Survey Team proposes a development plan combining various power sources, taking into account the advantage of each. It aims to minimize supply costs, considering environmental and social aspects including the reduction of CO2 emissions, and the aspect of providing a stable supply of electric power. As a result, issues to be newly addressed which have not been taken into consideration so far, such as responding to a massive introduction of renewable energy, and measures to introduce LNG-fired TPP, are becoming apparent. For promoting this MP in the future, the JICA Survey Team proposes an action plan and road map to address the assumed tasks.
13.1 Action Plan
13.1.1 Direction Selection of Long-term Generation Expansion Plan
In this MP, the JICA Survey Team proposes the idea of balancing various power sources as the optimum plan, considering that the degree of importance for the three pillars - reduction of supply cost (economic efficiency), reduction of environmental burden (environment) and ensuring energy security (supply stability) - is the same. However, with regard to these three pillars, by changing the importance of each, different conclusions are drawn. In general, the importance of each pillar is decided in consideration of the national policy. The current administration places importance on environmental friendliness and is trying to proactively develop renewable energy. The price of renewable energy has declined sharply, and the cost of supply per kWh for solar and wind power is becoming cheaper than coal-fired power. However, since renewable energy lacks stability of output, it is necessary to secure additional supply power for times when renewable energy cannot be relied upon. Considering the cost burden for additional supply power when 3 GW of wind power and 4 GW of solar power are installed in the system in 2040, the total supply cost becomes about 0.8 USC/kWh higher than a plan that combines various power sources in a balanced way. Since this increase in cost will be borne by people who are users of electricity, any policy to proactively develop renewable energy should be chosen after getting the consensus of the people with regard to this increase in cost. Although it is possible to develop more renewable energy, it is necessary to install many power storage facilities such as PSPP and batteries, which will further increase the cost burden on the people.
13.1.2 Condition Ordering for Introduction of a Large Amount of Renewable Energy
Among renewable energies, solar power generation and wind power generation are difficult to manage from the viewpoint of system operators, because the generation output is influenced by weather conditions and fluctuates suddenly. In a situation where the amount introduced into the system is small, it can be absorbed by the frequency control capacity in the system, so it is not a big problem. However, in order to promote the use of domestic energy, introduction of large amounts of renewable energy is proposed in this MP. With massive introduction of renewable energy, many issues become obvious, so it is necessary to prepare measures for solving these issues. (1) Strengthen ability to respond to fluctuations Solar power plants and wind power plants suddenly fluctuate in output depending on natural conditions. In each power plant, the output frequently fluctuates by 50% or more within one minute depending on the weather conditions of the area. In response to such fluctuations, it is necessary to change the output of hydro power plants and thermal power plants, and always keep the frequency constant by balancing demand and supply power. As a facility for frequency adjustment, power generation equipment with a wide output change range and fast change speed is required.

Project on Electricity Sector Master Plan Study in Democratic Socialist Republic of Sri Lanka
Final Report
13-2
Solar power plants generate power only during the day, and hydropower plants and thermal power plants that can adjust frequency are operating, so in general this is not a big problem. However, a wind power plant operates all day. Since many reservoir-type hydropower plants are stopped during off-peak times, frequency adjustment ability becomes insufficient and there is a concern that the supply quality of electric power will deteriorate remarkably. As a measure to avoid such risks, one may operate reservoir-type hydropower even during off-peak hours, but this is very uneconomical and there is a possibility that surplus supply capacity will increase. Another measure is to introduce power storage facilities, such as PSPP or batteries, and to adjust the frequency while absorbing surplus supply power. In terms of electric power storage facilities, because batteries have such problems as high cost and difficulties with large capacity at the level of current technologies, PSPP is the most feasible. Therefore, if the configuration rate of windpower generation equipment increases and there is a possibility of concern about a shortage of frequency adjustment ability during off-peak hours, it is desirable to introduce PSPP (especially adjustable speed type machines that can control frequency even during pumping operation) into the system. The cost of batteries is very high at present, but can be expected to greatly reduce in the future. Although the capacity of batteries is small, a distributed arrangement is possible, and a load fluctuation suppression effect at the distribution line level can be expected. Because batteries can be installed in a short period of time, it is important to confirm the response ability for load fluctuation by installing a small capacity battery in the Hambantota area, where solar power has already been installed, in preparation for the future mass introduction of renewable energy. (2) Suppress output when surplus power occurs In order to realize a massive introduction of renewable energy, it is necessary for the system operator to be able to request that power generation entities suppress output (or shut down) when surplus power occurs. Suppressing output reduces the amount of power generation and the income of the power generation entities is reduced. It is necessary to decide how to compensate for this loss at the contract stage. Since it is a measure for stable operation of the system, the power producer has an obligation to obey the instructions of the system operator, but in order to ensure the certainty of the output suppression, it is necessary to set proper penalties or to compensate to some extent with money. In addition, if the system operator requests output suppression of an unlimited amount, it becomes impossible to set prospects for profitability as a power generation company. Therefore, it is necessary to decide the upper limit value (frequency or number of times) for output suppression in the contract in advance. In a situation where the forecasted output suppression amount exceeds 10% of the generated amount, the frequency and the amount of requests for suppressing the output increase, making it difficult to secure profitability as a power generating company, and it is desirable to restrict new development. (3) Review of Feed-in-Tariff system For renewable energy of 10MW or less, purchase prices higher than actual prices are offered for the purpose of promoting the development of renewable energy, and electricity is purchased at prices higher than other power sources. Additional cost is supposed to be directly reflected in the electricity tariff, and this places a burden on the citizen. The costs of solar power and wind power have drastically declined in actual price, and are reaching a level that can compete with thermal power, so it is necessary to review the Feed-in-Tariff system as soon as possible. Specifically, it is desirable to limit the scope of the Feed-in Tariff system to a small scale of about 1MW or less, and to revise the purchase price to a price based on the actual price. (4) Institutional design enabling free entry For large-scale renewable energy exceeding 10MW, development companies are selected by a bidding system. Currently, the bidding system that CEB is considering is one where CEB decides the development area and constructs the power transmission facilities at its own expense, then publicly invites an amount of renewable energy commensurate with the transmittable amount, and selects the
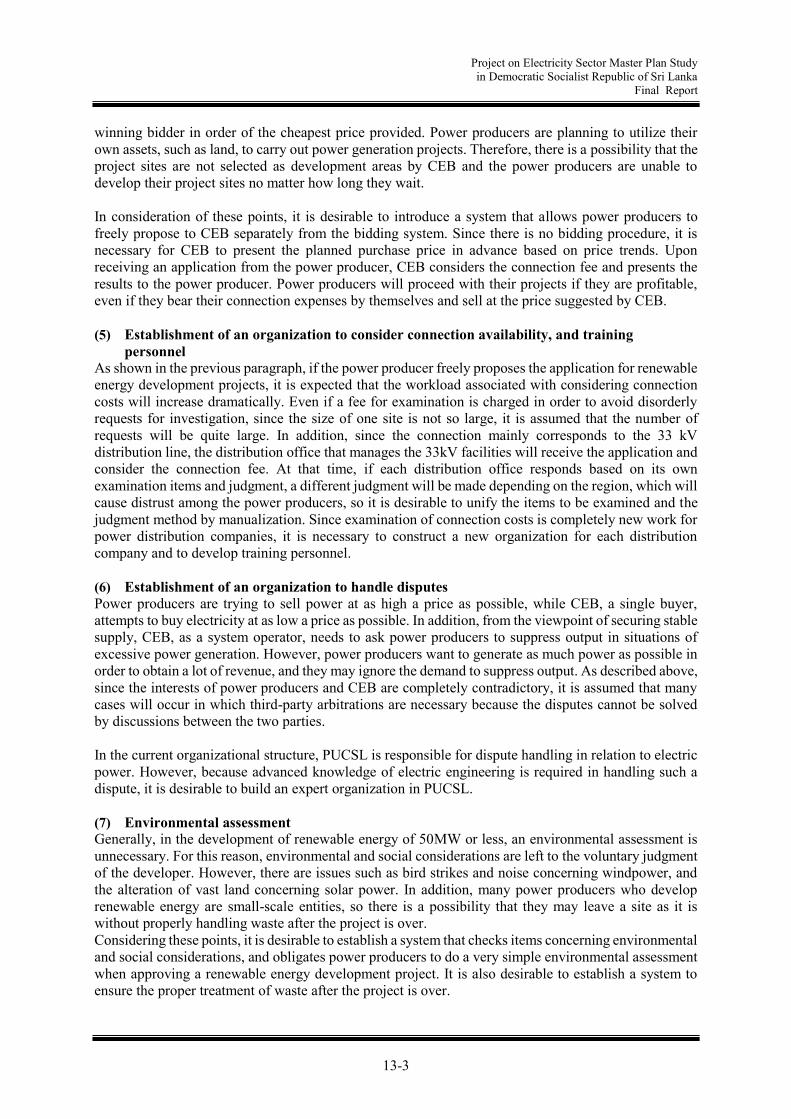
Project on Electricity Sector Master Plan Study in Democratic Socialist Republic of Sri Lanka
Final Report
13-3
winning bidder in order of the cheapest price provided. Power producers are planning to utilize their own assets, such as land, to carry out power generation projects. Therefore, there is a possibility that the project sites are not selected as development areas by CEB and the power producers are unable to develop their project sites no matter how long they wait. In consideration of these points, it is desirable to introduce a system that allows power producers to freely propose to CEB separately from the bidding system. Since there is no bidding procedure, it is necessary for CEB to present the planned purchase price in advance based on price trends. Upon receiving an application from the power producer, CEB considers the connection fee and presents the results to the power producer. Power producers will proceed with their projects if they are profitable, even if they bear their connection expenses by themselves and sell at the price suggested by CEB. (5) Establishment of an organization to consider connection availability, and training
personnel As shown in the previous paragraph, if the power producer freely proposes the application for renewable energy development projects, it is expected that the workload associated with considering connection costs will increase dramatically. Even if a fee for examination is charged in order to avoid disorderly requests for investigation, since the size of one site is not so large, it is assumed that the number of requests will be quite large. In addition, since the connection mainly corresponds to the 33 kV distribution line, the distribution office that manages the 33kV facilities will receive the application and consider the connection fee. At that time, if each distribution office responds based on its own examination items and judgment, a different judgment will be made depending on the region, which will cause distrust among the power producers, so it is desirable to unify the items to be examined and the judgment method by manualization. Since examination of connection costs is completely new work for power distribution companies, it is necessary to construct a new organization for each distribution company and to develop training personnel. (6) Establishment of an organization to handle disputes Power producers are trying to sell power at as high a price as possible, while CEB, a single buyer, attempts to buy electricity at as low a price as possible. In addition, from the viewpoint of securing stable supply, CEB, as a system operator, needs to ask power producers to suppress output in situations of excessive power generation. However, power producers want to generate as much power as possible in order to obtain a lot of revenue, and they may ignore the demand to suppress output. As described above, since the interests of power producers and CEB are completely contradictory, it is assumed that many cases will occur in which third-party arbitrations are necessary because the disputes cannot be solved by discussions between the two parties. In the current organizational structure, PUCSL is responsible for dispute handling in relation to electric power. However, because advanced knowledge of electric engineering is required in handling such a dispute, it is desirable to build an expert organization in PUCSL. (7) Environmental assessment Generally, in the development of renewable energy of 50MW or less, an environmental assessment is unnecessary. For this reason, environmental and social considerations are left to the voluntary judgment of the developer. However, there are issues such as bird strikes and noise concerning windpower, and the alteration of vast land concerning solar power. In addition, many power producers who develop renewable energy are small-scale entities, so there is a possibility that they may leave a site as it is without properly handling waste after the project is over. Considering these points, it is desirable to establish a system that checks items concerning environmental and social considerations, and obligates power producers to do a very simple environmental assessment when approving a renewable energy development project. It is also desirable to establish a system to ensure the proper treatment of waste after the project is over.
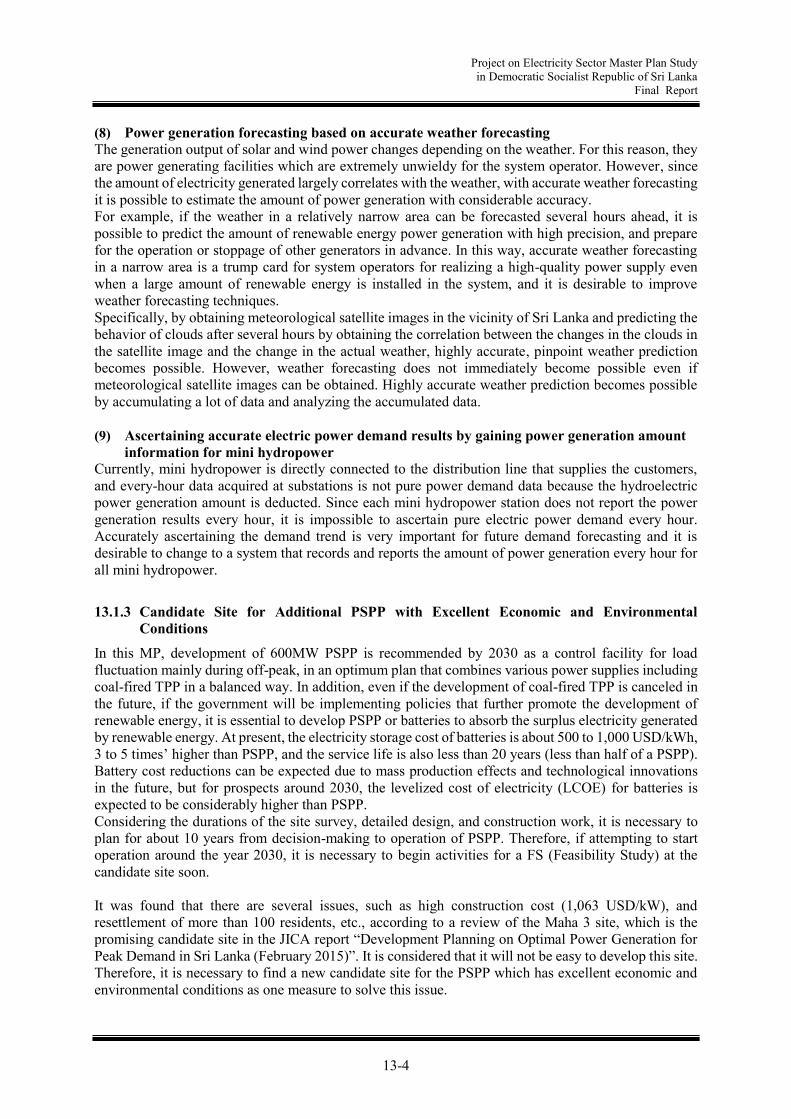
Project on Electricity Sector Master Plan Study in Democratic Socialist Republic of Sri Lanka
Final Report
13-4
(8) Power generation forecasting based on accurate weather forecasting The generation output of solar and wind power changes depending on the weather. For this reason, they are power generating facilities which are extremely unwieldy for the system operator. However, since the amount of electricity generated largely correlates with the weather, with accurate weather forecasting it is possible to estimate the amount of power generation with considerable accuracy. For example, if the weather in a relatively narrow area can be forecasted several hours ahead, it is possible to predict the amount of renewable energy power generation with high precision, and prepare for the operation or stoppage of other generators in advance. In this way, accurate weather forecasting in a narrow area is a trump card for system operators for realizing a high-quality power supply even when a large amount of renewable energy is installed in the system, and it is desirable to improve weather forecasting techniques. Specifically, by obtaining meteorological satellite images in the vicinity of Sri Lanka and predicting the behavior of clouds after several hours by obtaining the correlation between the changes in the clouds in the satellite image and the change in the actual weather, highly accurate, pinpoint weather prediction becomes possible. However, weather forecasting does not immediately become possible even if meteorological satellite images can be obtained. Highly accurate weather prediction becomes possible by accumulating a lot of data and analyzing the accumulated data. (9) Ascertaining accurate electric power demand results by gaining power generation amount
information for mini hydropower Currently, mini hydropower is directly connected to the distribution line that supplies the customers, and every-hour data acquired at substations is not pure power demand data because the hydroelectric power generation amount is deducted. Since each mini hydropower station does not report the power generation results every hour, it is impossible to ascertain pure electric power demand every hour. Accurately ascertaining the demand trend is very important for future demand forecasting and it is desirable to change to a system that records and reports the amount of power generation every hour for all mini hydropower.
13.1.3 Candidate Site for Additional PSPP with Excellent Economic and Environmental Conditions
In this MP, development of 600MW PSPP is recommended by 2030 as a control facility for load fluctuation mainly during off-peak, in an optimum plan that combines various power supplies including coal-fired TPP in a balanced way. In addition, even if the development of coal-fired TPP is canceled in the future, if the government will be implementing policies that further promote the development of renewable energy, it is essential to develop PSPP or batteries to absorb the surplus electricity generated by renewable energy. At present, the electricity storage cost of batteries is about 500 to 1,000 USD/kWh, 3 to 5 times’ higher than PSPP, and the service life is also less than 20 years (less than half of a PSPP). Battery cost reductions can be expected due to mass production effects and technological innovations in the future, but for prospects around 2030, the levelized cost of electricity (LCOE) for batteries is expected to be considerably higher than PSPP. Considering the durations of the site survey, detailed design, and construction work, it is necessary to plan for about 10 years from decision-making to operation of PSPP. Therefore, if attempting to start operation around the year 2030, it is necessary to begin activities for a FS (Feasibility Study) at the candidate site soon. It was found that there are several issues, such as high construction cost (1,063 USD/kW), and resettlement of more than 100 residents, etc., according to a review of the Maha 3 site, which is the promising candidate site in the JICA report “Development Planning on Optimal Power Generation for Peak Demand in Sri Lanka (February 2015)”. It is considered that it will not be easy to develop this site. Therefore, it is necessary to find a new candidate site for the PSPP which has excellent economic and environmental conditions as one measure to solve this issue.

Project on Electricity Sector Master Plan Study in Democratic Socialist Republic of Sri Lanka
Final Report
13-5
In the existing report, since the maximum unit capacity was set to 200MW from the viewpoint of system operation, the high effective head sites were excluded from the target at the stage of extraction of the optimum site due to restrictions on equipment manufacturing. It is concluded that the maximum unit capacity can be increased up to 400MW in 2040 in this MP survey, so there is a possibility that promising sites, excellent both economically and environmentally, remain in the list of sites excluded from the target at the initial stage due to restrictions on equipment manufacturing (refer to Appendix-1).
13.1.4 Promotion of Introduction of LNG-fired TPP
According to the “New Policies Scenario” in WEO 2016 by the IEA, the price of oil in 2040 will rise 2.4 times compared to 2015, and the LNG price in 2040 will be 1.2 times’ the 2015 level. In other words, the fuel cost for 300MW oil-fired combined cycle is currently as high as 16 USC/kWh, but is assumed to rise to about 38 USC/kWh in 2040. The fuel cost for 300MW LNG-fired combined cycle is currently about 10 USC/kWh, but will be about 12 USC/kWh in 2040. Therefore, the current difference is about 6 USC/kWh, but when comparing the fuel costs in 2040 it is a very large difference of about 26 USC/kWh. In this MP report, the JICA Survey Team proposes to introduce LNG-fired TPP as a power source instead of oil-fired TPP from the viewpoint of economic efficiency, and to convert some existing oil-fired TPP to LNG-fired. Even at present, the price of oil is high, so it is necessary to promote the introduction of LNG as soon as possible in order to reduce supply costs. (1) Construction of fuel supply facilities Since natural gas is a gas at normal temperature, it is necessary to liquefy it into LNG for transport and storage in large quantities. LNG needs to be transported and stored at an extremely low temperature of -162°C or less, and has the following issues. Fuel supply facilities (transportation vessels, storage tanks, etc.) are very expensive compared to petroleum. Because long-term storage is difficult, it is necessary to receive fuel regularly. It takes time to construct the fuel receiving facilities. As a long-term measure, it is considered most desirable to construct a dedicated port and LNG station around Colombo. However, because it takes time to construct a dedicated port, installing an FSRU (Floating Storage Registration Unit) within Colombo Port can be considered as a short-term strategy in order to promote the introduction of LNG as soon as possible. It is important to decide which method to adopt as early as possible and to start construction of fuel supply facilities. However, it is necessary to comprehensively judge final decisions considering the required amount of LNG, the necessary timing, the procurement period, the reserve amount of domestically produced natural gas and the time when it can be introduced. (2) Development prospects for domestic natural gas The recoverable reserves of domestic natural gas currently confirmed amount to 0.3 TCF (Trillion cubic feet) at Dorado gas field. The total reserves of the two gas fields, including the Barracuda gas field adjacent to Dorado, are estimated to be about 2 TCF. These reserves are comparable to the amount of a 300MW CCGT operating at 50% plant factor for 240 years. According to the PRDS's estimation, the supply cost from the domestic gas field is estimated at 16.5 USD/MMBTU. The imported LNG price is assumed to be 13.7 USD/MMBTU (Colombo CIF in 2015, not including the cost of LNG supply facilities), so LNG is still slightly cheaper than domestic gas even including the cost of LNG supply facilities. However, domestic gas has superiority in terms of energy security, such as price stability and supply stability, and considering this, has a more competitive price than LNG. In this way, since domestic gas is estimated to have the necessary and sufficient reserves, and has a more competitive price than LNG, from the viewpoint of effective utilization of domestic resources it is

Project on Electricity Sector Master Plan Study in Democratic Socialist Republic of Sri Lanka
Final Report
13-6
desirable to accelerate activities targeting the early start of domestic gas supply commercial operations. Moreover, in order to reduce the usage of petroleum fuel at an early stage, it is advisable to introduce LNG by using FSRU, which can be constructed earlier, and to shift from LNG to domestic gas at the stage when the domestic gas supply becomes available.
(3) Fuel procurement Since LNG-fired TPP is responsible for regulating supply and demand, the consumption of LNG fuel is greatly influenced by the supply and demand situation of electric power. In a contract for procurement of LNG fuel, stable fuel procurement becomes possible if buyers are limited and a long term contract of 10 years or more is concluded. However, because LNG fuel is very limited for applications other than electricity generation, there is no takeover destination even if a surplus of fuel occurs. Therefore, if the annual fuel import volume is fixed, there is a possibility of operating LNG-fired TPP in preference to coal-fired TPP in order to consume the contracted LNG fuel. In order to avoid such a situation, it is necessary to have elasticity in procuring LNG fuel. Specifically, it is advisable to procure about half of the consumption by spot contracts in addition to long-term contracts of 10 years or longer. In Sri Lanka, organizations that operate LNG fuel supply facilities are likely to demand more than a certain amount of consumption from power generation entities in order to recover costs related to construction. If all the LNG-fired TPP is subjected to operational limitation from the fuel side, it becomes very difficult to bear the supply and demand adjustment function. Therefore, it is desirable that CPC or CEB manages and operates the LNG fuel supply facilities without entrusting this to a private company. (4) Environmental and social considerations In general, LNG-fired TPP doesn’t emit air pollutants or thermal discharge to the extent that coal-fired TPP does. For this reason, it is likely for LNG-fired TPP to be established in areas relatively close to cities. From this point of view, it is considered that the effect on the natural environment is small, but there is a concern that social activities can be affected during the construction period. For example, there may be traffic jams around the construction area. Moreover, it is predicted that air pollution concentration in the city will already be high due to air pollutants from surrounding factories and vehicles. Therefore, it is necessary to check the environment around the site and limit the overall amount, including existing emission sources, and also carry out periodic monitoring surveys after commissioning.
13.1.5 Introduction of Coal-fired TPP with sufficient Consideration for the Environment
With regard to CO2 emissions, it is difficult to mitigate these at the current technology level, so emissions per kWh from coal-fired TPP are about twice as large as those from LNG-fired TPP. In the actual data from 2015, the CO2 emissions per kWh are 0.45 kg/kWh on average for all power generation facilities, which is almost the same low level as developed countries. In Scenario C, recommended by this MP, development of not only LNG thermal power but also coal-fired power is carried out, but development of renewable energy is also carried out at the same time, so the CO2 emissions per kWh in future will be almost the same as the present situation. In order to promote coal-fired TPP development, as for the ash storage area of the existing Norocholai power plant that is actually creating a negative impact on the environment, measures to prevent scattering, such as installing a fence, must be taken as soon as possible. CEB will take the necessary measures for the problem that is currently occurring and should explain to the stakeholders that it is possible to reduce the negative environmental impact on the surrounding area by emissions other than CO2 to a level comparable to LNG-fired TPP by introducing appropriate environmental measures. It is necessary to dispel the negative image of coal-fired TPP and place it as one of the important power sources in LTGEP 2020-2039, which is the next rolling plan (to be submitted by April 30, 2019).
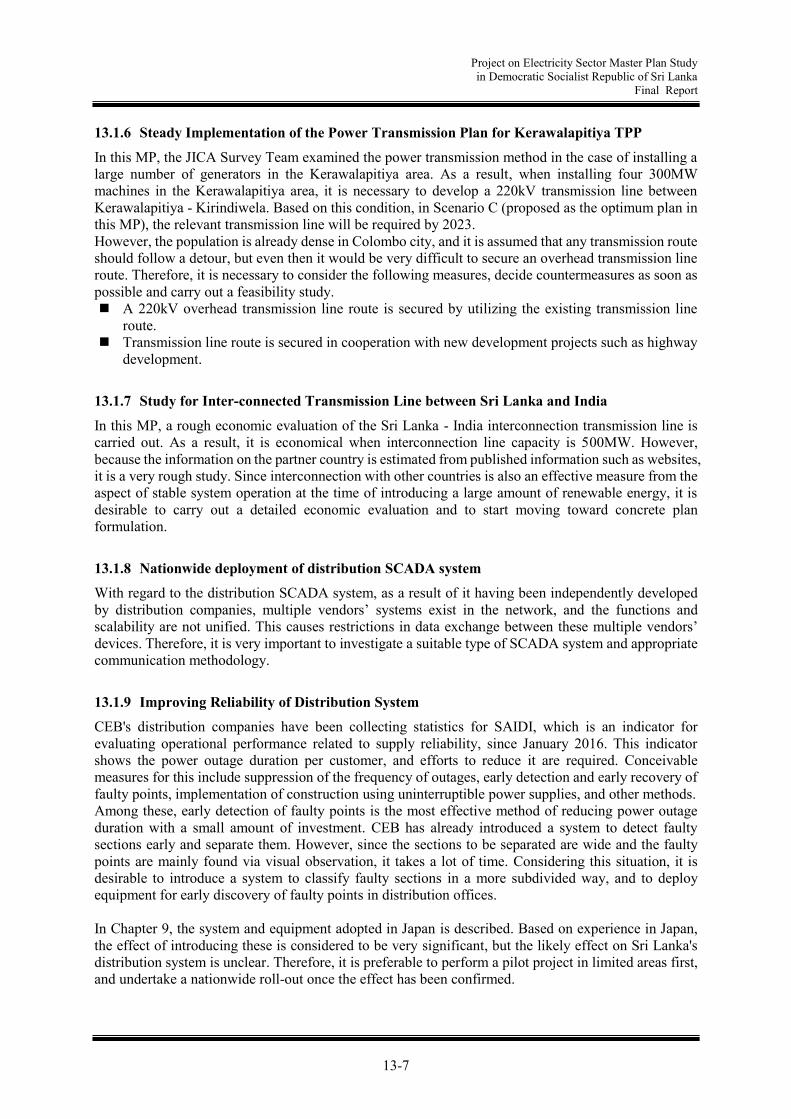
Project on Electricity Sector Master Plan Study in Democratic Socialist Republic of Sri Lanka
Final Report
13-7
13.1.6 Steady Implementation of the Power Transmission Plan for Kerawalapitiya TPP
In this MP, the JICA Survey Team examined the power transmission method in the case of installing a large number of generators in the Kerawalapitiya area. As a result, when installing four 300MW machines in the Kerawalapitiya area, it is necessary to develop a 220kV transmission line between Kerawalapitiya - Kirindiwela. Based on this condition, in Scenario C (proposed as the optimum plan in this MP), the relevant transmission line will be required by 2023. However, the population is already dense in Colombo city, and it is assumed that any transmission route should follow a detour, but even then it would be very difficult to secure an overhead transmission line route. Therefore, it is necessary to consider the following measures, decide countermeasures as soon as possible and carry out a feasibility study. A 220kV overhead transmission line route is secured by utilizing the existing transmission line
route. Transmission line route is secured in cooperation with new development projects such as highway
development.
13.1.7 Study for Inter-connected Transmission Line between Sri Lanka and India
In this MP, a rough economic evaluation of the Sri Lanka - India interconnection transmission line is carried out. As a result, it is economical when interconnection line capacity is 500MW. However, because the information on the partner country is estimated from published information such as websites, it is a very rough study. Since interconnection with other countries is also an effective measure from the aspect of stable system operation at the time of introducing a large amount of renewable energy, it is desirable to carry out a detailed economic evaluation and to start moving toward concrete plan formulation.
13.1.8 Nationwide deployment of distribution SCADA system
With regard to the distribution SCADA system, as a result of it having been independently developed by distribution companies, multiple vendors’ systems exist in the network, and the functions and scalability are not unified. This causes restrictions in data exchange between these multiple vendors’ devices. Therefore, it is very important to investigate a suitable type of SCADA system and appropriate communication methodology.
13.1.9 Improving Reliability of Distribution System
CEB's distribution companies have been collecting statistics for SAIDI, which is an indicator for evaluating operational performance related to supply reliability, since January 2016. This indicator shows the power outage duration per customer, and efforts to reduce it are required. Conceivable measures for this include suppression of the frequency of outages, early detection and early recovery of faulty points, implementation of construction using uninterruptible power supplies, and other methods. Among these, early detection of faulty points is the most effective method of reducing power outage duration with a small amount of investment. CEB has already introduced a system to detect faulty sections early and separate them. However, since the sections to be separated are wide and the faulty points are mainly found via visual observation, it takes a lot of time. Considering this situation, it is desirable to introduce a system to classify faulty sections in a more subdivided way, and to deploy equipment for early discovery of faulty points in distribution offices. In Chapter 9, the system and equipment adopted in Japan is described. Based on experience in Japan, the effect of introducing these is considered to be very significant, but the likely effect on Sri Lanka's distribution system is unclear. Therefore, it is preferable to perform a pilot project in limited areas first, and undertake a nationwide roll-out once the effect has been confirmed.

Project on Electricity Sector Master Plan Study in Democratic Socialist Republic of Sri Lanka
Final Report
13-8
13.2 Road Map
For the action plan shown in the previous section, the road map showing the execution timing and persons in charge of the implementation is shown below.
Table 13-1 Road Map
(Source: JICA Survey Team)
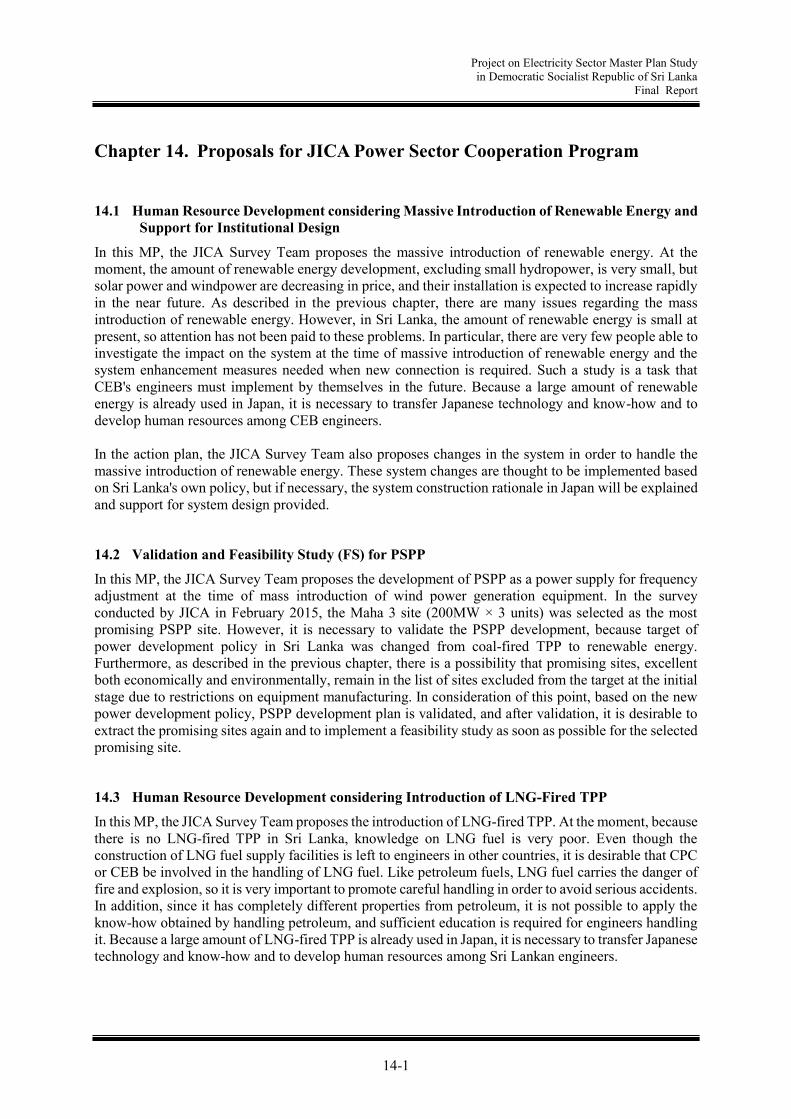
Project on Electricity Sector Master Plan Study in Democratic Socialist Republic of Sri Lanka
Final Report
14-1
Chapter 14. Proposals for JICA Power Sector Cooperation Program
14.1 Human Resource Development considering Massive Introduction of Renewable Energy and Support for Institutional Design
In this MP, the JICA Survey Team proposes the massive introduction of renewable energy. At the moment, the amount of renewable energy development, excluding small hydropower, is very small, but solar power and windpower are decreasing in price, and their installation is expected to increase rapidly in the near future. As described in the previous chapter, there are many issues regarding the mass introduction of renewable energy. However, in Sri Lanka, the amount of renewable energy is small at present, so attention has not been paid to these problems. In particular, there are very few people able to investigate the impact on the system at the time of massive introduction of renewable energy and the system enhancement measures needed when new connection is required. Such a study is a task that CEB's engineers must implement by themselves in the future. Because a large amount of renewable energy is already used in Japan, it is necessary to transfer Japanese technology and know-how and to develop human resources among CEB engineers. In the action plan, the JICA Survey Team also proposes changes in the system in order to handle the massive introduction of renewable energy. These system changes are thought to be implemented based on Sri Lanka's own policy, but if necessary, the system construction rationale in Japan will be explained and support for system design provided.
14.2 Validation and Feasibility Study (FS) for PSPP
In this MP, the JICA Survey Team proposes the development of PSPP as a power supply for frequency adjustment at the time of mass introduction of wind power generation equipment. In the survey conducted by JICA in February 2015, the Maha 3 site (200MW × 3 units) was selected as the most promising PSPP site. However, it is necessary to validate the PSPP development, because target of power development policy in Sri Lanka was changed from coal-fired TPP to renewable energy. Furthermore, as described in the previous chapter, there is a possibility that promising sites, excellent both economically and environmentally, remain in the list of sites excluded from the target at the initial stage due to restrictions on equipment manufacturing. In consideration of this point, based on the new power development policy, PSPP development plan is validated, and after validation, it is desirable to extract the promising sites again and to implement a feasibility study as soon as possible for the selected promising site.
14.3 Human Resource Development considering Introduction of LNG-Fired TPP
In this MP, the JICA Survey Team proposes the introduction of LNG-fired TPP. At the moment, because there is no LNG-fired TPP in Sri Lanka, knowledge on LNG fuel is very poor. Even though the construction of LNG fuel supply facilities is left to engineers in other countries, it is desirable that CPC or CEB be involved in the handling of LNG fuel. Like petroleum fuels, LNG fuel carries the danger of fire and explosion, so it is very important to promote careful handling in order to avoid serious accidents. In addition, since it has completely different properties from petroleum, it is not possible to apply the know-how obtained by handling petroleum, and sufficient education is required for engineers handling it. Because a large amount of LNG-fired TPP is already used in Japan, it is necessary to transfer Japanese technology and know-how and to develop human resources among Sri Lankan engineers.
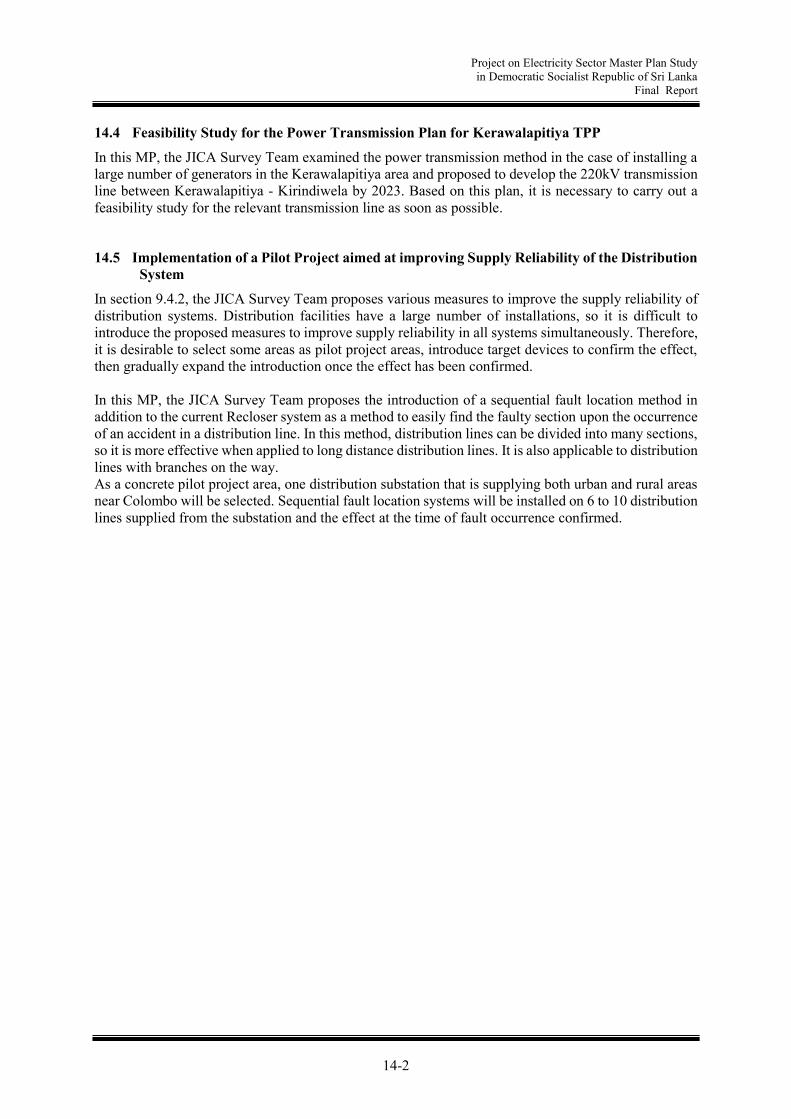
Project on Electricity Sector Master Plan Study in Democratic Socialist Republic of Sri Lanka
Final Report
14-2
14.4 Feasibility Study for the Power Transmission Plan for Kerawalapitiya TPP
In this MP, the JICA Survey Team examined the power transmission method in the case of installing a large number of generators in the Kerawalapitiya area and proposed to develop the 220kV transmission line between Kerawalapitiya - Kirindiwela by 2023. Based on this plan, it is necessary to carry out a feasibility study for the relevant transmission line as soon as possible.
14.5 Implementation of a Pilot Project aimed at improving Supply Reliability of the Distribution System
In section 9.4.2, the JICA Survey Team proposes various measures to improve the supply reliability of distribution systems. Distribution facilities have a large number of installations, so it is difficult to introduce the proposed measures to improve supply reliability in all systems simultaneously. Therefore, it is desirable to select some areas as pilot project areas, introduce target devices to confirm the effect, then gradually expand the introduction once the effect has been confirmed. In this MP, the JICA Survey Team proposes the introduction of a sequential fault location method in addition to the current Recloser system as a method to easily find the faulty section upon the occurrence of an accident in a distribution line. In this method, distribution lines can be divided into many sections, so it is more effective when applied to long distance distribution lines. It is also applicable to distribution lines with branches on the way. As a concrete pilot project area, one distribution substation that is supplying both urban and rural areas near Colombo will be selected. Sequential fault location systems will be installed on 6 to 10 distribution lines supplied from the substation and the effect at the time of fault occurrence confirmed.

Project on Electricity Sector Master Plan Study in Democratic Socialist Republic of Sri Lanka
Final Report
15-1
Chapter 15. Appendix
15.1 Appendix-1: Additional Pumped Storage Power Project
As mentioned in section 7.2 (1), Maha 3 PSPP, which was selected as the most likely project in a past study report, has a lot of issues to be solved. Accordingly, the following PSPP candidate site is selected additionally in this study as a likely alternative in order to solve the issues.
15.1.1 Profile of Additional Pumped Storage Power Project
(1) Outline of the project The project involves the existing Victoria reservoir being used for the lower pond and the existing irrigation pond located on the eastern side of Victoria Lake being used for the upper pond by expanding the pond. The net head and maximum discharge are planned as 686m and 240m3/s respectively, and the installed capacity could be 1,400MW. The unit capacity is set as 350MW, taking into consideration the manufacturing limit of pump-turbines. It is 177km long, along the blue line route in the below figure, from Colombo city to the outlet site of the project and it takes 4.5 hours by car. In addition, there is a roadway 2m wide to the upper pond site; thus, it is accessible by car.
(Source: JICA Survey Team)
Figure 15-1 Location of Additional PSPP
The project profile is shown in Table 15-1; here, the peak duration hours are set at 6, which is common in developing countries. Since it is possible to develop installed capacity of at most 1,400MW from the viewpoint of the topographical and geological features, a 2 stage development scheme is applied taking into consideration scale economy and the installation timing needed for the whole power system.

Project on Electricity Sector Master Plan Study in Democratic Socialist Republic of Sri Lanka
Final Report
15-2
Table 15-1 Project Profile for Additional PSPP
(Source: JICA Survey Team) (2) Plot plan for the main facilities A plot plan for the main facilities (on 1/50,000 topographical map and Google Earth) and the longitudinal section along the waterway route are illustrated in Figure 15-2, Figure 15-3 and Figure 15-4, respectively.
(Source: JICA Survey Team)
Figure 15-2 Plot Plan for Victoria PSPP (1/50,000 Topographical Map)
Upper Reservoir Lower Reservoir Upper dam Lower dam
Coordinates 7° 15' 49.02" N 80° 50' 19.39" E
7° 15' 12.37" N 80° 47' 42.14" E
Name of River Wewathenna Mahaweli Ganga River System Catchment area 0.3 km2 6.7 km2
HWL EL. 1160 m EL. 438 m LWL EL. 1125 m EL. 407 m
Available drawdown 35 m 31 m Gross storage capacity 5.5*106 m3 10.0*106 m3
Effective storage capacity 5.1*106 m3 5.1*106 m3 Reservoir area 0.17 km2 0.3 km2
Generation Pumping up Output (Input) 1400MW 1571MW
Discharge 240 m3/s 188 m3/s Gross head 727 m ―
Effective head 686 m ― Max. pumping head ― 754 m Min. pumping head ― 687 m Peak duration time 6.0 hr
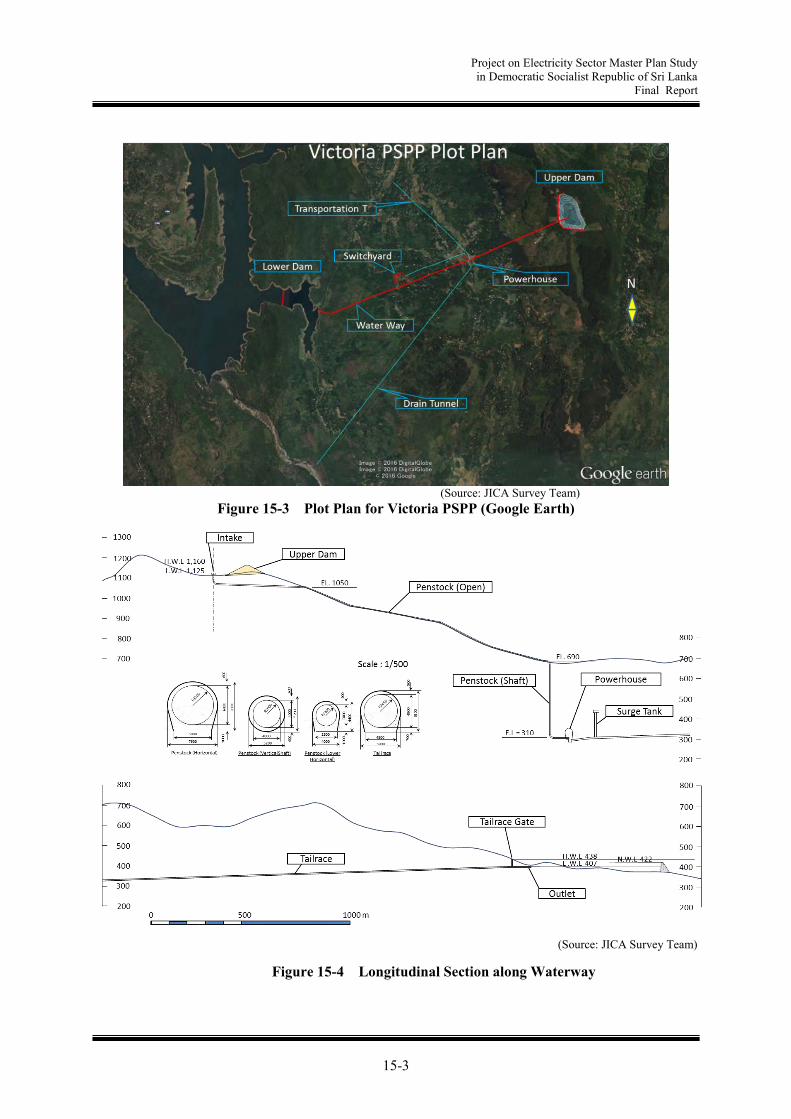
Project on Electricity Sector Master Plan Study in Democratic Socialist Republic of Sri Lanka
Final Report
15-3
(Source: JICA Survey Team)
Figure 15-3 Plot Plan for Victoria PSPP (Google Earth)
(Source: JICA Survey Team)
Figure 15-4 Longitudinal Section along Waterway

Project on Electricity Sector Master Plan Study in Democratic Socialist Republic of Sri Lanka
Final Report
15-4
(3) Upper Dam Although the left bank (east side) of the upper pond is formed by mountain ranges with EL. 1,200m, the elevation of the ridge of the right bank (west side) is as low as EL. 1,140m. Therefore, the upper dam is to be formed by augmenting the existing irrigation dam and prolonging it up to the tail end of the pond along the ridge. Since the alignment of the dam axis is curved in a convex shape to the outside, an asphalt facing fill type dam, which can be flexible against tensile deformation, is adopted. The layout of the upper pond and a cross section of the upper dam are illustrated in Figure 15-5.
(Source: JICA Survey Team)
Figure 15-5 Layout of Upper Pond and Cross Section of Upper Dam
(4) Lower Dam The existing Victoria reservoir (active storage capacity of 688MCM) is utilized as the lower dam. However, the Victoria reservoir is operated between LWL. 370m and HWL. 438m (available drawdown depth of 68m), and the water level has varied significantly on yearly and seasonal bases, for which actual records for the past 16 years are shown in Figure 15-6. The monthly mean water level from Apr. to Oct. is less than 416m. Accordingly, a submerged dam is installed as the lower dam in order to ensure the required storage capacity in drought years and during the dry season. The layout of the lower dam (submerged) and the outlet are illustrated in Figure 15-7.
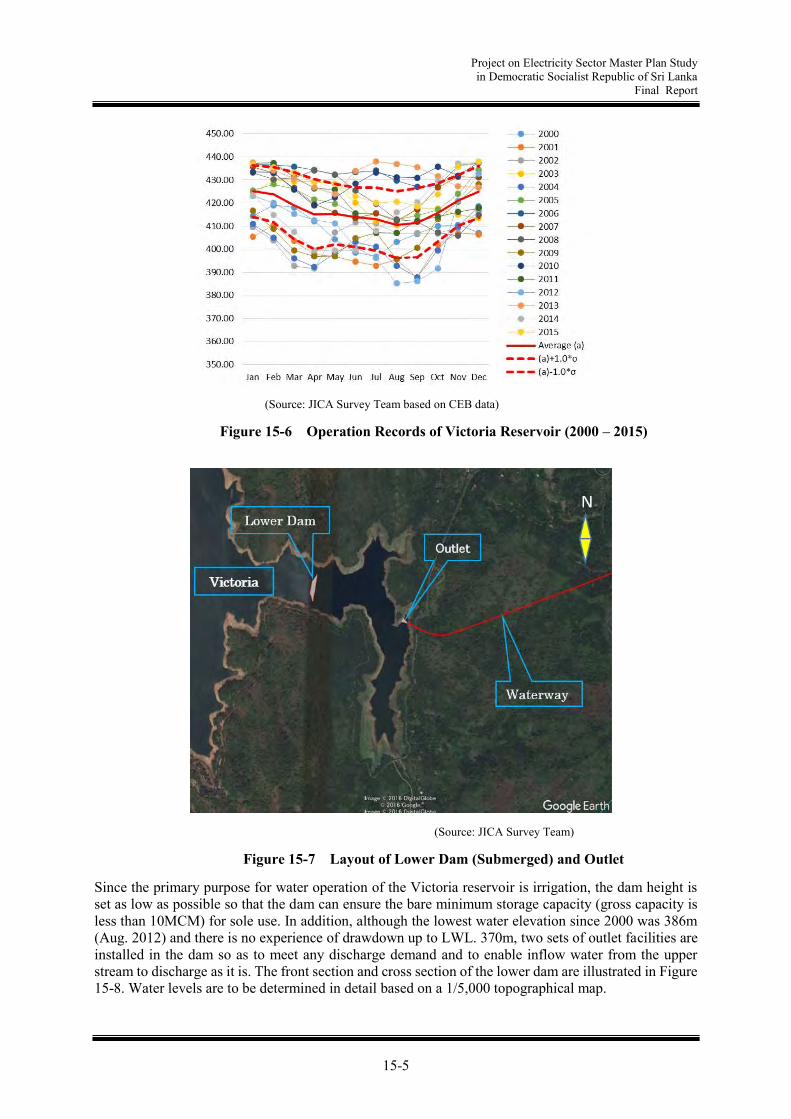
Project on Electricity Sector Master Plan Study in Democratic Socialist Republic of Sri Lanka
Final Report
15-5
(Source: JICA Survey Team based on CEB data)
Figure 15-6 Operation Records of Victoria Reservoir (2000 – 2015)
(Source: JICA Survey Team)
Figure 15-7 Layout of Lower Dam (Submerged) and Outlet
Since the primary purpose for water operation of the Victoria reservoir is irrigation, the dam height is set as low as possible so that the dam can ensure the bare minimum storage capacity (gross capacity is less than 10MCM) for sole use. In addition, although the lowest water elevation since 2000 was 386m (Aug. 2012) and there is no experience of drawdown up to LWL. 370m, two sets of outlet facilities are installed in the dam so as to meet any discharge demand and to enable inflow water from the upper stream to discharge as it is. The front section and cross section of the lower dam are illustrated in Figure 15-8. Water levels are to be determined in detail based on a 1/5,000 topographical map.
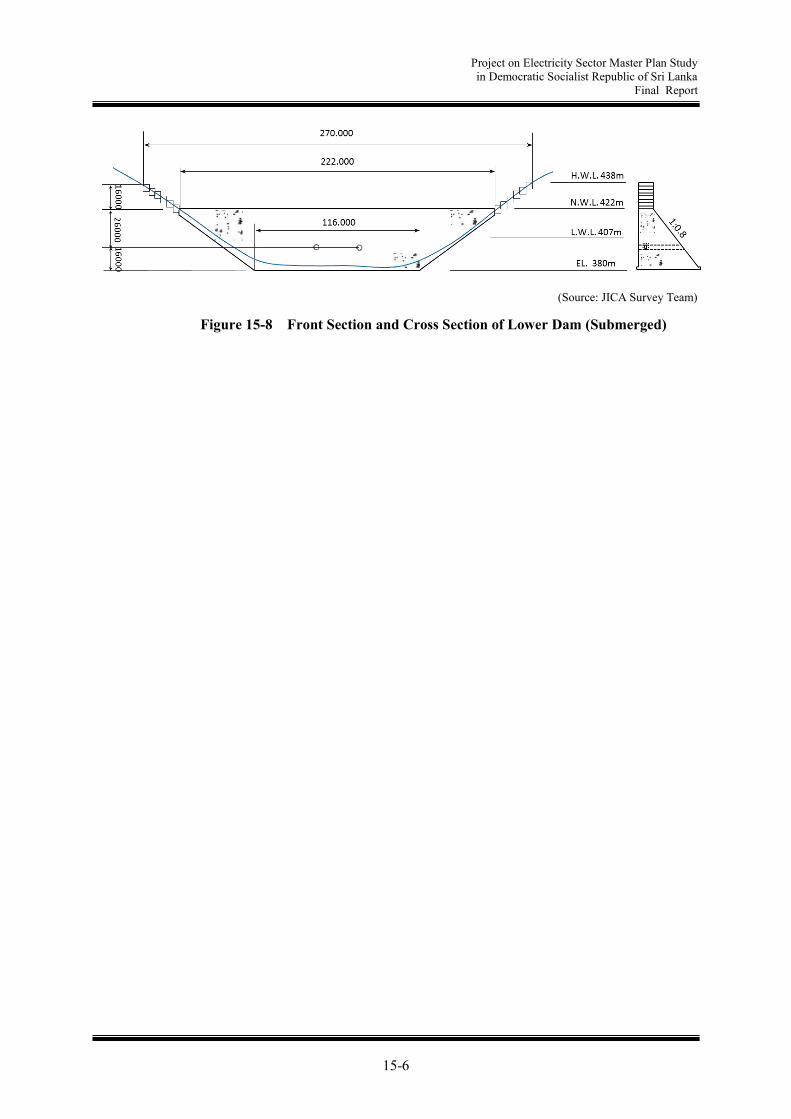
Project on Electricity Sector Master Plan Study in Democratic Socialist Republic of Sri Lanka
Final Report
15-6
(Source: JICA Survey Team)
Figure 15-8 Front Section and Cross Section of Lower Dam (Submerged)

Project on Electricity Sector Master Plan Study in Democratic Socialist Republic of Sri Lanka
Final Report
15-7
(5) Project features for each main facility Project features for each main facility based on the conceptual design are shown in Table 15-2.
Table 15-2 Project Features for Each Main Facility
(Source: JICA Survey Team)
Name Upper dam Lower dam
TypeAsphalt Facing Rock Fill
DamConcrete Gravity Dam
Height 40.0 m 42.0 m
Crest length 1000.0 m 222.0 m
Crest width 10 m 10 m
Upstream surface 1: 2.0 Upstream surface 1: 0.0
Downstream surface 1: 1.8 Downstream surface 1: 0.8
Volume 1000*10^3 m3
200*10^3 m3
Type
Entrance shape
Type
Internal diameter
Length
Type
Internal diameter
Type
Internal diameter
Type
Internal diameter
Length
Type
Upper chamber
Shaft
Orifice (Port)
Type
Entrance shape
Type
Height
Width
Length
Type
Number of units
Type
Number of units 4 units
#1,#2 : 415MVA
#3,#4 : 415MVA
218.0 m
Single stage Francis type with vertical shaft, Reversible
4 units
#1,#2 : 360MW/410MW
#3,#4 : 360MW/410MW
Adjustable speed generator motor
Internal Diameter 3.3 m
Lateral type, RC structure
H: 4.9m*W: 24.1m
Underground type, RC structure
57.5 m
34.0 m
Pressure tunnel with Circular cross section
4.9 m
2590.0 m
Restricted orifice surge tank with Upper chamber
W: 10.0m*H: 12.0m*L: 55.0m
Internal diameter : 8.0 m , Height : 122.0 m
2 branches : #1,#2=1680 m , #3,#4=1680 m
4 branches : #1,#2=90.0m, #3,#4=90.0m,
Pressure tunnel with Circular cross section
3.5-4.9m
4 branches : #1=81.7m, #2=81.7m
2 branches : #1,#2=10.0 m , #3,#4=10.0 m
Welded steel pipe (Open & Embedded type)
6.4-2.0 m
1 branch : 432 m
Morning-glory type , RC structure
H: 5.5m*W: 11.3m*8 mouths
Pressure tunnel with Circular cross section
6.4 m
432 m
Generator-
MotorCapacity
Length
Tailbay
Tailrace Surge
Tank
Tailrace
Pump-Turbine
capacity
Outlet
Power house
Dam
Intake
Headrace
Slope
Penstock
Length

Project on Electricity Sector Master Plan Study in Democratic Socialist Republic of Sri Lanka
Final Report
15-8
15.1.2 Topography and Geology
(1) General geology of Project site Most of Sri Lanka's geology belongs to a part of the Earth’s crust known as the “craton37”, which is the Precambrian strata, and consists of metamorphic rocks originated in sedimentary rocks. The Precambrian is subdivided into three main and one subordinate lithotectonic units running north-northeasterly, namely, Highland complex (2-3 Ga), Vijayan and Wanni Complex (1-2 Ga), and Kadugannawa Complex (0.9- 1 Ga) on the northern-most area. The main lithotectonic units and foliation trend lines are illustrated in Figure 15-9. The Highland complex lies in the central part of Sri Lanka, where the Project site is located, and consists of granulite faces metaquartzites, metacarbonate and metapelitic gneisses. These strata around the Project site are significantly deformed by folding (refer to Figure 15-10). However, they run in parallel with other metasedimentary lithological units. In general, fresh and hard rocks are cropped out surrounding the Victoria Lake, where the lower dam is planned, but the rocks surrounding the upper dam site are weathered strongly.
Figure 15-9 Simplified Geological Map Figure 15-10 Folded Structures around
Project Site
37 A part of the Earth’s crust that has attained stability, and has been little deformed for a prolonged period (Glossary of
geology; American Geological Institute)
(Source: Encyclopedia of European and Asian regional geology; Chapman & Hall, 1997)

Project on Electricity Sector Master Plan Study in Democratic Socialist Republic of Sri Lanka
Final Report
15-9
(2) Lineaments38 The distribution of lineaments around the PSPP site is shown in Figure 15-11. There is one lineament near the outlet, which runs NNE with a 6km length (A). Four E-W trend lineaments (B to E) are in the eastern area of lineament A, and one of them (C) crosses the tailrace tunnel. There is no possibility of major fracture zones surrounding the Project site; however, the presence of lineaments suggests some hidden weak geological structure along and/or beneath them. Therefore, the geotechnical characteristics of lineament-C should be made clear based on suitable investigations such as geophysical exploration at the next FS study stage.
(Source: JICA Survey Team)
Figure 15-11 Lineaments around Victoria PSPP
(3) Specific topographic features There are two blocks of specific topography which evoke landslides at the higher and lower slope of the upper pond on the Google Earth image (refer to Figure 5-12). In the case that there is a natural pond at the top of the mountain, there are many cases in which the pond was formed by a landslide. For this project site, there is a high possibility that the concave terrain was naturally caused by differential erosion depending on the geological structure with an NS trend. However, the suggested block movement seems to be in an EW direction. According to the site reconnaissance results, though there is no evidence of active landslides, it may be a trace of some past landslide and stable at present. However, since there is a possibility of instability during and after the impounding of water, the soundness of the blocks is to be identified in the next FS study stage.
38 A linear topographic feature regional extent that is believed to reflect crustal structure (Hobbs et al., 1976)

Project on Electricity Sector Master Plan Study in Democratic Socialist Republic of Sri Lanka
Final Report
15-10
(Source: JICA Survey Team)
Figure 15-12 Specific Topography Evoking Landslides Surrounding Upper Pond Site
(4) Comprehensive evaluation According to the site reconnaissance survey results, the project is basically deemed to have fewer issues from the aspects of topography and geology except for the above mentioned two geological issues. It is suggested that appropriate investigations on the above issues and other necessary items should be conducted at the next FS study stage and the feasibility of the Project be assessed properly.

Project on Electricity Sector Master Plan Study in Democratic Socialist Republic of Sri Lanka
Final Report
15-11
15.1.3 Environmental and Social Considerations
(1) Natural environment The protection area of Victoria Randenigala Rantembe Sanctuary is designated around the Victoria Reservoir and its eastern area. However, each civil structure of the additional PSPP (except the lower dam and the outlet) is planned to be located outside the protection area (refer to Figure 15-13). Most land use in and around the planned site area consists of cultivated fields or artificial forest, which improved the previously felled natural forest. The main types of covered-vegetation in this area are as follows, and it has been deemed that no threatened species which should be absolutely protected by law or treaty are in the area according to interviews with the local people. However, it is anticipated that this area is likely being used as feeding fields by raptors, since soaring raptors were often seen over the project area during the site survey conducted in November 2016. Therefore, a detailed environmental survey needs to be carried out in the EIA. (a) Upper reservoir: There are some rows of pine trees (Caribbean pine, Mexican pine) more than 30 m high, some grass fields covered with wild-lawn-grass, and some shrubbery forests with middle sized trees of Djenitri, and Glabrous ternstroemia around the existing pond. There are natural forests of Mahogany close to the artificial forests of araucaria-aceae, and eucalyptus pine in part of hinterland of the existing pond; however, these trees will not be affected by the project, since they are far from the planned upper pond. (b) Lower reservoir: There are trees of some species of pine and genus of Gliricidia (Locust tree) which are artificially or naturally grown around the lakeside of the Victoria reservoir. These trees will not be affected by the project as the lower dam and the outlet will be constructed in the the Victoria reservoir.
(Source: JICA Survey Team-arranged based on CEB data) Figure 15-13 Correlation between Victoria Randenigala Rantembe Sanctuary and PSPP Site
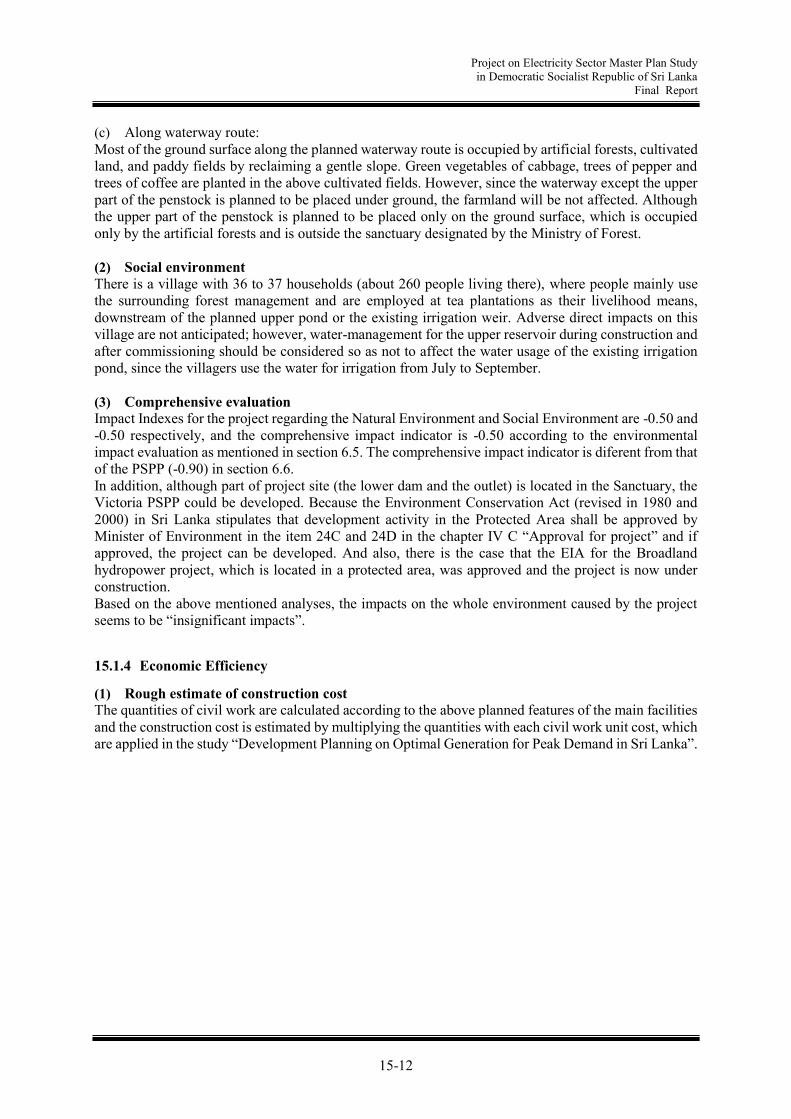
Project on Electricity Sector Master Plan Study in Democratic Socialist Republic of Sri Lanka
Final Report
15-12
(c) Along waterway route: Most of the ground surface along the planned waterway route is occupied by artificial forests, cultivated land, and paddy fields by reclaiming a gentle slope. Green vegetables of cabbage, trees of pepper and trees of coffee are planted in the above cultivated fields. However, since the waterway except the upper part of the penstock is planned to be placed under ground, the farmland will be not affected. Although the upper part of the penstock is planned to be placed only on the ground surface, which is occupied only by the artificial forests and is outside the sanctuary designated by the Ministry of Forest. (2) Social environment There is a village with 36 to 37 households (about 260 people living there), where people mainly use the surrounding forest management and are employed at tea plantations as their livelihood means, downstream of the planned upper pond or the existing irrigation weir. Adverse direct impacts on this village are not anticipated; however, water-management for the upper reservoir during construction and after commissioning should be considered so as not to affect the water usage of the existing irrigation pond, since the villagers use the water for irrigation from July to September. (3) Comprehensive evaluation Impact Indexes for the project regarding the Natural Environment and Social Environment are -0.50 and -0.50 respectively, and the comprehensive impact indicator is -0.50 according to the environmental impact evaluation as mentioned in section 6.5. The comprehensive impact indicator is diferent from that of the PSPP (-0.90) in section 6.6. In addition, although part of project site (the lower dam and the outlet) is located in the Sanctuary, the Victoria PSPP could be developed. Because the Environment Conservation Act (revised in 1980 and 2000) in Sri Lanka stipulates that development activity in the Protected Area shall be approved by Minister of Environment in the item 24C and 24D in the chapter IV C “Approval for project” and if approved, the project can be developed. And also, there is the case that the EIA for the Broadland hydropower project, which is located in a protected area, was approved and the project is now under construction. Based on the above mentioned analyses, the impacts on the whole environment caused by the project seems to be “insignificant impacts”.
15.1.4 Economic Efficiency
(1) Rough estimate of construction cost The quantities of civil work are calculated according to the above planned features of the main facilities and the construction cost is estimated by multiplying the quantities with each civil work unit cost, which are applied in the study “Development Planning on Optimal Generation for Peak Demand in Sri Lanka”.

Project on Electricity Sector Master Plan Study in Democratic Socialist Republic of Sri Lanka
Final Report
15-13
Table 15-3 Unit Costs for Civil Work
Item Unit Price Remarks Excavation Common USD/m3 15 for Open excavation Rock USD/m3 25 for Open excavation Tunnel USD/m3 80 for Horizontal Tunnel Penstock USD/m3 220 for Inclined Tunnel, Surge Shaft Underground USD/m3 115 for Powerhouse Cavern Embankment for fill type dams Rock USD/m3 18 Core USD/m3 23 Concrete Mass USD/m3 150 for RCC Dam Open USD/m3 220 for Structure (Intake, Outlet, etc.) Lining USD/m3 220 for Tunnel Lining USD/m3 275 for Vertical shaft (Surge tank) Filling Concrete USD/m3 100 for Around Steel Liner (Inclined or vertical shaft) Powerhouse USD/m3 220 for Sub-structure in Powerhouse Reinforcing Bar USD/ton 1,150 Hydro-Mechanical Gate USD/ton 3,825 Penstock USD/ton 5,500 Trash rack USD/ton 2,200
(Source: “Development Planning on Optimal Generation for Peak Demand in Sri Lanka”)
A rough estimate of the construction cost for Victoria PSPP is shown in Table 15-4.
Table 15-4 Rough Estimate of Construction Costs for Victoria PSPP
(Source: JICA Survey Team)
15.2 Appendix-2: Power Development Planning Simulation Results
Stage I Stage II Total Maha 3350MW×2 350MW×2 350MW×4 200MW×3×103 USD ×103 USD ×103 USD ×103 USD
1. Preparation and Land Acquisition 5,050 1,087 6,138 4,888 (1) Access Roads (2) Compensation & Resettlement (3) Camp & Facilities 5,050 1,087 6,138 4,888 3. Civil Works × 2%
2. Environmental Mitigation Cost 2,525 544 3,069 7,332 3. Civil Works × 1%3. Civil Works 252,518 54,368 306,886 244,3854. Hydromechanical Works 72,243 59,508 131,751 56,5165. Electro-Mechanical Equipment 138,450 138,450 276,900 193,4006. Transmission Line 1,000 1,000 2,000 3,900
471,786 254,957 726,743 510,4217. Administration and Engineering Services 70,768 38,244 109,011 76,563 Direct Cost × 15%8. Contingency 47,179 25,496 72,674 51,042 Direct Cost × 10%9. Interest During Construction 0 0 0 0 ∑(1,2,3,…,8)*0.4*i*T
Total Cost 589,732 318,696 908,428 638,026Installed Capacity 700 700 1400 600USD per kW 842 455 649 1,063
Item / Project Remarks
Direct Cost

Project on Electricity Sector Master Plan Study in Democratic Socialist Republic of Sri Lanka
Final Report
15-14
0.001 288 270 200
--- Environmental evaluation --- 20 USC/kWh 30 hours 10 5 20 10 0.4 0.1 1.0 0.002 0.001 100 0.8
6222 (0.57) (1.13) (0.56) (0.52) (0.90) 50,120 0.1301 50% 0.730304 39805 GWh CO2 3.666667 80% 20% 20% 30% 20% 10% 20% 20% 1009 946 175.2 3000 3000 1% 60% 1009
Scenario
No.LOLE LNG Coal Wind Solar PSPP LNG Coal PSPP Surplus
LNG
(kton)LNG Coal Surplus Fixed cost Fuel cost Total
Cost
USC/kWhScore kton-C kton-CO2 kg/kWh Score Total Score (LNG) (Coal) Total Score (LNG) (Coal) Total Score (LNG) (Coal) (PSPP) Total (Wind) (Solar)
Sub
TotalCost
Environ
ment
Energy
securityTotal
A-4F-011 22.37 1134 4065 504 500 0 1670 27573 0 1 284 4.2% 69.3% 0.0% 146213 198122 344335 8.65 9.5 7016.1 25726 0.646 0.0 (5.8) 7.8 1.6 0.0 (1.8) (1.8) 7.2 (0.7) (4.9) (5.6) 1.4 0.7 1.2 0.0 1.5 (1.0) (0.5) (1.5) 0.0 0.0 10.0 7.7 9.5 0.3 8.4 18.1 A-4F-011 22.2 11.2 20.9
A-6D-011 21.74 1710 3525 504 500 0 4297 24920 0 0 626 10.8% 62.6% 0.0% 141439 208164 349603 8.78 8.3 6638.4 24341 0.612 0.8 (5.5) 8.9 2.4 (0.7) (1.3) (2.1) 6.2 (0.5) (4.3) (4.8) 3.3 1.7 1.0 0.0 1.5 (1.0) (0.5) (1.5) 0.0 0.0 10.0 7.9 8.3 1.4 8.7 18.4 A-6D-011 21.0 12.8 21.5
A-4E-022 15.52 1134 3795 1004 1000 0 1523 25379 0 40 266 3.8% 63.8% 0.1% 141272 203345 344617 8.66 9.4 6468.6 23718 0.596 1.1 (6.0) 6.9 2.3 0.0 (1.5) (1.5) 7.9 (0.7) (4.4) (5.1) 2.6 0.6 1.1 0.0 1.7 (2.0) (1.0) (3.0) 0.0 (1.3) 8.8 7.4 9.4 1.3 7.8 18.4 A-4E-022 22.3 12.6 20.4
A-6C-022 16.18 1710 3255 1004 1000 0 3884 22957 0 0 563 9.8% 57.7% 0.0% 136498 211507 348005 8.74 8.7 6111.2 22408 0.563 1.9 (5.7) 8.0 3.1 (0.7) (1.1) (1.9) 6.9 (0.4) (3.8) (4.2) 4.6 1.5 0.9 0.0 2.4 (2.0) (1.0) (3.0) 0.0 (0.6) 9.5 8.0 8.7 2.4 8.9 19.9 A-6C-022 22.3 14.8 22.6
A-4D-023 23.84 1134 3525 1004 1500 0 1947 24229 0 5 317 4.9% 60.9% 0.0% 136332 205469 341801 8.59 10.0 6221.4 22812 0.573 1.7 (6.0) 7.1 2.7 0.0 (1.3) (1.3) 8.6 (0.7) (4.1) (4.8) 3.3 0.8 1.0 0.0 1.8 (2.0) (1.5) (3.5) 0.0 (1.7) 8.5 7.5 10.0 1.9 7.9 19.8 A-4D-023 23.9 14.1 21.3
A-4D-024 12.01 1134 3525 1004 2000 0 1594 23895 0 6 275 4.0% 60.0% 0.0% 137962 205536 343498 8.63 9.6 6107.5 22394 0.563 1.9 (6.2) 6.0 2.7 0.0 (1.3) (1.3) 8.6 (0.7) (4.0) (4.7) 3.4 0.6 1.0 0.0 1.6 (2.0) (2.0) (4.0) 0.0 (2.4) 7.9 7.1 9.6 1.9 7.3 18.8 A-4D-024 22.8 13.5 20.0
A-4D-033 15.02 1134 3525 1504 1500 0 1515 23108 0 142 266 3.8% 58.1% 0.4% 136332 209469 345801 8.69 9.1 5923.9 21721 0.546 2.3 (6.3) 6.0 3.0 0.0 (1.3) (1.3) 8.6 (0.7) (3.8) (4.5) 3.8 0.6 1.0 0.0 1.6 (3.0) (1.5) (4.5) 0.0 (2.9) 7.4 6.9 9.1 2.3 6.9 18.3 A-4D-033 22.0 13.7 19.3
A-4C-034 22.31 1134 3255 1504 2000 0 1957 21904 0 71 321 4.9% 55.0% 0.2% 131392 211607 342999 8.62 9.7 5665.7 20774 0.522 2.8 (6.2) 6.1 3.5 0.0 (1.1) (1.1) 9.3 (0.7) (3.5) (4.2) 4.6 0.8 0.9 0.0 1.7 (3.0) (2.0) (5.0) 0.0 (3.3) 7.0 7.0 9.7 2.9 7.1 19.7 A-4C-034 23.5 15.3 20.3
A-4C-044 14.66 1134 3255 2004 2000 0 1557 20838 0 295 271 3.9% 52.4% 0.7% 131392 216019 347411 8.73 8.8 5384.7 19744 0.496 3.4 (6.5) 5.1 3.7 0.0 (1.1) (1.1) 9.3 (0.7) (3.2) (4.0) 5.1 0.6 0.9 0.0 1.5 (4.0) (2.0) (6.0) 0.0 (4.5) 6.0 6.5 8.8 3.3 6.1 18.1 A-4C-044 21.4 14.8 18.2
A-4E-111 19.00 1134 3795 504 500 600 2079 27503 805 0 338 5.2% 69.1% 0.0% 146397 200865 347262 8.72 8.8 7016.2 25726 0.646 0.0 (6.0) 6.9 1.4 0.0 (1.5) (1.5) 7.9 (0.7) (4.9) (5.6) 1.6 0.8 1.1 3.0 1.5 (1.0) (0.5) (1.5) 0.0 0.0 10.0 7.9 8.8 0.0 8.7 17.5 A-4E-111 21.1 10.5 21.0
A-6C-111 20.71 1710 3255 504 500 600 5669 23684 264 0 823 14.2% 59.5% 0.0% 141623 215357 356980 8.97 6.7 6496.3 23820 0.598 1.1 (5.7) 8.0 2.5 (0.7) (1.1) (1.9) 6.9 (1.0) (4.0) (5.0) 2.9 2.0 0.9 1.5 1.5 (1.0) (0.5) (1.5) 0.0 0.0 10.0 8.0 6.7 1.5 8.8 17.0 A-6C-111 18.3 12.0 20.8
A-4D-122 17.86 1134 3525 1004 1000 600 2004 25057 471 0 324 5.0% 62.9% 0.0% 141456 209807 351263 8.82 8.0 6419 23536 0.591 1.3 (6.3) 6.0 2.2 0.0 (1.3) (1.3) 8.6 (0.7) (4.3) (5.0) 2.9 0.8 1.0 2.7 3.0 (2.0) (1.0) (3.0) 0.0 0.0 10.0 8.3 8.0 1.1 9.4 18.5 A-4D-122 20.7 12.5 22.4
A-6B-122 15.06 1710 2985 1004 1000 600 5307 21657 248 0 769 13.3% 54.4% 0.0% 136682 218989 355671 8.94 7.0 5961 21857 0.549 2.2 (6.0) 7.1 3.2 (0.7) (0.9) (1.6) 7.6 (0.9) (3.4) (4.3) 4.3 2.0 0.8 1.4 3.0 (2.0) (1.0) (3.0) 0.0 0.0 10.0 8.4 7.0 2.5 9.6 19.1 A-6B-122 19.9 14.4 22.9
A-4D-123 8.09 1134 3525 1004 1500 600 1649 24655 311 0 282 4.1% 61.9% 0.0% 143086 205051 348137 8.75 8.6 6290.2 23064 0.579 1.5 (6.5) 5.0 2.2 0.0 (1.3) (1.3) 8.6 (0.7) (4.2) (4.9) 3.0 0.7 1.0 1.8 3.4 (2.0) (1.5) (3.5) 0.0 (0.1) 9.9 8.3 8.6 1.1 9.4 19.2 A-4D-123 21.9 12.9 22.8
A-4C-124 16.24 1134 3255 1004 2000 600 2310 23288 272 0 366 5.8% 58.5% 0.0% 138146 208445 346591 8.71 9.0 6022.1 22081 0.555 2.1 (6.5) 5.1 2.7 0.0 (1.1) (1.1) 9.3 (0.6) (3.9) (4.5) 4.0 0.9 0.9 1.6 3.4 (2.0) (2.0) (4.0) 0.0 (0.6) 9.4 8.3 9.0 1.8 9.5 20.2 A-4C-124 22.9 14.3 23.5
A-4C-133 17.97 1134 3255 1504 1500 600 2097 22491 256 0 337 5.3% 56.5% 0.0% 136516 210952 347468 8.73 8.8 5815.7 21324 0.536 2.5 (6.5) 5.1 3.0 0.0 (1.1) (1.1) 9.3 (0.7) (3.7) (4.3) 4.3 0.8 0.9 1.5 3.2 (3.0) (1.5) (4.5) 0.0 (1.3) 8.8 8.0 8.8 2.3 8.9 20.0 A-4C-133 22.5 14.7 22.7
A-4C-134 8.83 1134 3255 1504 2000 600 1735 22158 238 0 293 4.4% 55.7% 0.0% 138146 210889 349035 8.77 8.4 5702.2 20908 0.525 2.8 (6.7) 4.0 3.0 0.0 (1.1) (1.1) 9.3 (0.7) (3.6) (4.3) 4.4 0.7 0.9 1.4 2.9 (3.0) (2.0) (5.0) 0.0 (2.1) 8.2 7.6 8.4 2.3 8.2 18.9 A-4C-134 21.5 14.1 21.2
A-4B-144 23.65 1134 2985 2004 2000 600 2222 19979 241 0 354 5.6% 50.2% 0.0% 131576 217222 348798 8.76 8.5 5230 19177 0.482 3.7 (6.7) 4.1 3.8 0.0 (0.9) (0.9) 10.0 (0.6) (3.0) (3.7) 5.7 0.9 0.8 1.4 3.1 (4.0) (2.0) (6.0) 0.0 (3.0) 7.4 7.6 8.5 3.4 8.1 20.0 A-4B-144 22.2 16.0 21.7
B-D3-044 14.80 3726 825 2004 2000 0 16510 5578 0 0 2301 41.5% 14.0% 0.0% 105259 279541 384800.5 9.67 0.7 3346.6 12271 0.308 7.7 (5.2) 10.0 8.2 (4.0) 0.0 (4.0) 0.0 (6.3) 0.0 (6.3) 0.0 4.8 0.0 0.0 4.8 (4.0) (2.0) (6.0) 0.0 (1.2) 8.9 5.4 0.7 9.3 4.0 14.1 B-D3-044 9.4 19.7 13.3
B-C3-046 16.20 3438 825 2004 3000 0 15134 5578 0 0 2126 38.0% 14.0% 0.0% 105001 276561 381561.8 9.59 1.4 3201 11737 0.295 8.0 (5.6) 8.6 8.1 (3.5) 0.0 (3.5) 1.5 (5.6) 0.0 (5.6) 1.5 4.4 0.0 0.0 4.4 (4.0) (3.0) (7.0) 0.0 (2.6) 7.7 5.2 1.4 9.3 3.8 14.5 B-C3-046 10.4 19.9 13.2
B-B3-048 22.68 3150 825 2004 4000 0 13750 5576 0 0 1000 34.5% 14.0% 0.0% 104742 273526 378268.1 9.50 2.1 3053.8 11197 0.281 8.3 (5.9) 7.2 8.1 (3.1) 0.0 (3.1) 3.0 (4.9) 0.0 (4.9) 3.0 4.0 0.0 0.0 4.0 (4.0) (3.5) (7.5) 0.0 (3.5) 6.9 5.3 2.1 9.3 4.0 15.4 B-B3-048 11.8 20.3 14.0
B-C3-064 23.32 3438 825 3004 2000 0 13230 5535 0 58 1852 33.2% 13.9% 0.1% 101740 274006 375746.5 9.44 2.7 2962 10861 0.273 8.5 (5.6) 8.5 8.5 (3.5) 0.0 (3.5) 1.5 (4.6) 0.0 (4.6) 3.6 4.4 0.0 0.0 4.4 (6.0) (2.0) (8.0) 0.0 (3.6) 6.8 5.1 2.7 9.8 3.6 16.0 B-C3-064 12.9 21.4 13.9
B-C3-066 8.18 3438 825 3004 3000 0 11830 5538 0 47 1670 29.7% 13.9% 0.1% 105001 270603 375603.8 9.44 2.7 2811.9 10310 0.259 8.8 (6.1) 6.4 8.3 (3.5) 0.0 (3.5) 1.5 (3.9) 0.0 (3.9) 5.1 4.4 0.0 0.0 4.4 (6.0) (3.0) (9.0) 0.0 (4.6) 5.9 4.9 2.7 9.6 3.1 15.4 B-C3-066 12.5 20.8 13.0
B-B3-068 12.38 3150 825 3004 4000 0 10485 5521 0 77 1496 26.3% 13.9% 0.2% 104742 267632 372374.1 9.35 3.4 2662.4 9762 0.245 9.1 (6.5) 5.0 8.3 (3.1) 0.0 (3.1) 3.0 (3.3) 0.0 (3.3) 6.6 4.0 0.0 0.0 4.0 (6.0) (3.5) (9.5) 0.0 (5.5) 5.1 5.0 3.4 9.6 3.3 16.3 B-B3-068 13.9 21.3 13.8
B-C3-084 13.68 3438 825 4004 2000 0 10456 5420 0 548 1473 26.3% 13.6% 1.4% 101740 272808 374548.5 9.41 2.9 2618.1 9600 0.241 9.2 (6.2) 6.3 8.6 (3.5) 0.0 (3.5) 1.5 (3.3) 0.0 (3.3) 6.6 4.1 0.0 0.0 4.1 (7.0) (2.0) (9.0) (0.4) (5.2) 5.3 4.8 2.9 10.0 3.1 16.0 B-C3-084 13.1 21.6 13.3
B-B3-086 14.45 3150 825 4004 3000 0 9352 5379 0 794 1327 23.5% 13.5% 2.0% 101482 271645 373126.8 9.37 3.3 2486.3 9116 0.229 9.5 (6.5) 4.9 8.6 (3.1) 0.0 (3.1) 3.0 (2.7) 0.0 (2.7) 7.8 3.7 0.0 0.0 3.7 (7.0) (3.0) (10.0) (1.0) (7.3) 3.5 4.3 3.3 9.9 2.0 15.2 B-B3-086 13.0 21.0 11.6
B-A3-088 19.47 2862 825 4004 4000 0 8440 5308 0 1172 1206 21.2% 13.3% 2.9% 101222 271942 373164.1 9.37 3.2 2368.6 8685 0.218 9.7 (6.9) 3.5 8.5 (2.6) 0.0 (2.6) 4.5 (2.2) 0.0 (2.2) 8.8 3.3 0.0 0.0 3.3 (7.0) (3.5) (10.5) (1.9) (9.1) 1.9 3.8 3.2 9.8 1.2 14.2 B-A3-088 12.4 20.3 9.9
B-93-08A 24.09 2574 825 4004 5000 0 7583 5263 0 1677 1093 19.1% 13.2% 4.2% 100963 273009 373972.4 9.40 3.1 2263 8298 0.208 10.0 (7.2) 2.1 8.4 (2.1) 0.0 (2.1) 6.0 (1.8) 0.0 (1.8) 9.8 3.0 0.0 0.0 3.0 (7.0) (4.0) (11.0) (3.2) (11.2) 0.0 3.2 3.1 9.7 0.0 12.7 B-93-08A 11.3 19.3 7.6
B-C3-144 22.18 3438 825 2004 2000 600 16523 5577 17 0 2304 41.5% 14.0% 0.0% 108494 279717 388211.5 9.75 0.0 3349.1 12280 0.309 7.7 (5.6) 8.5 7.9 (3.5) 0.0 (3.5) 1.5 (6.3) 0.0 (6.3) 0.0 4.4 0.0 0.1 4.5 (4.0) (2.0) (6.0) 0.0 (1.5) 8.7 5.5 0.0 8.9 4.3 13.2 B-C3-144 7.9 18.7 13.1
B-B3-146 22.34 3150 825 2004 3000 600 15142 5577 7 0 2129 38.0% 14.0% 0.0% 108236 276778 385013.8 9.67 0.7 3203.5 11746 0.295 8.0 (5.9) 7.1 7.8 (3.1) 0.0 (3.1) 3.0 (5.6) 0.0 (5.6) 1.5 4.0 0.0 0.0 4.0 (4.0) (3.0) (7.0) 0.0 (3.0) 7.4 5.3 0.7 8.9 4.0 13.5 B-B3-146 8.9 18.8 12.9
B-B3-148 12.40 3150 825 2004 4000 600 13770 5578 13 0 1952 34.6% 14.0% 0.0% 111496 273639 385135.1 9.68 0.7 3056.2 11206 0.282 8.3 (6.5) 5.1 7.7 (3.1) 0.0 (3.1) 3.0 (4.9) 0.0 (4.9) 3.0 4.0 0.0 0.1 4.1 (4.0) (3.5) (7.5) 0.0 (3.4) 6.9 5.4 0.7 8.7 4.1 13.4 B-B3-148 8.8 18.4 12.9
B-C3-164 10.59 3438 825 3004 2000 600 13160 5576 70 0 1840 33.1% 14.0% 0.0% 108494 273463 381957.5 9.60 1.3 2962.9 10864 0.273 8.5 (6.2) 6.3 8.1 (3.5) 0.0 (3.5) 1.5 (4.6) 0.0 (4.6) 3.7 4.4 0.0 0.4 4.8 (6.0) (2.0) (8.0) 0.0 (3.2) 7.1 5.3 1.3 9.2 4.0 14.5 B-C3-164 10.3 19.8 13.5
B-B3-166 10.64 3150 825 3004 3000 600 11780 5576 49 0 1666 29.6% 14.0% 0.0% 108236 270464 378699.8 9.51 2.0 2818.1 10333 0.260 8.8 (6.5) 5.0 8.0 (3.1) 0.0 (3.1) 3.0 (3.9) 0.0 (3.9) 5.2 4.0 0.0 0.3 4.3 (6.0) (3.0) (9.0) 0.0 (4.7) 5.8 5.1 2.0 9.2 3.6 14.8 B-B3-166 11.3 19.9 13.2
B-A3-168 19.47 2862 825 3004 4000 600 10418 5572 74 0 1488 26.2% 14.0% 0.0% 107977 267314 375291.1 9.43 2.8 2668.6 9785 0.246 9.1 (6.9) 3.6 8.0 (2.6) 0.0 (2.6) 4.5 (3.2) 0.0 (3.2) 6.7 3.6 0.0 0.4 4.0 (6.0) (3.5) (9.5) 0.0 (5.5) 5.1 5.3 2.8 9.1 3.9 15.9 B-A3-168 12.9 20.5 14.2
B-B3-184 17.20 3150 825 4004 2000 600 10222 5432 160 256 1442 25.7% 13.6% 0.6% 104975 270836 375811.5 9.44 2.7 2595.7 9518 0.239 9.3 (6.5) 4.8 8.4 (3.1) 0.0 (3.1) 3.0 (3.1) 0.0 (3.1) 6.9 4.0 0.0 0.9 4.9 (7.0) (2.0) (9.0) 0.0 (4.1) 6.4 5.8 2.7 9.6 4.8 17.2 B-B3-184 13.5 21.9 16.1
B-A3-186 20.29 2862 825 4004 3000 600 9148 5364 93 519 1304 23.0% 13.5% 1.3% 104717 269977 374693.8 9.41 2.9 2463.8 9034 0.227 9.5 (6.9) 3.4 8.3 (2.6) 0.0 (2.6) 4.5 (2.6) 0.0 (2.6) 8.1 3.6 0.0 0.5 4.1 (7.0) (3.0) (10.0) (0.3) (6.2) 4.5 5.2 2.9 9.6 3.8 16.2 B-A3-186 13.2 21.2 14.3
B-A3-188 11.45 2862 825 4004 4000 600 8260 5309 51 974 1183 20.8% 13.3% 2.4% 107977 270494 378471.1 9.51 2.1 2349.5 8615 0.216 9.8 (7.4) 1.4 8.1 (2.6) 0.0 (2.6) 4.5 (2.2) 0.0 (2.2) 9.0 3.3 0.0 0.3 3.6 (7.0) (3.5) (10.5) (1.4) (8.4) 2.5 4.2 2.1 9.3 2.0 13.3 B-A3-188 10.5 19.1 10.3
B-93-18A 16.15 2574 825 4004 5000 600 7387 5263 103 1410 1069 18.6% 13.2% 3.5% 107718 271391 379109.4 9.52 2.0 2243.1 8225 0.207 10.0 (7.8) 0.0 8.0 (2.1) 0.0 (2.1) 6.0 (1.7) 0.0 (1.7) 10.0 2.9 0.0 0.6 3.5 (7.0) (4.0) (11.0) (2.5) (10.0) 1.1 3.8 2.0 9.1 1.2 12.3 B-93-18A 9.8 18.4 8.9
C-98-033 11.30 2574 2175 1504 1500 0 8895 15562 0 0 1253 22.3% 39.1% 0.0% 122404 239536 361940.3 9.09 5.7 4889.4 17928 0.450 4.5 (5.5) 8.7 5.3 (2.1) (0.2) (2.4) 5.2 (2.5) (1.9) (4.4) 4.2 3.2 0.5 0.0 3.7 (3.0) (1.5) (4.5) 0.0 (0.8) 9.3 7.4 5.7 5.4 7.9 19.0 C-98-033 18.2 17.9 20.8
C-7A-033 13.20 1998 2715 1504 1500 0 5186 19260 0 2 748 13.0% 48.4% 0.0% 128507 223213 351720.3 8.84 7.9 5368.2 19683 0.494 3.5 (5.8) 7.6 4.3 (1.2) (0.7) (1.9) 6.8 (0.9) (2.8) (3.7) 5.7 2.1 0.7 0.0 2.8 (3.0) (1.5) (4.5) 0.0 (1.8) 8.4 7.6 7.9 4.0 8.1 19.9 C-7A-033 21.4 16.8 21.7
C-5C-033 12.80 1422 3255 1504 1500 0 2315 22223 0 71 360 5.8% 55.8% 0.2% 134609 211312 345921.3 8.69 9.1 5771.6 21163 0.532 2.6 (6.1) 6.5 3.4 (0.3) (1.1) (1.4) 8.4 (0.6) (3.6) (4.2) 4.5 0.9 0.9 0.0 1.8 (3.0) (1.5) (4.5) 0.0 (2.7) 7.6 7.1 9.1 2.8 7.3 19.2 C-5C-033 22.5 14.9 20.3
C-97-044 16.56 2574 1905 2004 2000 0 8574 13506 0 1 1212 21.5% 33.9% 0.0% 117464 243874 361338.5 9.08 5.8 4358.8 15982 0.402 5.6 (5.8) 7.8 6.0 (2.1) (0.0) (2.2) 5.9 (2.3) (1.4) (3.7) 5.7 3.2 0.4 0.0 3.6 (4.0) (2.0) (6.0) 0.0 (2.4) 7.9 7.0 5.8 6.4 7.1 19.3 C-97-044 18.5 19.2 20.1
C-79-044 15.77 1998 2445 2004 2000 0 4922 17201 0 51 717 12.4% 43.2% 0.1% 123566 228199 351765.5 8.84 7.9 4845.2 17766 0.446 4.5 (6.1) 6.7 5.0 (1.2) (0.5) (1.7) 7.5 (0.8) (2.3) (3.1) 7.0 2.0 0.6 0.0 2.6 (4.0) (2.0) (6.0) 0.0 (3.5) 6.9 7.1 7.9 5.0 7.2 20.0 C-79-044 21.4 17.9 20.6
C-5B-044 16.18 1422 2985 2004 2000 0 2379 19898 0 188 372 6.0% 50.0% 0.5% 129669 218056 347725.5 8.74 8.7 5223.9 19154 0.481 3.8 (6.3) 5.6 4.1 (0.3) (0.9) (1.2) 9.1 (0.6) (3.0) (3.6) 5.8 0.9 0.8 0.0 1.7 (4.0) (2.0) (6.0) 0.0 (4.3) 6.2 6.7 8.7 3.8 6.5 19.0 C-5B-044 21.9 16.0 19.2
C-96-055 19.76 2574 1635 2504 2500 0 8283 11458 0 42 1177 20.8% 28.8% 0.1% 112524 248658 361181.6 9.07 5.8 3834.6 14060 0.353 6.7 (6.0) 6.9 6.7 (2.1) 0.0 (2.1) 6.0 (2.2) (0.9) (3.0) 7.1 3.2 0.3 0.0 3.5 (5.0) (2.5) (7.5) 0.0 (4.0) 6.4 6.5 5.8 7.4 6.1 19.3 C-96-055 18.6 20.4 18.9
C-78-055 21.56 1998 2175 2504 2500 0 4857 14990 0 156 714 12.2% 37.7% 0.4% 118627 234377 353003.6 8.87 7.6 4307.5 15794 0.397 5.7 (6.3) 5.8 5.7 (1.2) (0.2) (1.5) 8.2 (0.7) (1.8) (2.5) 8.3 1.9 0.5 0.0 2.4 (5.0) (2.5) (7.5) 0.0 (5.1) 5.5 6.6 7.6 6.0 6.3 19.8 C-78-055 21.0 19.0 19.4
C-5A-055 20.67 1422 2715 2504 2500 0 2485 17577 0 351 389 6.2% 44.2% 0.9% 124730 225225 349954.6 8.79 8.2 4685.1 17179 0.432 4.9 (6.6) 4.7 4.8 (0.3) (0.7) (1.0) 9.8 (0.6) (2.4) (3.0) 7.1 1.0 0.7 0.0 1.7 (5.0) (2.5) (7.5) 0.0 (5.8) 4.8 6.3 8.2 4.8 5.7 18.7 C-5A-055 21.1 17.0 18.1
C-88-133 16.46 2286 2175 1504 1500 600 8868 15635 63 0 1252 22.3% 39.3% 0.0% 125639 239786 365425.3 9.18 4.9 4906.2 17989 0.452 4.4 (5.9) 7.3 5.0 (1.7) (0.2) (1.9) 6.7 (2.5) (1.9) (4.4) 4.2 2.8 0.5 0.4 3.7 (3.0) (1.5) (4.5) 0.0 (0.8) 9.2 7.7 4.9 5.0 8.4 18.3 C-88-133 16.9 16.9 21.0
C-6A-133 17.51 1710 2715 1504 1500 600 4963 19626 262 0 722 12.5% 49.3% 0.0% 131742 223069 354811.3 8.91 7.2 5430.2 19911 0.500 3.3 (6.2) 6.2 3.9 (0.7) (0.7) (1.4) 8.3 (0.8) (2.9) (3.7) 5.7 2.0 0.7 1.5 4.2 (3.0) (1.5) (4.5) 0.0 (0.3) 9.7 8.6 7.2 3.5 10.0 20.7 C-6A-133 21.0 16.6 24.4
C-4C-133 17.97 1134 3255 1504 1500 600 2097 22491 256 0 337 5.3% 56.5% 0.0% 136516 210952 347468.3 8.73 8.8 5815.7 21324 0.536 2.5 (6.5) 5.1 3.0 0.0 (1.1) (1.1) 9.3 (0.7) (3.7) (4.3) 4.3 0.8 0.9 1.5 3.2 (3.0) (1.5) (4.5) 0.0 (1.3) 8.8 8.0 8.8 2.3 8.9 20.0 C-4C-133 22.5 14.7 22.7
C-87-144 20.96 2286 1905 2004 2000 600 8507 13623 87 0 1203 21.4% 34.2% 0.0% 120699 243806 364505.5 9.16 5.1 4378.5 16055 0.403 5.5 (6.2) 6.3 5.7 (1.7) (0.0) (1.7) 7.4 (2.3) (1.4) (3.7) 5.7 2.8 0.4 0.5 3.7 (4.0) (2.0) (6.0) 0.0 (2.3) 7.9 7.4 5.1 5.9 7.7 18.8 C-87-144 17.4 18.4 20.6
C-69-144 22.47 1710 2445 2004 2000 600 4705 17501 256 0 691 11.8% 44.0% 0.0% 126802 227760 354562.5 8.91 7.3 4890.9 17933 0.451 4.5 (6.4) 5.2 4.6 (0.7) (0.5) (1.2) 9.0 (0.7) (2.4) (3.1) 7.0 1.9 0.6 1.5 3.9 (4.0) (2.0) (6.0) 0.0 (2.1) 8.1 8.1 7.3 4.5 9.1 20.8 C-69-144 21.2 17.8 23.3
C-4B-144 23.65 1134 2985 2004 2000 600 2222 19979 241 0 354 5.6% 50.2% 0.0% 131576 217222 348798.5 8.76 8.5 5230 19177 0.482 3.7 (6.7) 4.1 3.8 0.0 (0.9) (0.9) 10.0 (0.6) (3.0) (3.7) 5.7 0.9 0.8 1.4 3.1 (4.0) (2.0) (6.0) 0.0 (3.0) 7.4 7.6 8.5 3.4 8.1 20.0 C-4B-144 22.2 16.0 21.7
C-96-155 8.80 2574 1635 2504 2500 600 8169 11607 146 0 1165 20.5% 29.2% 0.0% 119279 248530 367808.6 9.24 4.4 3859.3 14151 0.356 6.6 (6.6) 4.8 6.2 (2.1) 0.0 (2.1) 6.0 (2.1) (0.9) (3.0) 7.1 3.2 0.3 0.8 4.3 (5.0) (2.5) (7.5) 0.0 (3.2) 7.2 6.9 4.4 6.7 6.9 18.0 C-96-155 16.1 18.9 19.1
C-78-155 8.28 1998 2175 2504 2500 600 4821 14957 148 0 708 12.1% 37.6% 0.0% 125381 233789 359169.6 9.02 6.3 4294.3 15746 0.396 5.7 (6.8) 3.7 5.3 (1.2) (0.2) (1.5) 8.2 (0.7) (1.8) (2.5) 8.3 1.9 0.5 0.8 3.3 (5.0) (2.5) (7.5) 0.0 (4.3) 6.2 7.0 6.3 5.4 7.1 18.8 C-78-155 18.8 17.8 19.8
C-5A-155 8.78 1422 2715 2504 2500 600 2403 17442 286 4 380 6.0% 43.8% 0.0% 131484 224038 355521.6 8.93 7.0 4651.1 17054 0.428 5.0 (7.1) 2.6 4.5 (0.3) (0.7) (1.0) 9.8 (0.6) (2.4) (3.0) 7.2 1.0 0.7 1.6 3.3 (5.0) (2.5) (7.5) 0.0 (4.2) 6.2 7.1 7.0 4.3 7.3 18.6 C-5A-155 19.6 16.3 19.9
O-5B-133 15.61 1422 2985 1504 1500 600 3252 21358 313 0 489 8.2% 53.7% 0.0% 134793 215675 350468.3 8.80 8.1 5657.9 20746 0.521 2.8 (6.3) 5.6 3.4 (0.3) (0.9) (1.2) 9.1 (0.5) (3.4) (3.9) 5.3 1.3 0.8 1.8 3.9 (3.0) (1.5) (4.5) 0.0 (0.6) 9.4 8.5 8.1 2.8 9.9 20.8 O-5B-133 22.2 15.8 24.3
O-78-144 20.62 1998 2175 2004 2000 600 6558 15618 192 0 943 16.5% 39.2% 0.0% 123750 235762 359512.5 9.03 6.2 4645 17032 0.428 5.0 (6.3) 5.8 5.1 (1.2) (0.2) (1.5) 8.2 (1.4) (1.9) (3.3) 6.6 2.4 0.5 1.1 4.0 (4.0) (2.0) (6.0) 0.0 (2.0) 8.2 7.9 6.2 5.2 8.7 20.0 O-78-144 19.4 18.2 22.4
O-69-144 22.47 1710 2445 2004 2000 600 4705 17501 256 0 691 11.8% 44.0% 0.0% 126802 227760 354562.5 8.91 7.3 4890.9 17933 0.451 4.5 (6.4) 5.2 4.6 (0.7) (0.5) (1.2) 9.0 (0.7) (2.4) (3.1) 7.0 1.9 0.6 1.5 3.9 (4.0) (2.0) (6.0) 0.0 (2.1) 8.1 8.1 7.3 4.5 9.1 20.8 O-69-144 21.2 17.8 23.3
O-5A-144 23.06 1422 2715 2004 2000 600 3370 18776 121 0 507 8.5% 47.2% 0.0% 129853 221595 351448.5 8.83 7.9 5054 18531 0.466 4.1 (6.6) 4.7 4.2 (0.3) (0.7) (1.0) 9.8 (0.5) (2.7) (3.2) 6.7 1.3 0.7 0.7 2.7 (4.0) (2.0) (6.0) 0.0 (3.3) 7.1 7.5 7.9 3.9 8.1 19.9 O-5A-144 21.5 16.7 21.6
O-79-143 11.43 1998 2445 2004 1500 600 5356 17555 296 0 776 13.5% 44.1% 0.0% 128691 229320 358011.3 8.99 6.5 4974.6 18240 0.458 4.3 (6.3) 5.6 4.5 (1.2) (0.5) (1.7) 7.5 (0.9) (2.4) (3.3) 6.5 2.1 0.6 1.7 4.4 (4.0) (1.5) (5.5) 0.0 (1.1) 9.0 8.2 6.5 4.4 9.3 20.1 O-79-143 19.9 17.3 23.2
O-6A-143 10.15 1710 2715 2004 1500 600 3786 19077 188 0 562 9.5% 47.9% 0.0% 131742 222285 354027.3 8.89 7.4 5171.2 18961 0.476 3.9 (6.5) 5.1 4.1 (0.7) (0.7) (1.4) 8.3 (0.4) (2.8) (3.2) 6.7 1.5 0.7 1.1 3.3 (4.0) (1.5) (5.5) 0.0 (2.2) 8.0 7.8 7.4 3.8 8.5 19.6 O-6A-143 20.6 16.3 22.0
O-5B-143 9.44 1422 2985 2004 1500 600 2629 20261 243 0 407 6.6% 50.9% 0.0% 134793 217657 352450.3 8.85 7.7 5338 19573 0.492 3.5 (6.6) 4.5 3.7 (0.3) (0.9) (1.2) 9.1 (0.6) (3.1) (3.7) 5.7 1.0 0.8 1.4 3.2 (4.0) (1.5) (5.5) 0.0 (2.3) 8.0 7.7 7.7 3.2 8.4 19.3 O-5B-143 20.8 15.5 21.7
O-79-134 9.16 1998 2445 1504 2000 600 6210 17643 153 0 897 15.6% 44.3% 0.0% 130321 229857 360178.5 9.05 6.0 5096.4 18687 0.469 4.0 (6.3) 5.7 4.4 (1.2) (0.5) (1.7) 7.5 (1.2) (2.4) (3.7) 5.8 2.4 0.6 0.9 3.9 (3.0) (2.0) (5.0) 0.0 (1.1) 9.0 8.0 6.0 4.1 9.0 19.1 O-79-134 18.7 16.4 22.2
O-6A-134 8.98 1710 2715 1504 2000 600 4320 19565 232 0 634 10.9% 49.2% 0.0% 133372 221260 354632.5 8.91 7.2 5342 19587 0.492 3.5 (6.5) 5.1 3.8 (0.7) (0.7) (1.4) 8.3 (0.5) (2.9) (3.5) 6.2 1.7 0.7 1.3 3.7 (3.0) (2.0) (5.0) 0.0 (1.3) 8.9 8.2 7.2 3.4 9.3 19.9 O-6A-134 20.6 16.0 23.1
O-5B-134 9.68 1422 2985 1504 2000 600 2810 21044 155 0 432 7.1% 52.9% 0.0% 136423 214813 351236.5 8.82 8.0 5537.7 20305 0.510 3.1 (6.6) 4.6 3.4 (0.3) (0.9) (1.2) 9.1 (0.6) (3.3) (3.9) 5.3 1.1 0.8 0.9 2.8 (3.0) (2.0) (5.0) 0.0 (2.2) 8.0 7.7 8.0 2.8 8.3 19.1 O-5B-134 21.0 14.8 21.5
O-87-154 12.27 2286 1905 2504 2000 600 6946 13560 248 0 990 17.5% 34.1% 0.0% 120699 241631 362330.5 9.10 5.6 4186.3 15350 0.386 5.9 (6.4) 5.2 5.8 (1.7) (0.0) (1.7) 7.4 (1.5) (1.4) (2.9) 7.4 2.8 0.4 1.4 4.6 (5.0) (2.0) (7.0) 0.0 (2.4) 7.8 7.7 5.6 6.1 8.3 19.9 O-87-154 18.6 19.3 21.9
O-78-154 14.84 1998 2175 2504 2000 600 5264 15213 172 0 766 13.2% 38.2% 0.0% 123750 234450 358200.5 9.00 6.5 4403.8 16147 0.406 5.5 (6.6) 4.7 5.3 (1.2) (0.2) (1.5) 8.2 (0.9) (1.8) (2.7) 7.8 2.1 0.5 1.0 3.6 (5.0) (2.0) (7.0) 0.0 (3.4) 6.9 7.4 6.5 5.4 7.7 19.6 O-78-154 19.5 18.3 21.0
O-69-154 13.90 1710 2445 2504 2000 600 3976 16499 172 0 590 10.0% 41.4% 0.0% 126802 228884 355686.5 8.94 7.0 4576.3 16780 0.422 5.1 (6.7) 4.1 4.9 (0.7) (0.5) (1.2) 9.0 (0.4) (2.1) (2.6) 8.2 1.6 0.6 1.0 3.2 (5.0) (2.0) (7.0) 0.0 (3.9) 6.6 7.4 7.0 4.9 7.7 19.6 O-69-154 20.2 17.6 21.1
O-87-145 13.28 2286 1905 2004 2500 600 7825 13623 93 0 1119 19.7% 34.2% 0.0% 122330 242567 364896.6 9.17 5.0 4309.3 15801 0.397 5.7 (6.4) 5.3 5.6 (1.7) (0.0) (1.7) 7.4 (1.9) (1.4) (3.4) 6.4 2.8 0.4 0.5 3.7 (4.0) (2.5) (6.5) 0.0 (2.8) 7.5 7.3 5.0 5.8 7.6 18.4 O-87-145 17.1 18.0 20.1
O-78-145 13.39 1998 2175 2004 2500 600 5879 15602 169 0 852 14.8% 39.2% 0.0% 125381 233999 359379.6 9.03 6.2 4565.2 16739 0.421 5.1 (6.6) 4.8 5.1 (1.2) (0.2) (1.5) 8.2 (1.1) (1.9) (3.0) 7.1 2.3 0.5 1.0 3.8 (4.0) (2.5) (6.5) 0.0 (2.7) 7.6 7.6 6.2 5.1 8.2 19.5 O-78-145 19.1 17.8 21.5
O-69-145 13.91 1710 2445 2004 2500 600 4205 17255 130 0 624 10.6% 43.3% 0.0% 128433 226594 355026.6 8.92 7.2 4778.7 17522 0.440 4.7 (6.7) 4.2 4.6 (0.7) (0.5) (1.2) 9.0 (0.5) (2.3) (2.8) 7.6 1.7 0.6 0.7 3.0 (4.0) (2.5) (6.5) 0.0 (3.5) 6.9 7.4 7.2 4.4 7.9 19.5 O-69-145 20.3 17.0 21.1
9.75 0.6 (5.2) (0.9) (1.7) 0.0 10.0 8.6 8.6
8.59 0.2 (7.8) (4.0) (6.3) (11.2) 0.0 1.4 3.2
Generation fluctuation
Energy
security
Capacity (MW) Energy (GWh) kWh (%) Generation cost CO2 emission Regional impactEnviron
ment
Fuel procurement Eco: 60%
Env: 20%
Sec: 20%
Eco: 20%
Env: 60%
Sec: 20%
Eco: 20%
Env: 20%
Sec: 60%
Fuel Price Increase Frequency control Gene- Fluctuation
Surplus Total Score

Project on Electricity Sector Master Plan Study in Democratic Socialist Republic of Sri Lanka
Final Report
15-15
Scenario A: Summary
Demand
(MW)
Demand
(GWh)Year LOLE LNG Coal Wind Solar
Back-up
GTPSPP LNG Coal PSPP Surplus
LNG
(kton)LNG Coal Surplus Fixed cost Fuel cost Total
Cost
USC/kWhkton-CO2 kg/kWh
2369 13912 2016 16.87 0 825 124 0 0 0 5540 0 0 0 0.0% 39.8% 0.0% 52095 85696 137791 9.9 6755 0.486
2491 14782 2017 12.45 0 825 134 40 0 0 5577 0 0 0 0.0% 37.7% 0.0% 54263 103207 157470 10.7 7172 0.485
2639 15811 2018 24.71 0 825 184 60 0 0 5576 0 0 0 0.0% 35.3% 0.0% 57322 114328 171650 10.9 7293 0.461
2798 16911 2019 16.42 0 825 234 80 0 0 5578 0 0 0 0.0% 33.0% 0.0% 61615 143279 204894 12.1 7701 0.455
2955 18010 2020 9.03 0 825 264 100 0 0 5578 0 0 0 0.0% 31.0% 0.0% 66398 171071 237469 13.2 8105 0.450
3112 19108 2021 26.41 576 825 294 140 0 3961 5578 0 0 550 20.7% 29.2% 0.0% 66398 130862 197260 10.3 8136 0.426
3267 20205 2022 23.38 1007 1095 324 180 0 4421 7571 0 0 642 21.9% 37.5% 0.0% 72834 97143 169977 8.4 8976 0.444
3422 21302 2023 21.52 1170 1365 354 220 0 3466 9402 0 0 515 16.3% 44.1% 0.0% 78081 100561 178642 8.4 10209 0.479
3577 22397 2024 11.80 1170 1635 384 260 0 2666 11073 0 0 401 11.9% 49.4% 0.0% 84651 103901 188552 8.4 11355 0.507
3730 23492 2025 9.45 1170 1905 414 300 0 1947 12571 0 16 315 8.3% 53.5% 0.1% 90742 109179 199921 8.5 12447 0.530
3883 24586 2026 26.42 1170 1905 444 350 0 2519 12835 0 1 383 10.2% 52.2% 0.0% 90742 116966 207708 8.4 12877 0.524
4035 25679 2027 13.25 1170 2175 474 400 0 1909 14322 0 15 311 7.4% 55.8% 0.1% 97313 121966 219279 8.5 14003 0.545
4187 26771 2028 15.43 1170 2175 504 450 0 2421 14646 0 1 372 9.0% 54.7% 0.0% 97313 129755 227068 8.5 14459 0.540
4333 27862 2029 6.15 1170 2445 534 500 0 1784 16147 0 6 296 6.4% 58.0% 0.0% 103883 134621 238504 8.6 15583 0.559
4505 28952 2030 11.36 1170 2445 564 550 0 2217 16447 0 1 348 7.7% 56.8% 0.0% 104307 143002 247309 8.5 15991 0.552
4677 30041 2031 25.26 1170 2445 594 600 0 2557 16970 0 0 388 8.5% 56.5% 0.0% 104307 149646 253953 8.5 16555 0.551
4849 31130 2032 8.93 1170 2715 624 700 100 0 1868 18503 0 2 307 6.0% 59.4% 0.0% 111529 153829 265358 8.5 17687 0.568
5021 32217 2033 5.79 1134 2985 654 800 100 0 1426 19772 0 14 255 4.4% 61.4% 0.0% 120068 158647 278715 8.7 18680 0.580
5193 33304 2034 11.07 1134 2985 704 900 200 0 1691 20229 0 4 286 5.1% 60.7% 0.0% 120720 165636 286356 8.6 19166 0.575
5365 34390 2035 18.08 1134 2985 754 1000 200 0 2007 20526 0 2 324 5.8% 59.7% 0.0% 121143 173378 294521 8.6 19536 0.568
5536 35475 2036 8.40 1134 3255 804 1100 300 0 1511 21814 0 12 265 4.3% 61.5% 0.0% 128365 178200 306565 8.6 20523 0.579
5708 36559 2037 15.18 1134 3255 854 1200 300 0 1814 22231 0 5 301 5.0% 60.8% 0.0% 128365 185344 313709 8.6 20990 0.574
5879 37642 2038 7.33 1134 3525 904 1300 400 0 1409 23385 0 27 253 3.7% 62.1% 0.1% 135588 190645 326233 8.7 21901 0.582
6051 38724 2039 12.73 1134 3525 954 1400 400 0 1663 23888 0 11 283 4.3% 61.7% 0.0% 135256 197518 332774 8.6 22419 0.579
6222 39805 2040 23.47 1134 3525 1004 1500 500 0 1945 24215 0 6 316 4.9% 60.8% 0.0% 136332 205221 341553 8.6 22799 0.573
Capacity (MW) Energy (GWh) kWh (%) Generation cost CO2 emission
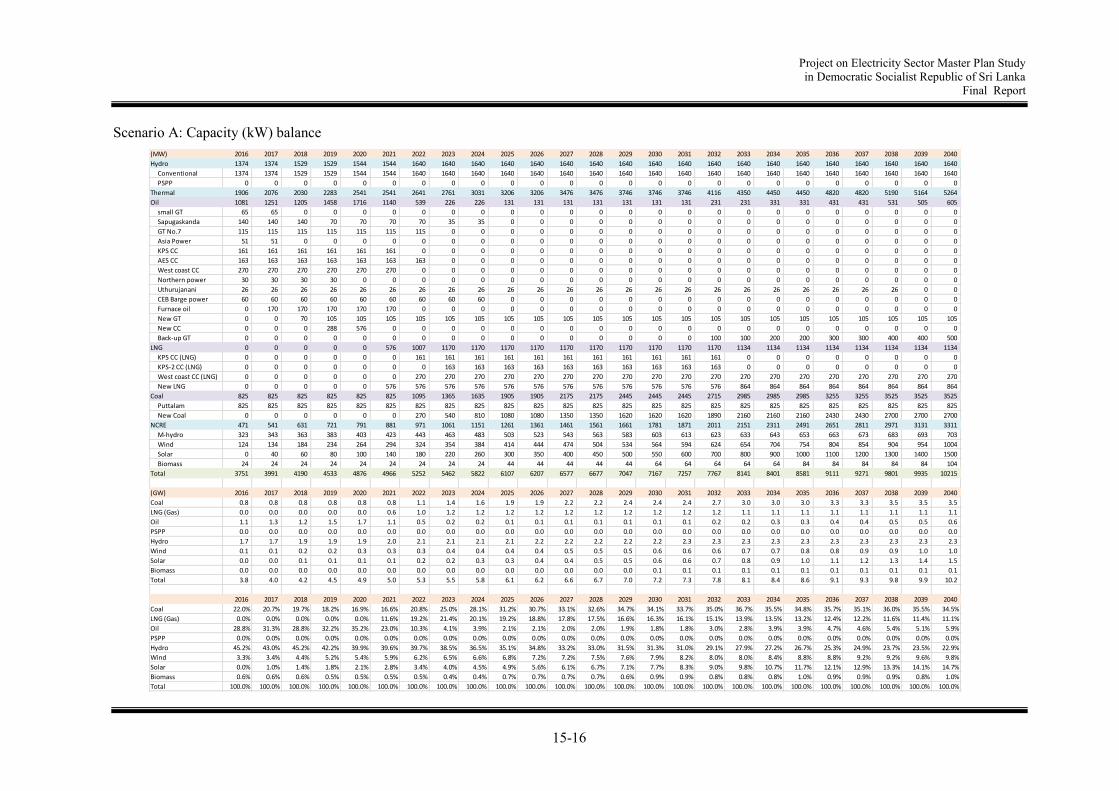
Project on Electricity Sector Master Plan Study in Democratic Socialist Republic of Sri Lanka
Final Report
15-16
Scenario A: Capacity (kW) balance
(MW) 2016 2017 2018 2019 2020 2021 2022 2023 2024 2025 2026 2027 2028 2029 2030 2031 2032 2033 2034 2035 2036 2037 2038 2039 2040
Hydro 1374 1374 1529 1529 1544 1544 1640 1640 1640 1640 1640 1640 1640 1640 1640 1640 1640 1640 1640 1640 1640 1640 1640 1640 1640
Conventional 1374 1374 1529 1529 1544 1544 1640 1640 1640 1640 1640 1640 1640 1640 1640 1640 1640 1640 1640 1640 1640 1640 1640 1640 1640
PSPP 0 0 0 0 0 0 0 0 0 0 0 0 0 0 0 0 0 0 0 0 0 0 0 0 0
Thermal 1906 2076 2030 2283 2541 2541 2641 2761 3031 3206 3206 3476 3476 3746 3746 3746 4116 4350 4450 4450 4820 4820 5190 5164 5264
Oil 1081 1251 1205 1458 1716 1140 539 226 226 131 131 131 131 131 131 131 231 231 331 331 431 431 531 505 605
small GT 65 65 0 0 0 0 0 0 0 0 0 0 0 0 0 0 0 0 0 0 0 0 0 0 0
Sapugaskanda 140 140 140 70 70 70 70 35 35 0 0 0 0 0 0 0 0 0 0 0 0 0 0 0 0
GT No.7 115 115 115 115 115 115 115 0 0 0 0 0 0 0 0 0 0 0 0 0 0 0 0 0 0
Asia Power 51 51 0 0 0 0 0 0 0 0 0 0 0 0 0 0 0 0 0 0 0 0 0 0 0
KPS CC 161 161 161 161 161 161 0 0 0 0 0 0 0 0 0 0 0 0 0 0 0 0 0 0 0
AES CC 163 163 163 163 163 163 163 0 0 0 0 0 0 0 0 0 0 0 0 0 0 0 0 0 0
West coast CC 270 270 270 270 270 270 0 0 0 0 0 0 0 0 0 0 0 0 0 0 0 0 0 0 0
Northern power 30 30 30 30 0 0 0 0 0 0 0 0 0 0 0 0 0 0 0 0 0 0 0 0 0
Uthurujanani 26 26 26 26 26 26 26 26 26 26 26 26 26 26 26 26 26 26 26 26 26 26 26 0 0
CEB Barge power 60 60 60 60 60 60 60 60 60 0 0 0 0 0 0 0 0 0 0 0 0 0 0 0 0
Furnace oil 0 170 170 170 170 170 0 0 0 0 0 0 0 0 0 0 0 0 0 0 0 0 0 0 0
New GT 0 0 70 105 105 105 105 105 105 105 105 105 105 105 105 105 105 105 105 105 105 105 105 105 105
New CC 0 0 0 288 576 0 0 0 0 0 0 0 0 0 0 0 0 0 0 0 0 0 0 0 0
Back-up GT 0 0 0 0 0 0 0 0 0 0 0 0 0 0 0 0 100 100 200 200 300 300 400 400 500
LNG 0 0 0 0 0 576 1007 1170 1170 1170 1170 1170 1170 1170 1170 1170 1170 1134 1134 1134 1134 1134 1134 1134 1134
KPS CC (LNG) 0 0 0 0 0 0 161 161 161 161 161 161 161 161 161 161 161 0 0 0 0 0 0 0 0
KPS-2 CC (LNG) 0 0 0 0 0 0 0 163 163 163 163 163 163 163 163 163 163 0 0 0 0 0 0 0 0
West coast CC (LNG) 0 0 0 0 0 0 270 270 270 270 270 270 270 270 270 270 270 270 270 270 270 270 270 270 270
New LNG 0 0 0 0 0 576 576 576 576 576 576 576 576 576 576 576 576 864 864 864 864 864 864 864 864
Coal 825 825 825 825 825 825 1095 1365 1635 1905 1905 2175 2175 2445 2445 2445 2715 2985 2985 2985 3255 3255 3525 3525 3525
Puttalam 825 825 825 825 825 825 825 825 825 825 825 825 825 825 825 825 825 825 825 825 825 825 825 825 825
New Coal 0 0 0 0 0 0 270 540 810 1080 1080 1350 1350 1620 1620 1620 1890 2160 2160 2160 2430 2430 2700 2700 2700
NCRE 471 541 631 721 791 881 971 1061 1151 1261 1361 1461 1561 1661 1781 1871 2011 2151 2311 2491 2651 2811 2971 3131 3311
M-hydro 323 343 363 383 403 423 443 463 483 503 523 543 563 583 603 613 623 633 643 653 663 673 683 693 703
Wind 124 134 184 234 264 294 324 354 384 414 444 474 504 534 564 594 624 654 704 754 804 854 904 954 1004
Solar 0 40 60 80 100 140 180 220 260 300 350 400 450 500 550 600 700 800 900 1000 1100 1200 1300 1400 1500
Biomass 24 24 24 24 24 24 24 24 24 44 44 44 44 44 64 64 64 64 64 84 84 84 84 84 104
Total 3751 3991 4190 4533 4876 4966 5252 5462 5822 6107 6207 6577 6677 7047 7167 7257 7767 8141 8401 8581 9111 9271 9801 9935 10215
(GW) 2016 2017 2018 2019 2020 2021 2022 2023 2024 2025 2026 2027 2028 2029 2030 2031 2032 2033 2034 2035 2036 2037 2038 2039 2040
Coal 0.8 0.8 0.8 0.8 0.8 0.8 1.1 1.4 1.6 1.9 1.9 2.2 2.2 2.4 2.4 2.4 2.7 3.0 3.0 3.0 3.3 3.3 3.5 3.5 3.5
LNG (Gas) 0.0 0.0 0.0 0.0 0.0 0.6 1.0 1.2 1.2 1.2 1.2 1.2 1.2 1.2 1.2 1.2 1.2 1.1 1.1 1.1 1.1 1.1 1.1 1.1 1.1
Oil 1.1 1.3 1.2 1.5 1.7 1.1 0.5 0.2 0.2 0.1 0.1 0.1 0.1 0.1 0.1 0.1 0.2 0.2 0.3 0.3 0.4 0.4 0.5 0.5 0.6
PSPP 0.0 0.0 0.0 0.0 0.0 0.0 0.0 0.0 0.0 0.0 0.0 0.0 0.0 0.0 0.0 0.0 0.0 0.0 0.0 0.0 0.0 0.0 0.0 0.0 0.0
Hydro 1.7 1.7 1.9 1.9 1.9 2.0 2.1 2.1 2.1 2.1 2.2 2.2 2.2 2.2 2.2 2.3 2.3 2.3 2.3 2.3 2.3 2.3 2.3 2.3 2.3
Wind 0.1 0.1 0.2 0.2 0.3 0.3 0.3 0.4 0.4 0.4 0.4 0.5 0.5 0.5 0.6 0.6 0.6 0.7 0.7 0.8 0.8 0.9 0.9 1.0 1.0
Solar 0.0 0.0 0.1 0.1 0.1 0.1 0.2 0.2 0.3 0.3 0.4 0.4 0.5 0.5 0.6 0.6 0.7 0.8 0.9 1.0 1.1 1.2 1.3 1.4 1.5
Biomass 0.0 0.0 0.0 0.0 0.0 0.0 0.0 0.0 0.0 0.0 0.0 0.0 0.0 0.0 0.1 0.1 0.1 0.1 0.1 0.1 0.1 0.1 0.1 0.1 0.1
Total 3.8 4.0 4.2 4.5 4.9 5.0 5.3 5.5 5.8 6.1 6.2 6.6 6.7 7.0 7.2 7.3 7.8 8.1 8.4 8.6 9.1 9.3 9.8 9.9 10.2
2016 2017 2018 2019 2020 2021 2022 2023 2024 2025 2026 2027 2028 2029 2030 2031 2032 2033 2034 2035 2036 2037 2038 2039 2040
Coal 22.0% 20.7% 19.7% 18.2% 16.9% 16.6% 20.8% 25.0% 28.1% 31.2% 30.7% 33.1% 32.6% 34.7% 34.1% 33.7% 35.0% 36.7% 35.5% 34.8% 35.7% 35.1% 36.0% 35.5% 34.5%
LNG (Gas) 0.0% 0.0% 0.0% 0.0% 0.0% 11.6% 19.2% 21.4% 20.1% 19.2% 18.8% 17.8% 17.5% 16.6% 16.3% 16.1% 15.1% 13.9% 13.5% 13.2% 12.4% 12.2% 11.6% 11.4% 11.1%
Oil 28.8% 31.3% 28.8% 32.2% 35.2% 23.0% 10.3% 4.1% 3.9% 2.1% 2.1% 2.0% 2.0% 1.9% 1.8% 1.8% 3.0% 2.8% 3.9% 3.9% 4.7% 4.6% 5.4% 5.1% 5.9%
PSPP 0.0% 0.0% 0.0% 0.0% 0.0% 0.0% 0.0% 0.0% 0.0% 0.0% 0.0% 0.0% 0.0% 0.0% 0.0% 0.0% 0.0% 0.0% 0.0% 0.0% 0.0% 0.0% 0.0% 0.0% 0.0%
Hydro 45.2% 43.0% 45.2% 42.2% 39.9% 39.6% 39.7% 38.5% 36.5% 35.1% 34.8% 33.2% 33.0% 31.5% 31.3% 31.0% 29.1% 27.9% 27.2% 26.7% 25.3% 24.9% 23.7% 23.5% 22.9%
Wind 3.3% 3.4% 4.4% 5.2% 5.4% 5.9% 6.2% 6.5% 6.6% 6.8% 7.2% 7.2% 7.5% 7.6% 7.9% 8.2% 8.0% 8.0% 8.4% 8.8% 8.8% 9.2% 9.2% 9.6% 9.8%
Solar 0.0% 1.0% 1.4% 1.8% 2.1% 2.8% 3.4% 4.0% 4.5% 4.9% 5.6% 6.1% 6.7% 7.1% 7.7% 8.3% 9.0% 9.8% 10.7% 11.7% 12.1% 12.9% 13.3% 14.1% 14.7%
Biomass 0.6% 0.6% 0.6% 0.5% 0.5% 0.5% 0.5% 0.4% 0.4% 0.7% 0.7% 0.7% 0.7% 0.6% 0.9% 0.9% 0.8% 0.8% 0.8% 1.0% 0.9% 0.9% 0.9% 0.8% 1.0%
Total 100.0% 100.0% 100.0% 100.0% 100.0% 100.0% 100.0% 100.0% 100.0% 100.0% 100.0% 100.0% 100.0% 100.0% 100.0% 100.0% 100.0% 100.0% 100.0% 100.0% 100.0% 100.0% 100.0% 100.0% 100.0%

Project on Electricity Sector Master Plan Study in Democratic Socialist Republic of Sri Lanka
Final Report
15-17
Scenario A: Energy (kWh) balance
(million kWh) 2016 2017 2018 2019 2020 2021 2022 2023 2024 2025 2026 2027 2028 2029 2030 2031 2032 2033 2034 2035 2036 2037 2038 2039 2040
Hydro 4330 4330 4902 4902 4954 4954 5307 5307 5307 5307 5307 5307 5307 5307 5307 5307 5307 5307 5307 5307 5307 5307 5307 5307 5307
Conventional 4330 4330 4902 4902 4954 4954 5307 5307 5307 5307 5307 5307 5307 5307 5307 5307 5307 5307 5307 5307 5307 5307 5307 5307 5307
PSPP 0 0 0 0 0 0 0 0 0 0 0 0 0 0 0 0 0 0 0 0 0 0 0 0 0
Thermal 8008 8715 8895 9714 10565 11451 11994 12868 13739 14518 15354 16231 17067 17931 18664 19527 20374 21201 21926 22539 23334 24054 24806 25563 26175
Oil 2468 3138 3319 4136 4987 1912 2 0 0 0 0 0 0 0 0 0 3 3 6 6 9 9 12 12 15
small GT 0 0 0 0 0 0 0 0 0 0 0 0 0 0 0 0 0 0 0 0 0 0 0 0 0
Sapugaskanda 428 477 518 393 272 319 2 0 0 0 0 0 0 0 0 0 0 0 0 0 0 0 0 0 0
GT No.7 0 0 0 0 0 0 0 0 0 0 0 0 0 0 0 0 0 0 0 0 0 0 0 0 0
Asia Power 0 0 0 0 0 0 0 0 0 0 0 0 0 0 0 0 0 0 0 0 0 0 0 0 0
KPS CC 878 1079 1098 958 960 748 0 0 0 0 0 0 0 0 0 0 0 0 0 0 0 0 0 0 0
AES CC 0 0 0 0 0 0 0 0 0 0 0 0 0 0 0 0 0 0 0 0 0 0 0 0 0
West coast CC 1152 1429 1451 956 159 824 0 0 0 0 0 0 0 0 0 0 0 0 0 0 0 0 0 0 0
Northern power 2 0 2 0 0 0 0 0 0 0 0 0 0 0 0 0 0 0 0 0 0 0 0 0 0
Uthurujanani 8 51 68 6 35 5 0 0 0 0 0 0 0 0 0 0 0 0 0 0 0 0 0 0 0
CEB Barge power 0 0 0 0 0 0 0 0 0 0 0 0 0 0 0 0 0 0 0 0 0 0 0 0 0
Furnace oil 0 102 182 15 39 16 0 0 0 0 0 0 0 0 0 0 0 0 0 0 0 0 0 0 0
New GT 0 0 0 0 0 0 0 0 0 0 0 0 0 0 0 0 0 0 0 0 0 0 0 0 0
New CC 0 0 0 1808 3522 0 0 0 0 0 0 0 0 0 0 0 0 0 0 0 0 0 0 0 0
Back-up GT 0 0 0 0 0 0 0 0 0 0 0 0 0 0 0 0 3 3 6 6 9 9 12 12 15
LNG 0 0 0 0 0 3961 4421 3466 2666 1947 2519 1909 2421 1784 2217 2557 1868 1426 1691 2007 1511 1814 1409 1663 1945
KPS CC (LNG) 0 0 0 0 0 0 246 191 33 9 27 18 26 9 30 22 23 0 0 0 0 0 0 0 0
KPS-2 CC (LNG) 0 0 0 0 0 0 0 0 0 0 0 0 0 0 0 0 0 0 0 0 0 0 0 0 0
West coast CC (LNG) 0 0 0 0 0 0 706 357 18 0 18 0 18 0 8 28 0 0 0 0 0 0 0 0 0
New LNG 0 0 0 0 0 3961 3469 2918 2615 1938 2474 1891 2377 1775 2179 2507 1845 1426 1691 2007 1511 1814 1409 1663 1945
Coal 5540 5577 5576 5578 5578 5578 7571 9402 11073 12571 12835 14322 14646 16147 16447 16970 18503 19772 20229 20526 21814 22231 23385 23888 24215
Puttalam 5540 5577 5576 5578 5578 5578 5560 5411 5284 5146 5230 5114 5189 5079 5140 5270 5142 4879 5053 5175 4919 5071 4831 4968 5086
New Coal 0 0 0 0 0 0 2011 3991 5789 7425 7605 9208 9457 11068 11307 11700 13361 14893 15176 15351 16895 17160 18554 18920 19129
NCRE 1575 1737 2016 2295 2491 2703 2905 3127 3350 3682 3924 4156 4398 4630 4982 5185 5455 5725 6082 6549 6856 7213 7569 7876 8343
M-hydro 1074 1141 1207 1273 1340 1406 1473 1539 1606 1672 1738 1805 1871 1938 2004 2038 2071 2104 2138 2171 2204 2238 2271 2304 2337
Wind 341 378 563 748 849 951 1052 1154 1255 1356 1458 1559 1661 1762 1864 1965 2067 2168 2353 2538 2676 2861 3046 3183 3368
Solar 0 55 83 110 138 193 248 303 358 413 487 551 624 689 762 827 965 1103 1240 1378 1516 1654 1792 1929 2067
Biomass 160 163 163 164 164 153 132 131 131 241 241 241 242 241 352 355 352 350 351 462 460 460 460 460 571
Total 13913 14782 15813 16911 18010 19108 20206 21302 22396 23507 24585 25694 26772 27868 28953 30019 31136 32233 33315 34395 35497 36574 37682 38746 39825
Surplus 0 0 0 0 0 0 0 0 0 16 1 15 1 6 1 0 2 14 4 2 12 5 27 11 6
Shortage 0 0 0 0 0 0 0 0 0 0 0 0 0 0 0 (22) (1) 0 0 (3) 0 0 0 0 (1)
Pumping-up 0 0 0 0 0 0 0 0 0 0 0 0 0 0 0 0 0 0 0 0 0 0 0 0 0
(TWh) 2016 2017 2018 2019 2020 2021 2022 2023 2024 2025 2026 2027 2028 2029 2030 2031 2032 2033 2034 2035 2036 2037 2038 2039 2040
Coal 5.5 5.6 5.6 5.6 5.6 5.6 7.6 9.4 11.1 12.6 12.8 14.3 14.6 16.1 16.4 17.0 18.5 19.8 20.2 20.5 21.8 22.2 23.4 23.9 24.2
LNG (Gas) 0.0 0.0 0.0 0.0 0.0 4.0 4.4 3.5 2.7 1.9 2.5 1.9 2.4 1.8 2.2 2.6 1.9 1.4 1.7 2.0 1.5 1.8 1.4 1.7 1.9
Oil 2.5 3.1 3.3 4.1 5.0 1.9 0.0 0.0 0.0 0.0 0.0 0.0 0.0 0.0 0.0 0.0 0.0 0.0 0.0 0.0 0.0 0.0 0.0 0.0 0.0
PSPP 0.0 0.0 0.0 0.0 0.0 0.0 0.0 0.0 0.0 0.0 0.0 0.0 0.0 0.0 0.0 0.0 0.0 0.0 0.0 0.0 0.0 0.0 0.0 0.0 0.0
Hydro 5.4 5.5 6.1 6.2 6.3 6.4 6.8 6.8 6.9 7.0 7.0 7.1 7.2 7.2 7.3 7.3 7.4 7.4 7.4 7.5 7.5 7.5 7.6 7.6 7.6
Wind 0.3 0.4 0.6 0.7 0.8 1.0 1.1 1.2 1.3 1.4 1.5 1.6 1.7 1.8 1.9 2.0 2.1 2.2 2.4 2.5 2.7 2.9 3.0 3.2 3.4
Solar 0.0 0.1 0.1 0.1 0.1 0.2 0.2 0.3 0.4 0.4 0.5 0.6 0.6 0.7 0.8 0.8 1.0 1.1 1.2 1.4 1.5 1.7 1.8 1.9 2.1
Biomass 0.2 0.2 0.2 0.2 0.2 0.2 0.1 0.1 0.1 0.2 0.2 0.2 0.2 0.2 0.4 0.4 0.4 0.4 0.4 0.5 0.5 0.5 0.5 0.5 0.6
Total 13.9 14.8 15.8 16.9 18.0 19.1 20.2 21.3 22.4 23.5 24.6 25.7 26.8 27.9 29.0 30.0 31.1 32.2 33.3 34.4 35.5 36.6 37.7 38.7 39.8
2016 2017 2018 2019 2020 2021 2022 2023 2024 2025 2026 2027 2028 2029 2030 2031 2032 2033 2034 2035 2036 2037 2038 2039 2040
Coal 39.8% 37.7% 35.3% 33.0% 31.0% 29.2% 37.5% 44.1% 49.4% 53.5% 52.2% 55.7% 54.7% 57.9% 56.8% 56.5% 59.4% 61.3% 60.7% 59.7% 61.5% 60.8% 62.1% 61.7% 60.8%
LNG (Gas) 0.0% 0.0% 0.0% 0.0% 0.0% 20.7% 21.9% 16.3% 11.9% 8.3% 10.2% 7.4% 9.0% 6.4% 7.7% 8.5% 6.0% 4.4% 5.1% 5.8% 4.3% 5.0% 3.7% 4.3% 4.9%
Oil 17.7% 21.2% 21.0% 24.5% 27.7% 10.0% 0.0% 0.0% 0.0% 0.0% 0.0% 0.0% 0.0% 0.0% 0.0% 0.0% 0.0% 0.0% 0.0% 0.0% 0.0% 0.0% 0.0% 0.0% 0.0%
PSPP 0.0% 0.0% 0.0% 0.0% 0.0% 0.0% 0.0% 0.0% 0.0% 0.0% 0.0% 0.0% 0.0% 0.0% 0.0% 0.0% 0.0% 0.0% 0.0% 0.0% 0.0% 0.0% 0.0% 0.0% 0.0%
Hydro 38.8% 37.0% 38.6% 36.5% 34.9% 33.3% 33.6% 32.1% 30.9% 29.7% 28.7% 27.7% 26.8% 26.0% 25.3% 24.5% 23.7% 23.0% 22.3% 21.7% 21.2% 20.6% 20.1% 19.6% 19.2%
Wind 2.5% 2.6% 3.6% 4.4% 4.7% 5.0% 5.2% 5.4% 5.6% 5.8% 5.9% 6.1% 6.2% 6.3% 6.4% 6.5% 6.6% 6.7% 7.1% 7.4% 7.5% 7.8% 8.1% 8.2% 8.5%
Solar 0.0% 0.4% 0.5% 0.7% 0.8% 1.0% 1.2% 1.4% 1.6% 1.8% 2.0% 2.1% 2.3% 2.5% 2.6% 2.8% 3.1% 3.4% 3.7% 4.0% 4.3% 4.5% 4.8% 5.0% 5.2%
Biomass 1.2% 1.1% 1.0% 1.0% 0.9% 0.8% 0.7% 0.6% 0.6% 1.0% 1.0% 0.9% 0.9% 0.9% 1.2% 1.2% 1.1% 1.1% 1.1% 1.3% 1.3% 1.3% 1.2% 1.2% 1.4%
Total 100.0% 100.0% 100.0% 100.0% 100.0% 100.0% 100.0% 100.0% 100.0% 100.0% 100.0% 100.0% 100.0% 100.0% 100.0% 100.0% 100.0% 100.0% 100.0% 100.0% 100.0% 100.0% 100.0% 100.0% 100.0%

Project on Electricity Sector Master Plan Study in Democratic Socialist Republic of Sri Lanka
Final Report
15-18
Scenario A: Fuel balance
(mill ion USC) 2016 2017 2018 2019 2020 2021 2022 2023 2024 2025 2026 2027 2028 2029 2030 2031 2032 2033 2034 2035 2036 2037 2038 2039 2040
Thermal 67952 84344 93448 120373 146767 105081 69978 71833 73609 76269 82382 85762 91874 95124 100766 106007 108395 111402 115953 120193 122942 127644 130511 135296 139501
Oil 44300 60208 68971 95544 121593 49815 45 0 0 0 0 0 0 0 0 0 60 60 120 120 180 180 240 240 300
small GT 0 0 0 0 0 0 0 0 0 0 0 0 0 0 0 0 0 0 0 0 0 0 0 0 0
Sapugaskanda 6461 7910 9402 7582 5636 6932 45 0 0 0 0 0 0 0 0 0 0 0 0 0 0 0 0 0 0
GT No.7 0 0 0 0 0 0 0 0 0 0 0 0 0 0 0 0 0 0 0 0 0 0 0 0 0
Asia Power 0 0 0 0 0 0 0 0 0 0 0 0 0 0 0 0 0 0 0 0 0 0 0 0 0
KPS CC 13648 18358 20309 19055 20543 16895 0 0 0 0 0 0 0 0 0 0 0 0 0 0 0 0 0 0 0
AES CC 0 0 0 0 0 0 0 0 0 0 0 0 0 0 0 0 0 0 0 0 0 0 0 0 0
West coast CC 24034 31163 34296 26032 4800 25488 0 0 0 0 0 0 0 0 0 0 0 0 0 0 0 0 0 0 0
Northern power 26 0 31 0 0 0 0 0 0 0 0 0 0 0 0 0 0 0 0 0 0 0 0 0 0
Uthurujanani 131 913 1314 135 794 114 0 0 0 0 0 0 0 0 0 0 0 0 0 0 0 0 0 0 0
CEB Barge power 0 0 0 0 0 0 0 0 0 0 0 0 0 0 0 0 0 0 0 0 0 0 0 0 0
Furnace oil 0 1864 3619 313 896 386 0 0 0 0 0 0 0 0 0 0 0 0 0 0 0 0 0 0 0
New GT 0 0 0 0 0 0 0 0 0 0 0 0 0 0 0 0 0 0 0 0 0 0 0 0 0
New CC 0 0 0 42427 88924 0 0 0 0 0 0 0 0 0 0 0 0 0 0 0 0 0 0 0 0
Back-up GT 0 0 0 0 0 0 0 0 0 0 0 0 0 0 0 0 60 60 120 120 180 180 240 240 300
LNG 0 0 0 0 0 29867 35642 29230 23190 18615 23096 19112 23273 18900 22597 25300 20084 16745 18886 21464 17629 20129 16941 19073 21389
KPS CC (LNG) 0 0 0 0 0 0 2060 1674 296 87 251 172 247 88 301 220 231 0 0 0 0 0 0 0 0
KPS-2 CC (LNG) 0 0 0 0 0 0 0 0 0 0 0 0 0 0 0 0 0 0 0 0 0 0 0 0 0
West coast CC (LNG) 0 0 0 0 0 0 6252 3290 169 0 176 0 176 0 84 283 0 0 0 0 0 0 0 0 0
New LNG 0 0 0 0 0 29867 27330 24266 22725 18528 22669 18940 22850 18812 22212 24797 19853 16745 18886 21464 17629 20129 16941 19073 21389
Coal 23652 24136 24477 24829 25174 25399 34291 42603 50419 57654 59286 66650 68601 76224 78169 80707 88251 94597 96947 98609 105133 107335 113330 115983 117812
Puttalam 23652 24136 24477 24829 25174 25399 25557 25111 24756 24338 24947 24619 25179 24868 25375 26075 25544 24350 25274 25938 24778 25591 24499 25245 25894
New Coal 0 0 0 0 0 0 8734 17492 25663 33316 34339 42031 43422 51356 52794 54632 62707 70247 71673 72671 80355 81744 88831 90738 91918
NCRE 18508 19639 21656 23689 25087 26496 27764 29315 30879 33997 35670 37292 38979 40585 43826 45249 47026 48819 51271 55276 57334 59773 62211 64297 68303
M-hydro 11467 11950 12433 12916 13399 13882 14365 14848 15331 15814 16297 16780 17263 17746 18229 18471 18713 18956 19198 19440 19682 19925 20167 20409 20652
Wind 4782 5056 6425 7795 8545 9296 10047 10798 11548 12299 13050 13801 14552 15302 16053 16804 17555 18306 19675 21044 22061 23430 24799 25816 27185
Solar 0 331 496 662 827 1158 1488 1819 2150 2481 2920 3308 3747 4134 4574 4961 5788 6615 7442 8269 9096 9923 10750 11577 12403
Biomass 2259 2302 2302 2316 2316 2160 1864 1850 1850 3403 3403 3403 3417 3403 4970 5013 4970 4942 4956 6523 6495 6495 6495 6495 8063
Total 86460 103983 115104 144062 171854 131577 97742 101148 104488 110266 118052 123054 130853 135709 144592 151256 155421 160221 167224 175469 180276 187417 192722 199593 207804
(USC/kWh) 2016 2017 2018 2019 2020 2021 2022 2023 2024 2025 2026 2027 2028 2029 2030 2031 2032 2033 2034 2035 2036 2037 2038 2039 2040
Thermal 8.5 9.7 10.5 12.4 13.9 9.2 5.8 5.6 5.4 5.3 5.4 5.3 5.4 5.3 5.4 5.4 5.3 5.3 5.3 5.3 5.3 5.3 5.3 5.3 5.3
Oil 17.9 19.2 20.8 23.1 24.4 26.1 22.5 0.0 0.0 0.0 0.0 0.0 0.0 0.0 0.0 0.0 20.0 20.0 20.0 20.0 20.0 20.0 20.0 20.0 20.0
small GT 0.0 0.0 0.0 0.0 0.0 0.0 0.0 0.0 0.0 0.0 0.0 0.0 0.0 0.0 0.0 0.0 0.0 0.0 0.0 0.0 0.0 0.0 0.0 0.0 0.0
Sapugaskanda 15.1 16.6 18.2 19.3 20.7 21.7 22.5 0.0 0.0 0.0 0.0 0.0 0.0 0.0 0.0 0.0 0.0 0.0 0.0 0.0 0.0 0.0 0.0 0.0 0.0
GT No.7 0.0 0.0 0.0 0.0 0.0 0.0 0.0 0.0 0.0 0.0 0.0 0.0 0.0 0.0 0.0 0.0 0.0 0.0 0.0 0.0 0.0 0.0 0.0 0.0 0.0
Asia Power 0.0 0.0 0.0 0.0 0.0 0.0 0.0 0.0 0.0 0.0 0.0 0.0 0.0 0.0 0.0 0.0 0.0 0.0 0.0 0.0 0.0 0.0 0.0 0.0 0.0
KPS CC 15.5 17.0 18.5 19.9 21.4 22.6 0.0 0.0 0.0 0.0 0.0 0.0 0.0 0.0 0.0 0.0 0.0 0.0 0.0 0.0 0.0 0.0 0.0 0.0 0.0
AES CC 0.0 0.0 0.0 0.0 0.0 0.0 0.0 0.0 0.0 0.0 0.0 0.0 0.0 0.0 0.0 0.0 0.0 0.0 0.0 0.0 0.0 0.0 0.0 0.0 0.0
West coast CC 20.9 21.8 23.6 27.2 30.2 30.9 0.0 0.0 0.0 0.0 0.0 0.0 0.0 0.0 0.0 0.0 0.0 0.0 0.0 0.0 0.0 0.0 0.0 0.0 0.0
Northern power 13.0 0.0 15.5 0.0 0.0 0.0 0.0 0.0 0.0 0.0 0.0 0.0 0.0 0.0 0.0 0.0 0.0 0.0 0.0 0.0 0.0 0.0 0.0 0.0 0.0
Uthurujanani 16.4 17.9 19.3 22.5 22.7 22.8 0.0 0.0 0.0 0.0 0.0 0.0 0.0 0.0 0.0 0.0 0.0 0.0 0.0 0.0 0.0 0.0 0.0 0.0 0.0
CEB Barge power 0.0 0.0 0.0 0.0 0.0 0.0 0.0 0.0 0.0 0.0 0.0 0.0 0.0 0.0 0.0 0.0 0.0 0.0 0.0 0.0 0.0 0.0 0.0 0.0 0.0
Furnace oil 0.0 18.3 19.9 20.9 23.0 24.1 0.0 0.0 0.0 0.0 0.0 0.0 0.0 0.0 0.0 0.0 0.0 0.0 0.0 0.0 0.0 0.0 0.0 0.0 0.0
New GT 0.0 0.0 0.0 0.0 0.0 0.0 0.0 0.0 0.0 0.0 0.0 0.0 0.0 0.0 0.0 0.0 0.0 0.0 0.0 0.0 0.0 0.0 0.0 0.0 0.0
New CC 0.0 0.0 0.0 23.5 25.2 0.0 0.0 0.0 0.0 0.0 0.0 0.0 0.0 0.0 0.0 0.0 0.0 0.0 0.0 0.0 0.0 0.0 0.0 0.0 0.0
LNG 0.0 0.0 0.0 0.0 0.0 7.5 8.1 8.4 8.7 9.6 9.2 10.0 9.6 10.6 10.2 9.9 10.8 11.7 11.2 10.7 11.7 11.1 12.0 11.5 11.0
KPS CC (LNG) 0.0 0.0 0.0 0.0 0.0 0.0 8.4 8.8 9.0 9.7 9.3 9.6 9.5 9.8 10.0 10.0 10.0 0.0 0.0 0.0 0.0 0.0 0.0 0.0 0.0
KPS-2 CC (LNG) 0.0 0.0 0.0 0.0 0.0 0.0 0.0 0.0 0.0 0.0 0.0 0.0 0.0 0.0 0.0 0.0 0.0 0.0 0.0 0.0 0.0 0.0 0.0 0.0 0.0
West coast CC (LNG) 0.0 0.0 0.0 0.0 0.0 0.0 8.9 9.2 9.4 0.0 9.8 0.0 9.8 0.0 10.5 10.1 0.0 0.0 0.0 0.0 0.0 0.0 0.0 0.0 0.0
New LNG 0.0 0.0 0.0 0.0 0.0 7.5 7.9 8.3 8.7 9.6 9.2 10.0 9.6 10.6 10.2 9.9 10.8 11.7 11.2 10.7 11.7 11.1 12.0 11.5 11.0
Coal 4.3 4.3 4.4 4.5 4.5 4.6 4.5 4.5 4.6 4.6 4.6 4.7 4.7 4.7 4.8 4.8 4.8 4.8 4.8 4.8 4.8 4.8 4.8 4.9 4.9
Puttalam 4.3 4.3 4.4 4.5 4.5 4.6 4.6 4.6 4.7 4.7 4.8 4.8 4.9 4.9 4.9 4.9 5.0 5.0 5.0 5.0 5.0 5.0 5.1 5.1 5.1
New Coal 0.0 0.0 0.0 0.0 0.0 0.0 4.3 4.4 4.4 4.5 4.5 4.6 4.6 4.6 4.7 4.7 4.7 4.7 4.7 4.7 4.8 4.8 4.8 4.8 4.8
NCRE 11.8 11.3 10.7 10.3 10.1 9.8 9.6 9.4 9.2 9.2 9.1 9.0 8.9 8.8 8.8 8.7 8.6 8.5 8.4 8.4 8.4 8.3 8.2 8.2 8.2
M-hydro 10.7 10.5 10.3 10.1 10.0 9.9 9.8 9.6 9.5 9.5 9.4 9.3 9.2 9.2 9.1 9.1 9.0 9.0 9.0 9.0 8.9 8.9 8.9 8.9 8.8
Wind 14.0 13.4 11.4 10.4 10.1 9.8 9.6 9.4 9.2 9.1 9.0 8.9 8.8 8.7 8.6 8.6 8.5 8.4 8.4 8.3 8.2 8.2 8.1 8.1 8.1
Solar 0.0 6.0 6.0 6.0 6.0 6.0 6.0 6.0 6.0 6.0 6.0 6.0 6.0 6.0 6.0 6.0 6.0 6.0 6.0 6.0 6.0 6.0 6.0 6.0 6.0
Biomass 14.1 14.1 14.1 14.1 14.1 14.1 14.1 14.1 14.1 14.1 14.1 14.1 14.1 14.1 14.1 14.1 14.1 14.1 14.1 14.1 14.1 14.1 14.1 14.1 14.1
Total 6.2 7.0 7.3 8.5 9.5 6.9 4.8 4.7 4.7 4.7 4.8 4.8 4.9 4.9 5.0 5.0 5.0 5.0 5.0 5.1 5.1 5.1 5.1 5.2 5.2

Project on Electricity Sector Master Plan Study in Democratic Socialist Republic of Sri Lanka
Final Report
15-19
Scenario B: Summary
Demand
(MW)
Demand
(GWh)Year LOLE LNG Coal Wind Solar
Back-up
GTPSPP LNG Coal PSPP Surplus
LNG
(kton)LNG Coal Surplus Fixed cost Fuel cost Total
Cost
USC/kWhkton-CO2 kg/kWh
2369 13912 2016 16.87 0 825 124 0 0 0 5540 0 0 0 0.0% 39.8% 0.0% 52095 85696 137791 9.9 6755 0.486
2491 14782 2017 12.45 0 825 134 40 0 0 5577 0 0 0 0.0% 37.7% 0.0% 54263 103207 157470 10.7 7172 0.485
2639 15811 2018 24.27 0 825 184 90 0 0 5578 0 0 0 0.0% 35.3% 0.0% 57322 113571 170893 10.8 7264 0.459
2798 16911 2019 15.36 0 825 234 140 0 0 5578 0 0 0 0.0% 33.0% 0.0% 61615 142133 203748 12.0 7654 0.453
2955 18010 2020 8.04 0 825 304 190 0 0 5578 0 0 0 0.0% 31.0% 0.0% 66398 166163 232561 12.9 7930 0.440
3112 19108 2021 19.18 576 825 404 240 0 3864 5578 0 0 538 20.2% 29.2% 0.0% 66398 121964 188362 9.9 7842 0.410
3267 20205 2022 17.19 1295 825 504 290 0 5648 5577 0 0 806 28.0% 27.6% 0.0% 71111 103001 174112 8.6 7709 0.382
3422 21302 2023 15.25 1746 825 604 340 0 6277 5577 0 0 887 29.5% 26.2% 0.0% 74636 112184 186820 8.8 7956 0.373
3577 22397 2024 36.96 1746 825 704 400 0 6881 5577 0 0 971 30.7% 24.9% 0.0% 74636 121798 196434 8.8 8212 0.367
3730 23492 2025 24.49 2034 825 804 500 0 7323 5577 0 0 1036 31.2% 23.7% 0.0% 77676 131857 209533 8.9 8411 0.358
3883 24586 2026 11.10 2322 825 1004 600 0 7536 5577 0 0 1065 30.7% 22.7% 0.0% 81195 141434 222629 9.1 8499 0.346
4035 25679 2027 13.82 2322 825 1204 700 200 7748 5577 1 0 1099 30.2% 21.7% 0.0% 83446 151305 234751 9.1 8603 0.335
4187 26771 2028 6.81 2322 825 1404 800 100 400 7961 5577 5 0 1128 29.7% 20.8% 0.0% 86024 161014 247038 9.2 8691 0.325
4333 27862 2029 7.88 2322 825 1604 900 100 600 8175 5577 9 0 1153 29.3% 20.0% 0.0% 88275 170518 258793 9.3 8768 0.315
4505 28952 2030 12.62 2322 825 1804 1000 200 600 8283 5575 25 0 1168 28.6% 19.3% 0.0% 89025 180474 269499 9.3 8811 0.304
4677 30041 2031 16.15 2322 825 2004 1100 200 600 8531 5576 47 0 1202 28.4% 18.6% 0.0% 89025 189172 278197 9.3 8917 0.297
4849 31130 2032 23.86 2322 825 2204 1200 300 600 8782 5574 71 0 1239 28.2% 17.9% 0.0% 89351 198163 287514 9.2 9028 0.290
5021 32217 2033 41.74 2286 825 2404 1300 300 600 9035 5572 90 0 1277 28.0% 17.3% 0.0% 89990 207130 297120 9.2 9141 0.284
5193 33304 2034 19.15 2574 825 2604 1400 400 600 9276 5574 108 0 1308 27.9% 16.7% 0.0% 93835 215750 309585 9.3 9238 0.277
5365 34390 2035 25.34 2574 825 2804 1500 400 600 9418 5572 138 0 1330 27.4% 16.2% 0.0% 94259 224746 319005 9.3 9303 0.271
5536 35475 2036 9.92 2862 825 3004 1600 500 600 9679 5567 176 0 1363 27.3% 15.7% 0.0% 98104 233439 331543 9.3 9398 0.265
5708 36559 2037 17.15 2862 825 3204 1700 500 600 9936 5555 201 1 1400 27.2% 15.2% 0.0% 98104 242430 340534 9.3 9501 0.260
5879 37642 2038 26.78 2862 825 3404 1800 600 600 10195 5551 217 11 1438 27.1% 14.7% 0.0% 98430 251497 349927 9.3 9613 0.255
6051 38724 2039 13.58 3150 825 3704 1900 600 600 10228 5472 221 66 1443 26.4% 14.1% 0.2% 101617 260496 362113 9.4 9558 0.247
6222 39805 2040 17.28 3150 825 4004 2000 700 600 10220 5432 159 261 1442 25.7% 13.6% 0.7% 102367 270393 372760 9.4 9518 0.239
Capacity (MW) Energy (GWh) kWh (%) Generation cost CO2 emission
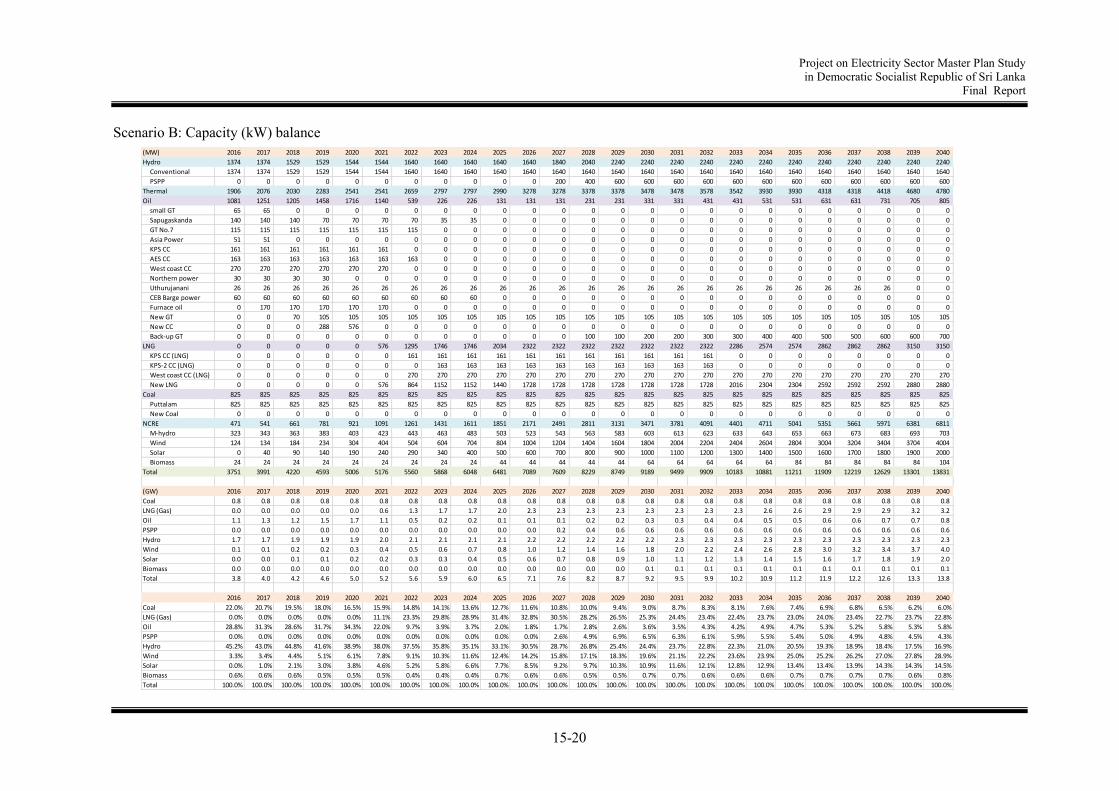
Project on Electricity Sector Master Plan Study in Democratic Socialist Republic of Sri Lanka
Final Report
15-20
Scenario B: Capacity (kW) balance
(MW) 2016 2017 2018 2019 2020 2021 2022 2023 2024 2025 2026 2027 2028 2029 2030 2031 2032 2033 2034 2035 2036 2037 2038 2039 2040
Hydro 1374 1374 1529 1529 1544 1544 1640 1640 1640 1640 1640 1840 2040 2240 2240 2240 2240 2240 2240 2240 2240 2240 2240 2240 2240
Conventional 1374 1374 1529 1529 1544 1544 1640 1640 1640 1640 1640 1640 1640 1640 1640 1640 1640 1640 1640 1640 1640 1640 1640 1640 1640
PSPP 0 0 0 0 0 0 0 0 0 0 0 200 400 600 600 600 600 600 600 600 600 600 600 600 600
Thermal 1906 2076 2030 2283 2541 2541 2659 2797 2797 2990 3278 3278 3378 3378 3478 3478 3578 3542 3930 3930 4318 4318 4418 4680 4780
Oil 1081 1251 1205 1458 1716 1140 539 226 226 131 131 131 231 231 331 331 431 431 531 531 631 631 731 705 805
small GT 65 65 0 0 0 0 0 0 0 0 0 0 0 0 0 0 0 0 0 0 0 0 0 0 0
Sapugaskanda 140 140 140 70 70 70 70 35 35 0 0 0 0 0 0 0 0 0 0 0 0 0 0 0 0
GT No.7 115 115 115 115 115 115 115 0 0 0 0 0 0 0 0 0 0 0 0 0 0 0 0 0 0
Asia Power 51 51 0 0 0 0 0 0 0 0 0 0 0 0 0 0 0 0 0 0 0 0 0 0 0
KPS CC 161 161 161 161 161 161 0 0 0 0 0 0 0 0 0 0 0 0 0 0 0 0 0 0 0
AES CC 163 163 163 163 163 163 163 0 0 0 0 0 0 0 0 0 0 0 0 0 0 0 0 0 0
West coast CC 270 270 270 270 270 270 0 0 0 0 0 0 0 0 0 0 0 0 0 0 0 0 0 0 0
Northern power 30 30 30 30 0 0 0 0 0 0 0 0 0 0 0 0 0 0 0 0 0 0 0 0 0
Uthurujanani 26 26 26 26 26 26 26 26 26 26 26 26 26 26 26 26 26 26 26 26 26 26 26 0 0
CEB Barge power 60 60 60 60 60 60 60 60 60 0 0 0 0 0 0 0 0 0 0 0 0 0 0 0 0
Furnace oil 0 170 170 170 170 170 0 0 0 0 0 0 0 0 0 0 0 0 0 0 0 0 0 0 0
New GT 0 0 70 105 105 105 105 105 105 105 105 105 105 105 105 105 105 105 105 105 105 105 105 105 105
New CC 0 0 0 288 576 0 0 0 0 0 0 0 0 0 0 0 0 0 0 0 0 0 0 0 0
Back-up GT 0 0 0 0 0 0 0 0 0 0 0 0 100 100 200 200 300 300 400 400 500 500 600 600 700
LNG 0 0 0 0 0 576 1295 1746 1746 2034 2322 2322 2322 2322 2322 2322 2322 2286 2574 2574 2862 2862 2862 3150 3150
KPS CC (LNG) 0 0 0 0 0 0 161 161 161 161 161 161 161 161 161 161 161 0 0 0 0 0 0 0 0
KPS-2 CC (LNG) 0 0 0 0 0 0 0 163 163 163 163 163 163 163 163 163 163 0 0 0 0 0 0 0 0
West coast CC (LNG) 0 0 0 0 0 0 270 270 270 270 270 270 270 270 270 270 270 270 270 270 270 270 270 270 270
New LNG 0 0 0 0 0 576 864 1152 1152 1440 1728 1728 1728 1728 1728 1728 1728 2016 2304 2304 2592 2592 2592 2880 2880
Coal 825 825 825 825 825 825 825 825 825 825 825 825 825 825 825 825 825 825 825 825 825 825 825 825 825
Puttalam 825 825 825 825 825 825 825 825 825 825 825 825 825 825 825 825 825 825 825 825 825 825 825 825 825
New Coal 0 0 0 0 0 0 0 0 0 0 0 0 0 0 0 0 0 0 0 0 0 0 0 0 0
NCRE 471 541 661 781 921 1091 1261 1431 1611 1851 2171 2491 2811 3131 3471 3781 4091 4401 4711 5041 5351 5661 5971 6381 6811
M-hydro 323 343 363 383 403 423 443 463 483 503 523 543 563 583 603 613 623 633 643 653 663 673 683 693 703
Wind 124 134 184 234 304 404 504 604 704 804 1004 1204 1404 1604 1804 2004 2204 2404 2604 2804 3004 3204 3404 3704 4004
Solar 0 40 90 140 190 240 290 340 400 500 600 700 800 900 1000 1100 1200 1300 1400 1500 1600 1700 1800 1900 2000
Biomass 24 24 24 24 24 24 24 24 24 44 44 44 44 44 64 64 64 64 64 84 84 84 84 84 104
Total 3751 3991 4220 4593 5006 5176 5560 5868 6048 6481 7089 7609 8229 8749 9189 9499 9909 10183 10881 11211 11909 12219 12629 13301 13831
(GW) 2016 2017 2018 2019 2020 2021 2022 2023 2024 2025 2026 2027 2028 2029 2030 2031 2032 2033 2034 2035 2036 2037 2038 2039 2040
Coal 0.8 0.8 0.8 0.8 0.8 0.8 0.8 0.8 0.8 0.8 0.8 0.8 0.8 0.8 0.8 0.8 0.8 0.8 0.8 0.8 0.8 0.8 0.8 0.8 0.8
LNG (Gas) 0.0 0.0 0.0 0.0 0.0 0.6 1.3 1.7 1.7 2.0 2.3 2.3 2.3 2.3 2.3 2.3 2.3 2.3 2.6 2.6 2.9 2.9 2.9 3.2 3.2
Oil 1.1 1.3 1.2 1.5 1.7 1.1 0.5 0.2 0.2 0.1 0.1 0.1 0.2 0.2 0.3 0.3 0.4 0.4 0.5 0.5 0.6 0.6 0.7 0.7 0.8
PSPP 0.0 0.0 0.0 0.0 0.0 0.0 0.0 0.0 0.0 0.0 0.0 0.2 0.4 0.6 0.6 0.6 0.6 0.6 0.6 0.6 0.6 0.6 0.6 0.6 0.6
Hydro 1.7 1.7 1.9 1.9 1.9 2.0 2.1 2.1 2.1 2.1 2.2 2.2 2.2 2.2 2.2 2.3 2.3 2.3 2.3 2.3 2.3 2.3 2.3 2.3 2.3
Wind 0.1 0.1 0.2 0.2 0.3 0.4 0.5 0.6 0.7 0.8 1.0 1.2 1.4 1.6 1.8 2.0 2.2 2.4 2.6 2.8 3.0 3.2 3.4 3.7 4.0
Solar 0.0 0.0 0.1 0.1 0.2 0.2 0.3 0.3 0.4 0.5 0.6 0.7 0.8 0.9 1.0 1.1 1.2 1.3 1.4 1.5 1.6 1.7 1.8 1.9 2.0
Biomass 0.0 0.0 0.0 0.0 0.0 0.0 0.0 0.0 0.0 0.0 0.0 0.0 0.0 0.0 0.1 0.1 0.1 0.1 0.1 0.1 0.1 0.1 0.1 0.1 0.1
Total 3.8 4.0 4.2 4.6 5.0 5.2 5.6 5.9 6.0 6.5 7.1 7.6 8.2 8.7 9.2 9.5 9.9 10.2 10.9 11.2 11.9 12.2 12.6 13.3 13.8
2016 2017 2018 2019 2020 2021 2022 2023 2024 2025 2026 2027 2028 2029 2030 2031 2032 2033 2034 2035 2036 2037 2038 2039 2040
Coal 22.0% 20.7% 19.5% 18.0% 16.5% 15.9% 14.8% 14.1% 13.6% 12.7% 11.6% 10.8% 10.0% 9.4% 9.0% 8.7% 8.3% 8.1% 7.6% 7.4% 6.9% 6.8% 6.5% 6.2% 6.0%
LNG (Gas) 0.0% 0.0% 0.0% 0.0% 0.0% 11.1% 23.3% 29.8% 28.9% 31.4% 32.8% 30.5% 28.2% 26.5% 25.3% 24.4% 23.4% 22.4% 23.7% 23.0% 24.0% 23.4% 22.7% 23.7% 22.8%
Oil 28.8% 31.3% 28.6% 31.7% 34.3% 22.0% 9.7% 3.9% 3.7% 2.0% 1.8% 1.7% 2.8% 2.6% 3.6% 3.5% 4.3% 4.2% 4.9% 4.7% 5.3% 5.2% 5.8% 5.3% 5.8%
PSPP 0.0% 0.0% 0.0% 0.0% 0.0% 0.0% 0.0% 0.0% 0.0% 0.0% 0.0% 2.6% 4.9% 6.9% 6.5% 6.3% 6.1% 5.9% 5.5% 5.4% 5.0% 4.9% 4.8% 4.5% 4.3%
Hydro 45.2% 43.0% 44.8% 41.6% 38.9% 38.0% 37.5% 35.8% 35.1% 33.1% 30.5% 28.7% 26.8% 25.4% 24.4% 23.7% 22.8% 22.3% 21.0% 20.5% 19.3% 18.9% 18.4% 17.5% 16.9%
Wind 3.3% 3.4% 4.4% 5.1% 6.1% 7.8% 9.1% 10.3% 11.6% 12.4% 14.2% 15.8% 17.1% 18.3% 19.6% 21.1% 22.2% 23.6% 23.9% 25.0% 25.2% 26.2% 27.0% 27.8% 28.9%
Solar 0.0% 1.0% 2.1% 3.0% 3.8% 4.6% 5.2% 5.8% 6.6% 7.7% 8.5% 9.2% 9.7% 10.3% 10.9% 11.6% 12.1% 12.8% 12.9% 13.4% 13.4% 13.9% 14.3% 14.3% 14.5%
Biomass 0.6% 0.6% 0.6% 0.5% 0.5% 0.5% 0.4% 0.4% 0.4% 0.7% 0.6% 0.6% 0.5% 0.5% 0.7% 0.7% 0.6% 0.6% 0.6% 0.7% 0.7% 0.7% 0.7% 0.6% 0.8%
Total 100.0% 100.0% 100.0% 100.0% 100.0% 100.0% 100.0% 100.0% 100.0% 100.0% 100.0% 100.0% 100.0% 100.0% 100.0% 100.0% 100.0% 100.0% 100.0% 100.0% 100.0% 100.0% 100.0% 100.0% 100.0%

Project on Electricity Sector Master Plan Study in Democratic Socialist Republic of Sri Lanka
Final Report
15-21
Scenario B: Energy (kWh) balance
(million kWh) 2016 2017 2018 2019 2020 2021 2022 2023 2024 2025 2026 2027 2028 2029 2030 2031 2032 2033 2034 2035 2036 2037 2038 2039 2040
Hydro 4330 4330 4902 4902 4954 4954 5307 5307 5307 5307 5307 5308 5312 5316 5332 5354 5378 5397 5415 5445 5483 5508 5524 5528 5466
Conventional 4330 4330 4902 4902 4954 4954 5307 5307 5307 5307 5307 5307 5307 5307 5307 5307 5307 5307 5307 5307 5307 5307 5307 5307 5307
PSPP 0 0 0 0 0 0 0 0 0 0 0 1 5 9 25 47 71 90 108 138 176 201 217 221 159
Thermal 8008 8715 8848 9631 10297 10938 11225 11854 12458 12900 13113 13325 13541 13755 13864 14113 14365 14616 14862 15002 15261 15506 15764 15718 15673
Oil 2468 3138 3270 4053 4719 1496 0 0 0 0 0 0 3 3 6 6 9 9 12 12 15 15 18 18 21
small GT 0 0 0 0 0 0 0 0 0 0 0 0 0 0 0 0 0 0 0 0 0 0 0 0 0
Sapugaskanda 428 477 516 400 168 314 0 0 0 0 0 0 0 0 0 0 0 0 0 0 0 0 0 0 0
GT No.7 0 0 0 0 0 0 0 0 0 0 0 0 0 0 0 0 0 0 0 0 0 0 0 0 0
Asia Power 0 0 0 0 0 0 0 0 0 0 0 0 0 0 0 0 0 0 0 0 0 0 0 0 0
KPS CC 878 1079 1091 891 944 613 0 0 0 0 0 0 0 0 0 0 0 0 0 0 0 0 0 0 0
AES CC 0 0 0 0 0 0 0 0 0 0 0 0 0 0 0 0 0 0 0 0 0 0 0 0 0
West coast CC 1152 1429 1425 950 69 496 0 0 0 0 0 0 0 0 0 0 0 0 0 0 0 0 0 0 0
Northern power 2 0 2 0 0 0 0 0 0 0 0 0 0 0 0 0 0 0 0 0 0 0 0 0 0
Uthurujanani 8 51 70 5 14 24 0 0 0 0 0 0 0 0 0 0 0 0 0 0 0 0 0 0 0
CEB Barge power 0 0 0 0 0 0 0 0 0 0 0 0 0 0 0 0 0 0 0 0 0 0 0 0 0
Furnace oil 0 102 166 13 26 49 0 0 0 0 0 0 0 0 0 0 0 0 0 0 0 0 0 0 0
New GT 0 0 0 0 0 0 0 0 0 0 0 0 0 0 0 0 0 0 0 0 0 0 0 0 0
New CC 0 0 0 1794 3498 0 0 0 0 0 0 0 0 0 0 0 0 0 0 0 0 0 0 0 0
Back-up GT 0 0 0 0 0 0 0 0 0 0 0 0 3 3 6 6 9 9 12 12 15 15 18 18 21
LNG 0 0 0 0 0 3864 5648 6277 6881 7323 7536 7748 7961 8175 8283 8531 8782 9035 9276 9418 9679 9936 10195 10228 10220
KPS CC (LNG) 0 0 0 0 0 0 156 28 150 16 0 10 14 14 60 66 89 0 0 0 0 0 0 0 0
KPS-2 CC (LNG) 0 0 0 0 0 0 0 0 0 0 0 0 0 0 0 0 0 0 0 0 0 0 0 0 0
West coast CC (LNG) 0 0 0 0 0 0 410 73 138 9 0 0 0 23 21 31 103 20 8 17 0 0 8 0 0
New LNG 0 0 0 0 0 3864 5082 6176 6593 7298 7536 7738 7947 8138 8202 8434 8590 9015 9268 9401 9679 9936 10187 10228 10220
Coal 5540 5577 5578 5578 5578 5578 5577 5577 5577 5577 5577 5577 5577 5577 5575 5576 5574 5572 5574 5572 5567 5555 5551 5472 5432
Puttalam 5540 5577 5578 5578 5578 5578 5577 5577 5577 5577 5577 5577 5577 5577 5575 5576 5574 5572 5574 5572 5567 5555 5551 5472 5432
New Coal 0 0 0 0 0 0 0 0 0 0 0 0 0 0 0 0 0 0 0 0 0 0 0 0 0
NCRE 1575 1737 2062 2378 2758 3216 3673 4142 4634 5284 6166 7047 7928 8808 9798 10647 11497 12342 13193 14153 14996 15848 16692 17876 19175
M-hydro 1074 1141 1207 1273 1340 1406 1473 1539 1606 1672 1738 1805 1871 1938 2004 2038 2071 2104 2138 2171 2204 2238 2271 2304 2337
Wind 341 378 563 748 988 1326 1664 2003 2341 2679 3356 4032 4709 5385 6062 6738 7415 8092 8768 9445 10121 10798 11474 12489 13504
Solar 0 55 128 193 266 331 404 469 555 692 830 968 1106 1244 1382 1519 1657 1795 1933 2071 2208 2346 2484 2622 2760
Biomass 160 163 164 164 164 153 132 131 132 241 242 242 242 241 350 352 354 351 354 466 463 466 463 461 574
Total 13913 14782 15812 16911 18009 19108 20205 21303 22399 23491 24586 25680 26781 27879 28994 30114 31240 32355 33470 34600 35740 36862 37980 39122 40314
Surplus 0 0 0 0 0 0 0 0 0 0 0 0 0 0 0 0 0 0 0 0 0 1 11 66 261
Shortage 0 0 0 0 0 0 0 0 0 0 0 0 0 0 0 0 0 0 0 0 0 0 0 0 0
Pumping-up 0 0 0 0 0 0 0 0 0 0 0 (1) (6) (13) (36) (67) (100) (128) (154) (197) (251) (286) (308) (315) (227)
(TWh) 2016 2017 2018 2019 2020 2021 2022 2023 2024 2025 2026 2027 2028 2029 2030 2031 2032 2033 2034 2035 2036 2037 2038 2039 2040
Coal 5.5 5.6 5.6 5.6 5.6 5.6 5.6 5.6 5.6 5.6 5.6 5.6 5.6 5.6 5.6 5.6 5.6 5.6 5.6 5.6 5.6 5.6 5.6 5.5 5.4
LNG (Gas) 0.0 0.0 0.0 0.0 0.0 3.9 5.6 6.3 6.9 7.3 7.5 7.7 8.0 8.2 8.3 8.5 8.8 9.0 9.3 9.4 9.7 9.9 10.2 10.2 10.2
Oil 2.5 3.1 3.3 4.1 4.7 1.5 0.0 0.0 0.0 0.0 0.0 0.0 0.0 0.0 0.0 0.0 0.0 0.0 0.0 0.0 0.0 0.0 0.0 0.0 0.0
PSPP 0.0 0.0 0.0 0.0 0.0 0.0 0.0 0.0 0.0 0.0 0.0 0.0 0.0 0.0 0.0 0.0 0.1 0.1 0.1 0.1 0.2 0.2 0.2 0.2 0.2
Hydro 5.4 5.5 6.1 6.2 6.3 6.4 6.8 6.8 6.9 7.0 7.0 7.1 7.2 7.2 7.3 7.3 7.4 7.4 7.4 7.5 7.5 7.5 7.6 7.6 7.6
Wind 0.3 0.4 0.6 0.7 1.0 1.3 1.7 2.0 2.3 2.7 3.4 4.0 4.7 5.4 6.1 6.7 7.4 8.1 8.8 9.4 10.1 10.8 11.5 12.5 13.5
Solar 0.0 0.1 0.1 0.2 0.3 0.3 0.4 0.5 0.6 0.7 0.8 1.0 1.1 1.2 1.4 1.5 1.7 1.8 1.9 2.1 2.2 2.3 2.5 2.6 2.8
Biomass 0.2 0.2 0.2 0.2 0.2 0.2 0.1 0.1 0.1 0.2 0.2 0.2 0.2 0.2 0.4 0.4 0.4 0.4 0.4 0.5 0.5 0.5 0.5 0.5 0.6
Total 13.9 14.8 15.8 16.9 18.0 19.1 20.2 21.3 22.4 23.5 24.6 25.7 26.8 27.9 29.0 30.1 31.2 32.4 33.5 34.6 35.7 36.9 38.0 39.1 40.3
2016 2017 2018 2019 2020 2021 2022 2023 2024 2025 2026 2027 2028 2029 2030 2031 2032 2033 2034 2035 2036 2037 2038 2039 2040
Coal 39.8% 37.7% 35.3% 33.0% 31.0% 29.2% 27.6% 26.2% 24.9% 23.7% 22.7% 21.7% 20.8% 20.0% 19.2% 18.5% 17.8% 17.2% 16.7% 16.1% 15.6% 15.1% 14.6% 14.0% 13.5%
LNG (Gas) 0.0% 0.0% 0.0% 0.0% 0.0% 20.2% 28.0% 29.5% 30.7% 31.2% 30.7% 30.2% 29.7% 29.3% 28.6% 28.3% 28.1% 27.9% 27.7% 27.2% 27.1% 27.0% 26.8% 26.1% 25.4%
Oil 17.7% 21.2% 20.7% 24.0% 26.2% 7.8% 0.0% 0.0% 0.0% 0.0% 0.0% 0.0% 0.0% 0.0% 0.0% 0.0% 0.0% 0.0% 0.0% 0.0% 0.0% 0.0% 0.0% 0.0% 0.1%
PSPP 0.0% 0.0% 0.0% 0.0% 0.0% 0.0% 0.0% 0.0% 0.0% 0.0% 0.0% 0.0% 0.0% 0.0% 0.1% 0.2% 0.2% 0.3% 0.3% 0.4% 0.5% 0.5% 0.6% 0.6% 0.4%
Hydro 38.8% 37.0% 38.6% 36.5% 34.9% 33.3% 33.6% 32.1% 30.9% 29.7% 28.7% 27.7% 26.8% 26.0% 25.2% 24.4% 23.6% 22.9% 22.2% 21.6% 21.0% 20.5% 20.0% 19.5% 19.0%
Wind 2.5% 2.6% 3.6% 4.4% 5.5% 6.9% 8.2% 9.4% 10.5% 11.4% 13.7% 15.7% 17.6% 19.3% 20.9% 22.4% 23.7% 25.0% 26.2% 27.3% 28.3% 29.3% 30.2% 31.9% 33.5%
Solar 0.0% 0.4% 0.8% 1.1% 1.5% 1.7% 2.0% 2.2% 2.5% 2.9% 3.4% 3.8% 4.1% 4.5% 4.8% 5.0% 5.3% 5.5% 5.8% 6.0% 6.2% 6.4% 6.5% 6.7% 6.8%
Biomass 1.2% 1.1% 1.0% 1.0% 0.9% 0.8% 0.7% 0.6% 0.6% 1.0% 1.0% 0.9% 0.9% 0.9% 1.2% 1.2% 1.1% 1.1% 1.1% 1.3% 1.3% 1.3% 1.2% 1.2% 1.4%
Total 100.0% 100.0% 100.0% 100.0% 100.0% 100.0% 100.0% 100.0% 100.0% 100.0% 100.0% 100.0% 100.0% 100.0% 100.0% 100.0% 100.0% 100.0% 100.0% 100.0% 100.0% 100.0% 100.0% 100.0% 100.0%
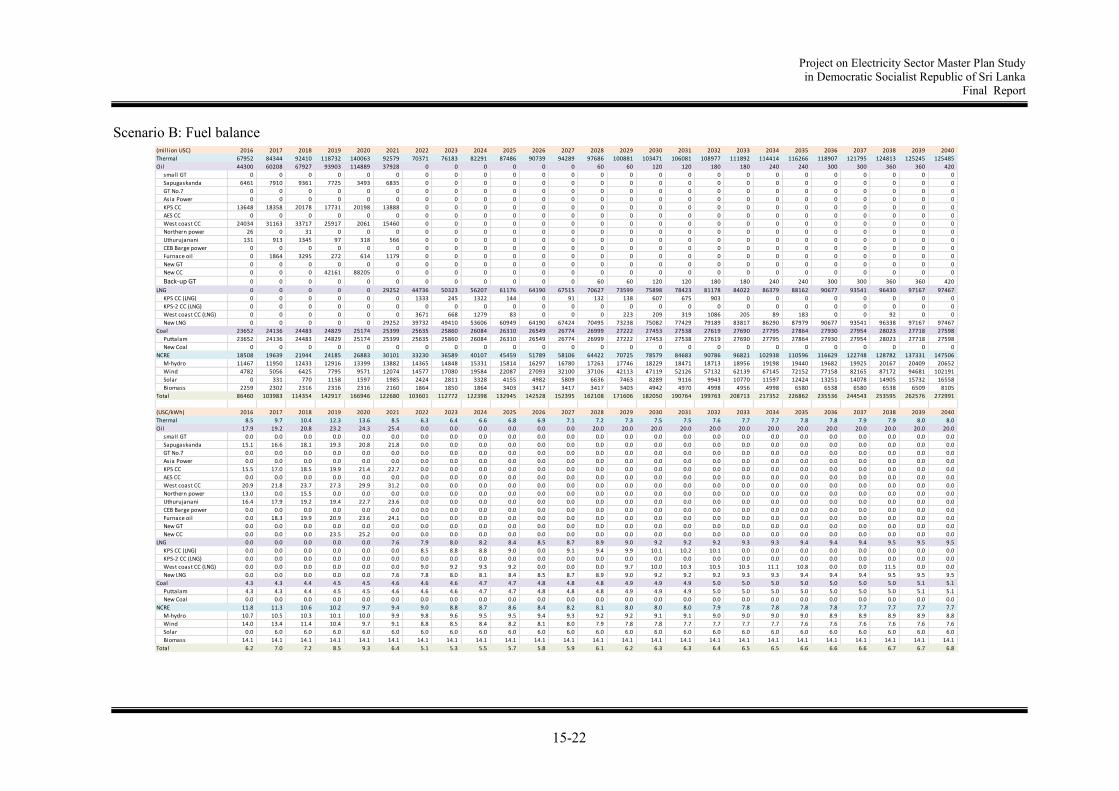
Project on Electricity Sector Master Plan Study in Democratic Socialist Republic of Sri Lanka
Final Report
15-22
Scenario B: Fuel balance
(mill ion USC) 2016 2017 2018 2019 2020 2021 2022 2023 2024 2025 2026 2027 2028 2029 2030 2031 2032 2033 2034 2035 2036 2037 2038 2039 2040
Thermal 67952 84344 92410 118732 140063 92579 70371 76183 82291 87486 90739 94289 97686 100881 103471 106081 108977 111892 114414 116266 118907 121795 124813 125245 125485
Oil 44300 60208 67927 93903 114889 37928 0 0 0 0 0 0 60 60 120 120 180 180 240 240 300 300 360 360 420
small GT 0 0 0 0 0 0 0 0 0 0 0 0 0 0 0 0 0 0 0 0 0 0 0 0 0
Sapugaskanda 6461 7910 9361 7725 3493 6835 0 0 0 0 0 0 0 0 0 0 0 0 0 0 0 0 0 0 0
GT No.7 0 0 0 0 0 0 0 0 0 0 0 0 0 0 0 0 0 0 0 0 0 0 0 0 0
Asia Power 0 0 0 0 0 0 0 0 0 0 0 0 0 0 0 0 0 0 0 0 0 0 0 0 0
KPS CC 13648 18358 20178 17731 20198 13888 0 0 0 0 0 0 0 0 0 0 0 0 0 0 0 0 0 0 0
AES CC 0 0 0 0 0 0 0 0 0 0 0 0 0 0 0 0 0 0 0 0 0 0 0 0 0
West coast CC 24034 31163 33717 25917 2061 15460 0 0 0 0 0 0 0 0 0 0 0 0 0 0 0 0 0 0 0
Northern power 26 0 31 0 0 0 0 0 0 0 0 0 0 0 0 0 0 0 0 0 0 0 0 0 0
Uthurujanani 131 913 1345 97 318 566 0 0 0 0 0 0 0 0 0 0 0 0 0 0 0 0 0 0 0
CEB Barge power 0 0 0 0 0 0 0 0 0 0 0 0 0 0 0 0 0 0 0 0 0 0 0 0 0
Furnace oil 0 1864 3295 272 614 1179 0 0 0 0 0 0 0 0 0 0 0 0 0 0 0 0 0 0 0
New GT 0 0 0 0 0 0 0 0 0 0 0 0 0 0 0 0 0 0 0 0 0 0 0 0 0
New CC 0 0 0 42161 88205 0 0 0 0 0 0 0 0 0 0 0 0 0 0 0 0 0 0 0 0
Back-up GT 0 0 0 0 0 0 0 0 0 0 0 0 60 60 120 120 180 180 240 240 300 300 360 360 420
LNG 0 0 0 0 0 29252 44736 50323 56207 61176 64190 67515 70627 73599 75898 78423 81178 84022 86379 88162 90677 93541 96430 97167 97467
KPS CC (LNG) 0 0 0 0 0 0 1333 245 1322 144 0 91 132 138 607 675 903 0 0 0 0 0 0 0 0
KPS-2 CC (LNG) 0 0 0 0 0 0 0 0 0 0 0 0 0 0 0 0 0 0 0 0 0 0 0 0 0
West coast CC (LNG) 0 0 0 0 0 0 3671 668 1279 83 0 0 0 223 209 319 1086 205 89 183 0 0 92 0 0
New LNG 0 0 0 0 0 29252 39732 49410 53606 60949 64190 67424 70495 73238 75082 77429 79189 83817 86290 87979 90677 93541 96338 97167 97467
Coal 23652 24136 24483 24829 25174 25399 25635 25860 26084 26310 26549 26774 26999 27222 27453 27538 27619 27690 27795 27864 27930 27954 28023 27718 27598
Puttalam 23652 24136 24483 24829 25174 25399 25635 25860 26084 26310 26549 26774 26999 27222 27453 27538 27619 27690 27795 27864 27930 27954 28023 27718 27598
New Coal 0 0 0 0 0 0 0 0 0 0 0 0 0 0 0 0 0 0 0 0 0 0 0 0 0
NCRE 18508 19639 21944 24185 26883 30101 33230 36589 40107 45459 51789 58106 64422 70725 78579 84683 90786 96821 102938 110596 116629 122748 128782 137331 147506
M-hydro 11467 11950 12433 12916 13399 13882 14365 14848 15331 15814 16297 16780 17263 17746 18229 18471 18713 18956 19198 19440 19682 19925 20167 20409 20652
Wind 4782 5056 6425 7795 9571 12074 14577 17080 19584 22087 27093 32100 37106 42113 47119 52126 57132 62139 67145 72152 77158 82165 87172 94681 102191
Solar 0 331 770 1158 1597 1985 2424 2811 3328 4155 4982 5809 6636 7463 8289 9116 9943 10770 11597 12424 13251 14078 14905 15732 16558
Biomass 2259 2302 2316 2316 2316 2160 1864 1850 1864 3403 3417 3417 3417 3403 4942 4970 4998 4956 4998 6580 6538 6580 6538 6509 8105
Total 86460 103983 114354 142917 166946 122680 103601 112772 122398 132945 142528 152395 162108 171606 182050 190764 199763 208713 217352 226862 235536 244543 253595 262576 272991
(USC/kWh) 2016 2017 2018 2019 2020 2021 2022 2023 2024 2025 2026 2027 2028 2029 2030 2031 2032 2033 2034 2035 2036 2037 2038 2039 2040
Thermal 8.5 9.7 10.4 12.3 13.6 8.5 6.3 6.4 6.6 6.8 6.9 7.1 7.2 7.3 7.5 7.5 7.6 7.7 7.7 7.8 7.8 7.9 7.9 8.0 8.0
Oil 17.9 19.2 20.8 23.2 24.3 25.4 0.0 0.0 0.0 0.0 0.0 0.0 20.0 20.0 20.0 20.0 20.0 20.0 20.0 20.0 20.0 20.0 20.0 20.0 20.0
small GT 0.0 0.0 0.0 0.0 0.0 0.0 0.0 0.0 0.0 0.0 0.0 0.0 0.0 0.0 0.0 0.0 0.0 0.0 0.0 0.0 0.0 0.0 0.0 0.0 0.0
Sapugaskanda 15.1 16.6 18.1 19.3 20.8 21.8 0.0 0.0 0.0 0.0 0.0 0.0 0.0 0.0 0.0 0.0 0.0 0.0 0.0 0.0 0.0 0.0 0.0 0.0 0.0
GT No.7 0.0 0.0 0.0 0.0 0.0 0.0 0.0 0.0 0.0 0.0 0.0 0.0 0.0 0.0 0.0 0.0 0.0 0.0 0.0 0.0 0.0 0.0 0.0 0.0 0.0
Asia Power 0.0 0.0 0.0 0.0 0.0 0.0 0.0 0.0 0.0 0.0 0.0 0.0 0.0 0.0 0.0 0.0 0.0 0.0 0.0 0.0 0.0 0.0 0.0 0.0 0.0
KPS CC 15.5 17.0 18.5 19.9 21.4 22.7 0.0 0.0 0.0 0.0 0.0 0.0 0.0 0.0 0.0 0.0 0.0 0.0 0.0 0.0 0.0 0.0 0.0 0.0 0.0
AES CC 0.0 0.0 0.0 0.0 0.0 0.0 0.0 0.0 0.0 0.0 0.0 0.0 0.0 0.0 0.0 0.0 0.0 0.0 0.0 0.0 0.0 0.0 0.0 0.0 0.0
West coast CC 20.9 21.8 23.7 27.3 29.9 31.2 0.0 0.0 0.0 0.0 0.0 0.0 0.0 0.0 0.0 0.0 0.0 0.0 0.0 0.0 0.0 0.0 0.0 0.0 0.0
Northern power 13.0 0.0 15.5 0.0 0.0 0.0 0.0 0.0 0.0 0.0 0.0 0.0 0.0 0.0 0.0 0.0 0.0 0.0 0.0 0.0 0.0 0.0 0.0 0.0 0.0
Uthurujanani 16.4 17.9 19.2 19.4 22.7 23.6 0.0 0.0 0.0 0.0 0.0 0.0 0.0 0.0 0.0 0.0 0.0 0.0 0.0 0.0 0.0 0.0 0.0 0.0 0.0
CEB Barge power 0.0 0.0 0.0 0.0 0.0 0.0 0.0 0.0 0.0 0.0 0.0 0.0 0.0 0.0 0.0 0.0 0.0 0.0 0.0 0.0 0.0 0.0 0.0 0.0 0.0
Furnace oil 0.0 18.3 19.9 20.9 23.6 24.1 0.0 0.0 0.0 0.0 0.0 0.0 0.0 0.0 0.0 0.0 0.0 0.0 0.0 0.0 0.0 0.0 0.0 0.0 0.0
New GT 0.0 0.0 0.0 0.0 0.0 0.0 0.0 0.0 0.0 0.0 0.0 0.0 0.0 0.0 0.0 0.0 0.0 0.0 0.0 0.0 0.0 0.0 0.0 0.0 0.0
New CC 0.0 0.0 0.0 23.5 25.2 0.0 0.0 0.0 0.0 0.0 0.0 0.0 0.0 0.0 0.0 0.0 0.0 0.0 0.0 0.0 0.0 0.0 0.0 0.0 0.0
LNG 0.0 0.0 0.0 0.0 0.0 7.6 7.9 8.0 8.2 8.4 8.5 8.7 8.9 9.0 9.2 9.2 9.2 9.3 9.3 9.4 9.4 9.4 9.5 9.5 9.5
KPS CC (LNG) 0.0 0.0 0.0 0.0 0.0 0.0 8.5 8.8 8.8 9.0 0.0 9.1 9.4 9.9 10.1 10.2 10.1 0.0 0.0 0.0 0.0 0.0 0.0 0.0 0.0
KPS-2 CC (LNG) 0.0 0.0 0.0 0.0 0.0 0.0 0.0 0.0 0.0 0.0 0.0 0.0 0.0 0.0 0.0 0.0 0.0 0.0 0.0 0.0 0.0 0.0 0.0 0.0 0.0
West coast CC (LNG) 0.0 0.0 0.0 0.0 0.0 0.0 9.0 9.2 9.3 9.2 0.0 0.0 0.0 9.7 10.0 10.3 10.5 10.3 11.1 10.8 0.0 0.0 11.5 0.0 0.0
New LNG 0.0 0.0 0.0 0.0 0.0 7.6 7.8 8.0 8.1 8.4 8.5 8.7 8.9 9.0 9.2 9.2 9.2 9.3 9.3 9.4 9.4 9.4 9.5 9.5 9.5
Coal 4.3 4.3 4.4 4.5 4.5 4.6 4.6 4.6 4.7 4.7 4.8 4.8 4.8 4.9 4.9 4.9 5.0 5.0 5.0 5.0 5.0 5.0 5.0 5.1 5.1
Puttalam 4.3 4.3 4.4 4.5 4.5 4.6 4.6 4.6 4.7 4.7 4.8 4.8 4.8 4.9 4.9 4.9 5.0 5.0 5.0 5.0 5.0 5.0 5.0 5.1 5.1
New Coal 0.0 0.0 0.0 0.0 0.0 0.0 0.0 0.0 0.0 0.0 0.0 0.0 0.0 0.0 0.0 0.0 0.0 0.0 0.0 0.0 0.0 0.0 0.0 0.0 0.0
NCRE 11.8 11.3 10.6 10.2 9.7 9.4 9.0 8.8 8.7 8.6 8.4 8.2 8.1 8.0 8.0 8.0 7.9 7.8 7.8 7.8 7.8 7.7 7.7 7.7 7.7
M-hydro 10.7 10.5 10.3 10.1 10.0 9.9 9.8 9.6 9.5 9.5 9.4 9.3 9.2 9.2 9.1 9.1 9.0 9.0 9.0 9.0 8.9 8.9 8.9 8.9 8.8
Wind 14.0 13.4 11.4 10.4 9.7 9.1 8.8 8.5 8.4 8.2 8.1 8.0 7.9 7.8 7.8 7.7 7.7 7.7 7.7 7.6 7.6 7.6 7.6 7.6 7.6
Solar 0.0 6.0 6.0 6.0 6.0 6.0 6.0 6.0 6.0 6.0 6.0 6.0 6.0 6.0 6.0 6.0 6.0 6.0 6.0 6.0 6.0 6.0 6.0 6.0 6.0
Biomass 14.1 14.1 14.1 14.1 14.1 14.1 14.1 14.1 14.1 14.1 14.1 14.1 14.1 14.1 14.1 14.1 14.1 14.1 14.1 14.1 14.1 14.1 14.1 14.1 14.1
Total 6.2 7.0 7.2 8.5 9.3 6.4 5.1 5.3 5.5 5.7 5.8 5.9 6.1 6.2 6.3 6.3 6.4 6.5 6.5 6.6 6.6 6.6 6.7 6.7 6.8
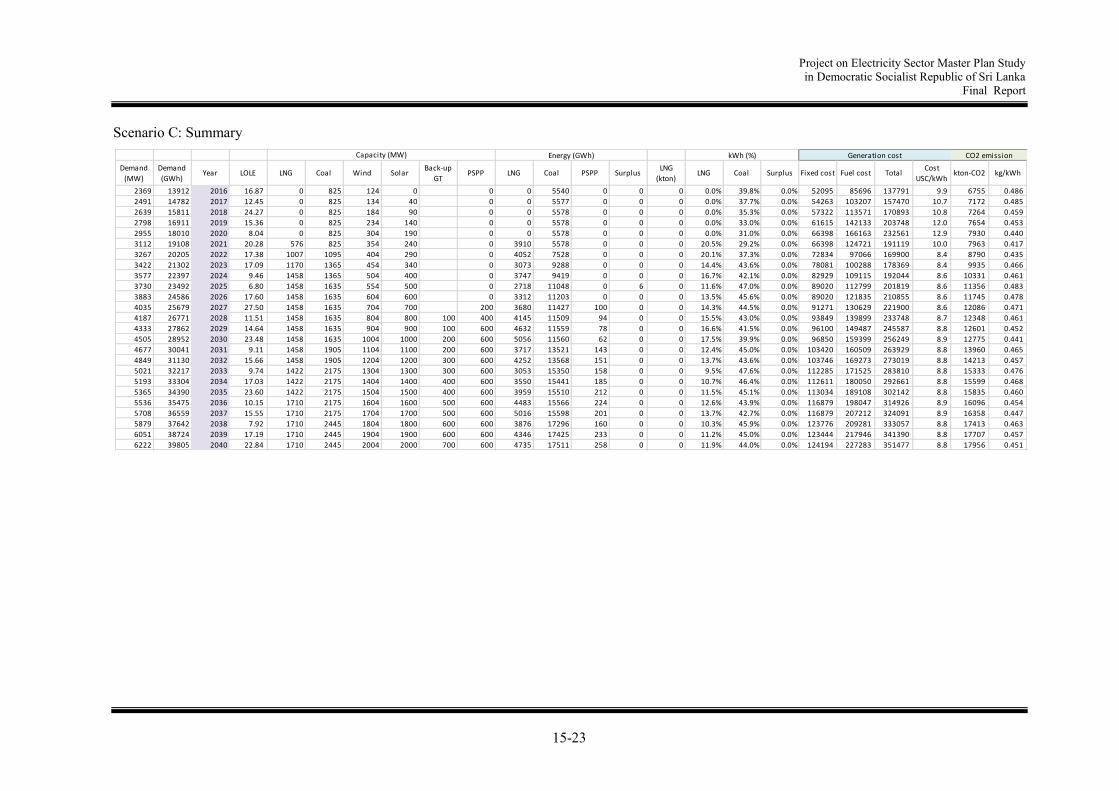
Project on Electricity Sector Master Plan Study in Democratic Socialist Republic of Sri Lanka
Final Report
15-23
Scenario C: Summary
Demand
(MW)
Demand
(GWh)Year LOLE LNG Coal Wind Solar
Back-up
GTPSPP LNG Coal PSPP Surplus
LNG
(kton)LNG Coal Surplus Fixed cost Fuel cost Total
Cost
USC/kWhkton-CO2 kg/kWh
2369 13912 2016 16.87 0 825 124 0 0 0 5540 0 0 0 0.0% 39.8% 0.0% 52095 85696 137791 9.9 6755 0.486
2491 14782 2017 12.45 0 825 134 40 0 0 5577 0 0 0 0.0% 37.7% 0.0% 54263 103207 157470 10.7 7172 0.485
2639 15811 2018 24.27 0 825 184 90 0 0 5578 0 0 0 0.0% 35.3% 0.0% 57322 113571 170893 10.8 7264 0.459
2798 16911 2019 15.36 0 825 234 140 0 0 5578 0 0 0 0.0% 33.0% 0.0% 61615 142133 203748 12.0 7654 0.453
2955 18010 2020 8.04 0 825 304 190 0 0 5578 0 0 0 0.0% 31.0% 0.0% 66398 166163 232561 12.9 7930 0.440
3112 19108 2021 20.28 576 825 354 240 0 3910 5578 0 0 0 20.5% 29.2% 0.0% 66398 124721 191119 10.0 7963 0.417
3267 20205 2022 17.38 1007 1095 404 290 0 4052 7528 0 0 0 20.1% 37.3% 0.0% 72834 97066 169900 8.4 8790 0.435
3422 21302 2023 17.09 1170 1365 454 340 0 3073 9288 0 0 0 14.4% 43.6% 0.0% 78081 100288 178369 8.4 9935 0.466
3577 22397 2024 9.46 1458 1365 504 400 0 3747 9419 0 0 0 16.7% 42.1% 0.0% 82929 109115 192044 8.6 10331 0.461
3730 23492 2025 6.80 1458 1635 554 500 0 2718 11048 0 6 0 11.6% 47.0% 0.0% 89020 112799 201819 8.6 11356 0.483
3883 24586 2026 17.60 1458 1635 604 600 0 3312 11203 0 0 0 13.5% 45.6% 0.0% 89020 121835 210855 8.6 11745 0.478
4035 25679 2027 27.50 1458 1635 704 700 200 3680 11427 100 0 0 14.3% 44.5% 0.0% 91271 130629 221900 8.6 12086 0.471
4187 26771 2028 11.51 1458 1635 804 800 100 400 4145 11509 94 0 0 15.5% 43.0% 0.0% 93849 139899 233748 8.7 12348 0.461
4333 27862 2029 14.64 1458 1635 904 900 100 600 4632 11559 78 0 0 16.6% 41.5% 0.0% 96100 149487 245587 8.8 12601 0.452
4505 28952 2030 23.48 1458 1635 1004 1000 200 600 5056 11560 62 0 0 17.5% 39.9% 0.0% 96850 159399 256249 8.9 12775 0.441
4677 30041 2031 9.11 1458 1905 1104 1100 200 600 3717 13521 143 0 0 12.4% 45.0% 0.0% 103420 160509 263929 8.8 13960 0.465
4849 31130 2032 15.66 1458 1905 1204 1200 300 600 4252 13568 151 0 0 13.7% 43.6% 0.0% 103746 169273 273019 8.8 14213 0.457
5021 32217 2033 9.74 1422 2175 1304 1300 300 600 3053 15350 158 0 0 9.5% 47.6% 0.0% 112285 171525 283810 8.8 15333 0.476
5193 33304 2034 17.03 1422 2175 1404 1400 400 600 3550 15441 185 0 0 10.7% 46.4% 0.0% 112611 180050 292661 8.8 15599 0.468
5365 34390 2035 23.60 1422 2175 1504 1500 400 600 3959 15510 212 0 0 11.5% 45.1% 0.0% 113034 189108 302142 8.8 15835 0.460
5536 35475 2036 10.15 1710 2175 1604 1600 500 600 4483 15566 224 0 0 12.6% 43.9% 0.0% 116879 198047 314926 8.9 16096 0.454
5708 36559 2037 15.55 1710 2175 1704 1700 500 600 5016 15598 201 0 0 13.7% 42.7% 0.0% 116879 207212 324091 8.9 16358 0.447
5879 37642 2038 7.92 1710 2445 1804 1800 600 600 3876 17296 160 0 0 10.3% 45.9% 0.0% 123776 209281 333057 8.8 17413 0.463
6051 38724 2039 17.19 1710 2445 1904 1900 600 600 4346 17425 233 0 0 11.2% 45.0% 0.0% 123444 217946 341390 8.8 17707 0.457
6222 39805 2040 22.84 1710 2445 2004 2000 700 600 4735 17511 258 0 0 11.9% 44.0% 0.0% 124194 227283 351477 8.8 17956 0.451
Capacity (MW) Energy (GWh) kWh (%) Generation cost CO2 emission

Project on Electricity Sector Master Plan Study in Democratic Socialist Republic of Sri Lanka
Final Report
15-24
Scenario C: Capacity (kW) balance
(MW) 2016 2017 2018 2019 2020 2021 2022 2023 2024 2025 2026 2027 2028 2029 2030 2031 2032 2033 2034 2035 2036 2037 2038 2039 2040
Hydro 1374 1374 1529 1529 1544 1544 1640 1640 1640 1640 1640 1840 2040 2240 2240 2240 2240 2240 2240 2240 2240 2240 2240 2240 2240
Conventional 1374 1374 1529 1529 1544 1544 1640 1640 1640 1640 1640 1640 1640 1640 1640 1640 1640 1640 1640 1640 1640 1640 1640 1640 1640
PSPP 0 0 0 0 0 0 0 0 0 0 0 200 400 600 600 600 600 600 600 600 600 600 600 600 600
Thermal 1906 2076 2030 2283 2541 2541 2641 2761 3049 3224 3224 3224 3324 3324 3424 3694 3794 4028 4128 4128 4516 4516 4886 4860 4960
Oil 1081 1251 1205 1458 1716 1140 539 226 226 131 131 131 231 231 331 331 431 431 531 531 631 631 731 705 805
small GT 65 65 0 0 0 0 0 0 0 0 0 0 0 0 0 0 0 0 0 0 0 0 0 0 0
Sapugaskanda 140 140 140 70 70 70 70 35 35 0 0 0 0 0 0 0 0 0 0 0 0 0 0 0 0
GT No.7 115 115 115 115 115 115 115 0 0 0 0 0 0 0 0 0 0 0 0 0 0 0 0 0 0
Asia Power 51 51 0 0 0 0 0 0 0 0 0 0 0 0 0 0 0 0 0 0 0 0 0 0 0
KPS CC 161 161 161 161 161 161 0 0 0 0 0 0 0 0 0 0 0 0 0 0 0 0 0 0 0
AES CC 163 163 163 163 163 163 163 0 0 0 0 0 0 0 0 0 0 0 0 0 0 0 0 0 0
West coast CC 270 270 270 270 270 270 0 0 0 0 0 0 0 0 0 0 0 0 0 0 0 0 0 0 0
Northern power 30 30 30 30 0 0 0 0 0 0 0 0 0 0 0 0 0 0 0 0 0 0 0 0 0
Uthurujanani 26 26 26 26 26 26 26 26 26 26 26 26 26 26 26 26 26 26 26 26 26 26 26 0 0
CEB Barge power 60 60 60 60 60 60 60 60 60 0 0 0 0 0 0 0 0 0 0 0 0 0 0 0 0
Furnace oil 0 170 170 170 170 170 0 0 0 0 0 0 0 0 0 0 0 0 0 0 0 0 0 0 0
New GT 0 0 70 105 105 105 105 105 105 105 105 105 105 105 105 105 105 105 105 105 105 105 105 105 105
New CC 0 0 0 288 576 0 0 0 0 0 0 0 0 0 0 0 0 0 0 0 0 0 0 0 0
Back-up GT 0 0 0 0 0 0 0 0 0 0 0 0 100 100 200 200 300 300 400 400 500 500 600 600 700
LNG 0 0 0 0 0 576 1007 1170 1458 1458 1458 1458 1458 1458 1458 1458 1458 1422 1422 1422 1710 1710 1710 1710 1710
KPS CC (LNG) 0 0 0 0 0 0 161 161 161 161 161 161 161 161 161 161 161 0 0 0 0 0 0 0 0
KPS-2 CC (LNG) 0 0 0 0 0 0 0 163 163 163 163 163 163 163 163 163 163 0 0 0 0 0 0 0 0
West coast CC (LNG) 0 0 0 0 0 0 270 270 270 270 270 270 270 270 270 270 270 270 270 270 270 270 270 270 270
New LNG 0 0 0 0 0 576 576 576 864 864 864 864 864 864 864 864 864 1152 1152 1152 1440 1440 1440 1440 1440
Coal 825 825 825 825 825 825 1095 1365 1365 1635 1635 1635 1635 1635 1635 1905 1905 2175 2175 2175 2175 2175 2445 2445 2445
Puttalam 825 825 825 825 825 825 825 825 825 825 825 825 825 825 825 825 825 825 825 825 825 825 825 825 825
New Coal 0 0 0 0 0 0 270 540 540 810 810 810 810 810 810 1080 1080 1350 1350 1350 1350 1350 1620 1620 1620
NCRE 471 541 661 781 921 1041 1161 1281 1411 1601 1771 1991 2211 2431 2671 2881 3091 3301 3511 3741 3951 4161 4371 4581 4811
M-hydro 323 343 363 383 403 423 443 463 483 503 523 543 563 583 603 613 623 633 643 653 663 673 683 693 703
Wind 124 134 184 234 304 354 404 454 504 554 604 704 804 904 1004 1104 1204 1304 1404 1504 1604 1704 1804 1904 2004
Solar 0 40 90 140 190 240 290 340 400 500 600 700 800 900 1000 1100 1200 1300 1400 1500 1600 1700 1800 1900 2000
Biomass 24 24 24 24 24 24 24 24 24 44 44 44 44 44 64 64 64 64 64 84 84 84 84 84 104
Total 3751 3991 4220 4593 5006 5126 5442 5682 6100 6465 6635 7055 7575 7995 8335 8815 9125 9569 9879 10109 10707 10917 11497 11681 12011
(GW) 2016 2017 2018 2019 2020 2021 2022 2023 2024 2025 2026 2027 2028 2029 2030 2031 2032 2033 2034 2035 2036 2037 2038 2039 2040
Coal 0.8 0.8 0.8 0.8 0.8 0.8 1.1 1.4 1.4 1.6 1.6 1.6 1.6 1.6 1.6 1.9 1.9 2.2 2.2 2.2 2.2 2.2 2.4 2.4 2.4
LNG (Gas) 0.0 0.0 0.0 0.0 0.0 0.6 1.0 1.2 1.5 1.5 1.5 1.5 1.5 1.5 1.5 1.5 1.5 1.4 1.4 1.4 1.7 1.7 1.7 1.7 1.7
Oil 1.1 1.3 1.2 1.5 1.7 1.1 0.5 0.2 0.2 0.1 0.1 0.1 0.2 0.2 0.3 0.3 0.4 0.4 0.5 0.5 0.6 0.6 0.7 0.7 0.8
PSPP 0.0 0.0 0.0 0.0 0.0 0.0 0.0 0.0 0.0 0.0 0.0 0.2 0.4 0.6 0.6 0.6 0.6 0.6 0.6 0.6 0.6 0.6 0.6 0.6 0.6
Hydro 1.7 1.7 1.9 1.9 1.9 2.0 2.1 2.1 2.1 2.1 2.2 2.2 2.2 2.2 2.2 2.3 2.3 2.3 2.3 2.3 2.3 2.3 2.3 2.3 2.3
Wind 0.1 0.1 0.2 0.2 0.3 0.4 0.4 0.5 0.5 0.6 0.6 0.7 0.8 0.9 1.0 1.1 1.2 1.3 1.4 1.5 1.6 1.7 1.8 1.9 2.0
Solar 0.0 0.0 0.1 0.1 0.2 0.2 0.3 0.3 0.4 0.5 0.6 0.7 0.8 0.9 1.0 1.1 1.2 1.3 1.4 1.5 1.6 1.7 1.8 1.9 2.0
Biomass 0.0 0.0 0.0 0.0 0.0 0.0 0.0 0.0 0.0 0.0 0.0 0.0 0.0 0.0 0.1 0.1 0.1 0.1 0.1 0.1 0.1 0.1 0.1 0.1 0.1
Total 3.8 4.0 4.2 4.6 5.0 5.1 5.4 5.7 6.1 6.5 6.6 7.1 7.6 8.0 8.3 8.8 9.1 9.6 9.9 10.1 10.7 10.9 11.5 11.7 12.0
2016 2017 2018 2019 2020 2021 2022 2023 2024 2025 2026 2027 2028 2029 2030 2031 2032 2033 2034 2035 2036 2037 2038 2039 2040
Coal 22.0% 20.7% 19.5% 18.0% 16.5% 16.1% 20.1% 24.0% 22.4% 25.3% 24.6% 23.2% 21.6% 20.5% 19.6% 21.6% 20.9% 22.7% 22.0% 21.5% 20.3% 19.9% 21.3% 20.9% 20.4%
LNG (Gas) 0.0% 0.0% 0.0% 0.0% 0.0% 11.2% 18.5% 20.6% 23.9% 22.6% 22.0% 20.7% 19.2% 18.2% 17.5% 16.5% 16.0% 14.9% 14.4% 14.1% 16.0% 15.7% 14.9% 14.6% 14.2%
Oil 28.8% 31.3% 28.6% 31.7% 34.3% 22.2% 9.9% 4.0% 3.7% 2.0% 2.0% 1.9% 3.0% 2.9% 4.0% 3.8% 4.7% 4.5% 5.4% 5.3% 5.9% 5.8% 6.4% 6.0% 6.7%
PSPP 0.0% 0.0% 0.0% 0.0% 0.0% 0.0% 0.0% 0.0% 0.0% 0.0% 0.0% 2.8% 5.3% 7.5% 7.2% 6.8% 6.6% 6.3% 6.1% 5.9% 5.6% 5.5% 5.2% 5.1% 5.0%
Hydro 45.2% 43.0% 44.8% 41.6% 38.9% 38.4% 38.3% 37.0% 34.8% 33.1% 32.6% 30.9% 29.1% 27.8% 26.9% 25.6% 24.8% 23.8% 23.1% 22.7% 21.5% 21.2% 20.2% 20.0% 19.5%
Wind 3.3% 3.4% 4.4% 5.1% 6.1% 6.9% 7.4% 8.0% 8.3% 8.6% 9.1% 10.0% 10.6% 11.3% 12.0% 12.5% 13.2% 13.6% 14.2% 14.9% 15.0% 15.6% 15.7% 16.3% 16.7%
Solar 0.0% 1.0% 2.1% 3.0% 3.8% 4.7% 5.3% 6.0% 6.6% 7.7% 9.0% 9.9% 10.6% 11.3% 12.0% 12.5% 13.2% 13.6% 14.2% 14.8% 14.9% 15.6% 15.7% 16.3% 16.7%
Biomass 0.6% 0.6% 0.6% 0.5% 0.5% 0.5% 0.4% 0.4% 0.4% 0.7% 0.7% 0.6% 0.6% 0.6% 0.8% 0.7% 0.7% 0.7% 0.6% 0.8% 0.8% 0.8% 0.7% 0.7% 0.9%
Total 100.0% 100.0% 100.0% 100.0% 100.0% 100.0% 100.0% 100.0% 100.0% 100.0% 100.0% 100.0% 100.0% 100.0% 100.0% 100.0% 100.0% 100.0% 100.0% 100.0% 100.0% 100.0% 100.0% 100.0% 100.0%

Project on Electricity Sector Master Plan Study in Democratic Socialist Republic of Sri Lanka
Final Report
15-25
Scenario C: Energy (kWh) balance
(million kWh) 2016 2017 2018 2019 2020 2021 2022 2023 2024 2025 2026 2027 2028 2029 2030 2031 2032 2033 2034 2035 2036 2037 2038 2039 2040
Hydro 4330 4330 4902 4902 4954 4954 5307 5307 5307 5307 5307 5407 5401 5385 5369 5450 5458 5465 5492 5519 5531 5508 5467 5540 5565
Conventional 4330 4330 4902 4902 4954 4954 5307 5307 5307 5307 5307 5307 5307 5307 5307 5307 5307 5307 5307 5307 5307 5307 5307 5307 5307
PSPP 0 0 0 0 0 0 0 0 0 0 0 100 94 78 62 143 151 158 185 212 224 201 160 233 258
Thermal 8008 8715 8848 9631 10297 11138 11580 12361 13166 13766 14515 15107 15657 16194 16622 17244 17829 18412 19003 19481 20064 20629 21190 21789 22267
Oil 2468 3138 3270 4053 4719 1650 0 0 0 0 0 0 3 3 6 6 9 9 12 12 15 15 18 18 21
small GT 0 0 0 0 0 0 0 0 0 0 0 0 0 0 0 0 0 0 0 0 0 0 0 0 0
Sapugaskanda 428 477 516 400 168 314 0 0 0 0 0 0 0 0 0 0 0 0 0 0 0 0 0 0 0
GT No.7 0 0 0 0 0 0 0 0 0 0 0 0 0 0 0 0 0 0 0 0 0 0 0 0 0
Asia Power 0 0 0 0 0 0 0 0 0 0 0 0 0 0 0 0 0 0 0 0 0 0 0 0 0
KPS CC 878 1079 1091 891 944 720 0 0 0 0 0 0 0 0 0 0 0 0 0 0 0 0 0 0 0
AES CC 0 0 0 0 0 0 0 0 0 0 0 0 0 0 0 0 0 0 0 0 0 0 0 0 0
West coast CC 1152 1429 1425 950 69 520 0 0 0 0 0 0 0 0 0 0 0 0 0 0 0 0 0 0 0
Northern power 2 0 2 0 0 0 0 0 0 0 0 0 0 0 0 0 0 0 0 0 0 0 0 0 0
Uthurujanani 8 51 70 5 14 18 0 0 0 0 0 0 0 0 0 0 0 0 0 0 0 0 0 0 0
CEB Barge power 0 0 0 0 0 0 0 0 0 0 0 0 0 0 0 0 0 0 0 0 0 0 0 0 0
Furnace oil 0 102 166 13 26 78 0 0 0 0 0 0 0 0 0 0 0 0 0 0 0 0 0 0 0
New GT 0 0 0 0 0 0 0 0 0 0 0 0 0 0 0 0 0 0 0 0 0 0 0 0 0
New CC 0 0 0 1794 3498 0 0 0 0 0 0 0 0 0 0 0 0 0 0 0 0 0 0 0 0
Back-up GT 0 0 0 0 0 0 0 0 0 0 0 0 3 3 6 6 9 9 12 12 15 15 18 18 21
LNG 0 0 0 0 0 3910 4052 3073 3747 2718 3312 3680 4145 4632 5056 3717 4252 3053 3550 3959 4483 5016 3876 4346 4735
KPS CC (LNG) 0 0 0 0 0 0 226 74 21 0 19 26 43 189 174 15 165 0 0 0 0 0 0 0 0
KPS-2 CC (LNG) 0 0 0 0 0 0 0 0 0 0 0 0 0 0 11 0 0 0 0 0 0 0 0 0 0
West coast CC (LNG) 0 0 0 0 0 0 587 179 0 0 0 18 103 139 309 91 62 0 10 34 0 23 0 15 23
New LNG 0 0 0 0 0 3910 3239 2820 3726 2718 3293 3636 3999 4304 4562 3611 4025 3053 3540 3925 4483 4993 3876 4331 4712
Coal 5540 5577 5578 5578 5578 5578 7528 9288 9419 11048 11203 11427 11509 11559 11560 13521 13568 15350 15441 15510 15566 15598 17296 17425 17511
Puttalam 5540 5577 5578 5578 5578 5578 5517 5365 5429 5290 5340 5459 5504 5530 5530 5504 5531 5422 5447 5484 5516 5542 5428 5455 5488
New Coal 0 0 0 0 0 0 2011 3923 3990 5758 5863 5968 6005 6029 6030 8017 8037 9928 9994 10026 10050 10056 11868 11970 12023
NCRE 1575 1737 2062 2378 2758 3016 3318 3634 3924 4426 4764 5307 5850 6397 7052 7556 8067 8573 9084 9704 10213 10722 11231 11743 12361
M-hydro 1074 1141 1207 1273 1340 1406 1473 1539 1606 1672 1738 1805 1871 1938 2004 2038 2071 2104 2138 2171 2204 2238 2271 2304 2337
Wind 341 378 563 748 988 1125 1310 1495 1632 1818 1955 2293 2631 2970 3308 3646 3985 4323 4661 4999 5338 5676 6014 6352 6691
Solar 0 55 128 193 266 331 404 469 555 692 830 968 1106 1244 1382 1519 1657 1795 1933 2071 2208 2346 2484 2622 2760
Biomass 160 163 164 164 164 154 131 131 131 244 241 241 242 245 358 353 354 351 352 463 463 462 462 465 573
Total 13913 14782 15812 16911 18009 19108 20205 21302 22397 23499 24586 25821 26908 27976 29043 30250 31354 32450 33579 34704 35808 36859 37888 39072 40193
Surplus 0 0 0 0 0 0 0 0 0 6 0 0 0 0 0 0 0 0 0 0 0 0 0 0 0
Shortage 0 0 0 0 0 0 0 0 0 0 0 0 0 0 0 0 0 0 0 0 0 0 0 0 0
Pumping-up 0 0 0 0 0 0 0 0 0 0 0 (143) (135) (111) (86) (203) (214) (224) (263) (301) (318) (285) (228) (331) (366)
2016 2017 2018 2019 2020 2021 2022 2023 2024 2025 2026 2027 2028 2029 2030 2031 2032 2033 2034 2035 2036 2037 2038 2039 2040
Coal 5.5 5.6 5.6 5.6 5.6 5.6 7.5 9.3 9.4 11.0 11.2 11.4 11.5 11.6 11.6 13.5 13.6 15.4 15.4 15.5 15.6 15.6 17.3 17.4 17.5
LNG (Gas) 0.0 0.0 0.0 0.0 0.0 3.9 4.1 3.1 3.7 2.7 3.3 3.7 4.1 4.6 5.1 3.7 4.3 3.1 3.6 4.0 4.5 5.0 3.9 4.3 4.7
Oil 2.5 3.1 3.3 4.1 4.7 1.7 0.0 0.0 0.0 0.0 0.0 0.0 0.0 0.0 0.0 0.0 0.0 0.0 0.0 0.0 0.0 0.0 0.0 0.0 0.0
PSPP 0.0 0.0 0.0 0.0 0.0 0.0 0.0 0.0 0.0 0.0 0.0 0.1 0.1 0.1 0.1 0.1 0.2 0.2 0.2 0.2 0.2 0.2 0.2 0.2 0.3
Hydro 5.4 5.5 6.1 6.2 6.3 6.4 6.8 6.8 6.9 7.0 7.0 7.1 7.2 7.2 7.3 7.3 7.4 7.4 7.4 7.5 7.5 7.5 7.6 7.6 7.6
Wind 0.3 0.4 0.6 0.7 1.0 1.1 1.3 1.5 1.6 1.8 2.0 2.3 2.6 3.0 3.3 3.6 4.0 4.3 4.7 5.0 5.3 5.7 6.0 6.4 6.7
Solar 0.0 0.1 0.1 0.2 0.3 0.3 0.4 0.5 0.6 0.7 0.8 1.0 1.1 1.2 1.4 1.5 1.7 1.8 1.9 2.1 2.2 2.3 2.5 2.6 2.8
Biomass 0.2 0.2 0.2 0.2 0.2 0.2 0.1 0.1 0.1 0.2 0.2 0.2 0.2 0.2 0.4 0.4 0.4 0.4 0.4 0.5 0.5 0.5 0.5 0.5 0.6
Total 13.9 14.8 15.8 16.9 18.0 19.1 20.2 21.3 22.4 23.5 24.6 25.8 26.9 28.0 29.0 30.3 31.4 32.5 33.6 34.7 35.8 36.9 37.9 39.1 40.2
2016 2017 2018 2019 2020 2021 2022 2023 2024 2025 2026 2027 2028 2029 2030 2031 2032 2033 2034 2035 2036 2037 2038 2039 2040
Coal 39.8% 37.7% 35.3% 33.0% 31.0% 29.2% 37.3% 43.6% 42.1% 47.0% 45.6% 44.3% 42.8% 41.3% 39.8% 44.7% 43.3% 47.3% 46.0% 44.7% 43.5% 42.3% 45.7% 44.6% 43.6%
LNG (Gas) 0.0% 0.0% 0.0% 0.0% 0.0% 20.5% 20.1% 14.4% 16.7% 11.6% 13.5% 14.3% 15.4% 16.6% 17.4% 12.3% 13.6% 9.4% 10.6% 11.4% 12.5% 13.6% 10.2% 11.1% 11.8%
Oil 17.7% 21.2% 20.7% 24.0% 26.2% 8.6% 0.0% 0.0% 0.0% 0.0% 0.0% 0.0% 0.0% 0.0% 0.0% 0.0% 0.0% 0.0% 0.0% 0.0% 0.0% 0.0% 0.0% 0.0% 0.1%
PSPP 0.0% 0.0% 0.0% 0.0% 0.0% 0.0% 0.0% 0.0% 0.0% 0.0% 0.0% 0.4% 0.3% 0.3% 0.2% 0.5% 0.5% 0.5% 0.6% 0.6% 0.6% 0.5% 0.4% 0.6% 0.6%
Hydro 38.8% 37.0% 38.6% 36.5% 34.9% 33.3% 33.6% 32.1% 30.9% 29.7% 28.7% 27.5% 26.7% 25.9% 25.2% 24.3% 23.5% 22.8% 22.2% 21.5% 21.0% 20.5% 20.0% 19.5% 19.0%
Wind 2.5% 2.6% 3.6% 4.4% 5.5% 5.9% 6.5% 7.0% 7.3% 7.7% 8.0% 8.9% 9.8% 10.6% 11.4% 12.1% 12.7% 13.3% 13.9% 14.4% 14.9% 15.4% 15.9% 16.3% 16.6%
Solar 0.0% 0.4% 0.8% 1.1% 1.5% 1.7% 2.0% 2.2% 2.5% 2.9% 3.4% 3.7% 4.1% 4.4% 4.8% 5.0% 5.3% 5.5% 5.8% 6.0% 6.2% 6.4% 6.6% 6.7% 6.9%
Biomass 1.2% 1.1% 1.0% 1.0% 0.9% 0.8% 0.6% 0.6% 0.6% 1.0% 1.0% 0.9% 0.9% 0.9% 1.2% 1.2% 1.1% 1.1% 1.0% 1.3% 1.3% 1.3% 1.2% 1.2% 1.4%
Total 100.0% 100.0% 100.0% 100.0% 100.0% 100.0% 100.0% 100.0% 100.0% 100.0% 100.0% 100.0% 100.0% 100.0% 100.0% 100.0% 100.0% 100.0% 100.0% 100.0% 100.0% 100.0% 100.0% 100.0% 100.0%

Project on Electricity Sector Master Plan Study in Democratic Socialist Republic of Sri Lanka
Final Report
15-26
Scenario C: Fuel balance
(mill ion USC) 2016 2017 2018 2019 2020 2021 2022 2023 2024 2025 2026 2027 2028 2029 2030 2031 2032 2033 2034 2035 2036 2037 2038 2039 2040
Thermal 67952 84344 92410 118732 140063 96821 67058 68039 74852 74782 81513 86492 91946 97691 102710 100289 105477 104177 109120 113547 118915 124512 123008 128079 132805
Oil 44300 60208 67927 93903 114889 41877 0 0 0 0 0 0 60 60 120 120 180 180 240 240 300 300 360 360 420
small GT 0 0 0 0 0 0 0 0 0 0 0 0 0 0 0 0 0 0 0 0 0 0 0 0 0
Sapugaskanda 6461 7910 9361 7725 3493 6823 0 0 0 0 0 0 0 0 0 0 0 0 0 0 0 0 0 0 0
GT No.7 0 0 0 0 0 0 0 0 0 0 0 0 0 0 0 0 0 0 0 0 0 0 0 0 0
Asia Power 0 0 0 0 0 0 0 0 0 0 0 0 0 0 0 0 0 0 0 0 0 0 0 0 0
KPS CC 13648 18358 20178 17731 20198 16363 0 0 0 0 0 0 0 0 0 0 0 0 0 0 0 0 0 0 0
AES CC 0 0 0 0 0 0 0 0 0 0 0 0 0 0 0 0 0 0 0 0 0 0 0 0 0
West coast CC 24034 31163 33717 25917 2061 16408 0 0 0 0 0 0 0 0 0 0 0 0 0 0 0 0 0 0 0
Northern power 26 0 31 0 0 0 0 0 0 0 0 0 0 0 0 0 0 0 0 0 0 0 0 0 0
Uthurujanani 131 913 1345 97 318 411 0 0 0 0 0 0 0 0 0 0 0 0 0 0 0 0 0 0 0
CEB Barge power 0 0 0 0 0 0 0 0 0 0 0 0 0 0 0 0 0 0 0 0 0 0 0 0 0
Furnace oil 0 1864 3295 272 614 1872 0 0 0 0 0 0 0 0 0 0 0 0 0 0 0 0 0 0 0
New GT 0 0 0 0 0 0 0 0 0 0 0 0 0 0 0 0 0 0 0 0 0 0 0 0 0
New CC 0 0 0 42161 88205 0 0 0 0 0 0 0 0 0 0 0 0 0 0 0 0 0 0 0 0
Back-up GT 0 0 0 0 0 0 0 0 0 0 0 0 60 60 120 120 180 180 240 240 300 300 360 360 420LNG 0 0 0 0 0 29545 32959 25916 31799 24027 29650 33208 37788 42850 47343 35619 40316 30451 34699 38571 43393 48622 38700 42925 46952
KPS CC (LNG) 0 0 0 0 0 0 1890 651 185 0 175 248 418 1874 1744 155 1685 0 0 0 0 0 0 0 0
KPS-2 CC (LNG) 0 0 0 0 0 0 0 0 0 0 0 0 0 0 120 0 0 0 0 0 0 0 0 0 0
West coast CC (LNG) 0 0 0 0 0 0 5238 1650 0 0 0 176 1045 1406 3200 959 639 0 108 374 0 254 0 169 258
New LNG 0 0 0 0 0 29545 25831 23615 31614 24027 29475 32784 36325 39570 42279 34505 37992 30451 34591 38197 43393 48368 38700 42756 46694
Coal 23652 24136 24483 24829 25174 25399 34099 42123 43053 50755 51863 53284 54098 54781 55247 64550 64981 73546 74181 74736 75222 75590 83948 84794 85433
Puttalam 23652 24136 24483 24829 25174 25399 25365 24904 25413 24998 25453 26225 26654 27003 27239 27194 27415 26969 27182 27438 27683 27888 27422 27634 27875
New Coal 0 0 0 0 0 0 8734 17219 17640 25757 26410 27059 27444 27778 28008 37356 37566 46577 46999 47298 47539 47702 56526 57160 57558
NCRE 18508 19639 21944 24185 26883 28628 30595 32835 34851 39125 41410 45223 49050 52905 58314 61815 65401 68932 72519 77659 81231 84789 88362 91977 97074
M-hydro 11467 11950 12433 12916 13399 13882 14365 14848 15331 15814 16297 16780 17263 17746 18229 18471 18713 18956 19198 19440 19682 19925 20167 20409 20652
Wind 4782 5056 6425 7795 9571 10587 11956 13326 14342 15711 16728 19231 21734 24237 26741 29244 31747 34250 36754 39257 41760 44263 46767 49270 51773
Solar 0 331 770 1158 1597 1985 2424 2811 3328 4155 4982 5809 6636 7463 8289 9116 9943 10770 11597 12424 13251 14078 14905 15732 16558
Biomass 2259 2302 2316 2316 2316 2174 1850 1850 1850 3445 3403 3403 3417 3459 5055 4984 4998 4956 4970 6538 6538 6523 6523 6566 8091
Total 86460 103983 114354 142917 166946 125449 97653 100874 109703 113907 122923 131715 140996 150596 161024 162104 170878 173109 181639 191206 200146 209301 211370 220056 229879
(USC/kWh) 2016 2017 2018 2019 2020 2021 2022 2023 2024 2025 2026 2027 2028 2029 2030 2031 2032 2033 2034 2035 2036 2037 2038 2039 2040
Thermal 8.5 9.7 10.4 12.3 13.6 8.7 5.8 5.5 5.7 5.4 5.6 5.7 5.9 6.0 6.2 5.8 5.9 5.7 5.7 5.8 5.9 6.0 5.8 5.9 6.0
Oil 17.9 19.2 20.8 23.2 24.3 25.4 0.0 0.0 0.0 0.0 0.0 0.0 20.0 20.0 20.0 20.0 20.0 20.0 20.0 20.0 20.0 20.0 20.0 20.0 20.0
small GT 0.0 0.0 0.0 0.0 0.0 0.0 0.0 0.0 0.0 0.0 0.0 0.0 0.0 0.0 0.0 0.0 0.0 0.0 0.0 0.0 0.0 0.0 0.0 0.0 0.0
Sapugaskanda 15.1 16.6 18.1 19.3 20.8 21.7 0.0 0.0 0.0 0.0 0.0 0.0 0.0 0.0 0.0 0.0 0.0 0.0 0.0 0.0 0.0 0.0 0.0 0.0 0.0
GT No.7 0.0 0.0 0.0 0.0 0.0 0.0 0.0 0.0 0.0 0.0 0.0 0.0 0.0 0.0 0.0 0.0 0.0 0.0 0.0 0.0 0.0 0.0 0.0 0.0 0.0
Asia Power 0.0 0.0 0.0 0.0 0.0 0.0 0.0 0.0 0.0 0.0 0.0 0.0 0.0 0.0 0.0 0.0 0.0 0.0 0.0 0.0 0.0 0.0 0.0 0.0 0.0
KPS CC 15.5 17.0 18.5 19.9 21.4 22.7 0.0 0.0 0.0 0.0 0.0 0.0 0.0 0.0 0.0 0.0 0.0 0.0 0.0 0.0 0.0 0.0 0.0 0.0 0.0
AES CC 0.0 0.0 0.0 0.0 0.0 0.0 0.0 0.0 0.0 0.0 0.0 0.0 0.0 0.0 0.0 0.0 0.0 0.0 0.0 0.0 0.0 0.0 0.0 0.0 0.0
West coast CC 20.9 21.8 23.7 27.3 29.9 31.6 0.0 0.0 0.0 0.0 0.0 0.0 0.0 0.0 0.0 0.0 0.0 0.0 0.0 0.0 0.0 0.0 0.0 0.0 0.0
Northern power 13.0 0.0 15.5 0.0 0.0 0.0 0.0 0.0 0.0 0.0 0.0 0.0 0.0 0.0 0.0 0.0 0.0 0.0 0.0 0.0 0.0 0.0 0.0 0.0 0.0
Uthurujanani 16.4 17.9 19.2 19.4 22.7 22.8 0.0 0.0 0.0 0.0 0.0 0.0 0.0 0.0 0.0 0.0 0.0 0.0 0.0 0.0 0.0 0.0 0.0 0.0 0.0
CEB Barge power 0.0 0.0 0.0 0.0 0.0 0.0 0.0 0.0 0.0 0.0 0.0 0.0 0.0 0.0 0.0 0.0 0.0 0.0 0.0 0.0 0.0 0.0 0.0 0.0 0.0
Furnace oil 0.0 18.3 19.9 20.9 23.6 24.0 0.0 0.0 0.0 0.0 0.0 0.0 0.0 0.0 0.0 0.0 0.0 0.0 0.0 0.0 0.0 0.0 0.0 0.0 0.0
New GT 0.0 0.0 0.0 0.0 0.0 0.0 0.0 0.0 0.0 0.0 0.0 0.0 0.0 0.0 0.0 0.0 0.0 0.0 0.0 0.0 0.0 0.0 0.0 0.0 0.0
New CC 0.0 0.0 0.0 23.5 25.2 0.0 0.0 0.0 0.0 0.0 0.0 0.0 0.0 0.0 0.0 0.0 0.0 0.0 0.0 0.0 0.0 0.0 0.0 0.0 0.0
LNG 0.0 0.0 0.0 0.0 0.0 7.6 8.1 8.4 8.5 8.8 9.0 9.0 9.1 9.3 9.4 9.6 9.5 10.0 9.8 9.7 9.7 9.7 10.0 9.9 9.9
KPS CC (LNG) 0.0 0.0 0.0 0.0 0.0 0.0 8.4 8.8 8.8 0.0 9.2 9.5 9.7 9.9 10.0 10.3 10.2 0.0 0.0 0.0 0.0 0.0 0.0 0.0 0.0
KPS-2 CC (LNG) 0.0 0.0 0.0 0.0 0.0 0.0 0.0 0.0 0.0 0.0 0.0 0.0 0.0 0.0 10.9 0.0 0.0 0.0 0.0 0.0 0.0 0.0 0.0 0.0 0.0
West coast CC (LNG) 0.0 0.0 0.0 0.0 0.0 0.0 8.9 9.2 0.0 0.0 0.0 9.8 10.1 10.1 10.4 10.5 10.3 0.0 10.8 11.0 0.0 11.0 0.0 11.3 11.2
New LNG 0.0 0.0 0.0 0.0 0.0 7.6 8.0 8.4 8.5 8.8 9.0 9.0 9.1 9.2 9.3 9.6 9.4 10.0 9.8 9.7 9.7 9.7 10.0 9.9 9.9
Coal 4.3 4.3 4.4 4.5 4.5 4.6 4.5 4.5 4.6 4.6 4.6 4.7 4.7 4.7 4.8 4.8 4.8 4.8 4.8 4.8 4.8 4.8 4.9 4.9 4.9
Puttalam 4.3 4.3 4.4 4.5 4.5 4.6 4.6 4.6 4.7 4.7 4.8 4.8 4.8 4.9 4.9 4.9 5.0 5.0 5.0 5.0 5.0 5.0 5.1 5.1 5.1
New Coal 0.0 0.0 0.0 0.0 0.0 0.0 4.3 4.4 4.4 4.5 4.5 4.5 4.6 4.6 4.6 4.7 4.7 4.7 4.7 4.7 4.7 4.7 4.8 4.8 4.8
NCRE 11.8 11.3 10.6 10.2 9.7 9.5 9.2 9.0 8.9 8.8 8.7 8.5 8.4 8.3 8.3 8.2 8.1 8.0 8.0 8.0 8.0 7.9 7.9 7.8 7.9
M-hydro 10.7 10.5 10.3 10.1 10.0 9.9 9.8 9.6 9.5 9.5 9.4 9.3 9.2 9.2 9.1 9.1 9.0 9.0 9.0 9.0 8.9 8.9 8.9 8.9 8.8
Wind 14.0 13.4 11.4 10.4 9.7 9.4 9.1 8.9 8.8 8.6 8.6 8.4 8.3 8.2 8.1 8.0 8.0 7.9 7.9 7.9 7.8 7.8 7.8 7.8 7.7
Solar 0.0 6.0 6.0 6.0 6.0 6.0 6.0 6.0 6.0 6.0 6.0 6.0 6.0 6.0 6.0 6.0 6.0 6.0 6.0 6.0 6.0 6.0 6.0 6.0 6.0
Biomass 14.1 14.1 14.1 14.1 14.1 14.1 14.1 14.1 14.1 14.1 14.1 14.1 14.1 14.1 14.1 14.1 14.1 14.1 14.1 14.1 14.1 14.1 14.1 14.1 14.1
Total 6.2 7.0 7.2 8.5 9.3 6.6 4.8 4.7 4.9 4.8 5.0 5.1 5.2 5.4 5.5 5.4 5.4 5.3 5.4 5.5 5.6 5.7 5.6 5.6 5.7