chapter 9 sections:9.2, 9.3, 9.4, 9.5. chapter 9: phase diagrams why study? one of the reason why...
Post on 21-Dec-2015
228 views
TRANSCRIPT

Chapter 9Chapter 9Sections:9.2, 9.3, 9.4, 9.5Sections:9.2, 9.3, 9.4, 9.5

Chapter 9: Phase DiagramsChapter 9: Phase Diagrams
Why study?Why study?
One of the reason why a knowledge and understanding of phase One of the reason why a knowledge and understanding of phase diagrams is important to the engineers related to the design and control diagrams is important to the engineers related to the design and control of heat treating processes.of heat treating processes.
Some properties are functions of their microstructures, and, Some properties are functions of their microstructures, and, consequently, of their thermal histories.consequently, of their thermal histories.

Definitions and Basic ConceptsDefinitions and Basic Concepts Components Components : Pure metals and/or compounds of which an alloy is : Pure metals and/or compounds of which an alloy is
composedcomposed– Example: in a copper-zinc brass, the components are Cu and Zn.Example: in a copper-zinc brass, the components are Cu and Zn.
SystemSystem– First meaningFirst meaning: refer to a specific body of material under consideration : refer to a specific body of material under consideration
( e.g., a ladle of molten steel)( e.g., a ladle of molten steel)– Second meaningSecond meaning: relate to the series of possible alloys consisting of the : relate to the series of possible alloys consisting of the
same components, but without regard to alloy composition (e.g., the same components, but without regard to alloy composition (e.g., the iron-carbon system)iron-carbon system)
Solid solutionSolid solution: Consists of atoms of : Consists of atoms of at least twoat least two different types different types– SoluteSolute an element or compound present in a minor concentration an element or compound present in a minor concentration– Solvent Solvent an element or compound in greater amount; host atoms. an element or compound in greater amount; host atoms.– Solute atoms occupy either substitutional or interstitial positions in the Solute atoms occupy either substitutional or interstitial positions in the
solvent latticesolvent lattice– Crystal structure of the solvent is maintainedCrystal structure of the solvent is maintained

9.2 Solubility Limit9.2 Solubility Limit Solubility LimitSolubility Limit: The maximum concentration of a solute atoms that : The maximum concentration of a solute atoms that
may dissolve in the solvent to form a solid solution at some specific may dissolve in the solvent to form a solid solution at some specific temperature.temperature.
The addition in excess results in the formation of another solid solution The addition in excess results in the formation of another solid solution or compound that has a distinctly different composition.or compound that has a distinctly different composition.
ExampleExample: Sugar-Water (C: Sugar-Water (C1212HH2222OO1111-H-H22O) systemO) system– Initially, as sugar added to water, a solution of Initially, as sugar added to water, a solution of syrupsyrup forms. forms.– As more sugar is added, solution becomes more As more sugar is added, solution becomes more concentratedconcentrated– Solution becomes Solution becomes saturatedsaturated with sugar with sugar Solubility limitSolubility limit is reached is reached– Not capable to dissolving more Not capable to dissolving more further addition simply further addition simply settlesettle to to
the bottomthe bottom– System now consists of System now consists of two separate substancestwo separate substances::
» A sugar-water syrup liquid solution, andA sugar-water syrup liquid solution, and» Solid crystals of undissolved sugarSolid crystals of undissolved sugar


9.3 Phases9.3 Phases Phase:Phase: defined as a homogeneous portion of a system that has uniform defined as a homogeneous portion of a system that has uniform
physical and chemical characteristics.physical and chemical characteristics.
Every Every pure materialpure material is considered to be a phase is considered to be a phase
– Also every solid, liquid, and gaseous solutionAlso every solid, liquid, and gaseous solution
– e.g., syrup solution is one phase, and solid sugar is anothere.g., syrup solution is one phase, and solid sugar is another
If more than one phase is present, it is If more than one phase is present, it is not necessarynot necessary that there be that there be difference in difference in both physical and chemical propertiesboth physical and chemical properties::
– A disparity in one or both is sufficientA disparity in one or both is sufficient
– e.g., water and ice in a container ( two phase, identical chemically)e.g., water and ice in a container ( two phase, identical chemically)
– When a substance can exist in two or more polymorphic forms (e.g. When a substance can exist in two or more polymorphic forms (e.g. having both FCC abd BCC) having both FCC abd BCC) each structure is a separate phase each structure is a separate phase because of difference in physical properties.because of difference in physical properties.

A single-phase system is termed “A single-phase system is termed “homogeneoushomogeneous””
Systems composed of two or more phases are termed “Systems composed of two or more phases are termed “mixturemixture” or ” or heterogeneous heterogeneous systems”.systems”.
Most metallic alloys, ceramics, polymeric, and composite systems are Most metallic alloys, ceramics, polymeric, and composite systems are heterogeneous.heterogeneous.
Ordinarily, in Ordinarily, in multiphasemultiphase systems systems
– The phases interact such that the property is different and more The phases interact such that the property is different and more attractive than individual phases.attractive than individual phases.
9.4 Microstructure9.4 Microstructure
Physical properties and mechanical behavior depend on the Physical properties and mechanical behavior depend on the microstructuremicrostructure..
In metal alloys, microstructure is In metal alloys, microstructure is characterizedcharacterized by by– Number of phases presentNumber of phases present– Their proportionsTheir proportions– The manner they are distributed or arrangedThe manner they are distributed or arranged
The microstructure of an alloy The microstructure of an alloy depends ondepends on such variables as such variables as– Alloying elements presentAlloying elements present– Their concentrationsTheir concentrations– The heat treatmentThe heat treatment
Microstructure Microstructure studiesstudies: : – surface preparation (Polishing and etching)surface preparation (Polishing and etching)– For two phase alloys, one phase may appear light and other darkFor two phase alloys, one phase may appear light and other dark

9.5 Phase Equilibria9.5 Phase Equilibria
Free energyFree energy is a function of the internal energy of a system, and also of is a function of the internal energy of a system, and also of the randomness or disorder of the atoms or molecules (or entropy).the randomness or disorder of the atoms or molecules (or entropy).
A system is at A system is at equilibriumequilibrium if its free energy is at a minimum under some if its free energy is at a minimum under some specified combination of temperature, pressure, and composition.specified combination of temperature, pressure, and composition.
In In macroscopicmacroscopic sense, this means that the characteristics of the system sense, this means that the characteristics of the system do not change with time but persist indefinitelydo not change with time but persist indefinitely The system is stableThe system is stable
A change in temperature, pressure, and/or composition in equilibrium A change in temperature, pressure, and/or composition in equilibrium increase in free energy increase in free energy another equilibriumanother equilibrium state whereby the free state whereby the free energy is lowered.energy is lowered.

Phase equilibriumPhase equilibrium refers to equilibrium as it applied to systems in which refers to equilibrium as it applied to systems in which more than one phase may exist.more than one phase may exist.
ExampleExample: :
– Sugar-water syrup is contained in a closed vesselSugar-water syrup is contained in a closed vessel
solution is in contact with solid sugar at 20solution is in contact with solid sugar at 20ooCC
– If system is in equilibrium,If system is in equilibrium,
» Composition of syrup is 65wt% CComposition of syrup is 65wt% C1212HH2222OO1111-35wt% H-35wt% H22O (Fig 9.1)O (Fig 9.1)
» Amount and composition of syrup and sugar will remain constantAmount and composition of syrup and sugar will remain constant
– If temperature is raised to 100If temperature is raised to 100ooCC
» Equilibrium is temporarily upsetEquilibrium is temporarily upset
» Solubility limit of sugar has increased to 80 wt%Solubility limit of sugar has increased to 80 wt%
» Some of the solid sugar will dissolve until new equilibrium is reachedSome of the solid sugar will dissolve until new equilibrium is reached

Metastable stateMetastable state::
– Nonequilibrium stateNonequilibrium state
– A state of equilibrium is never completely achieved because the rate A state of equilibrium is never completely achieved because the rate of approach to equilibrium is extremely slowof approach to equilibrium is extremely slow
– Common in many metals or solid solutionsCommon in many metals or solid solutions
– Persist indefinitely with imperceptible changes with time.Persist indefinitely with imperceptible changes with time.
Metastable structureMetastable structure: :
– More practical than equilibrium More practical than equilibrium
– Some steel and aluminum rely on this for heat treatment designingSome steel and aluminum rely on this for heat treatment designing

Chapter 9Chapter 9Sections: 9.6Sections: 9.6

Equilibrium Phase DiagramsEquilibrium Phase Diagrams
Equilibrium Phase diagramEquilibrium Phase diagram::
– Represents the relationships between temperature and the Represents the relationships between temperature and the compositions and the quantities of phases at equilibrium.compositions and the quantities of phases at equilibrium.
– Also known as phase, equilibrium or constitutional diagramAlso known as phase, equilibrium or constitutional diagram
A A binary alloybinary alloy is one that contains two components. is one that contains two components.
Temperature and composition are the variable parameters for binary Temperature and composition are the variable parameters for binary alloys.alloys.
Of Of more than two componentsmore than two components, phase diagrams become extremely , phase diagrams become extremely complicated and difficult to representscomplicated and difficult to represents

9.6 Binary Isomorphous 9.6 Binary Isomorphous systemssystems Phase diagram of the Phase diagram of the
copper-Nickel systemcopper-Nickel system is is shown in Fig 9.2a.shown in Fig 9.2a.
Ordinate Ordinate Temperature Temperature
AbscissaAbscissa composition composition
Composition ranges from 0 Composition ranges from 0 wt% Ni (100 wt% Cu) to wt% Ni (100 wt% Cu) to 100 wt% Ni (0 wt% Cu)100 wt% Ni (0 wt% Cu)
Three different phaseThree different phase regions, or fields, appear regions, or fields, appear – An alpha (An alpha () field) field– A liquid (L) fieldA liquid (L) field– A two-phase (A two-phase (+L) field+L) field
Liquid L:Liquid L: homogeneous liquid solution composed of both copper and homogeneous liquid solution composed of both copper and nickelnickel
phase:phase: a substitutional solid solution consisting of both Cu and Ni a substitutional solid solution consisting of both Cu and Ni atoms, and having an FCC crstal structure.atoms, and having an FCC crstal structure.
Isomorphous:Isomorphous: complete liquid and solid solubility of two components complete liquid and solid solubility of two components
Copper-Nickel system is IsomorpousCopper-Nickel system is Isomorpous– At temperatures below about 1080oC, mutually soluble in solid state At temperatures below about 1080oC, mutually soluble in solid state
for all compositionsfor all compositions– Complete solubility is due to same crystal structure (FCC), nearly Complete solubility is due to same crystal structure (FCC), nearly
identical atomic radii and electronegativities, and similar valencesidentical atomic radii and electronegativities, and similar valences
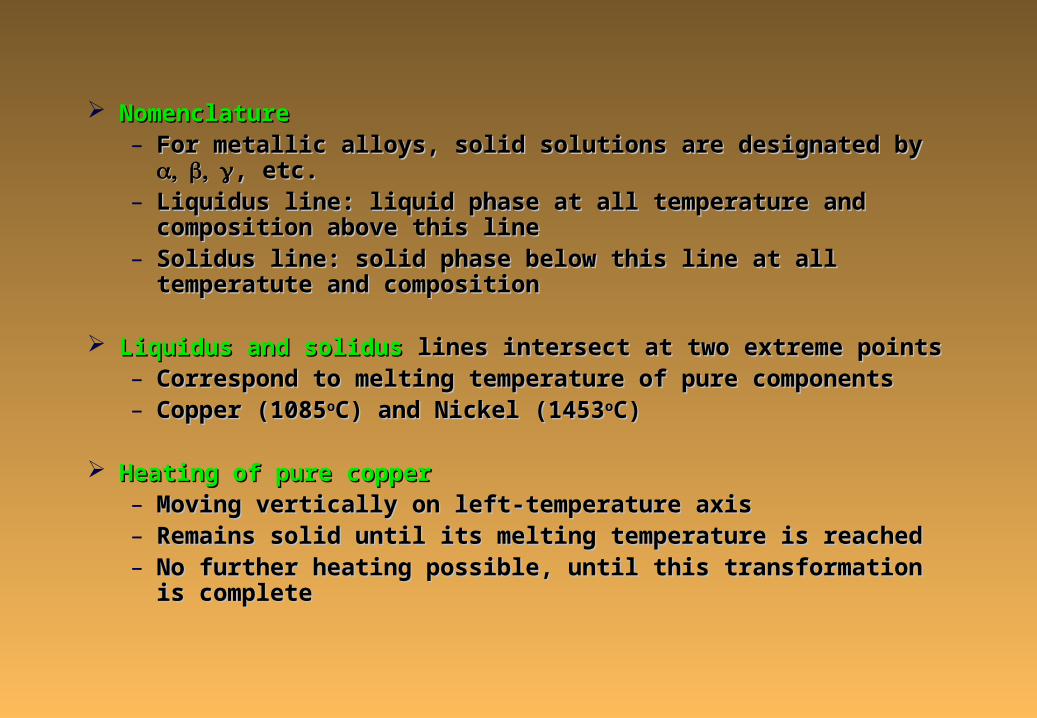
NomenclatureNomenclature– For metallic alloys, solid solutions are designated by For metallic alloys, solid solutions are designated by , etc., etc.– Liquidus line: liquid phase at all temperature and composition above Liquidus line: liquid phase at all temperature and composition above
this linethis line– Solidus line: solid phase below this line at all temperatute and Solidus line: solid phase below this line at all temperatute and
compositioncomposition
Liquidus and solidusLiquidus and solidus lines intersect at two extreme points lines intersect at two extreme points– Correspond to melting temperature of pure componentsCorrespond to melting temperature of pure components– Copper (1085Copper (1085ooC) and Nickel (1453C) and Nickel (1453ooC)C)
Heating of pure copperHeating of pure copper– Moving vertically on left-temperature axisMoving vertically on left-temperature axis– Remains solid until its melting temperature is reachedRemains solid until its melting temperature is reached– No further heating possible, until this transformation is completeNo further heating possible, until this transformation is complete

For any composition other than pure componentsFor any composition other than pure components
– Melting phenomenon occurs over the range of temperature between Melting phenomenon occurs over the range of temperature between the solidus and liquidus linesthe solidus and liquidus lines
– Both solid Both solid and liquid will be in equilibrium within this range and liquid will be in equilibrium within this range
Interpretation of Phase DiagramsInterpretation of Phase Diagrams
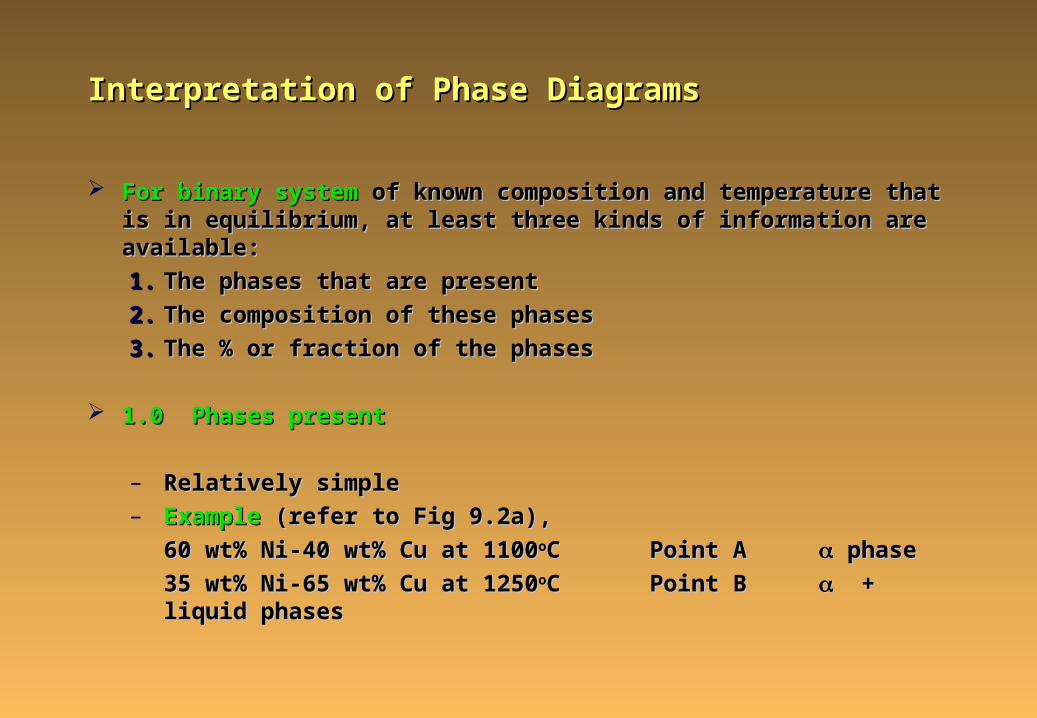
For binary systemFor binary system of known composition and temperature that is in of known composition and temperature that is in equilibrium, at least three kinds of information are available:equilibrium, at least three kinds of information are available:
1.1. The phases that are presentThe phases that are present
2.2. The composition of these phasesThe composition of these phases
3.3. The % or fraction of the phasesThe % or fraction of the phases
1.0 Phases present1.0 Phases present
– Relatively simpleRelatively simple
– ExampleExample (refer to Fig 9.2a), (refer to Fig 9.2a),
60 wt% Ni-40 wt% Cu at 110060 wt% Ni-40 wt% Cu at 1100ooCC Point A Point A phase phase
35 wt% Ni-65 wt% Cu at 125035 wt% Ni-65 wt% Cu at 1250ooCC Point B Point B + liquid phases + liquid phases
5
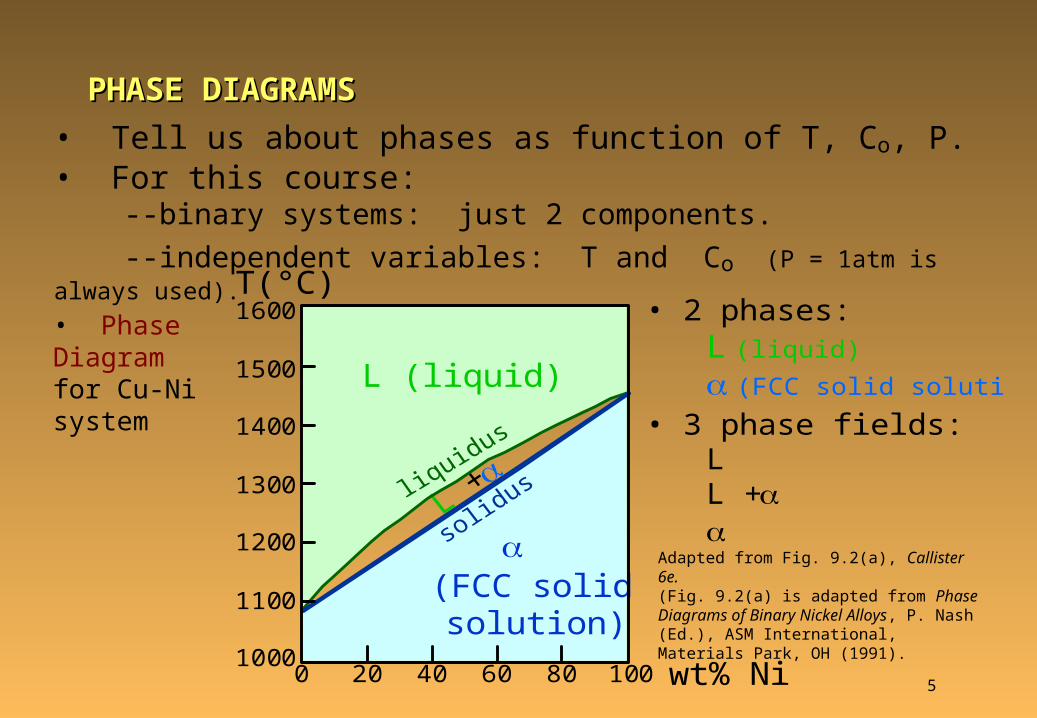
• Tell us about phases as function of T, Co, P. • For this course: --binary systems: just 2 components.
--independent variables: T and Co (P = 1atm is always used).
• PhaseDiagramfor Cu-Nisystem
• 2 phases: L (liquid) (FCC solid solution)
• 3 phase fields: L L +
wt% Ni20 40 60 80 10001000
1100
1200
1300
1400
1500
1600T(°C)
L (liquid)
(FCC solid solution)
Adapted from Fig. 9.2(a), Callister 6e.(Fig. 9.2(a) is adapted from Phase Diagrams of Binary Nickel Alloys, P. Nash (Ed.), ASM International, Materials Park, OH (1991).
PHASE DIAGRAMSPHASE DIAGRAMS

6
• Rule 1: If we know T and Co, then we know: --the # and types of phases present.
• Examples:
wt% Ni20 40 60 80 10001000
1100
1200
1300
1400
1500
1600T(°C)
L (liquid)
(FCC solid solution)
A(1100,60)
B(1
250,3
5)
Cu-Niphase
diagram
A(1100, 60): 1 phase:
B(1250, 35): 2 phases: L +
Adapted from Fig. 9.2(a), Callister 6e.(Fig. 9.2(a) is adapted from Phase Diagrams of Binary Nickel Alloys, P. Nash (Ed.), ASM International, Materials Park, OH, 1991).
PHASE DIAGRAMS:PHASE DIAGRAMS: # and types of phases# and types of phases
7
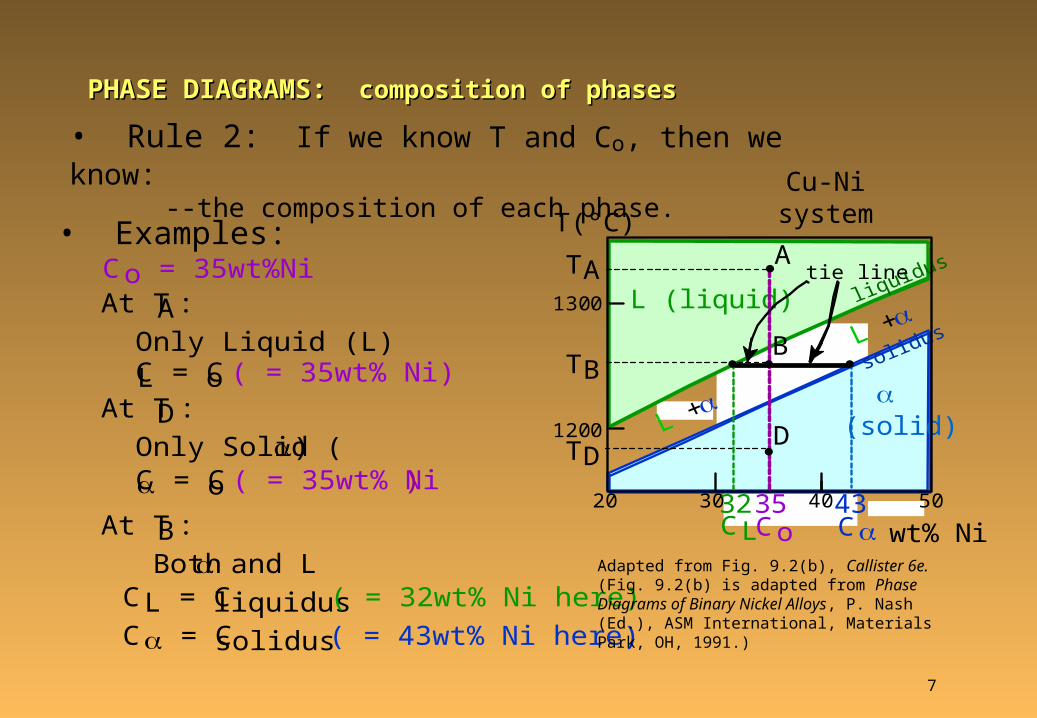
• Rule 2: If we know T and Co, then we know: --the composition of each phase.
• Examples:
wt% Ni20
1200
1300
T(°C)
L (liquid)
(solid)
30 40 50
TAA
DTD
TBB
tie line
433532CoCL C
Cu-Ni system
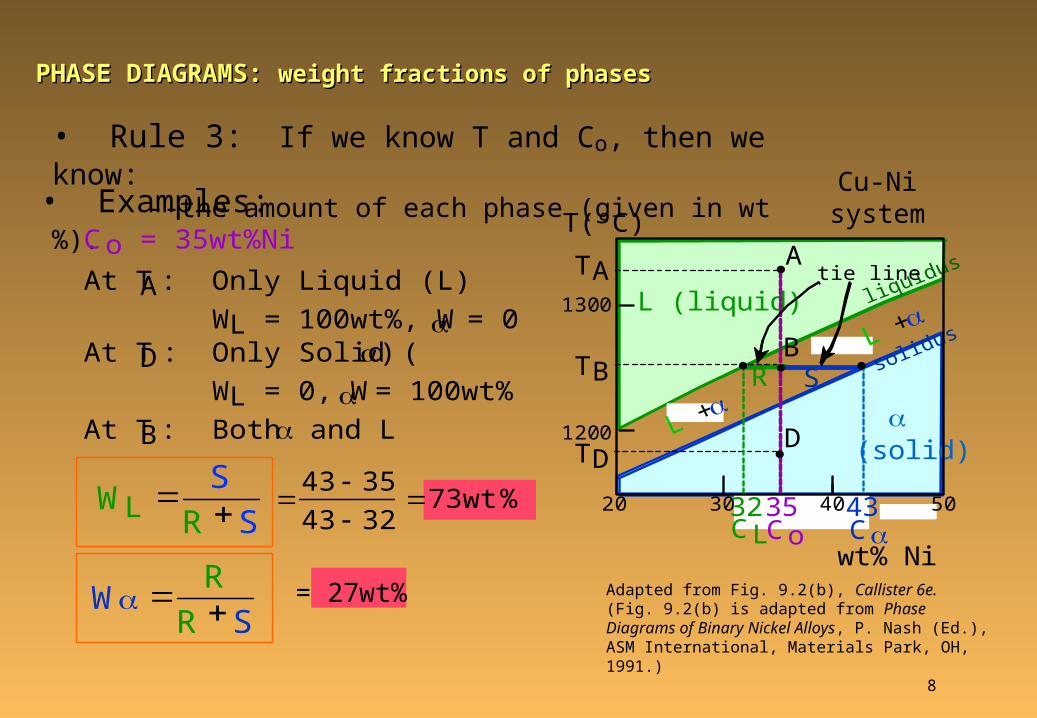
At TA: Only Liquid (L) CL = Co ( = 35wt% Ni)
At TB: Both and L CL = Cliquidus ( = 32wt% Ni here) C = Csolidus ( = 43wt% Ni here)
At TD: Only Solid () C = Co ( = 35wt% Ni)
Co = 35wt%Ni
Adapted from Fig. 9.2(b), Callister 6e.(Fig. 9.2(b) is adapted from Phase Diagrams of Binary Nickel Alloys, P. Nash (Ed.), ASM International, Materials Park, OH, 1991.)
PHASE DIAGRAMS: PHASE DIAGRAMS: composition of phasescomposition of phases
8
• Rule 3: If we know T and Co, then we know: --the amount of each phase (given in wt%). Cu-Ni
system• Examples:
At TB: Both and L
At TA: Only Liquid (L) WL = 100wt%, W = 0
At TD: Only Solid () WL = 0, W = 100wt%
Co = 35wt%Ni
WL SR S
W RR S
43 3543 32
73wt%
= 27wt%wt% Ni
20
1200
1300
T(°C)
L (liquid)
(solid)
30 40 50
TAA
DTD
TBB
tie line
433532CoCL C
R S
Adapted from Fig. 9.2(b), Callister 6e.(Fig. 9.2(b) is adapted from Phase Diagrams of Binary Nickel Alloys, P. Nash (Ed.), ASM International, Materials Park, OH, 1991.)
PHASE DIAGRAMS: PHASE DIAGRAMS: weight fractions of phasesweight fractions of phases

• Sum of weight fractions:
9
• Conservation of mass (Ni):
• Combine above equations:
WL W 1
Co WLCL WC
RR S
W Co CLC CL
SR S
WLC Co
C CL
• A geometric interpretation:Co
R S
WWL
CL Cmoment equilibrium:
1 Wsolving gives Lever Rule
WLR WS
THE LEVER RULE: A PROOFTHE LEVER RULE: A PROOF
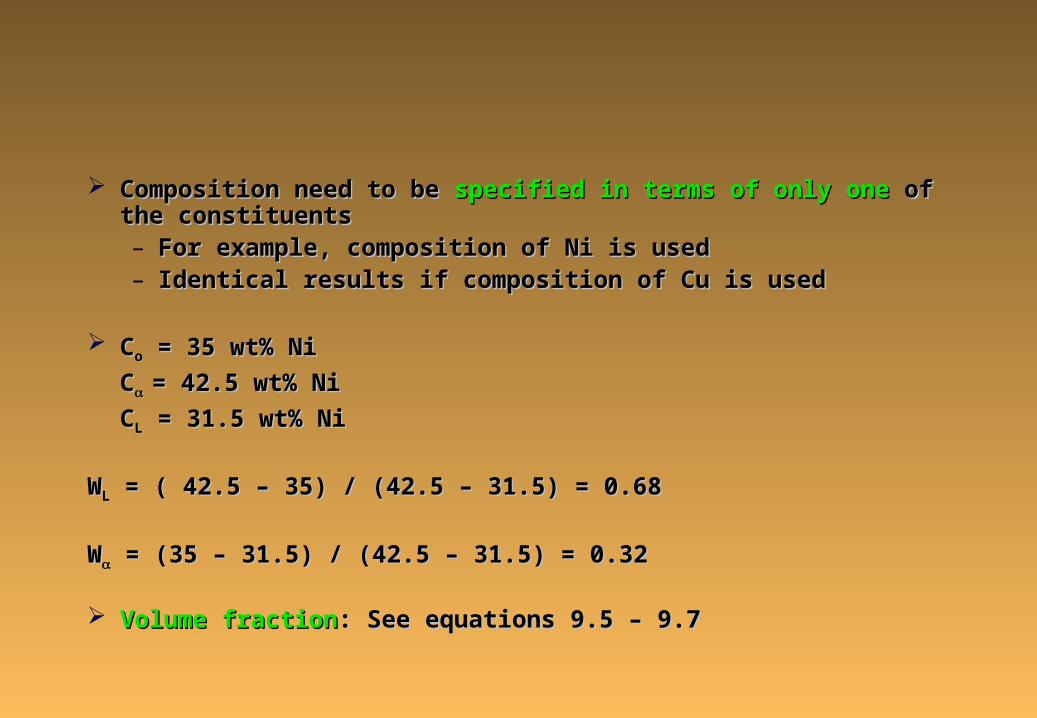
Composition need to be Composition need to be specified in terms of only onespecified in terms of only one of the constituents of the constituents– For example, composition of Ni is usedFor example, composition of Ni is used– Identical results if composition of Cu is usedIdentical results if composition of Cu is used
CCoo = 35 wt% Ni = 35 wt% Ni
CC = 42.5 wt% Ni= 42.5 wt% Ni
CCLL = 31.5 wt% Ni = 31.5 wt% Ni
WWLL = ( 42.5 – 35) / (42.5 – 31.5) = 0.68 = ( 42.5 – 35) / (42.5 – 31.5) = 0.68
WW = (35 – 31.5) / (42.5 – 31.5) = 0.32 = (35 – 31.5) / (42.5 – 31.5) = 0.32
Volume fractionVolume fraction: See equations 9.5 – 9.7: See equations 9.5 – 9.7
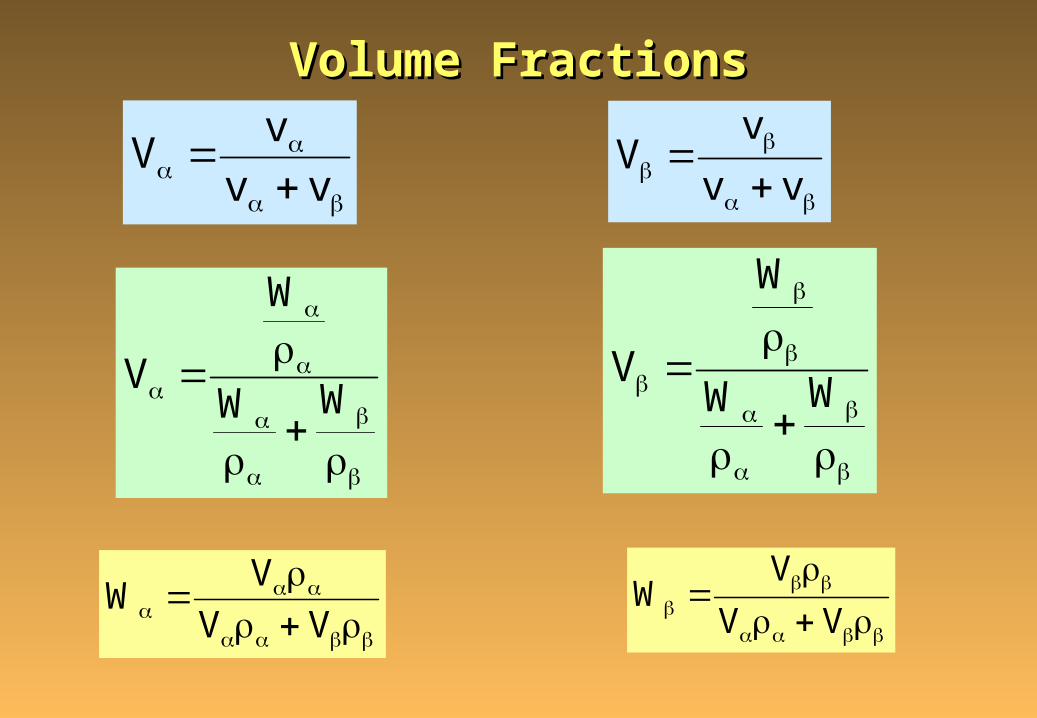
Volume FractionsVolume Fractions
vv
vV
vv
vV
WW
W
V
WW
W
V
VV
VW
VV
VW
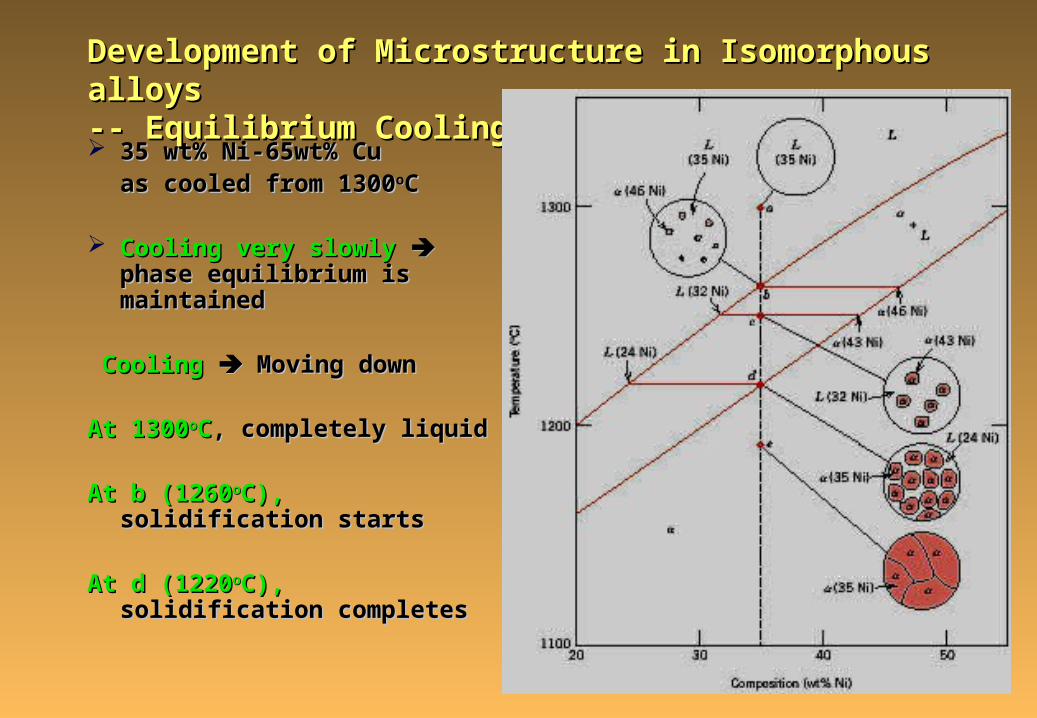
Development of Microstructure in Isomorphous alloysDevelopment of Microstructure in Isomorphous alloys-- Equilibrium Cooling-- Equilibrium Cooling 35 wt% Ni-65wt% Cu35 wt% Ni-65wt% Cu
as cooled from 1300as cooled from 1300ooCC
Cooling very slowlyCooling very slowly phase phase equilibrium is maintainedequilibrium is maintained
CoolingCooling Moving down Moving down
At 1300At 1300ooCC, completely liquid, completely liquid
At b (1260At b (1260ooC),C), solidification starts solidification starts
At d (1220At d (1220ooC),C), solidification solidification completescompletes

Development of Microstructure Development of Microstructure -- Non-Equilibrium Cooling-- Non-Equilibrium Cooling
Extremely slow cooling not validExtremely slow cooling not valid
Temperature change Temperature change readjustment in composition readjustment in composition diffusional diffusional processesprocesses
Diffusion ratesDiffusion rates are low for the solid phase and, for both phases, are low for the solid phase and, for both phases, decrease with diminishing temperaturedecrease with diminishing temperature
Practical solidification processesPractical solidification processes, cooling rates are much too rapid to , cooling rates are much too rapid to allow these compositional readjustments and maintenance of allow these compositional readjustments and maintenance of equilibrium equilibrium different microstructure develops different microstructure develops


At b’,At b’, phase begin to form [ phase begin to form [(46Ni)](46Ni)]
At c’At c’, ,
– liquid composition: 29wt% Ni-71 wt% Culiquid composition: 29wt% Ni-71 wt% Cu
– Solid phase: 40 wt% Ni-60 wt% Cu [Solid phase: 40 wt% Ni-60 wt% Cu [(40Ni)](40Ni)]
– Since diffusion in solid is relatively slow, Since diffusion in solid is relatively slow, phase formed at b’ has phase formed at b’ has not changes composition appreciably not changes composition appreciably still [ still [(46Ni)](46Ni)]
– Composition of Composition of grains continuously changes radially from 46 wt grains continuously changes radially from 46 wt% Ni at center to 40 wt% Ni at the outer grains % Ni at center to 40 wt% Ni at the outer grains average average composition (say 42 wt%Ni)composition (say 42 wt%Ni)
– Solidus line has shiftedSolidus line has shifted

Chapter 9Chapter 9Sections: 9.7Sections: 9.7

9.7 Binary Eutectic Systems9.7 Binary Eutectic Systems
Binary Eutectic Phase DiagramBinary Eutectic Phase Diagram– Another type of common and relatively simple phase diagramAnother type of common and relatively simple phase diagram– Figure 9.6 shows for the copper-silver systemFigure 9.6 shows for the copper-silver system
Features of Binary Eutectic Phase Diagram Features of Binary Eutectic Phase Diagram
Feature 1: Three single-phase regionsFeature 1: Three single-phase regions ( ( , , , and liquid ), and liquid )– The The phase: solid solution rich in copper, silver as solute, FCC phase: solid solution rich in copper, silver as solute, FCC– The The phase: solid solution rich in silver, copper as solute, FCC phase: solid solution rich in silver, copper as solute, FCC– Solubility in each of these solids phases is limitedSolubility in each of these solids phases is limited
Solubility limit for Solubility limit for phasephase– Line ABC ( Increases with temperature, maximum, decreases to minimum)Line ABC ( Increases with temperature, maximum, decreases to minimum)– Solvus line (BC)Solvus line (BC)– Solidus line (AB)Solidus line (AB)

Solubility limit for Solubility limit for phase phase
– Line FGH ( Increases with temperature, maximum, decreases to Line FGH ( Increases with temperature, maximum, decreases to minimum)minimum)
– Solvus line (GH)Solvus line (GH)– Solidus line (FG)Solidus line (FG)
Line BEG is also Line BEG is also solidus linesolidus line
– Maximum solubility in both Maximum solubility in both and and phases occur at 779 phases occur at 779ooCC
Feature 2:Feature 2: Three two-phase regions Three two-phase regions + L+ L + L+ L + +

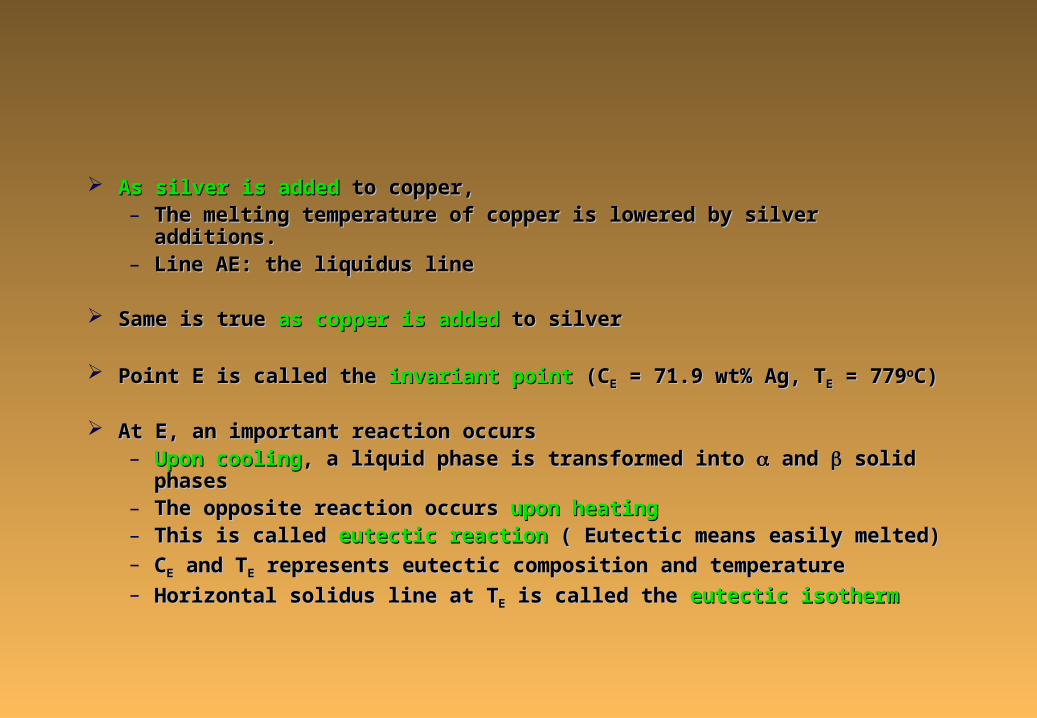
As silver is addedAs silver is added to copper, to copper, – The melting temperature of copper is lowered by silver additions.The melting temperature of copper is lowered by silver additions.– Line AE: the liquidus lineLine AE: the liquidus line
Same is true Same is true as copper is addedas copper is added to silver to silver
Point E is called the Point E is called the invariant pointinvariant point (C (CEE = 71.9 wt% Ag, T = 71.9 wt% Ag, TEE = 779 = 779ooC)C)
At E, an important reaction occursAt E, an important reaction occurs– Upon coolingUpon cooling, a liquid phase is transformed into , a liquid phase is transformed into and and solid phases solid phases– The opposite reaction occurs The opposite reaction occurs upon heatingupon heating– This is called This is called eutectic reactioneutectic reaction ( Eutectic means easily melted) ( Eutectic means easily melted)– CCEE and T and TEE represents eutectic composition and temperature represents eutectic composition and temperature– Horizontal solidus line at THorizontal solidus line at TEE is called the is called the eutectic isothermeutectic isotherm

The eutectic reaction, The eutectic reaction, upon coolingupon cooling, is similar to solidification of pure , is similar to solidification of pure components:components:
– Reaction proceeds to completion at a constant temperatureReaction proceeds to completion at a constant temperature
– Isothermal at TIsothermal at TEE
– Solid products of eutectic solidification is always two solid phasesSolid products of eutectic solidification is always two solid phases
Another common eutectic system is that for lead and tinAnother common eutectic system is that for lead and tin
– The phase diagram is shown in Figure 9.7The phase diagram is shown in Figure 9.7
Example 9.2Example 9.2 Example 9.3Example 9.3
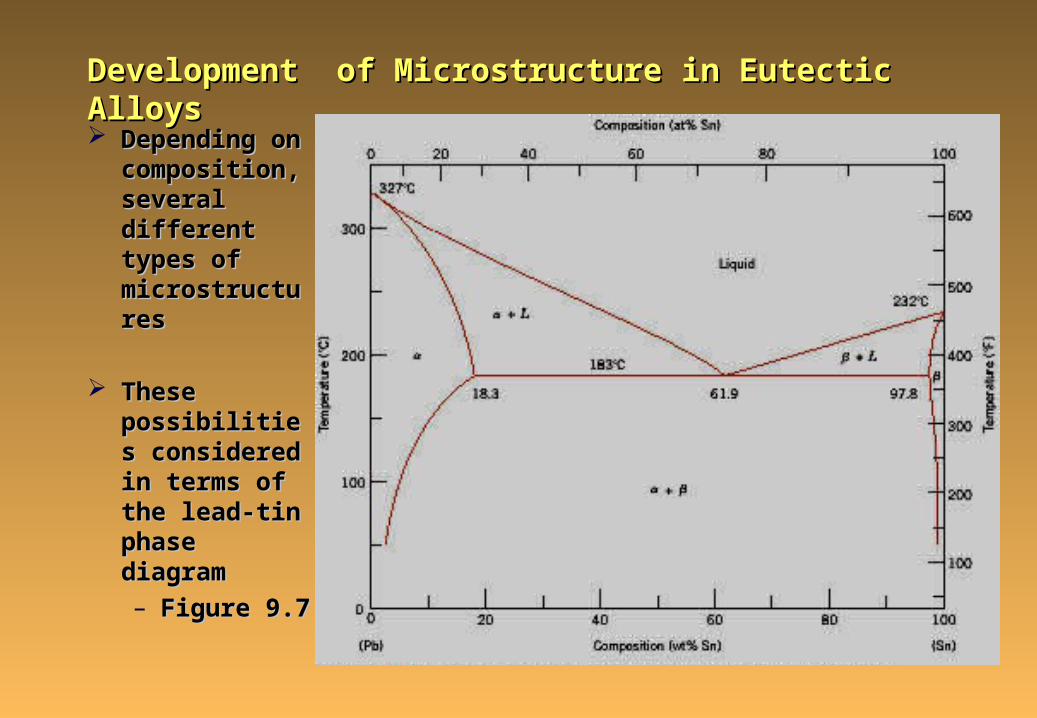
Development of Microstructure in Eutectic AlloysDevelopment of Microstructure in Eutectic Alloys
Depending on Depending on composition, composition, several different several different types of types of microstructuresmicrostructures
These These possibilities possibilities considered in considered in terms of the terms of the lead-tin phase lead-tin phase diagramdiagram
– Figure 9.7Figure 9.7
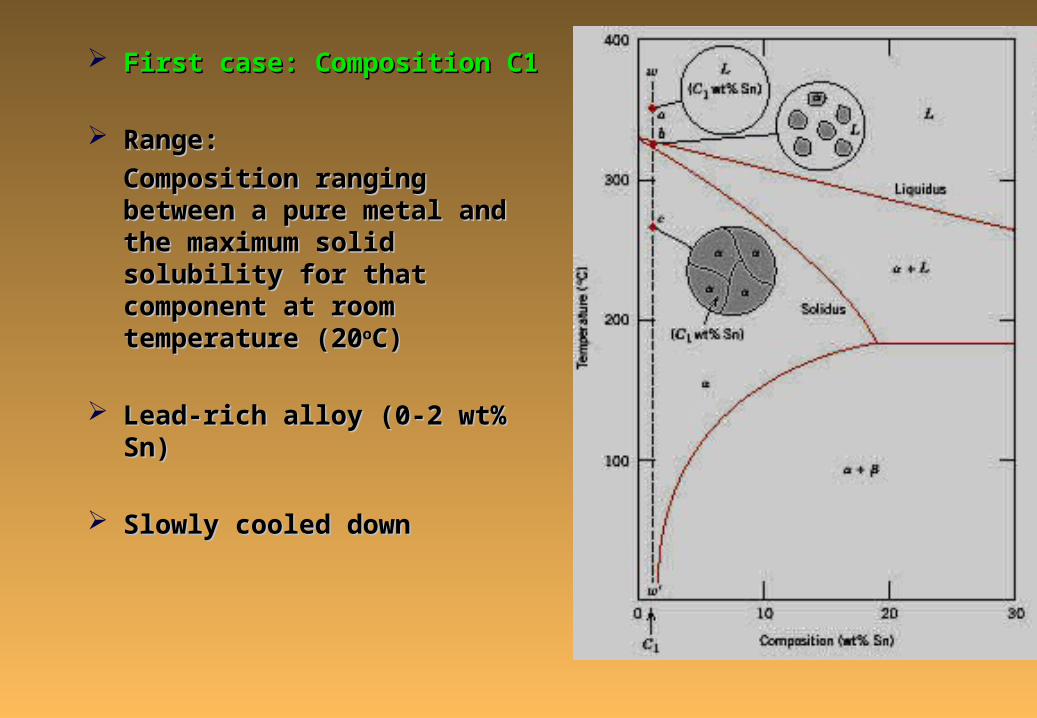
First case: Composition C1First case: Composition C1
Range: Range:
Composition ranging between a pure Composition ranging between a pure metal and the maximum solid metal and the maximum solid solubility for that component at room solubility for that component at room temperature (20temperature (20ooC)C)
Lead-rich alloy (0-2 wt% Sn)Lead-rich alloy (0-2 wt% Sn)
Slowly cooled down Slowly cooled down
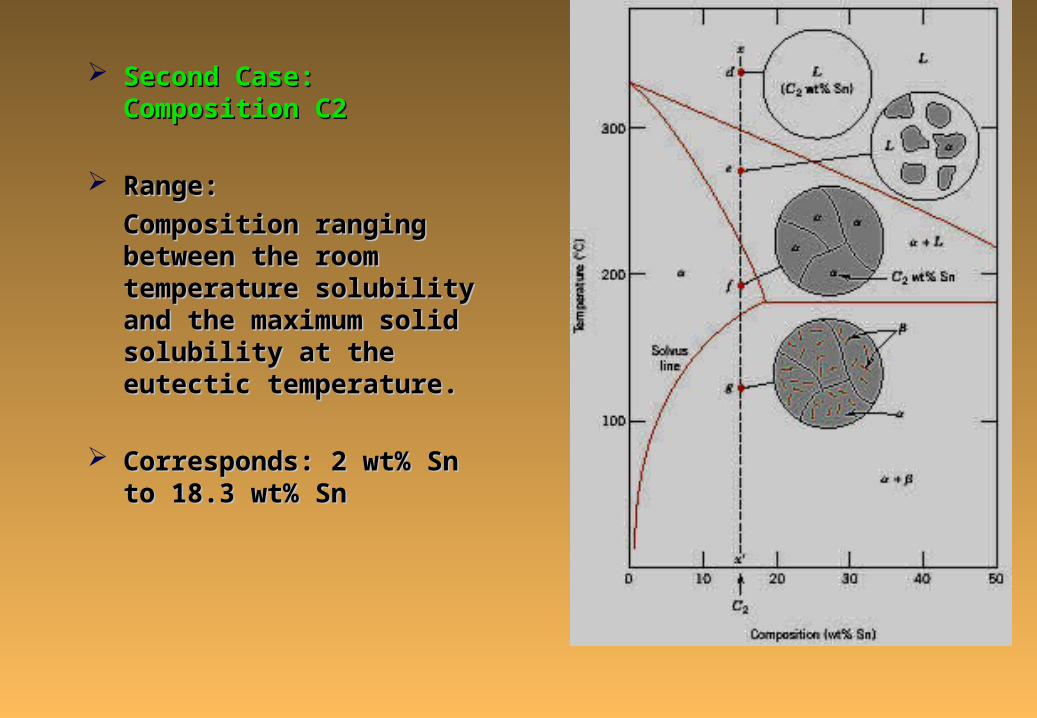
Second Case: Composition C2Second Case: Composition C2
Range: Range:
Composition ranging between Composition ranging between the room temperature solubility the room temperature solubility and the maximum solid and the maximum solid solubility at the eutectic solubility at the eutectic temperature.temperature.
Corresponds: 2 wt% Sn to 18.3 Corresponds: 2 wt% Sn to 18.3 wt% Snwt% Sn

Third Case: Composition Third Case: Composition C3C3
Solidification of the Solidification of the eutectic compositioneutectic composition
Corresponds: 61 wt% Sn Corresponds: 61 wt% Sn
The microstructure at i is The microstructure at i is known as known as eutectic eutectic structure.structure.
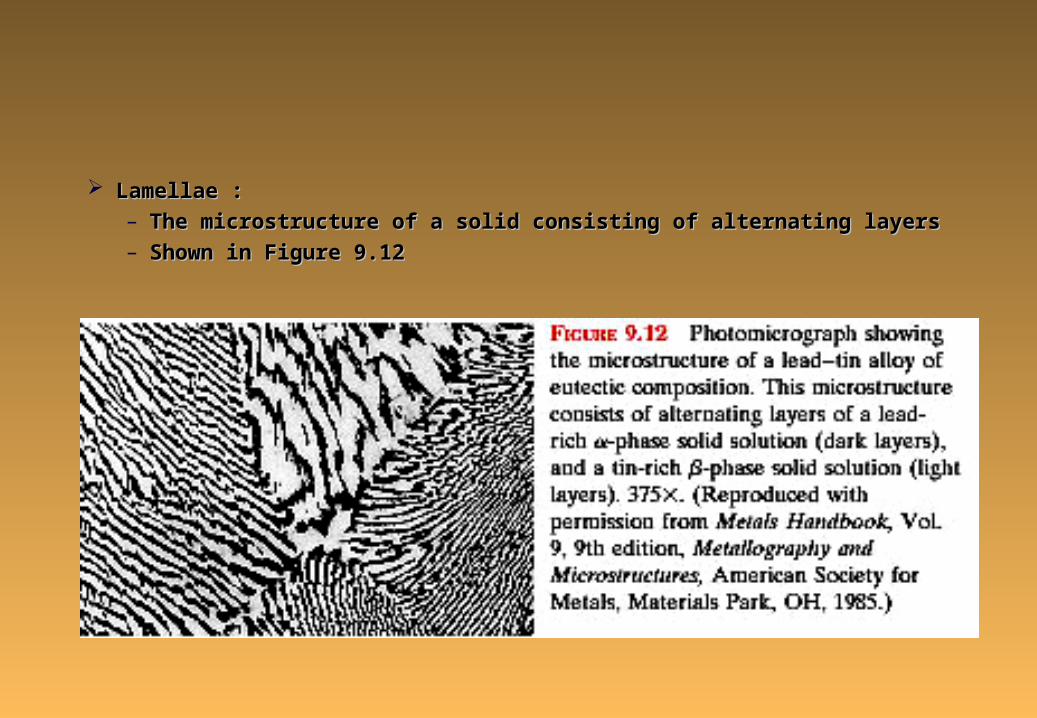
Lamellae : Lamellae :
– The microstructure of a solid consisting of alternating layersThe microstructure of a solid consisting of alternating layers
– Shown in Figure 9.12Shown in Figure 9.12
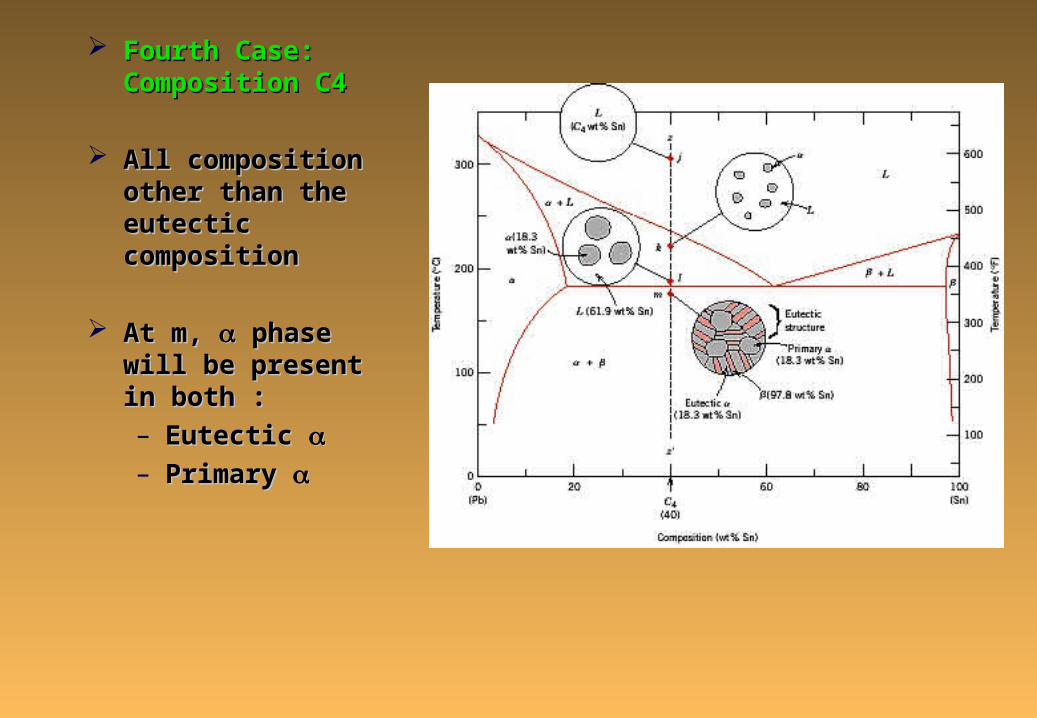
Fourth Case: Fourth Case: Composition C4Composition C4
All composition other All composition other than the eutectic than the eutectic compositioncomposition
At m, At m, phase will be phase will be present in both :present in both :
– Eutectic Eutectic – Primary Primary
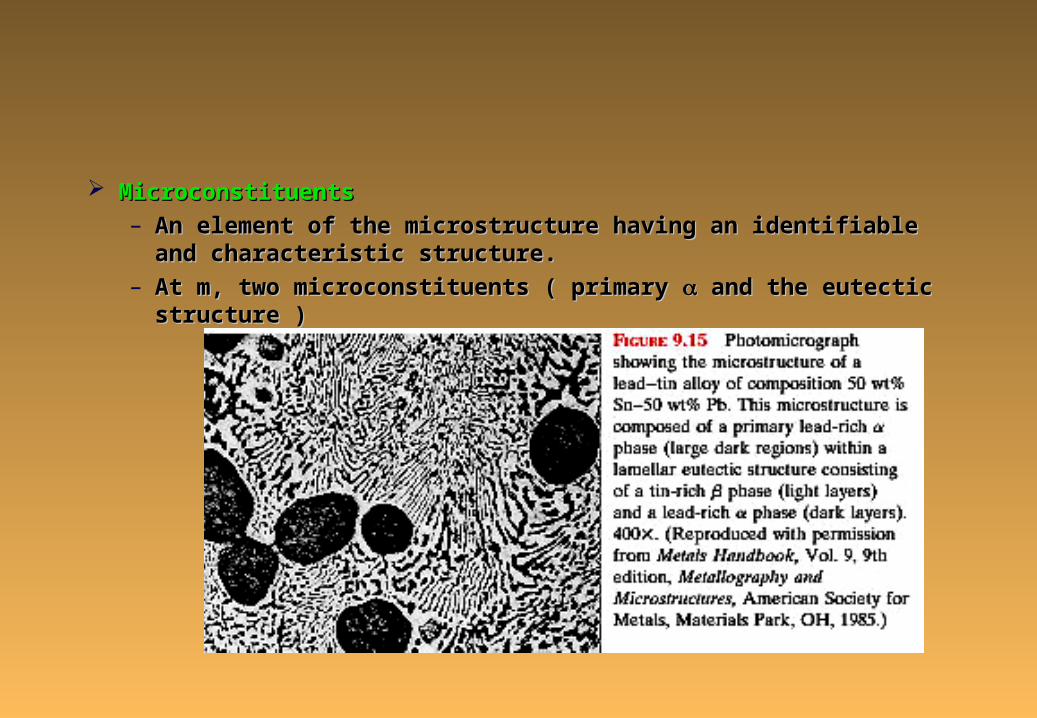
MicroconstituentsMicroconstituents
– An element of the microstructure having an identifiable and An element of the microstructure having an identifiable and characteristic structure.characteristic structure.
– At m, two microconstituents ( primary At m, two microconstituents ( primary and the eutectic structure ) and the eutectic structure )

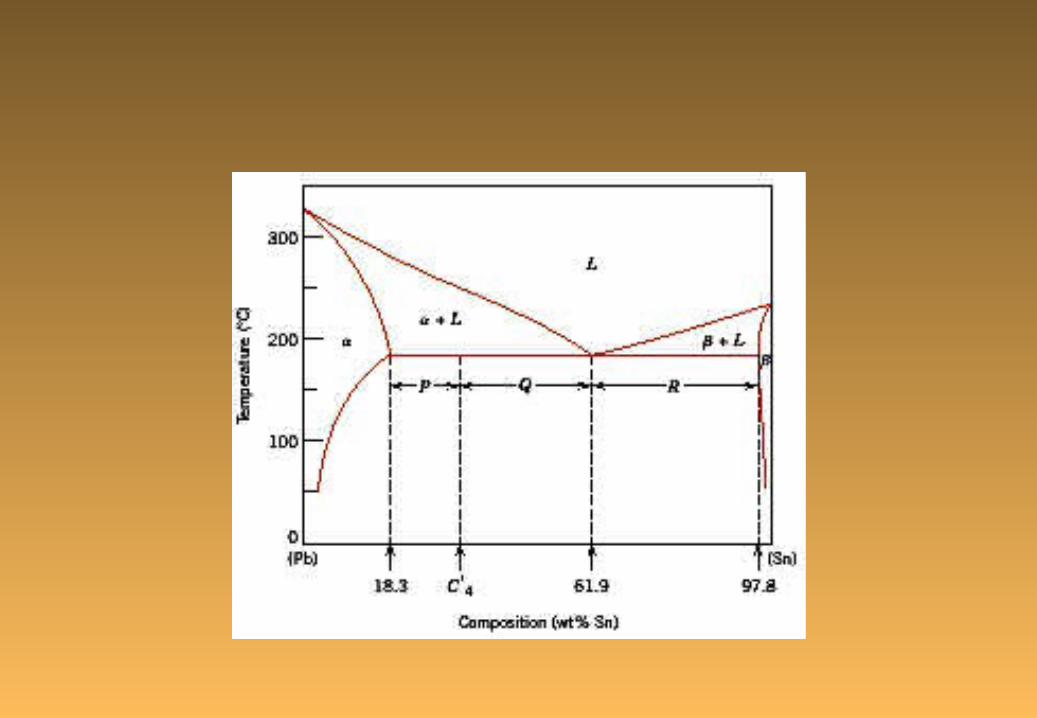
Relative amountsRelative amounts of both eutectic and of both eutectic and primary a microconstituentsprimary a microconstituents
Eutectic microconstituents forms from Eutectic microconstituents forms from liquid having eutectic composition (61 wtliquid having eutectic composition (61 wt% Sn, Fig 9.11, point i)% Sn, Fig 9.11, point i)
Apply lever rule using tie lineApply lever rule using tie line
Eutectic fractionEutectic fraction
WWee = W = WLL = P / (P+Q) = P / (P+Q)
Primary Primary fraction fraction
WWprimary primary = Q / (P+Q) = Q / (P+Q)
Total Total fraction (primary plus eutectic) fraction (primary plus eutectic)
WW = (Q+R) / (P+Q+R) = (Q+R) / (P+Q+R)
Total Total fraction (primary plus eutectic) fraction (primary plus eutectic)
WW = P / (P+Q+R) = P / (P+Q+R)

Chapter 9Chapter 9Sections: 9.8, 9.9, 9.13Sections: 9.8, 9.9, 9.13

9.8 Equilibrium Diagrams Having Intermediate Phases or 9.8 Equilibrium Diagrams Having Intermediate Phases or CompoundsCompounds
Terminal solid solutionsTerminal solid solutions
– Solid phases exist over the composition ranges near the Solid phases exist over the composition ranges near the concentration extremities of the phase diagramconcentration extremities of the phase diagram
– Examples:Examples: Copper-Silver system (Figures 9.6) Copper-Silver system (Figures 9.6)
– Lead –Tin system (Figure 9.7)Lead –Tin system (Figure 9.7)
Intermediate solid solutionsIntermediate solid solutions
– Intermediate phasesIntermediate phases
– Solid phases at other than the two composition extremesSolid phases at other than the two composition extremes
– ExampleExample: Cupper-Zinc system (Figure 9.17): Cupper-Zinc system (Figure 9.17)


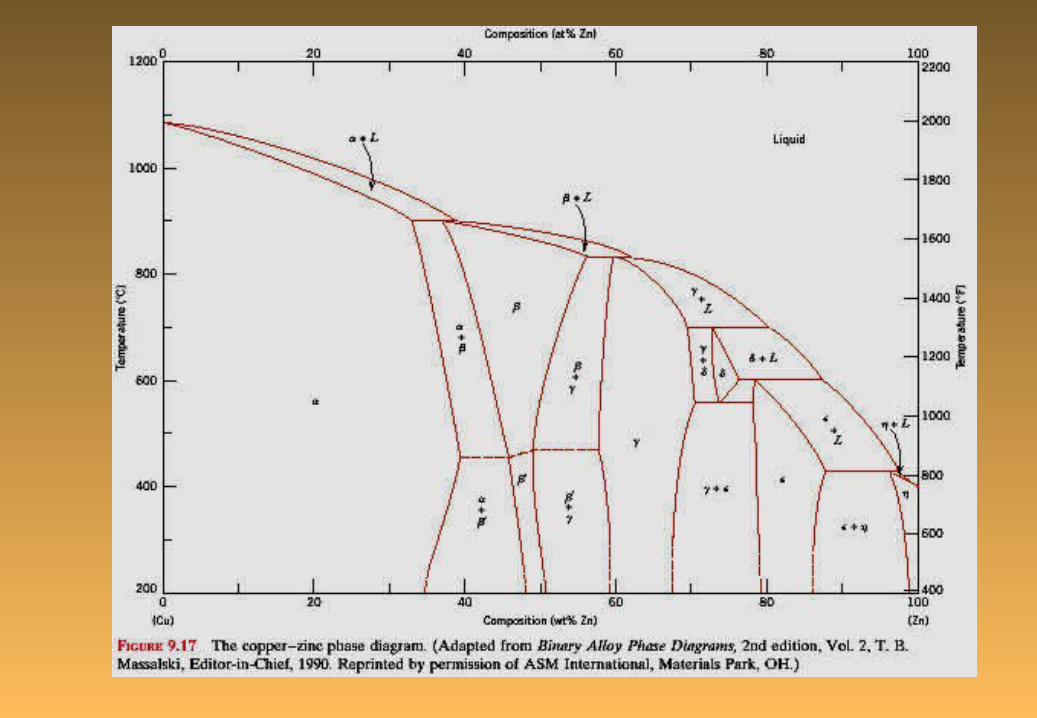

Intermetallic Intermetallic compoundscompounds
Discrete Discrete intermediate intermediate compounds compounds rather than solid rather than solid solutionssolutions
– These These compounds compounds have distinc have distinc chemical chemical formulasformulas

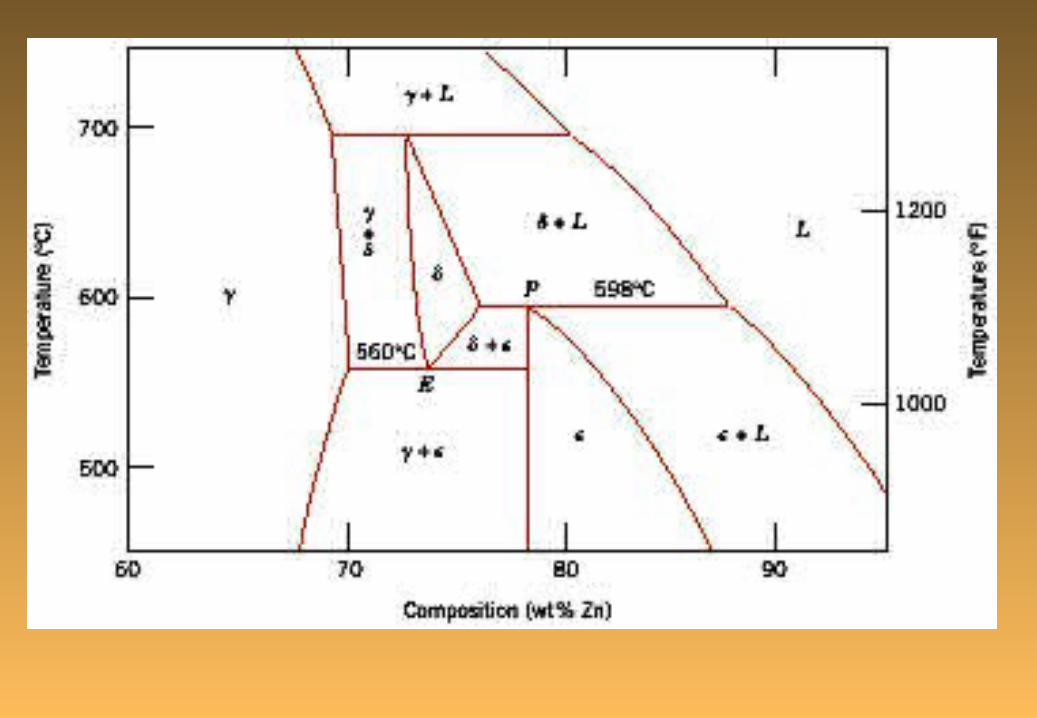
9.9 Eutectoid and Peritectic Reactions9.9 Eutectoid and Peritectic Reactions
Eutectoid ReactionEutectoid Reaction
– Invariant point E, Figure 9.19Invariant point E, Figure 9.19
– Upon cooling, a solid phase transforms into two other solid phasesUpon cooling, a solid phase transforms into two other solid phases
– Reverse reaction occurs on heatingReverse reaction occurs on heating
– Horizontal line at 560Horizontal line at 560ooC: eutectoid or eutectoid isothermC: eutectoid or eutectoid isotherm
– Eutectic Eutectic liquid on cooling transforms into two solids liquid on cooling transforms into two solids
– Importance: iron-carbon diagramImportance: iron-carbon diagram
Peritectic ReactionPeritectic Reaction
– Another invariant reaction Another invariant reaction (Point P, Figure 9.19)(Point P, Figure 9.19)
– Upon heating, one solid phase transforms into a liquid phase and Upon heating, one solid phase transforms into a liquid phase and another solid phaseanother solid phase
– (( + L) + L) on cooling on cooling
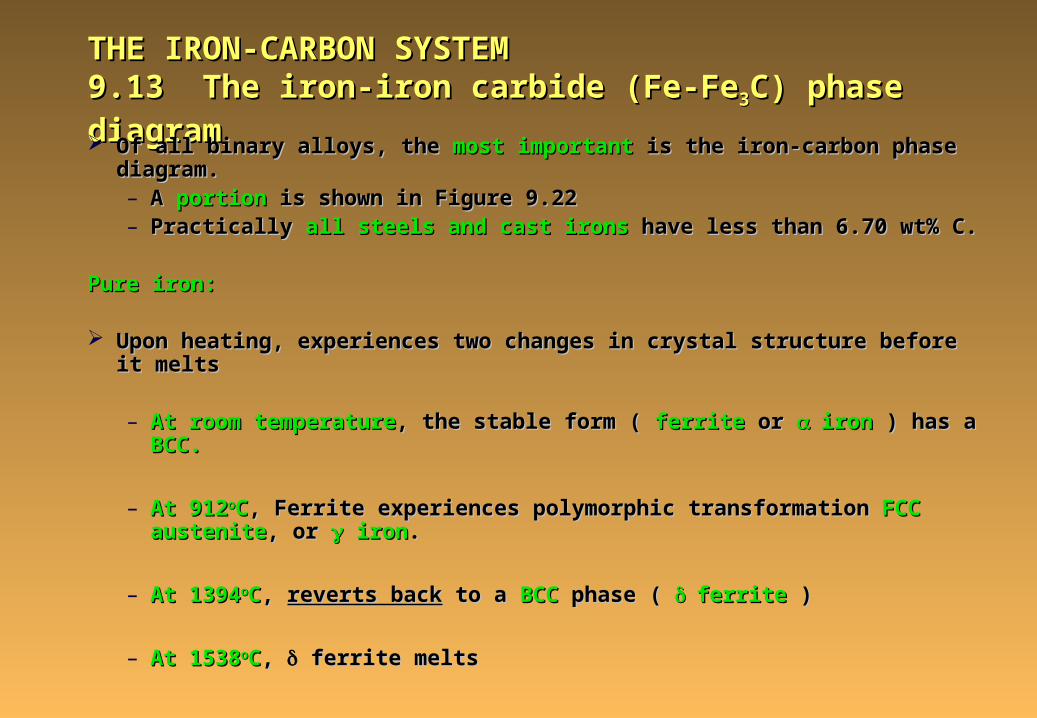
THE IRON-CARBON SYSTEMTHE IRON-CARBON SYSTEM9.13 The iron-iron carbide (Fe-Fe9.13 The iron-iron carbide (Fe-Fe33C) phase diagramC) phase diagram Of all binary alloys, the Of all binary alloys, the most importantmost important is the iron-carbon phase diagram. is the iron-carbon phase diagram.
– A A portionportion is shown in Figure 9.22 is shown in Figure 9.22– Practically Practically all steels and cast ironsall steels and cast irons have less than 6.70 wt% C. have less than 6.70 wt% C.
Pure iron:Pure iron:
Upon heating, experiences two changes in crystal structure before it meltsUpon heating, experiences two changes in crystal structure before it melts
– At room temperatureAt room temperature, the stable form ( , the stable form ( ferriteferrite or or ironiron ) has a ) has a BCC.BCC.
– At 912At 912ooCC, Ferrite experiences polymorphic transformation , Ferrite experiences polymorphic transformation FCC FCC austeniteaustenite, or , or iron iron..
– At 1394At 1394ooCC, , reverts backreverts back to a to a BCCBCC phase ( phase ( ferriteferrite ) )
– At 1538At 1538ooCC, , ferrite melts ferrite melts
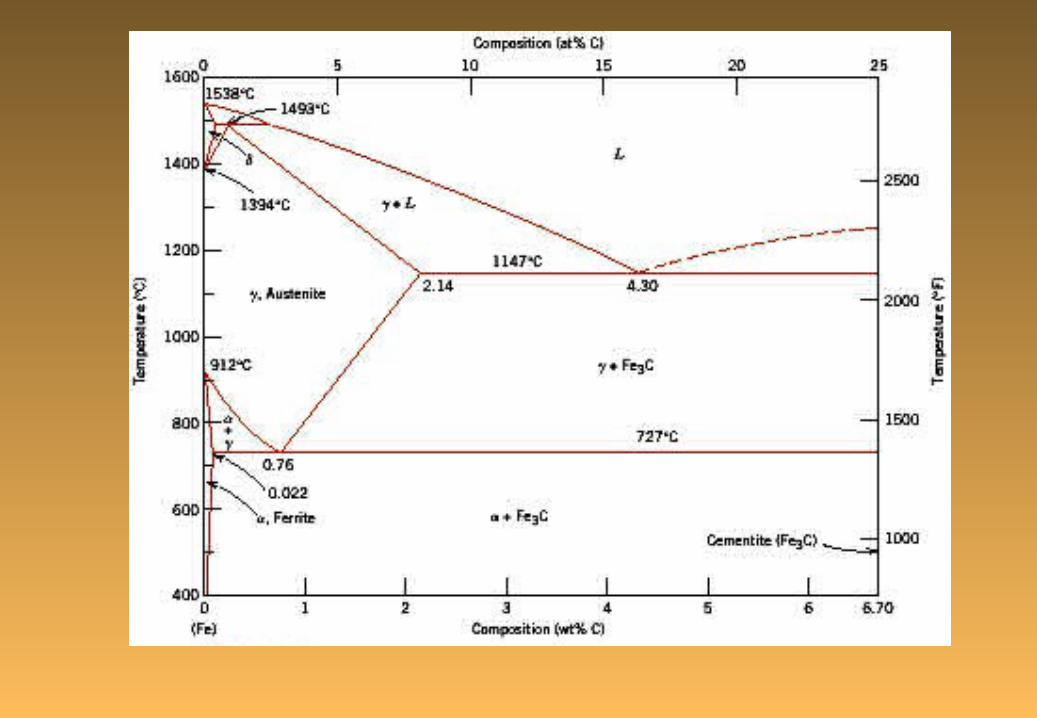

At 6.7 wt% CAt 6.7 wt% C
– Intermediate compound Intermediate compound iron carbideiron carbide, or , or cementitecementite (FE (FE33C), is formed.C), is formed.
– 6.7 wt% C corresponds to 100 wt% Fe6.7 wt% C corresponds to 100 wt% Fe33CC
Carbon is an Carbon is an interstitial impurityinterstitial impurity in iron in iron
– Forms a solid solution with each of Forms a solid solution with each of and and ferrites and ferrites and austenite austenite
BCC BCC ferrite ferrite
– Small concentration of carbon are soluble (0.022 wt% at 727Small concentration of carbon are soluble (0.022 wt% at 727ooC)C)
– Even though small concentration, significantly influences mechanical Even though small concentration, significantly influences mechanical propertiesproperties
– Relatively soft, magnetic at temperature below 768Relatively soft, magnetic at temperature below 768ooC, density of 7.88 C, density of 7.88 g/cmg/cm33
– Figure shows photomicrograph Figure shows photomicrograph

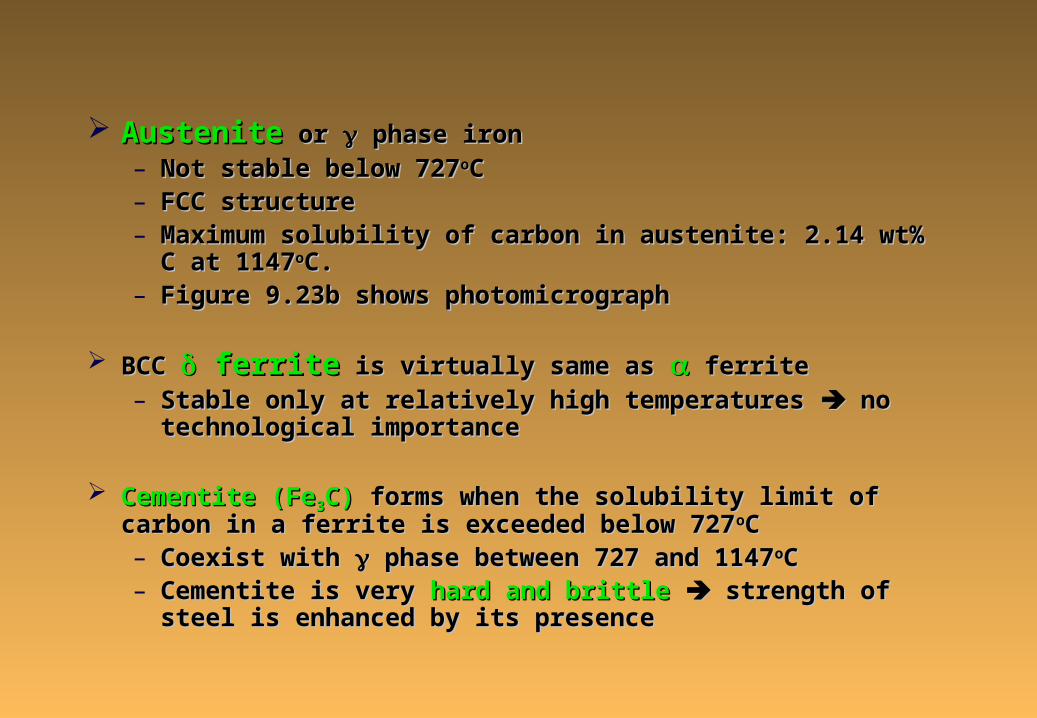
AusteniteAustenite or or phase iron phase iron– Not stable below 727Not stable below 727ooCC– FCC structureFCC structure– Maximum solubility of carbon in austenite: 2.14 wt% C at 1147Maximum solubility of carbon in austenite: 2.14 wt% C at 1147ooC.C.– Figure 9.23b shows photomicrographFigure 9.23b shows photomicrograph
BCC BCC ferrite ferrite is virtually same as is virtually same as ferrite ferrite– Stable only at relatively high temperatures Stable only at relatively high temperatures no technological no technological
importanceimportance
Cementite (FeCementite (Fe33C)C) forms when the solubility limit of carbon in a ferrite is forms when the solubility limit of carbon in a ferrite is exceeded below 727exceeded below 727ooCC– Coexist with Coexist with phase between 727 and 1147 phase between 727 and 1147ooCC– Cementite is very Cementite is very hard and brittlehard and brittle strength of steel is enhanced by strength of steel is enhanced by
its presence its presence

One One eutectic reactioneutectic reaction for iron-carbon system for iron-carbon system
– At 4.30 wt% C and 1147At 4.30 wt% C and 1147ooCC
L L on cooling on cooling + Fe + Fe33CC
L L on heating on heating + Fe + Fe33CC
Eutectoid invariantEutectoid invariant point at 0.76 wt% C and 727 point at 0.76 wt% C and 727ooCC
(0.76 wt% C) (0.76 wt% C) on cooling on cooling (0.022 wt% C) + Fe(0.022 wt% C) + Fe33C(6.7 wt%C)C(6.7 wt%C)
(0.76 wt% C) (0.76 wt% C) on heating on heating (0.022 wt% C) + Fe(0.022 wt% C) + Fe33C(6.7 wt%C)C(6.7 wt%C)

Chapter 9Chapter 9Sections: 9.14, 9.15Sections: 9.14, 9.15

9.14 Development of Microstructures in Iron-Carbon Alloys9.14 Development of Microstructures in Iron-Carbon Alloys
Microstructure depends on both the Microstructure depends on both the carbon content and heat treatmentcarbon content and heat treatment..
Discussion confined to Discussion confined to very slow coolingvery slow cooling equilibrium is continuously equilibrium is continuously maintained.maintained.
Phase changePhase change from from austenite region into the austenite region into the + Fe + Fe33C phase fieldC phase field
– Relatively Relatively complexcomplex, similar to eutectic system, similar to eutectic system
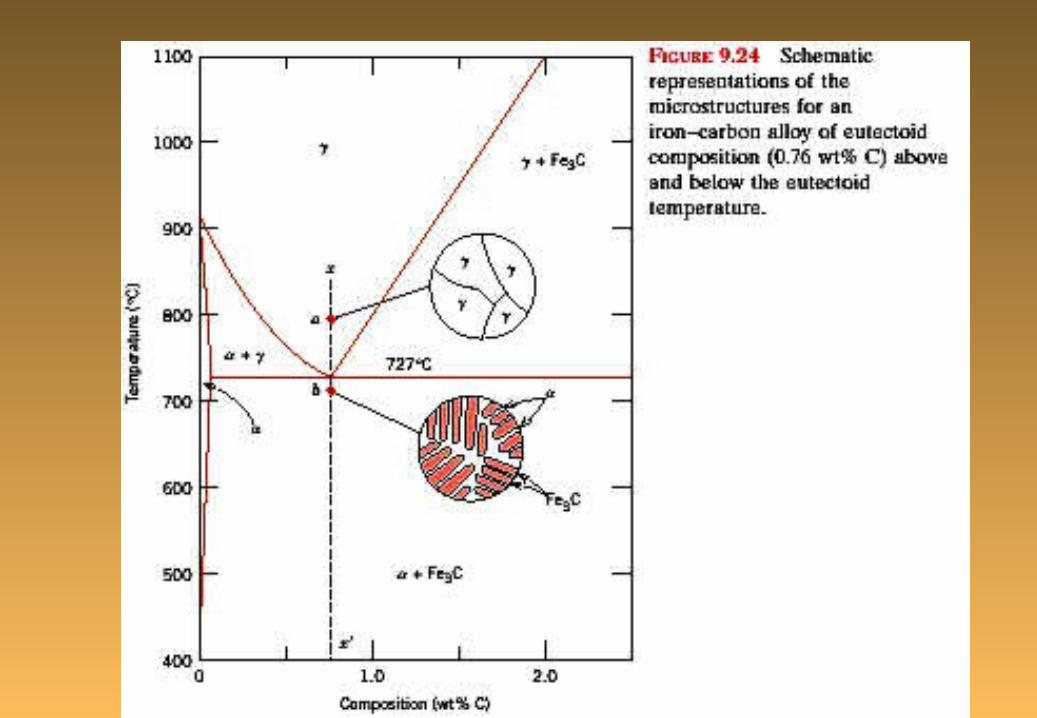
– Consider cooling of an alloy of Consider cooling of an alloy of eutectoid compositioneutectoid composition
((Point aPoint a at 0.76 wt% C and 800 at 0.76 wt% C and 800ooC)C)
– No changes until the eutectoid temperature (727No changes until the eutectoid temperature (727ooC)C)
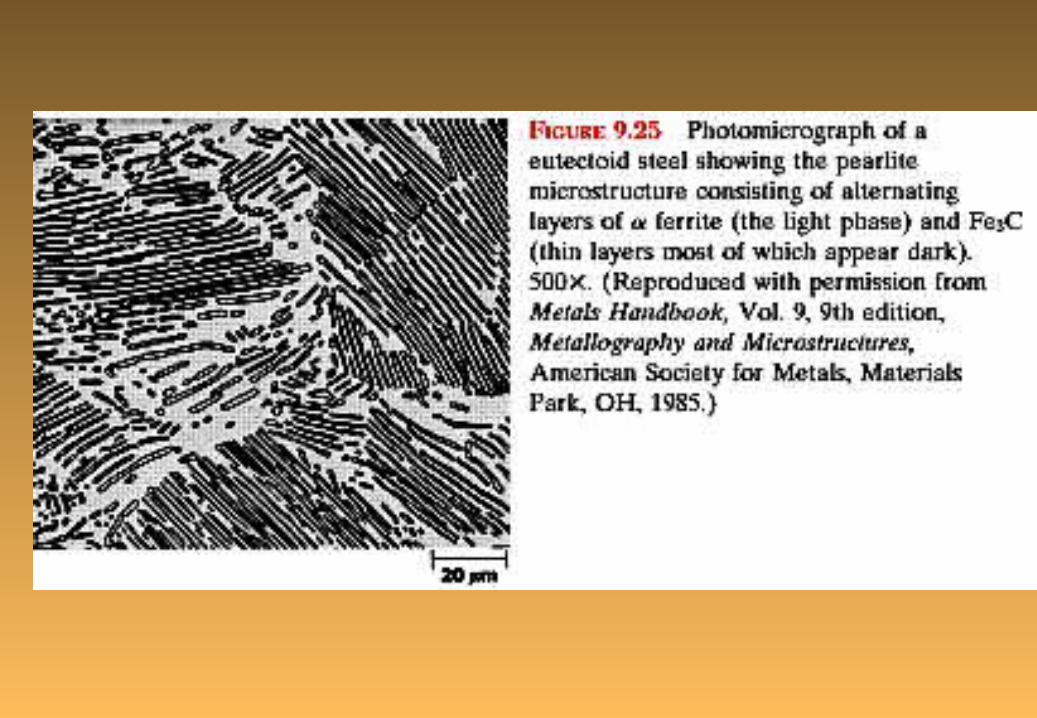
– At b, At b, pearlitepearlite microstructure microstructure
– Figure 9.25, Figure 9.25, photomicrographphotomicrograph of eutectoid steel showing the pearlite. of eutectoid steel showing the pearlite.

The pearlite exists The pearlite exists as grainsas grains
– Often termed Often termed coloniescolonies
– Layer Layer orientationorientation is same in each colony is same in each colony
– Thick light layers Thick light layers ferriteferrite phase phase
– Thin lamellae, mostly dark Thin lamellae, mostly dark cementitecementite
– Ferrite Ferrite soft and ductile soft and ductile
Cementite Cementite hard and brittle hard and brittle
PearlitePearlite intermediateintermediate between ferrite and between ferrite and cementitecementite

Hypo-Eutectoid AlloysHypo-Eutectoid Alloys
Consider a Consider a compositioncomposition Co to the Co to the left of eutectoidleft of eutectoid– Between 0.022 and 0.76 wt% CBetween 0.022 and 0.76 wt% C– Termed a Termed a hypoeutectoidhypoeutectoid (less than eutectoid) alloy (less than eutectoid) alloy– Cooling is shown in Figure 9.27Cooling is shown in Figure 9.27
At dAt d, about 775, about 775ooC, C, + + phase phase– Composition of Composition of ferrite (ferrite ( iron) iron) changes along MN changes along MN
» Slight changesSlight changes– Composition of Composition of austenite (austenite ( iron) iron) changes dramatically along MO changes dramatically along MO
At fAt f, just below the eutectoid, just below the eutectoid– All All -phase-phase having eutectoid composition having eutectoid composition transforms to pearlitetransforms to pearlite– No changeNo change in in -phase (ferrite )-phase (ferrite )– Ferrite exist in Ferrite exist in two phasestwo phases::
» Eutectoid ferriteEutectoid ferrite ferrite that is present in pearlite ferrite that is present in pearlite» Proeutectoid ferriteProeutectoid ferrite pre- or before eutectoid; formed above Te pre- or before eutectoid; formed above Te


Figure 9.28: Figure 9.28: photomicrographphotomicrograph of of a 0.38 wt% C steela 0.38 wt% C steel
– Large white regions: Large white regions: proeutectoid ferriteproeutectoid ferrite
– PearlitePearlite
» Dark regionsDark regions
» Spacing between Spacing between and and FeFe33C layers vary from C layers vary from
grain to graingrain to grain

Hyper-Eutectoid AlloysHyper-Eutectoid Alloys
Right side of eutectoidRight side of eutectoid ( between 0.76 and 2.14 wt% C) ( between 0.76 and 2.14 wt% C)
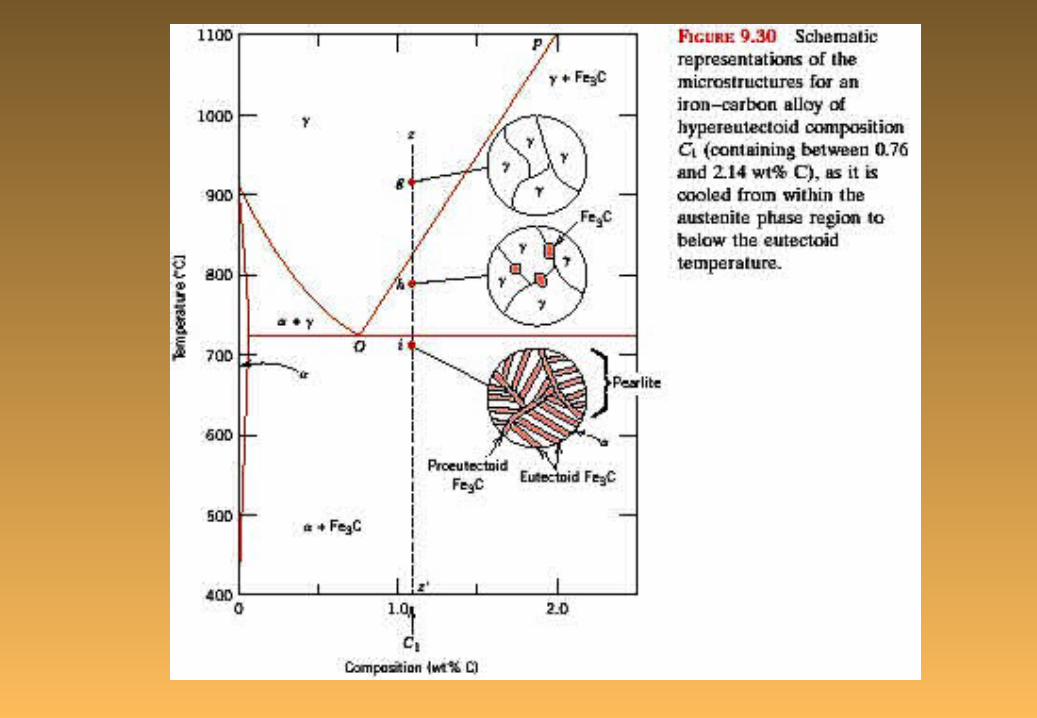
At gAt g, only , only phase (austenite ) of composition C phase (austenite ) of composition C11
Upon cooling Upon cooling at hat h, , + Fe + Fe33C phase field C phase field – Proeutectoid cementiteProeutectoid cementite that forms before the eutectoid reaction that forms before the eutectoid reaction– Cementite compositionCementite composition remains constant as the temperature changes remains constant as the temperature changes– Austenite compositionAustenite composition changes along line PO towards eutectoid changes along line PO towards eutectoid
Below eutectoid temperature Below eutectoid temperature at iat i, , – All All remaining austeniteremaining austenite of eutectoid composition of eutectoid composition pearlite ( pearlite (+Fe+Fe33C)C)– MicroconstituentsMicroconstituents of resulting microstructure of resulting microstructure
pearlite and proeutectoid cementite (Fig pearlite and proeutectoid cementite (Fig 9.30)9.30)

Photomicrograph of hypereutectoid alloys Photomicrograph of hypereutectoid alloys
Photomicrograph of 1.4 wt% C steel is shown in Fig. 9.31Photomicrograph of 1.4 wt% C steel is shown in Fig. 9.31
– Consists of pearlite and proeutectoid cementiteConsists of pearlite and proeutectoid cementite
– Proeutectoid cementite appears lightProeutectoid cementite appears light
– Same appearance as proeutectoid ferriteSame appearance as proeutectoid ferrite
difficulty in distinguishing between hypoeutectoid and difficulty in distinguishing between hypoeutectoid and hypereutectoid steels on the basis of microstructurehypereutectoid steels on the basis of microstructure
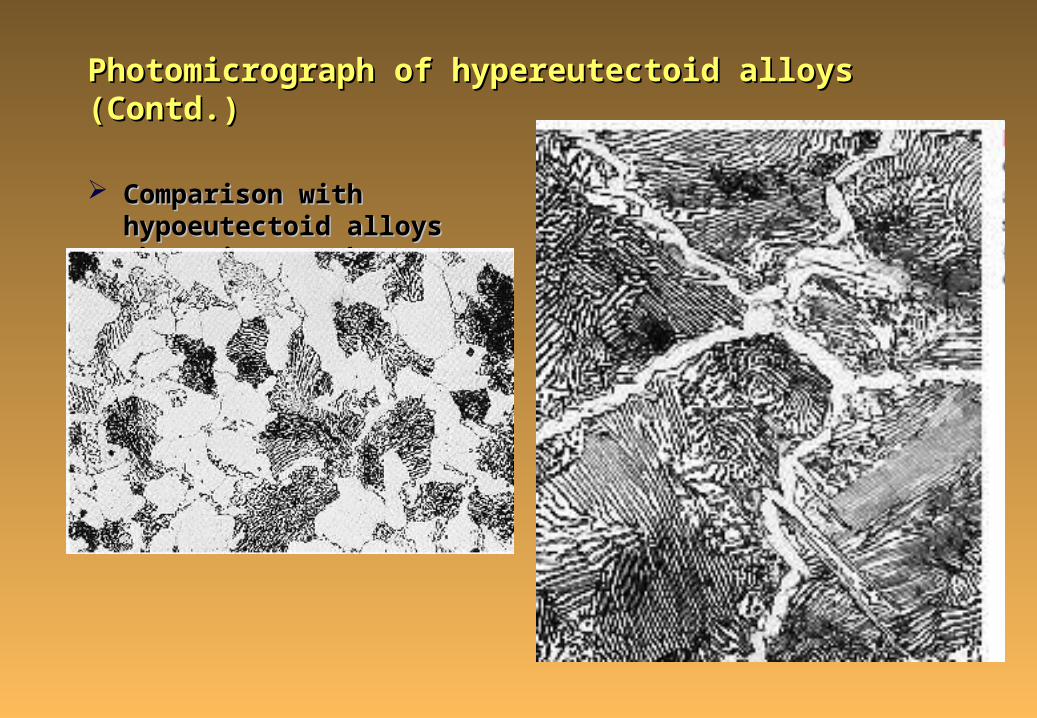
Photomicrograph of hypereutectoid alloys (Contd.)Photomicrograph of hypereutectoid alloys (Contd.)
Comparison with hypoeutectoid Comparison with hypoeutectoid alloys photomicrographalloys photomicrograph

Relative amounts for hypoeutectoid steel alloysRelative amounts for hypoeutectoid steel alloys
Using lever ruleUsing lever rule
Tie line extends between 0.022 and 0.76 wt% CTie line extends between 0.022 and 0.76 wt% C
Fraction of pearlite,Fraction of pearlite,
WWpp = T / (T+U) = (C = T / (T+U) = (Coo’’ – 0.022) / (0.76 – 0.022) – 0.022) / (0.76 – 0.022)
Fraction of proeutectoid Fraction of proeutectoid ,,
WW’’ = U / (T+U) = (0.76 - C = U / (T+U) = (0.76 - Coo
’’) / (0.76 – 0.022)) / (0.76 – 0.022)
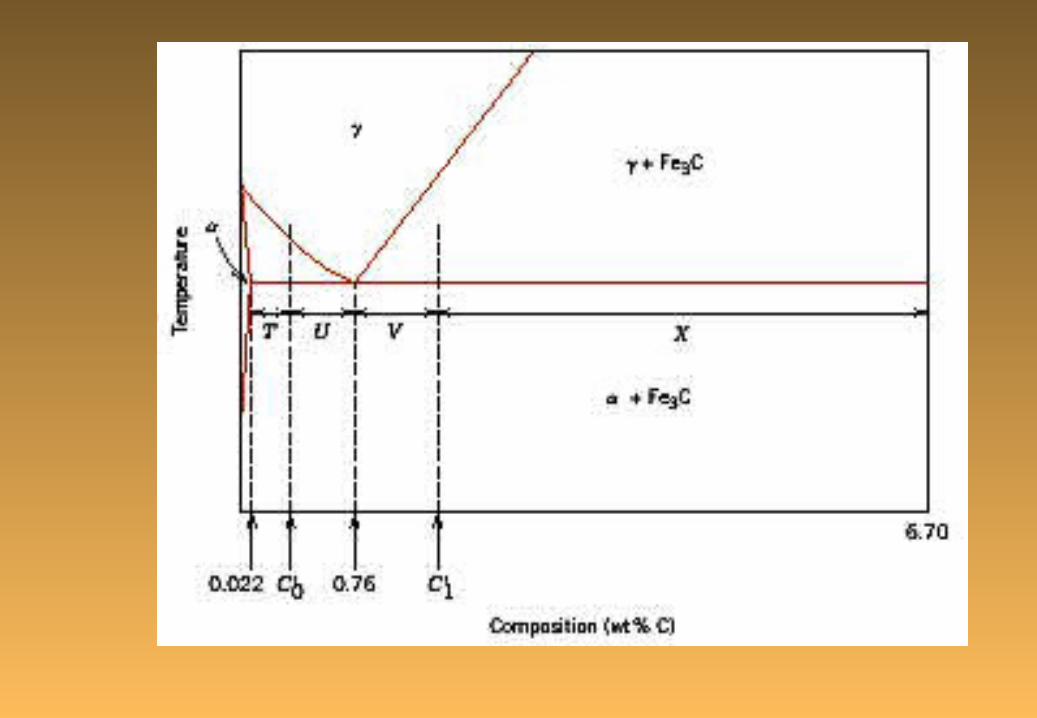
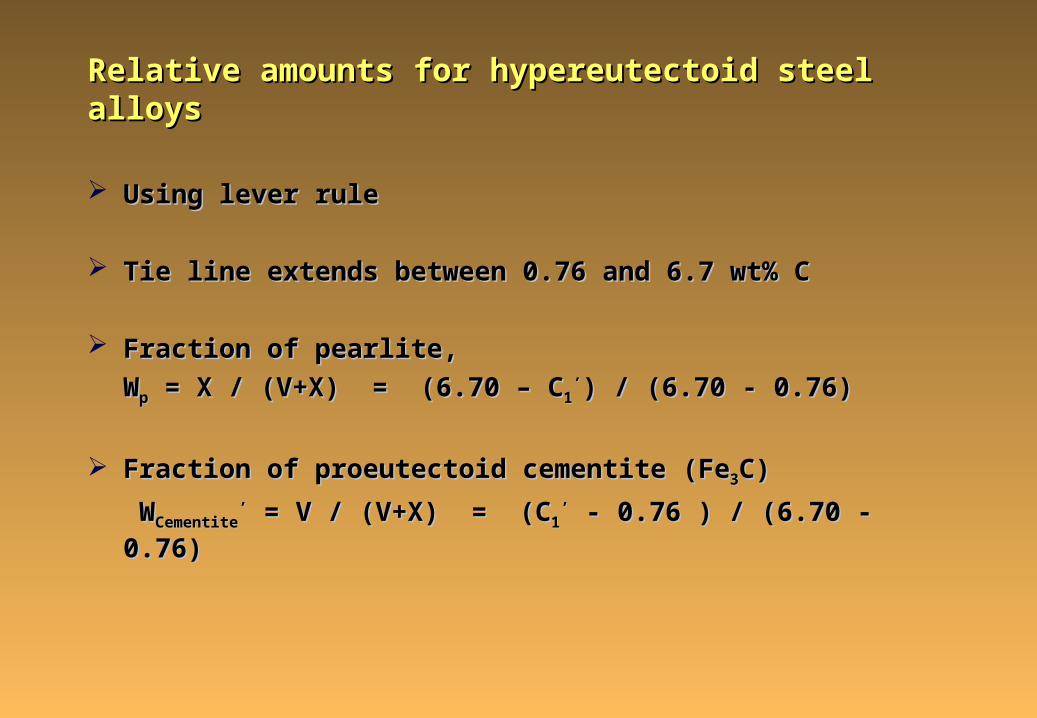
Relative amounts for hypereutectoid steel alloysRelative amounts for hypereutectoid steel alloys
Using lever ruleUsing lever rule
Tie line extends between 0.76 and 6.7 wt% CTie line extends between 0.76 and 6.7 wt% C
Fraction of pearlite,Fraction of pearlite,
WWpp = X / (V+X) = (6.70 – C = X / (V+X) = (6.70 – C11’’) / (6.70 - 0.76)) / (6.70 - 0.76)
Fraction of proeutectoid cementite (FeFraction of proeutectoid cementite (Fe33C)C)
WWCementiteCementite’’ = V / (V+X) = (C = V / (V+X) = (C11
’’ - 0.76 ) / (6.70 - 0.76) - 0.76 ) / (6.70 - 0.76)
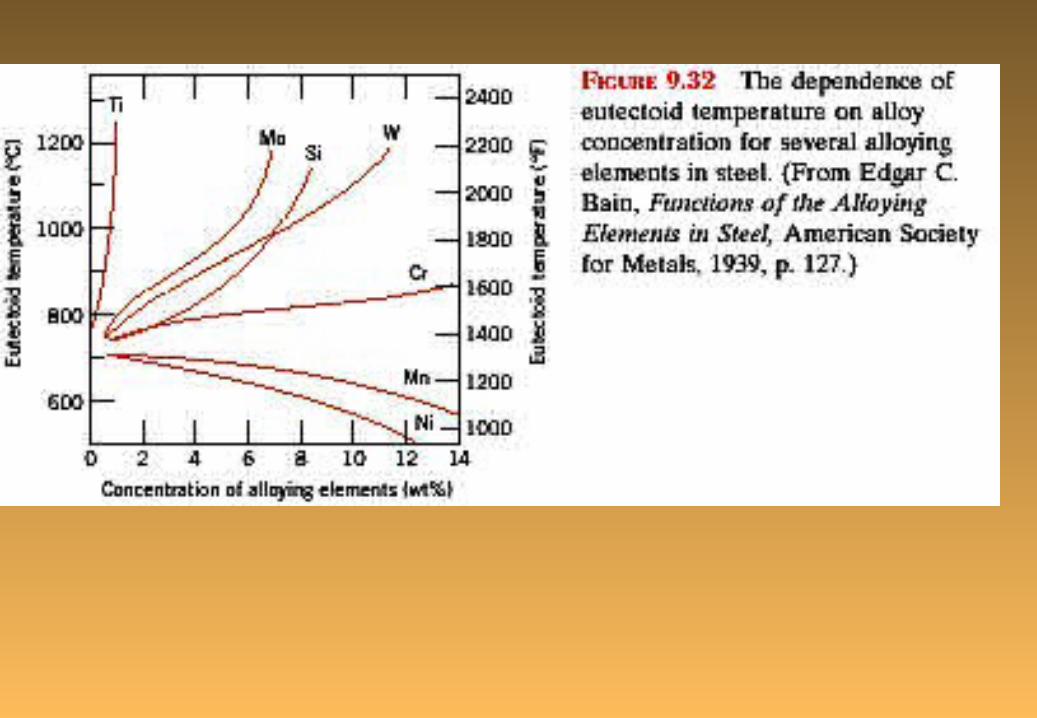
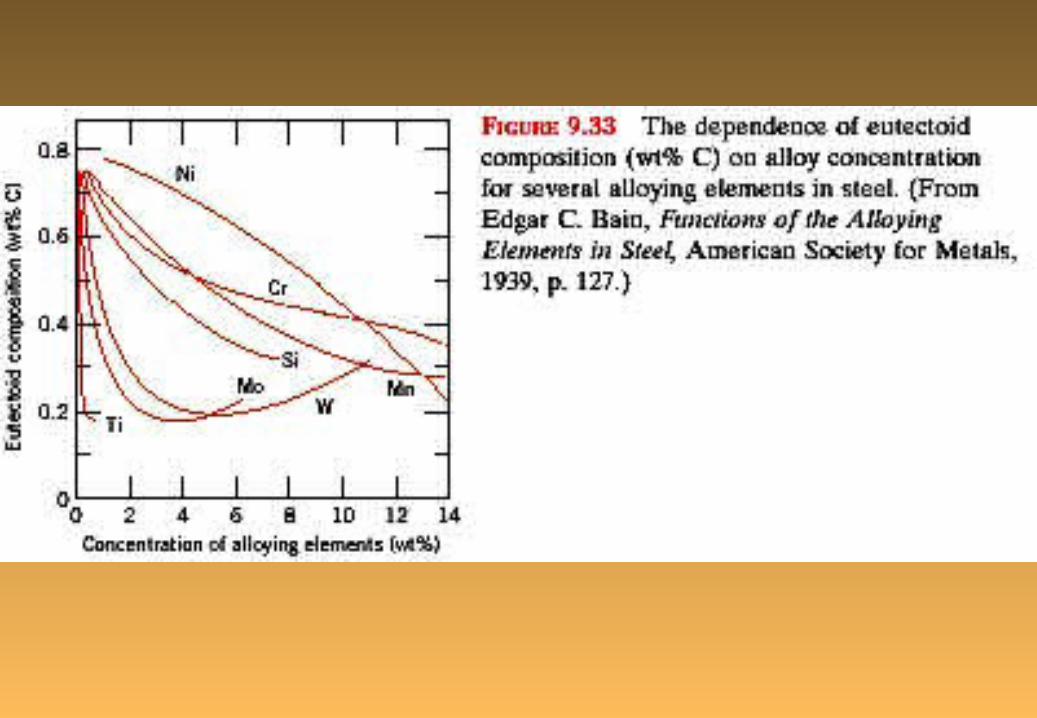
9.15 The Influence of Other Alloying Elements9.15 The Influence of Other Alloying Elements
Other alloying elements (Cr, Ni, Ti, etc.) bring about Other alloying elements (Cr, Ni, Ti, etc.) bring about dramatic changesdramatic changes
Changes in the position of phase boundaries and shapesChanges in the position of phase boundaries and shapes
One important change One important change shift in eutectoid position w.r.t temperature shift in eutectoid position w.r.t temperature and compositionand composition
These effects are illustrated in These effects are illustrated in Figures 9.32 and 9.33Figures 9.32 and 9.33