chapter 9 supplemental investigation on water use … · nevería, huachipa, ate and surco) 13 %...
TRANSCRIPT

9 - 1
CHAPTER 9 SUPPLEMENTAL INVESTIGATION ON WATER USE ANDLOSS IN RIMAC RIVER BASIN
9.1 Introduction
(1) Purpose of Supplemental Investigation
The Study Team commenced the Supplemental Investigation on August 7, 2001based on the implementation procedure of PHASE II described in item 2 of theMinutes of Meeting signed on March 1, 2000.
The purpose of the Supplemental Investigation is:
1) To obtain necessary data and information of the water use and water quality in themain stream of the Rímac River, and the main stream of the tributaries, the SantaEulalia River and the San Mateo River.
2) To identify and to confirm problems in water use, water quality, and waterdemand.
3) To assess if the water losses in the main stream of the Rímac River in the dryseason are larger than or equal to that estimated in the SEDAPAL’s Water SupplyMaster Plan for Lima Metropolitan Area (December 1998).
4) To clarify the implementation of the feasibility study for Phase II.
The Scope of the Study for the Supplemental Investigation on Water Use and Loss inthe Rímac River Basin is stipulated in the attachment of the Minutes of Meetingsigned on August 27, 2001.
(2) Study Area
The Study area is the Rímac River basin, one of the most important rivers of Peru,where, the capital city, Lima occupies its coastal and middle stretch. It provides thebasic needs of water resources to support its natural environment and the greatestsocio-economic activity of the country, where more than 30 % of the nationalpopulation, about 7.5 million in 2001, and more than 60 % of the industries areconcentrated.
9.2 Existing Condition of the Rimac River Basin
9.2.1 Topography and Geology
The catchment area of the Rímac River is about 3,583 km2, of which altitude variesfrom sea level to 4,850 m.a.s.l. The length of the main stream is 143 km and itsaverage river gradient is 1/29.5 (0.0339). The main river divides upstream ofChosica into two tributaries, the Santa Eulalia River and the Rímac River. (Thestretch higher than elevation 2,500 m.a.s.l. yields water resources.)

9 - 2
In general, the basin is covered by elastic sedimentary and volcanic formations of theage from Jurassic to Tertiary, intrusive rocks of the age from Cretaceous to Tertiaryand also Quaternary deposits. Jurassic formations are exposed in the northern part ofLima and extend to NW-SE direction along the Pacific Coast. The formationsconsist predominantly of andesitic extrusives associated with chert, shale, and etc.
Various facies of intrusive rocks are found in the western area of the WesternCordillera. These intrusives consist of granite, granodiorite, and tonalite, etc. ofCretaceous and Tertiary ages and andesite of Cretaceous. Small intrusive bodiessuch as andesite, rhyodacite, and trachyandesite are found in the Tertiary area.
There are many metal mines in the investigated area. Principal mineralization hasbeen associated with igneous activity in Miocene deformation stage during Andeangeotectonic process. The minings excavate various types of minerals which consistof galena, spherlite, chalcopyrite, barite with pyrite, etc.
Quaternary deposits, divided into Pleistocene and Helocene, consist of terrace withvarious levels, glacial, recent river and talus deposits. The deposits forming theground of Lima is largest among them in scale. Thick piles of sand and gravel withclay are found. Major part of the deposits are presumably Pleistocence in age andcovered by fan deposits of the Rímac river.
The basin is situated in the arid or semi-arid climate area with less vegetation.Furthermore, the mountains in the basin (the Andes mountains) upheaved during theTertiary are accompanied with various faults and fractures. As such, the basin isseverely exposed to weathering, making the basin vulnerable to the various disasters.
River terraces formed at Pleistocene are found in several places along the Rímac andSanta Eulalia river. There is a distribution of two or three-layered terrace depositshaving its height ranging from 10 to 50 m in the vicinity of Chosica. There is alsoterrace deposits in the upstream of Chosica. These deposits consist of boulder,gravel, sand, and clay having its thickness ranging from 30 to 50 m. Gravels andboulders that occupy a large part of the deposit have its size from a fist size to blockmore than 1 m. These are shaped roundly.
There are also old deposits which have a height of around 120 m above river bed inthe upstream of Santa Eulalia river. These deposits presumed to be formed duringglacial epoch are composed of various size of angular rocky materials. The similartype of deposits is also extensively distributed in many tributaries of the basin. Thisis the so-called “Older Huaycos” in Peru.
9.2.2 Meteorology and Hydrology
(1) Meteorology
1) General
The Rímac river basin is composed of the sub basins of the Santa Eulalia and SanMateo rivers. These two rivers merge into the Rímac river at the immediatelyupstream of Chosica city. The altitude of the Rímac river basin is from coast to4,818 m.a.s.l. at Anticona in Ticlio. Oceanic climate system generates two distinct

9 - 3
seasons, i.e. the wet season from November to April and the dry season from May toOctober. Less rainfall has been observed in the coastal area due to an effect of theHumboldt current, which provides cool air mass and it prevent an ascending aircurrent.
2) Rainfall
River basins for supplying water source to Lima city consist of the river basins of theRimac, Chillon, Lurin and most upstream area of the Mantaro. Location of therainfall observation stations and average monthly rainfall, are shown in Figure 2.2.1and Table 2.2.1 of Supporting report Volume IV. In the coastal area, the rainfallamount is very few throughout the year, i.e. less than 50 mm. Rainfall amountgradually increases corresponding to the altitude, e.g., about 250 mm at El. 2,000 m,400 mm at El. 3,000 m and 600 to 900 mm at El. 4,000 m or higher.
Most of the rainfall observation stations in the Mantaro river basin are located attheir altitude of 3,700 to 4,600 m. Average annual rainfall ranges between 550 mmto 900 mm. The largest annual average and maximum annual rainfall amounts wereobserved at Marcapomacocha (El. 4,600 m) about 1,308 mm and 2,209 mm during27 years (1969 - 1995). In the recent three decades, the principal El Nino hasoccurred in 1972-73, 1982-83 and 1991-92 and 1997.
3) Meteorological Data
There are 12 climatological stations in and adjacent basins of the Rímac river basin..as shown in Figure 2.2.3 of Supporting report Volume IV. Meteorological dataobserved in these stations are shown in Table 2.2.2 – 2.2.6 of Supporting reportVolume IV.
(2) Hydrology
1) River System
(a) River System in and around the Rímac River Basin
There are two (2) major river basins adjacent to the Rímac river basin, namelythe Chillón and Lurín river basins at the north and the south. In addition, themost upstream area in the Mantaro river basin supplies water to the Lima city.The upstream area of the Mantaro river basin lies on highly elevatedmountainous area from 3,800 m to 5,000 m or higher. The catchment area ofthe river basins are as follows:
Catchment Areas of River Basins
River Basins Catchment Area (km2) RemarksChillon river 2,237Rimac river 3,583Lurin river 1,642
Mantaro basin 827.5
Marca I : 147.0 km2
Marca II : 335.0 km2
Marca III : 116.5 km2
Carispacocha : 229.0 km2
Source: Master Plan (SEDAPAL, 1998)

9 - 4
(b) River System in Rimac River Basin
The principal rivers in the Rimac river basin is the Rimac (San Mateo atupstream) and Santa Eulalia rivers. The Santa Eulalia river joins to the Rimacriver at Chosica, 55 km from the estuary. The catchment areas of the Rimacand Santa Eulalia rivers at the confluence are 1,228 km2 and 1,085 km2,respectively. Longitudinal slope of the Rimac and Santa Eulalia rivers are 1:23and 1:17 at the upstream of the confluence, and 1/65 at the lower reach afterthe confluence.
(c) River System in Mantaro River Basin
Upstream area of the Mantaro river basin contributes to supplying water to theLima and surrounding area for the purposes of a potable water, hydropowergeneration, industrial, irrigation water supply, etc. Several lagoons located atthe most upstream of the basin rink each other with small streams, and thetributaries originate from these lagoons merge into the Mantaro river.
(2) Run-off of River System
1) Hydrological Station
Location of the water level gauging stations in and around the Rímac river basin arepresented in Figure 2.2.5 of Supporting report Volume IV.
2) Run-off of Rímac River Basin
Average annual discharge observed at Chosica station (SENAMHI) is estimated atapproximately 25.8 m3/sec, 814 MCM for a period of 31 years, 1965 to 1994 afterthe Marca I project and lagoon rehabilitation works upstream of the Santa Eulaliariver have been completed in 1965. Major reservoirs and lagoons are listed inTable 2.2.7 of Supporting report Volume IV. Total effective storage volume of 125MCM in the Rímac river basin contributes to constantly maintain river flow about6.9 m3/sec for the period of May to November except drought year.
3) Reservoirs and Lagoons in Mantaro River Basin
Water source development plans in the Mantaro river basin have been implementedsince 1962 corresponding to an increase of the water demand in Lima andsurrounding area including a hydropower generation. The main feature of theseproject from a view point of hydrological potential are as follows:

9 - 5
Description of Marca and Other Related Projects
Project Title Reservoir and Lagoons DiversionCapacity Remarks
Marca I+III Marcapomacocha : 80 MCMAntacoto : 120 MCM 7.0 m3/sec
Marca II
Huacracocha : 7.5 MCMHuascacocha : 9.3 MCM
Huallacocha Alto : 0.74 MCMHuallacocha Bajo : 18.0 MCMPomacocha : 70.0 MCM
Total : 105.54 MCM
6.5 m3/sec
Huascacocha 52.5 MCM 2.5 m3/sec
Mantaro-Carispacocha
Carispacocha : 22.5 MCMMarcapomacocha : 100-140 MCM (*)
Antacoto : 120 MCM5.0 m3/sec
Notes: (*) Existing capacity is 14.8 MCM
9.2.3 Existing Water Use and Water Rights
(1) Irrigation Facility
The Rímac River Valley has a deficient irrigation facility, which is mostly primitivewithout control gates at the intakes and canals. The rapid reduction of theagricultural area is a main reason of these troubles, as well as the lack of cultivationand irrigation expansion plans and the inappropriate technical distribution, etc.
In the Rímac River Irrigation District, from Chosica to Callao, there are 18 intakesfor irrigation and industry use, La Atarjea intake for potable water supply anddiversion channel for the Huampaní Hydroelectric Power Station. The location ofthese facilities is shown is Figure 9.2.1.
The Chillón-Rímac-Lurín Irrigation District Technical Administration, the RímacRiver Board of Users, and SEDAPAL were going to sign an agreement on the RímacRiver water distribution in drought season (1999) for a better water use andmanagement. Although it was not carried out, however the fifth clause of theagreement determined the flow rates for the different uses as follows:
Flow Rates for the Different Uses
Water Use Flow Rates(a) Population 80 %(b) Agriculture (Carapongo, La Estrella,
Nevería, Huachipa, Ate and Surco)13 %
(c) Mining Industry (Cajamarquilla) 1 %(d) Infiltration 6 %
In addition, the Rímac River minimum flow was established in 9.88 m3/sec(1921-1997), considering a persistence of 90 %.

9 - 6
(2) Present Water Use Evaluation for Irrigation and Its Problems
There are several problems on the water use for irrigation, as follows: Thissituation does not allow the implementation of an appropriate control andmeasuring facility.
1) Seasonal Inconsistency in the Water Demand and the River Discharge
2) High Contamination
3) Deterioration of Intake Works and Irrigation Channels
4) Inappropriate Management of the Water Resources
5) Poor Irrigation Proficiencies
6) Poor activity of the Board of Users
7) Difficulty to collect water rates and fees from the farmers
(3) Water Rights
1) Jurisdiction and Management Authority
The Irrigation District is a geographical area upon which the Irrigation DistrictTechnical Administrator exercises authority. The Ministry of Agriculture willestablish the area of each Irrigation District based on real aspects of the watershedand the needs for effective water management.
Watersheds with regulated irrigation and intensive multi-sectoral water use, like theRímac River, are managed by the Rímac River Basin Autonomous Authority, whichis responsible for formulating water resource development plans in its jurisdiction.As the main public user, SEDAPAL belongs to the Board of Directors.
The Rímac River Basin Self-Governed Authority is responsible for formulatingmaster plans on water resource development, supervising watershed managementand water-related actions, solving ultimately any appeals lodged against thedirectives issued by the Irrigation District Technical Administrator.
2) Board of Users
This organization represents all the water users of the Irrigation District. It isconformed by one or more representatives of each Irrigation Users Commission, onedelegate of the Sanitation Service Agencies to which SEDAPAL belongs, twodelegates named by the users of the Energy and Mining Sectors, respectively; andone delegate of other sectors. As the main user of the Rímac basin water resourcesfor domestic and public purposes, SEDAPAL has preference and priority before theagricultural uses, according to the General Law of Waters.
3) Government Bodies
The Board of Users, the General Assembly, and the Board of Directors aregovernment bodies; but the General Assembly is the most important one because allthe water users constitute it.

9 - 7
4) SEDAPAL Administrative Proficiency
SEDAPAL, as a water user of the Rímac Irrigation District, is part of the Board ofUsers; and, consequently, has the monthly assignment of supplying water for publicuse, complying with the payment of rates.
The organization of the water use and management and its relation with SEDAPALin the Rímac River basin are shown in Figure 9.2.2.
9.2.4 Water Quality and Environment
(1) General Description of Water Quality and Environment
It has been reported since 1960th that the water quality of the Rímac River issignificantly contaminated from its origin in Ticlio to the river mouth in Callao dueto toxic chemical substances (acids, pesticide, fertilizer, nitrate, sulfates, heavymetals, etc.), non degradable materials (plastic, rubber, metal, etc.) andmicroorganism (coliforms, viruses, general pathogen, etc.). Those are dischargedfrom more than 107 entities (domestic, industrial, mining and agricultural-farming).The water quality of the tributary, the Santa Eulalia River is reported to be fairlygood.
It was reported that biological resources, wild life, plant life, and land ecosystemswere completely transformed since 1960th, in particular the ecosystems induced inthe agricultural fields, the river forests, and the urban parks. Those transformedinclude high diversity of birds, rodents, insects and reptiles. The hydro-biologicalresources are also practically extinct. The river shrimp and an endemic fish, pejerreywere extinct since 1960th. However, many of natural springs in the valley betweenChosica and La Atarjea still sustain very small and ornamental fish.
The legislation decree No. 613, Environmental and Natural Resources Code wasenacted on September 8, 1990. The general water law, D.L. No. 17752 was enactedon July 24, 1969. Under the general water law and its norms, the environmentalsanitation office of the Ministry of Health is the institution in charge of enforcingcompliance to these established norms. The legislation decree No. 613,Environmental and Natural Resources Code was enacted on September 8, 1990.
(2) Water Quality Monitoring Method and Result
SEDAPAL has established its monitoring water quality program includingestablishment of sampling stations in order to evaluate and determine the waterquality of the entire Rímac River basin. Physical and chemical analyses of watersamples for the program started from 1993 in the SEDAPAL’s laboratory for thefollowing parameters:
Physiochemical pH, temperature, muddiness, specific conductivity, dissolvedoxygen, total solids, dissolved oxygen, total solids, dissolved solids, suspended
Source: Law for Boards of Users and Irrigation Commissions
Edited by the National Board of Users of the Irrigation District of PerúMarch 2001

9 - 8
solids, cyanide, total carbon, inorganic carbon, organic carbon, trihalomethanes, iron,manganese, lead, cadmium, chrome, copper, zinc, aluminum, barium, arsenic.
Metals iron, manganese, lead, cadmium, chrome, copper, zinc, aluminum, barium,arsenic.
These parameters are mainly total metals and dissolved in water. All the metals in thelist are considered toxic. These parameters are required to evaluate the level ofcontamination. Some parameters are also used to evaluate the environmental impactor the toxicity level of the water, whether for human health reasons, aquaticresources, agriculture or irrigation.
SEDAPAL’s laboratory adopts the physical-chemical analysis, metal analysis,cyanide analysis, organic carbon analysis, trihalomethane analysis. The analyticalmethod for respective parameters is shown in Table 2.4.1 of Supporting reportVolume IV. The annual average results of the water quality analysis in the period1993-1996 are summarized in Table 9.2.1. The conditions of 1999-2000 period wasreported to be more ore less same. The location and condition of the sampling stationis shown in Figure 9.2.3. These values are compared to the permissible limits forwatercourses, Classes I of the general water law, D. L. No. 17752 and the level of theWHO guidelines. The condition of the water quality is summarized below.
ParametersLimits ofGeneral
Water LawWHO
Guidelines Quality Level
Physical-chemical analysispH 5 – 9 < 8 Within the permissible limit for Classes I & IIISuspended solids (turbidity) 0 mg/l 5 Fairly high value (34.5mg/l) at La Atarjea, increasing from
Graton tunnel to Tamboreque intake, Lower in Huanpani-LaAtarjea stretch than the mountain reach (21-61mg/l)
Dissolved Oxygen (DO) > 3.0 mg/l Within the permissible limits for all the classesMetal AnalysisAluminum, Al - 0.2 mg/l High concentrations identified in the complex in Tamboreque
(0.5-6.0 mg/l) and the Aruri river (0.9-1.5 mg/l), La Atarjeaintake (0.6-2.1 mg/l), the rest below 2.0 mg/l)
Arsenic, As 0.1 mg/l 0.01 mg/l Identified above the permissible limit for Class I and III (0.2mg/l), The complex in Tamboreque (0.04-2.1 mg/l), Ruri river(0.31-0.63), La Atarjea intake (0.02-0.07), the rest below thepermissible limit
Barium, Ba 0.1 mg/l 0.7 mg/l Identified above the permissible limit for Class I at all stations,La Atarjea intake (max.0.14 mg/l)
Cadmium, Cd 0.01 mg/l 0.003mg/l
Identified above the permissible limit for Class I at severalstations (0.01-0.03 mg/l), La Atarjea intake (0.004-005 mg/l)
Zinc 5.0 mg/l 3.0 mg/l Mostly below permissible limit for human consumption forClass I (5.0 mg/l) and Class III (25.0 mg/l), Maximumidentified at Tamboreque (6.3 mg/l) and Arui river (5.1 mg/l)
Copper, C 1.0 mg/l 2.0 mg/l Below permissible limit for Class I (1.0 mg/l) at all stations,The complex in Tamboreque (1.1-0.29 mg/l), La Atarjea intake(0.006-0.09 mg/l)
Chrome, Cr 0.05 mg/l 0.05 mg/l Below permissible limit for Class I (0.05 mg/l) at all stations,The complex in Tamboreque (0.0007-0.01 mg/l), La Atarjeaintake (max. 0.013 mg/l)
Iron, Fe 1.5 mg/l 0.3 mg/l Identified above the permissible limit for Class I at all stations,La Atarjea intake (2.7-5.3 mg/l), Santa Eulalia river (0.58-1.55mg/l), Tamboreque II bridge (max 9.36 mg/)
Manganese 0.1 mg/l 0.5 mg/l Above permissible limit for Class I at most stations exceptSanta Eulalia river (0.04-0.12 mg/l), La Atarjea intake (max.0.13-0.22 mg/l)
Lead, Pb 0.05 mg/l 0.01 mg/l Above permissible limit for Class I at all stations, lowest inSanta Eulalia river, La Atarjea intake (max. 0.17-0.26 mg/l)
Cyanide 0.2 mg/l 0.07 mg/l Below permissible limit for Class I at all stations, The complexin Tamboreque (0.005-0.01 mg/l), La Atarjea intake (max.0.0011 mg/l)
Trihalomethane analysis - - 1.88-13.93µg/l (from other data 1993-1996)

9 - 9
Concentration of most of the toxic substances are identified significantly higher thanthe permissible maximum limits, in particular lead and arsenic at Station No. 6downstream of the Tamboreque mine complex.
Domestic wastewater contains fecal liquid and solids. Bacteriologic contamination iscaused mainly by this source. This problem was confirmed through an invertebratemacro study by FAO (1993). High concentration of fecal coliforms were reporteddownstream of Chosica all the year, in particular in the area between Ricardo Palmaand Chaclacayo (30,00-160,000 NMP/100ml in 1993-2000). It varied from 1,000 to240,000 NMP/100ml at the La Atarjea Intake in 1993-2000. Main sources of organiccontamination result from the industries located along the river, mainly betweenRicardo Plama and Ñaña with small contribution from agricultural and domesticsources (CEPIS 1992). BOD was recorded in a range 1.2-7.3 mg/l in 1993-2000.
Assessment of these values is presented in Section 9.3.3
9.2.5 Hydrogeology and Groundwater
The aquifer of Lima is made of complex fluvial-alluvial formations, intercrossed withbedding levels and its thickness varies from 100 m in Vitarte (Huachipa Bridge) to400-600 m in the coastal area, according to geophysical studies. There are isolatedoutcrops in the valley like hills arising at several points of the fluvial-alluvial plainand the plain continues to the Western Andean Mountain foothills, among which theRímac and Chillón Rivers run, crossing the valley.
It has been possible to check lithological profiles and geophysical conditions of theupper part of the alluvial plain of the lower reach of the Rímac river basin. The plainis composed of granular sediments, and these tend to accumulate a greater quantity offine sediments in deeper portion, becoming less usable as an aquifer. In the valley,the rock foundation is at depths varying from 100 m in Vitarte to 400-600 m towardthe Coastal area.
The aquifer of the Rímac River Valley is recharged basically by ground water flowsof the upper part of the valley (7.20 m3/sec); filtration flows from irrigation channelsand leaks of the sewerage network in the urban area (1.60 m3/sec); the interchangebetween Chillón River, Rímac River and the aquifer (3.90 m3/sec); and from theinterchange between the aquifer and the sea (seawater inflow or fresh water outflow)(1.30 m3/sec). The Amsa-Antea Association made these calculations in 1998.
The valley ground water has suffered an unbalance in the last 30 years due to theoverexploitation of ground water through tubular wells. This unbalance, interpretedas permanent decreases in ground water, has caused a decline of ground water levelsat a rate of 1.5 m/year, and there are many borderlines of aquifer with decreases of upto 4.0 m per year. These decreases have caused the inflow of seawater into theaquifer, contaminating it. The damaged areas are the districts located in the coastalzone.
In 1997, the aquifer exploited 12 m3/sec using 1,100 tubular wells (from which 400were for population use, with discharges of 8.3 m3/sec, and 700 were for the

9 - 10
industrial use with discharges of 2.45 m3/sec), and 50 wells for private agriculturaluse with discharges of 1 m3/sec.
To date, the ground water exploitation at the valley is of 12 m3/sec (6 m3/sec bySEDAPAL and 6 m3/sec by private sector), including the aquifers of Rímac andChillón rivers. In order to maintain the balance of inflow and outflow water in theaquifer of Lima, ground water exploitation should not exceed 8.0 m3/sec, expressedin a constant discharge or its equivalent to 240 MCM (Amsa-Antea, 1999), in theother hand SEDAPAL as conservationist policy is limiting ground water exploitationto 5 m3/sec.
The evolution of values for electric conductivity that measures the globalconcentration of dissolved salts in water has shown variations. The electricconductivity data for 1971, obtained from the hydrogeological map of Lima wasbetween 0.6 and 3.0 mmhos/cm at +25°C, while the conductivity data recorded for1994 are between 0.4 and 6.0 mmhos/cm at + 25 °C.
This increase in conductivity denotes the chemical damage that the Rímac RiverValley aquifer suffers, due to an overexploitation of ground water, withoutconsidering the ground water salinity due to seawater inflow. The valley waters areclassified chemically in bicarbonate-calcium waters and sulfate-calcium waters.
The induced recharge pilot project operates along 6 km of the middle Rímac rivervalley, upstream from La Atarjea treatment plant, by drilling 30 wells located nearthe Rímac riverbanks: 18 on the right riverbank and 12 on the left riverbank, with aproduction capacity of 1.5 m3/sec. Based on the results of the induced recharge pilotproject, consideration is being given to carry on and expand the project until reaching22 km, to the town of Chaclacayo. From the 400 m3/sec surface water that currentlydischarge to the sea during flood seasons, it is expected to divert 5 m3/sec surfacewater.
9.3 Assessment of Water Quantity and Quality
9.3.1 Discharge
The SENAMHI, EDEGEL and SEDAPAL are responsible for the data collection andprocessing in most of the stations. The discharge data have been practicablyanalyzed in monthly and annual basis.
The annual run-off in the Rímac river basin (1965-1994) is estimated at about 21.3m3/sec (672 MCM) in average referring to the discharge balance observed at theChosica station (EDEGEL, 25.8 m3/sec, 814 MCM) and at the Milloc station (4.5m3/sec, 142 MCM) which has been diverted from the Mantaro river basin. Durationcurve of the Rímac river observed at the Chosica station is shown in Figure 9.3.1.The discharge of 50 % and 90 % reliability, which include diversion flow from theMantaro river basin and also regulated flow from the Yuracmayo reservoir, are 22.1m3/sec and 14.7 m3/sec, respectively.

9 - 11
The historical discharge records well indicate the water resources development inboth river basins for four decades. However the hydropower plants have depletedand varied the stream flows so as to meet daily and seasonal power demand.Furthermore the reservoirs as well as natural and artificial lagoons regulate thestream flow during the dry season. Consequently complex operation of reservoirsand power plants does not allow accurate run-off calculation.
Run-off coefficient is an important indicator to estimate actual run-off amount. Run-off coefficient of 0.56 was observed at the Yauli river basin (Pomacocha) of Marca IIproject in the Mantaro river basin. While run-off coefficient in the Rímac river basinis roughly estimated at 42 % based on the mean annual run-off and rainfall data. It isassumed that higher run-off coefficient in the Mantaro river basin is due to the lowpermeability of the surface layer and less vegetation cover.
Other than the monthly discharge records, hourly discharge data observed at theChosica station (SENAMHI) and La Atarjea intake (SEDAPAL) have been collectedto estimate a stream flow loss in lower reach of the Rímac river basin in 30 km long,where a wide and deep river deposit causes infiltration loss. Furthermore monthlydischarge data at Sheque and Tamboraque stations under the EDEGEL operationhave been collected for a loss calculation in the middle and upper reach. Otherdischarge data observed at the hydropower stations located upstream the Chosicastation are unlikely to be used for estimating loss because their flow measurementsare limited to the hydropower generation, and discharge is controlled by regulatingponds in response to the power demand from time to time.
9.3.2 Surface Water Quantity and Loss
(1) Discharge Measurement
1) Finding at Discharge Measurement
It is notified that the discharge records used for several study reports have notablediscrepancy in quantity, in particular the loss calculation of the river flow of the 1998SEDAPAL Master Plan, this loss was assumed to be 5 % in the dry season meandischarge which amounts 0.67 m3/sec. In this regard, a discharge measurement hasbeen conducted to examine the physical water loss in the river channel, confirmingalso accuracy of the discharge records measured at several gauging stations.
Field investigation and discharge data analysis have identified the followingconditions:
(a) Five (5) hydropower stations control stream flow by the regulating pondsfrom time to time to meet power demand in Lima and surroundings.Variation of the power plant flow interrupts loss estimation.
(b) As described in (a) above, river discharge fluctuates in a short period dueto the hydropower plant operation. SEDAPAL therefore estimates theintake discharge at the La Atarjea intake site subtracting about 6.0 m3/secfrom the total discharge observed at the upstream gauging stations of theHuinco and the Matucana hydropower stations in the Santa Eulalia and

9 - 12
the Rímac rivers, respectively. This 6.0 m3/sec is equivalent to thedischarge loss.
(c) There exist several diversion weirs along the Rímac river for the use ofthe industrial and irrigation purposes. The loss mentioned above includesthose water use.
(d) The channel training works of the Rímac river, widening the channelwidth from about 20 m to 180 - 200 m for improving groundwaterrecharge through the permeable river deposits in the stretch of 6.0 kmlong immediately upstream of the La Atarjea intake site.
(e) The discharge records at the Chosica SENAMHI station are assessed asmost reliable for the run-off analysis because there is no bypass oroverflow at the station.
(f) Diversion discharge through the existing irrigation intakes varies fromtime to time depending on the water level of the Rímac river.
After review of the foregoing findings, several sites have been selected for the StudyTeam's direct discharge measurement as indicated in Figure 9.3.2. Measurement atthe sections 1B to 5B aims at infiltration rate measurement in the 6.0 km stretchwhere groundwater recharge project is under operation at present. Sections 1A to 4Aaim at counterchecking accuracy of the existing discharge records of SENAMHI andEDEGEL.
(2) Amount of Water Loss
1) Loss in the Lower Reach of the Rímac river
With regard to the water loss in the main stream of the Rímac river basin, thefindings are as follows:
(a) Majority of the water loss in the main stream of the Rímac river basinoccurs in the lower reach of the Rímac river, in particular in the stretchbetween Chosica and La Atarjea.
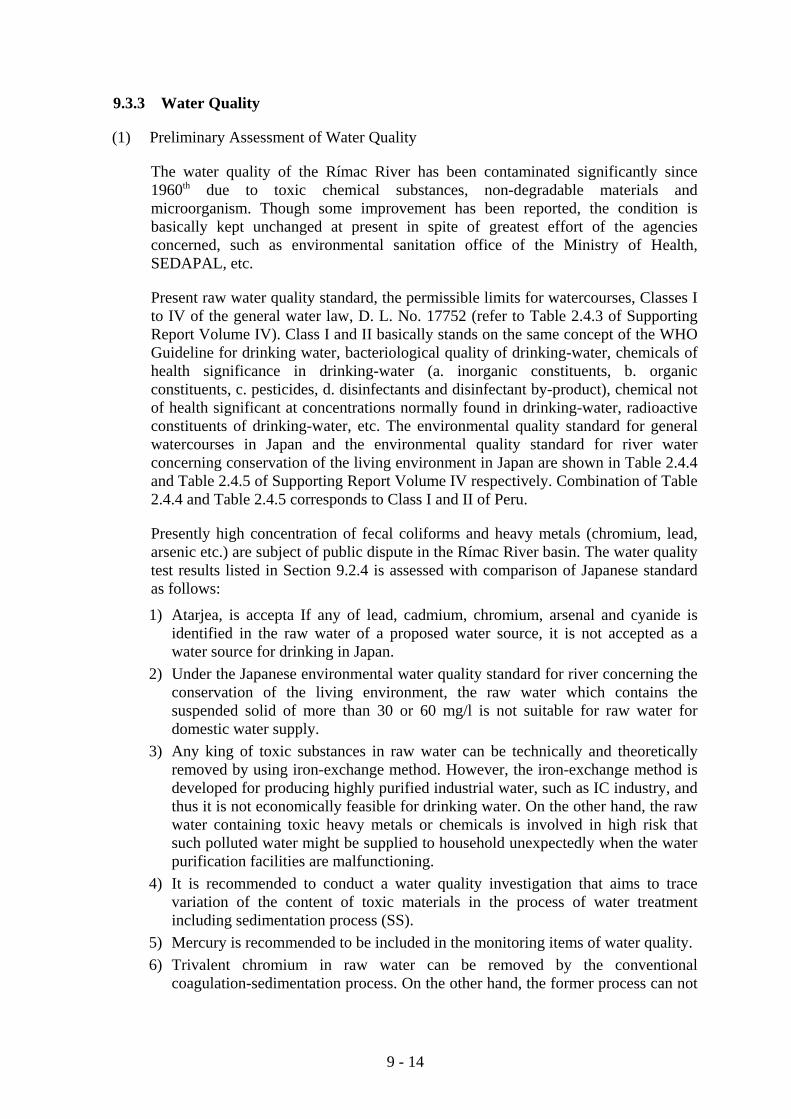
(b) The total mean water loss in the 30 km stretch between Chosica and LaAtarjea will be in a range of 6.0 - 10.0 m3/sec, at least 6.0 m3/sec during thedry season. This is due to the fact that the minimum discharge balancebetween Chosica and La Atarjea intake is about 6.0 m3/sec as shown inFigure 9.3.3. The loss is composed of the riparian water use (irrigation andindustry) and infiltration loss including evaporation. The component ofirrigation and industrial water use seems to be predominant. No clearinfiltration area or spot has been identified. It is assumed that the irrigationand industrial water use and the infiltration loss is 4.0 m3/sec (70 %) and 2.0m3/sec (30 %).
(c) The total discharge of 17 irrigation intakes located upstream of the LaAtarjea intake, 6.8 m3/sec measured by the Study Team seems to be themaximum amount. (refer to Figure 9.2.1) The daily average withdrawal for

9 - 13
irrigation and industrial use is assumed to be 4.0 m3/sec with considerationof the existing irrigation area of about 4,750 ha.
(d) It is assumed that infiltration loss in the 7 km stretch between Huachipabridge (3B, 5B) and the La Atarjea intake (1B) including the 6 km rivertraining works is about 2.0 m3/sec.
Flow Balance of the Rímac is shown in Table 9.3.1. In Table 9.3.1, infiltrationdischarge of 2.0 m3/sec is quantitatively reasonable comparing with the total waterloss of 3.5 - 3.6 m3/sec between Chosica and La Atarjea intake during the droughtyears, 1991 - 1992. Discharge records at Sheque and Tamboraque intakes ofEDEGEL have been also obtained to calculate stream flow losses in the upper reachof the Rímac river with comparison to that at the Chosica station. It is difficult toestimate the water losses accurately because discharge and subsurface flow from theresidual catchment area of 1,180 km2 is included in the flow record at Chosica.
2) Accuracy of Discharge Records and Measurement
The error range of the discharge records of SENAMHI, EDEGEL and SEDAPALseems 10 - 20 %. The flow measurement done directly by the Study Team seems toinclude an error of 10 - 20 %. The details are as follows:
Discharge Measurement Errors
No. Location Measurement Errors (Comparison with JICA Study Team)
1A2A, 3A
4A
Chosica (SENAMHI)Sheque (EDEGEL)
Tamboraque (EDEGEL)
Measurement by SENAMHI is about 6 % larger. (*1)Measurements by EDEGEL and JICA Study Team are almostsame.
Measurement by EDEGEL is about 13 % smaller. (*2)
1B-5B River discharge betweenChosica and La Atarjeaintake
Measurement error in several observations ranges 10 - 20 %.
(*1) Error in measurement. Measurement error of 6 % is not applicable to long period discharge databy SENAMHI because discharge measurement by the JICA Study Team was carried out in quiteshort period.
(*2) EDEGEL converts water level in the tunnel section into discharge. Water level is measured bysensor, and calibration of sensor is necessary. Measurement error of 13 % is not applicable tolong period data by EDEGEL for the same reason as (*1) above.
In addition, Figure 3.2.3 of Supporting report Volume IV shows discharge dataobserved at Chosica by SENAMHI and EDEGEL (Huampaní intake for hydropowerplant), both observation stations are closely located. Discharge records at respectivetwo stations are almost same during low water periods (the dry season), whiledischarge record during high water periods (the wet season) are inaccurate in severalyears because of its higher run-off coefficient and unstable flow condition due tohigh velocity. These are found at both stations especially January to March.Considering this fact, water balance calculation by monthly basis or shorter period isrecommended to minimize an effect of discharge measurement error during highwater periods.
9 - 14
9.3.3 Water Quality
(1) Preliminary Assessment of Water Quality
The water quality of the Rímac River has been contaminated significantly since1960th due to toxic chemical substances, non-degradable materials andmicroorganism. Though some improvement has been reported, the condition isbasically kept unchanged at present in spite of greatest effort of the agenciesconcerned, such as environmental sanitation office of the Ministry of Health,SEDAPAL, etc.
Present raw water quality standard, the permissible limits for watercourses, Classes Ito IV of the general water law, D. L. No. 17752 (refer to Table 2.4.3 of SupportingReport Volume IV). Class I and II basically stands on the same concept of the WHOGuideline for drinking water, bacteriological quality of drinking-water, chemicals ofhealth significance in drinking-water (a. inorganic constituents, b. organicconstituents, c. pesticides, d. disinfectants and disinfectant by-product), chemical notof health significant at concentrations normally found in drinking-water, radioactiveconstituents of drinking-water, etc. The environmental quality standard for generalwatercourses in Japan and the environmental quality standard for river waterconcerning conservation of the living environment in Japan are shown in Table 2.4.4and Table 2.4.5 of Supporting Report Volume IV respectively. Combination of Table2.4.4 and Table 2.4.5 corresponds to Class I and II of Peru.
Presently high concentration of fecal coliforms and heavy metals (chromium, lead,arsenic etc.) are subject of public dispute in the Rímac River basin. The water qualitytest results listed in Section 9.2.4 is assessed with comparison of Japanese standardas follows:
1) Atarjea, is accepta If any of lead, cadmium, chromium, arsenal and cyanide isidentified in the raw water of a proposed water source, it is not accepted as awater source for drinking in Japan.
2) Under the Japanese environmental water quality standard for river concerning theconservation of the living environment, the raw water which contains thesuspended solid of more than 30 or 60 mg/l is not suitable for raw water fordomestic water supply.
3) Any king of toxic substances in raw water can be technically and theoreticallyremoved by using iron-exchange method. However, the iron-exchange method isdeveloped for producing highly purified industrial water, such as IC industry, andthus it is not economically feasible for drinking water. On the other hand, the rawwater containing toxic heavy metals or chemicals is involved in high risk thatsuch polluted water might be supplied to household unexpectedly when the waterpurification facilities are malfunctioning.
4) It is recommended to conduct a water quality investigation that aims to tracevariation of the content of toxic materials in the process of water treatmentincluding sedimentation process (SS).
5) Mercury is recommended to be included in the monitoring items of water quality.6) Trivalent chromium in raw water can be removed by the conventional
coagulation-sedimentation process. On the other hand, the former process can not

9 - 15
remove hexavalent chromium, but it can be technically removed by a specialmethod with a reduction process. However it requires a complex pH controlprocess (raising/ lowering) during the reduction process. Therefore pH control isnot recommendable from the standpoint of safety control.
7) Removal of cyanide also can be technically possible by a special method withoxidation process including pH control, but it is also dangerous and notrecommendable.
8) BOD (Biological Oxygen Demand), generally less than 5 mg/l upstream of LaAtarjea, is acceptable range in spite of industrial and domestic sewerage.
Heavy chlorination has been applied for disinfection of water supply with extra cost ofchlorine. Heavy metals, that might cause degradation of public health in long term, willnot be able to be eliminated by normal water treatment plant with reasonable cost.Excessive dosage of chlorination yields by-product such as trihalomethane, and itmight also cause degradation of public health.
(2) Study for Alternative Measures
The water loss identified in Section 9.3.2 will not be resolved by construction of newwater source facilities only. For maintaining the balance of demand and supply ofpotable water to Lima, it would be required to adopt either or adequate combinationof structural and non-structural measures, such as reducing the water loss, managingthe demand and developing new water sources.
In view of the identified water loss and quality issues the Study Team suggestsSEDAPAL to study the following measures as a hint to resolve present problems:
a. Monitoring Water Quality and Aquatic Ecology- To make inventory of aquatic species and fish population- To assess the fish fauna and fish population dynamics- To introduce artificial reproduction of endemic fish with ecological and/ or
economic interest- To assess the aquatic environment through the use of bio indicators: integrated
monitoring approach using benthic organisms, zooplakton toxicity tests, andfish liver tissues to evaluate pollution effects, and correlate with chemical andmetal analysis at specified areas,
- To conduct water quality test for selected pesticide and toxic chemicals- To conduct water quality test for mercury (not included in SEDAPAL’s list)
b. Institutional and Legal Arrangement- Institutional and legal arrangement to regulate point source control of
industrial waste water discharge in particular mining industry- Enhancement of cleaner production among the industries: it aims to enhance
technology to reduce the content of toxic chemical materials contained insewage and solid waste in the production process, and to reduce the use of thetoxic chemical materials in quantity including recycle and reuse technology
- Enactment of polluter’s pay principle
c. Alternative Structural Measures- Installation of specific treatment plants for toxic chemicals and metals (costly)

9 - 16
- Relocation of the existing SEDAPAL intake facilities from La Atarjea toappropriate upstream site including bypass pipeline
(3) Integrated Management of Surface Water and Groundwater
Comprehensive and quantitative river basin management under the concept ofhydrological cycle management will be required for the Rímac River basin in thefuture. The management will aim to establish sustainable development andenvironment of the basin by improving:
1) the national or regional institutional framework for water resources developmentand management;
2) the organizational and financial framework for basin management;
3) the regional water quality management regulatory institutions andimplementation;
4) irrigation management policy, institutions and regulations;
An example is shown below.
Legal and Institutional Arrangement: Legal and institutional framework that enablesthe anticipated management framework,
Monitoring System: Integrated monitoring and management of surface water andground water, and water quantity and quality, and
Public Involvement: Establishment of autonomous (public-private) organization tomonitor and improve the river environment by participatory approach.
9.3.4 Water Loss Due to Hydrogeological Condition
(1) Infiltration Calculated by SEDAPAL
Based on the information on maximum and minimum water levels recorded in 19observation wells (piezometers) and 30 extraction-recharge wells of the pilot project,SEDAPAL obtained the answer for the water level recovering produced betweenOctober 1998 and March 1999, due to the induced recharge effect.
The obtained data determined that the water volume filtered into the pilot projectservice area, between Huachipa Bridge and La Atarjea, was 4.12 MCM during thatperiod, equivalent to 0.317 m3/sec during the 5 observation months or 0.130 m3/secfor one year.
(2) Theoretical Infiltration Calculated by Morits Equation
To quantify the infiltration theoretically, considering the constant permeabilityconditions in the covered area, the Moritz equation has been used. (see Annex III)
As a result of this equation, an average infiltration of 1.49 m3/sec for the 6-km areabetween Huachipa Bridge and La Atarjea is obtained. The average velocity (1.11

9 - 17
m/sec) and the average flow (26.93 m3/sec) are obtained from the measurementscarried out by the JICA Study Team at the 1B point, 200 m upstream of La Atarjeaintake.
(3) Other Infiltration Values Obtained from Investigation
According to investigations developed by several consultants in the Rímac riverValley aquifer, the infiltration values do not show the same magnitude rate.
(4) Direct Measurement by JICA
The infiltration between 1B and 3B sites was approximately estimated to be 2.0m3/sec by the JICA Study Team based on the water flow measurement by use ofcurrent meters during August 27 to September 19, 2001.
(5) Binnie & Partners (1980)
A balance performed by B & P considers that the infiltrations between Chosica andCallao are 4.72 m3/sec. The infiltrations downstream La Atarjea are 1/3 of the totalinfiltration between Chosica and Callao; and La Atarjea flows have been calculatedfrom the Chosica flow minus the 2/3 of infiltration losses produced between Chosicaand Callao.
The infiltrations considered in the different studies on the Rímac River are shown inthe following table:
Infiltration Rates in Different Studies
Date Distances(km aprox.).
Infiltration(m3/sec)
Infiltration(m3/s/km) Scope
SEDAPAL 1999 6 0.13 0.02 Huachipa -La Atarjea
Morits Equation 2001 6 1.49 0.25 Huachipa- La Atarjea
JICA 1981 6 2.0 0.33 Vitarte – La Atarjea
B&P 1980 22 3.15 0.14 Chosica –La Atarjea
(6) Conclusions:
1) According to the obtained information, it was not possible to get a definitiveconclusion about the infiltration produced between Huachipa Bridge and LaAtarjea. In addition, the flow measurements carried out by the JICA StudyTeam between August and September, 2001, in the above-mentioned area, donot show the existence of significant point infiltrations in the area.
2) The discrepancies between SEDAPAL and the mentioned consultants require afuture investigation.

9 - 18
9.4 Review of 1998 Water Supply Master Plan
9.4.1 Water Demand
(1) Domestic and Non-Domestic Water Demand
1) Projection of Future Population of Metropolitan Lima
Metropolitan Lima is constituted by 43 districts of Lima Province and 6 districts ofCallao Province. Figure 4.1.1 of Supporting report Volume IV shows all districts aswell as SEDAPAL water supply areas. Total population in Metropolitan Lima as1993 census was 6,434,323 which is 28.4% of the total population of Perú. Table4.1.1 of Supporting report Volume IV shows the future population of MetropolitanLima as estimated by SEDAPAL M/P, BLASA and INEI. For the planning horizonof 2030 such population projected ranges between 11.5 to 11.75 millions. Asummary is given below
Metropolitan Lima Population1993 1998 2000 2005 2010 2020 2030
MASTER PLAN 6,434,323 7,130,008 7,505,802 8,233,031 8,934,224 10,266,351 11,751,197Annual Growth Rate (%) 2.07 2.60 1.87 1.65 1.40 1.36
BLASA 7,400,352 8,083,627 8,768,901 10,133,451 11,500,000Annual Growth Rate (%) 1.78 1.64 1.46 1.27
INEI 7,500,542 8,187,398 8,881,228 10,267,751 11,713,832Annual Growth Rate (%) 1.77 1.64 1.46 1.33
2) Water Demand
Domestic and non-domestic water demand for Lima Metropolitan Area whichincludes 49 districts has been calculated by four (4) methods, they are:
* SEDAPAL Master Plan (1998)
* BLASA (Revised water demand, 2001)
* BLASA/Master Plan (It is BLASA approach applying to it population given bySEDAPAL Master Plan)
* BLASA/INEI ( It is BLASA approach applying to it population forecasted byNational Institute of Statistics)
BLASA in April 2001 under contract with SEDAPAL revised water demandcalculated by SEDAPAL Master Plan in 1998 because unbilled potable water(*)instead to decrease was increasing from 35% in 1997 to 44% in year 2000notwithstanding that unit water consumption for same period decreased from 319
(*) Unbilled potable water (UPW) means the sum of physical and no physical water loss plus no identified
water loss.

9 - 19
l/p/d to 290 l/p/d, thus basically targeted water demand forecasted by SEDAPALMaster Plan did not accomplish.
Main differences between Master Plan and BLASA are as follows:
* BLASA forecasted population is less than that one of SEDAPAL Master Plan
* BLASA present metered water consumption is larger than that one ofSEDAPAL Master Plan
* BLASA considered some little unit water consumption for those non-connectedpopulation and SEDAPAL Master Plan did not consider any
* BLASA coverage is a little less than that of SEDAPAL Master Plan
* Water supply efficiency (1-loss ratio) were settled as follows:
Water Supply Efficiency
Year SEDAPAL Master Plan BLASA2000 65 % 70 %2005 70 % 75 %
2010 - 2030 75 % 75 %
For the four (4) methods above mentioned total water demand was calculated asshown in Table 9.4.1 as well as in Figure 9.4.1. For year 2000, 2005, 2010, 2020 and2030 total water demand is shown as follows.
Methods 2000 2005 2010 2020 2030
Water Demand Master Plan (m3/sec) 27.80 29.67 30.64 35.54 40.68Water Demand BLASA (m3/sec) 32.09 26.34 29.13 35.17 40.17
Water Demand BLASA/PM (m3/sec) 32.46 26.72 29.56 35.54 40.87Water Demand BLASA/INEI (m3/sec) 32.45 26.61 29.42 35.54 40.77
For year 2030 differences among each method are only 2% and this difference is dueto the population natural increment.
For the purpose of this supplementary study and in order to carry out water balanceBLASA approach was selected.
(2) Water for Agricultural Uses
There sums to be difference between SEDAPAL’S report and actual amount of theriparian irrigation water use. In order to capture a potential range of the irrigationwater use, the present irrigation water demand is estimated based on the prevailingirrigation activity and land area. Among four possible cases the study team evaluatesthe alternative 2A being the most realistic case that represent the actual agriculturalactivities in the area, because this area shows the greatest agricultural development ofthe Rímac river valley. The total irrigation demand would be in an order of 2 m3/s(63 MCM/year).

9 - 20
Present Irrigation Water Demand
Irrigation Efficiency by
AlternativeArea
(has) Conveyance(%)
Distribution(%)
IrrigationEfficiency
(%)
IrrigationWater
Loss (%)
TotalDemand
(MCM)
Scope
1A 5,683 75 67 50 50 74.47All the Irrigation District
(San Mateo-Callao)
1B 5,683 70 60 42 58 89.42All the Rímac Irrigation
District (San Mateo-Callao)
2A 4,751 75 67 50 50 62.42 From Ricardo Palma to Callao
2B 4,751 70 60 42 58 74.42 From Ricardo Palma to Callao
(Refer to the monthly irrigation water demand in Table 4.1.3 of Supporting Report IV.)
9.4.2 Progress of Water Saving Measures
(1) Unbilled Water and Water Losses
In accordance with SEDAPAL yearbook 2000, water consumption per capita(Produced water/Served inhabitant) has decreased during the period 1997-2000 from319.4 l/day to 288.9 l/day.
As of April 2001 unbilled water is 43% of which breaking down is 30% for watersupply system losses and 13% for unrecorded losses (Refer to Table 4.2.1 ofSupporting report Volume IV). System losses are taken into account for the purposeof calculating water production requirements and the balance would be the efficiencyof the whole system for the intake, production and distribution of potable water. Itcan be said that the efficiency of the system managed by SEDAPAL is about 70%,which is quite close to values being handled in the large capital cities of SouthAmerica.
(2) Micrometering
The house connections and number of installed meters has evolved favorably in theperiod 1997-2000, as shown below:
Year 1997 1998 1999 2000
Installed connections 839,337 871,723 940,325 971,130
Metered connections 308,544 352,485 488,011 631,263
In reviewing these figures it is observed that as of year 2000, despite a significanteffort by SEDAPAL, there still is 35% of installed house connections without meter.

9 - 21
(3) Current Network and Rehabilitation of Potable Water Network
The evolution of the potable water network as well as its rehabilitation are shownbelow:
Year 1997 1998 1999 2000 2001
Potable water network (km) 8,158 8,464 8,652 8,751
Cumulative rehabilitatedNetwork (km) 156.13 198.99 337.67 435.93 440.29
(4) Saved Water due to Micrometering and Network Rehabilitation
According to data furnished by SEDAPAL’s Micrometering and Records Team,water savings due to the combined effects of the increase in micrometering, networkrehabilitation and leakage control, amounted to an average of 5.6 m3/sec as of August2001.
This potable water savings has been reflected in an improvement of service to thesupplied population, i.e. bigger amount of water, higher pressures and better servicecontinuity; however, it has not been reflected in achieving the target service coveragedue to the lack of new distribution networks that enter in operation as the populationincreases.
9.4.3 Review of SEDAPAL’s Expansion Plan
SEDAPAL Master Plan had considered following project be under operation in orderto supply raw water during dry season in average as follows:
Marca III (Surface water) in year 1999: Q= 3.0m3/sec
Chillón Project (surface and ground water) in year 2001: Q= 0.71 m3/sec
Marca II (Surface water) in year 2003: Q= 6.5 m3/sec
Huascacocha (Surface water) in year 2015: 2.5 m3/sec
Cañete or Mantaro (Surface water) in year 2020: 5.0 m3/sec (or 2.5 m3/sec each inyears 2021 and 2025)
SEDAPAL’s Master Plan took into account 5% (0.67 m3/sec) of the average dryseason discharge as infiltration in the Rímac river upstream of La Atarjea waterintake.
In case counting the Rímac water loss (Irrigation water intake, infiltration and others)be 6.0 m3/sec, then situation is completely different from that forecasted bySEDAPAL Master Plan because total water sources available (surface and groundwater) has to be reduced in the same amount of loss.

9 - 22
Based on what has been stated above Figure 9.4.2 was prepared in order to show howloss in 6 m3/sec affects the SEDAPAL expansion plan but still keeping that Marca IIhas to be under operation in year 2003 as it was planed by Master Plan. Mainconclusions are:
• Huascacocha project in the amount of 2.5 m3/sec has to get early into operationin year 2007 instead 2015
• Mantaro-Carispacha project in the amount of 5 m3/sec has to get early intooperation in year 2012 instead 2020, and
• A new source of surface water in the amount of 5.4 m3/sec has to get intooperation in year 2020
Regarding actual situation of SEDAPAL implementation are as follows:
• Marca III (3m3/sec): under operation since 1999 as scheduled
• Chillón ground water project in the amount of 0.8 m3/sec went into operation inJune 2001
• Marca II is delayed. Construction has been scheduled to start in 2004 andoperation in 2007.
Taking into consideration those above facts then Huascacocha project and Marca IIhave to be under operation in year 2007 in the total amount of 9.0 m3/sec as shown inFigure 4.3.5 of Supporting report Volume IV. The location of these projects in theMantaro River basin is shown in Figure 9.4.3.
9.4.4 Water Demand and Supply Balance
(1) Annual Water Balance by SEDAPAL’s Method
Water balance carried out by SEDAPAL Master Plan in 1998 following procedurewas applied:
* Projection of active water demand (D/I, commercial, state use and park andgardens) from 1998-2030. Active water demand means the water demand whichoccurs in future if MIO program is implemented (institutional and operationalimprovement program)
* Assessment of surface and groundwater source present and future
* Water production required taking in consideration total water loss (physical andno-physical). Loss were assessed as 35% in period 1998-2000, 30% in 2005 and25% from 2010 to 2030.
* Loss in Rímac river upstream La Atarjea during dry season (May-November)was assessed as 5% of the average discharge in same period
* Irrigation water demand in Rímac and Lurín valley
* Reuse of sewerage treated water in gardening and agriculture

9 - 23
Water balance was carried annually and monthly for four (4) alternatives (1, 1a, 2and 3). Alternatives 1a and 2 include to bring 5m3/sec either from Cañete or MantaroRiver Basin. Alternative 2 was finally selected by SEDAPAL Master Plan.
Based upon average daily water demand, the proposed expansion system ofSEDAPAL Master Plan is presented in Figure 9.4.4.
It was assumed that all domestic and non-domestic water demand of LimaMetropolitan area is taken at La Atarjea where intakes and potable water treatmentplant are located. Water balance was calculated as water offer (surface andgroundwater) minus water demand. The details are presented in Section 4.3.1 ofSupporting Report Volume IV.
(2) Water Demand and Supply Balance Analysis
1) Balance Model by Monthly Discharge
The water balance point is set at SEDAPAL’s intake site at La Atarjea. Theavailable surface water flow at La Atarjea intake is assumed to be the discharge atChosica minus the aggregate water loss between La Atarjea and Chosica. Theaggregate water loss between La Atarjea and Chosica is assumed to be the sum of theirrigation demand and other water losses consisting of riparian water uses, infiltrationand evaporation in the stretch.
It is assumed that all domestic and industrial water demand of the Lima Metropolitanarea is withdrawn at La Atarjea. The net D/I water supply demand is balance of thetotal D/I water supply demand minus the total groundwater supply.
In short the water balance is calculated by:
QBL,t = QC,t - (DIR,t + LAC,t) - (DWS,t - QG,t) + QRi,t
= QC,t - DIR,t - LAC,t - DWS,t + QG,t + QRi,t
Where,
QBL,t : Demand and supply balance at year t (m3/sec)
QC,t : Surface flow discharge at Chosica (SENAMHI Station) at yeart (m3/sec)
DIR,t : Irrigation water demand between La Atarjea and Chosica at yeart (m3/sec)
LAC,t : Water loss in the stretch between Atarjea and Chosica at yeart (m3/sec)
DWS,t : D/I Water supply demand of Lima Metropolitan area at yeart (m3/sec)
QG,t : Groundwater Supply for Lima Metropolitan area at year t (m3/sec)

9 - 24
QRi,t : Regulated flow from reservoirs and diversion at year t (m3/sec)
2) Flow Condition
The monthly mean discharge record of 20 years at Chosica from 1979 to 1998 isused as the surface discharge at Chosica.
The discharge during the period was modified by the regulated flow by the Marca IProject facilities commissioned in 1962 and the Yuracmayo Project commissioned in1996, but it is treated as the existing natural flow, i.e., without project.
3) Calculation Case and Result
The water demand and supply balance is done for the following category, whereMarca I and Yuracmayo Projects are treated as the existing condition:
Cases for Water Balance Calculation
Category Dam & Water Transfer D/I WaterDemand Water Loss
A Without Project 2000, 2005, 2010,2020, 2030 6.0 m3/sec
BWith Project
Marca III, Marca II2005 ~ 2030 0.67 m3/sec
C
With Project
Marca III, Marca II,Huascacocha,
Mantaro-Carispacha (or Cañete)
Max. 16.5 m3/sec
2005 ~ 20306.0 m3/sec
(Irrigation, Factory,Infiltration, Evaporation, etc.)
Alternative cases for the water balance and corresponding conditions are shown inTable 9.4.2. The summary of the calculation results is shown in Table 9.4.3.
These results infer the following prospect:
(a) During the last two decades the most severe drought occurred in 1989-1992 period. It continued four years, and the reservoirs and lagoons in theupstream of the Rímac River were completely emptied due to little rainfallduring the rainy season.
(b) If the same event occurred, even the lowest water supply demandprojected in 2005 will not be fulfilled even if Marca II is commissionedby 2005. The hydrological reliability of ‘With Marca II system’ isassessed to be less than 80% (4/20). That is, input of Marca II will not besufficient even for the event of 1994-1995 draught (4/20) in 2005 evenconsidering the optimistic water loss in the Chosica-La Atarjea stretchbeing only 0.67 m3/sec instead of 6.0 m3/sec.

9 - 25
(c) SEDAPAL’s present planning method of water demand and supply basedon the annual mean analysis is assessed to be very optimistic.Introduction of an elaborated quantitative water demand and supplybalance method considering seasonal variation of discharge and waterdemand by use of at least monthly mean discharge records will benecessary in order to manage the reliable water supply system for theLima metropolitan area.
9.4.5 Option for Additional Facilities
Cementos Lima (private firm in Lima) is currently proceeding a project named ‘ELPLATANAL INTEGRATED PROJECT’ for the development of total 270 MWpower production and total 27,000 ha irrigation, with construction of a storage namedMoro de Arica dam in the upstream stretch of the Cañete river. The details of theProject are presented in Chapter 5 of Supporting Report Volume IV.
Periods for the design and construction of the hydropower component and theirrigation component are assumed to be 4 years and 10 years respectively.Preparatory works including access roads are being proceeded. Social settlement inthe project related area including Cañete and Yauyos provinces were started in April2001, and commencement of construction of the dam and the power station isscheduled in 2003.
This development has dimensions (in water demand, dams, power stations,groundwater development, water conveyance and irrigation facilities) similar to thoseof the Scenario-2/Case 2.1 on the Table 4.2.3. It is however noted that the Case 2.1assumes construction of Paucarcocha reservoir but the above project assumes thereservoir construction as a possibility in future.
Such being the current status of the Cañete river water development, it is necessary toimplement some additional facilities to yield new water for the purpose to transferthe Cañete river water to Lima.
Option for the additional facility to yield new 5 m3/sec water is deemed to be:
• Construction of a storage named San Jerónimo in the midstream, equivalent tothe Scenario-3/Case 3.1,or,
• Construction of the Paucarcocha dam at upstream glacial lakes and 3 m3/secgroundwater wells in the downstream coastal area, equivalent to the Scenario-3/Case 3.3.
As examined in the foregoing Section 5.2, economic comparison of the alternativesfor yielding 5 m3/sec water between the above Cañete basin facility and the Mantarobasin facility (Mantaro-Carispacha scheme) shows that the latter is preferred. Further,it would be the case that the transfer of Cañete River water to other basin, namely toLima, induces serious objection by the people in the Cañete basin.

Table 9.2.1 Summary of Rímac River Annual Average Water Quality Test (1993 – 1996)
PARAMETERS UNITS MONITORING STATIONS1 2 3 4 5 6 7 8 9 10 11 12 13 14
PH Units 7.76 8.46 8.46 8.26 7.72 8.40 8.39 8.20 8.29 8.27 8.17 8.24 8.18 8.28TURBIDITY U.N.T/U.J 9.79 31.90 158.00 42.60 33.80 36.50 21.68 38.78 185.00 16.64 36.34 39.00 45.53 49.00ELECTRIC CONDUCTIVITY µmhos/cm 869.00 684.00 703.00 687.00 382.00 633.00 614.00 726.00 743.00 455.00 517.00 486.00 505.00 521.00TEMPERATURE °C 19.36 16.94 16.96 16.60 13.56 15.51 19.50 22.37 22.45 19.60 21.00 17.90 19.42 20.37DISSOLVED OXYGEN Mg/lt 6.64 7.69 7.78 7.79 8.32 7.81 7.73 7.64 7.69 8.68 7.99 8.21 8.32 7.88TOTAL SOLIDS Mg/lt 737.00 558.00 570.00 571.00 394.00 514.00 534.00 673.00 640.00 420.00 547.00 407.00 438.00 431.00DISSOLVED SOLIDS Mg/lt 562.00 427.00 435.00 435.00 217.00 363.00 380.00 454.00 443.00 278.00 350.00 290.00 341.00 333.00SUSPENDED SOLIDS Mg/lt 32.00 41.50 59.00 52.80 49.00 38.00 23.30 26.80 21.83 59.00 61.30 36.80 38.80 34.50IRON Mg/lt 0.891 3.250 25.087 4.826 6.709 4.572 2.296 3.203 2.420 0.949 3.154 3.857 4.235 4.176MANGANESUM Mg/lt 0.171 0.270 2.270 0.362 0.590 4.899 0.215 0.150 0.124 0.085 0.173 0.211 0.202 0.190LEAD Mg/lt 0.087 0.470 2.507 0.533 0.132 0.463 0.144 0.358 0.215 0.090 0.177 0.217 0.181 0.203CADMIUM Mg/lt 0.0056 0.0100 0.0230 0.0076 0.0237 0.0130 0.0074 0.0089 0.0077 0.0034 0.0055 0.0048 0.0348 0.0044CHROMIUM Mg/lt 0.0057 0.0100 0.0219 0.0160 0.0053 0.0124 0.0058 0.0017 0.0071 0.0064 0.0021 0.0023 0.0073 0.0078COPPER Mg/lt 0.065 0.210 0.634 0.249 0.313 0.246 0.090 0.096 0.052 0.046 0.441 0.117 0.072 0.071ZINC Mg/lt 1.381 1.520 4.615 1.906 4.290 2.205 0.956 0.887 0.372 0.333 0.481 0.700 0.588 0.530ALUMINUM Mg/lt 0.512 1.080 2.539 1.221 1.206 0.988 0.474 1.095 1.004 0.662 1.446 1.249 1.574 1.526BARIUM Mg/lt 0.160 0.140 0.145 0.144 0.114 0.140 0.129 0.314 0.195 0.113 0.176 0.123 0.125 0.134ARSENIC Mg/lt 0.030 0.040 0.688 0.080 0.469 0.175 0.074 0.060 0.038 0.025 0.038 0.046 0.044 0.038CYANID Mg/lt <0.0025 <0.0025 0.029 0.011 <0.0025 0.015 0.002 0.002 0.015 <0.0020 0.004 <0.0025 0.001 0.001TOTAL CARBON Mg/lt 43.73 32.75 32.89 32.38 8.66 27.08 26.74 25.79 30.03 24.29 27.45 24.37 26.10 26.28INORGANIC CARBON Mg/lt 42.00 31.20 30.95 30.63 6.33 24.76 24.34 23.31 26.89 21.56 21.38 22.29 22.93 22.82ORGANIC CARBON Mg/lt 1.71 1.57 1.86 1.53 2.35 1.57 2.42 2.49 3.13 3.06 6.08 4.95 3.15 2.86TRIHALOMETHANES µg/lt 2.22 2.21 1.88 4.65 2.70 2.39 3.46 3.42 4.13 2.69 13.93 3.13 4.32 6.801) GRATHON TUNNEL; 2) TAMBORAQUE III BRIDGE; 3) EFFLUENTS FROM TAMBORAQUE MINING FACILITIES; 4) TAMBORAQUE II BRIDGE;5) ARURI RIVER; 6) TAMBORAQUE INTAKE; 7) SURCO BRIDGE; 8) CORCONA; 9) RICARDO PALMA BRIDGE; 10) SANTA EULALIA RIVER;11) LOS ANGELES BRIDGE; 12) ÑAÑA BRIDGE; 13) HUACHIPA BRIDGE; 14) LA ATARJEA INTAKEPrepared by Marco Antonio Meza Alvarez, January 1997Source: Physic-Chemical Laboratory. SEDAPAL Sub-Management Office for Plants
9-26

(unit : m3/sec)
➊ ➋ ➊ +➋ ➌ -➊ -➋ ➌ , ➂ Industry/ Irrigation Infiltration Others Total ➃ ➄
Monthly average
(Jul.- Sep., 1991-92)
6.1
(EDEGEL)
8.4
(EDEGEL)
14.5 -0.3
-0.4
14.2(SENAMHI)
14.1(EDEGEL)
-1.6
-1.5
-2.0 --- -3.6
-3.5
10.6 *1
(SEDAPAL)
0.0
0.0
Monthly average
(Jul.- Sep., 1993-95)
6.8
(EDEGEL)
12.1
(EDEGEL)
18.9 +0.5
-1.7
19.4(SENAMHI)
17.2(EDEGEL)
-4.3
-2.1
-2.0 --- -6.3
-4.1
13.1 *1
(SEDAPAL)
0.0
0.0
Monthly average
(Jul.- Sep., 1996-97)
5.7
(EDEGEL)
10.0
(EDEGEL)
15.7 +5.3
+1.9
21.0(SENAMHI)
17.6(EDEGEL)
-7.1
-3.7
-2.0 --- -9.1
-5.7
11.9 *1
(SEDAPAL)
0.0
0.0
Daily average inAug. 27 - Sep. 9, 2001
11.3
(JICA)
13.0
(JICA)
24.3 +2.5 26.8
(SENAMHI)
-6.8 *3 -2.0 --- -8.8 16.5 *2
(SEDAPAL)
1.5
Source: *1 Production of Plant No. 1 and 2, La Atarjea (SEDAPAL)*2 Discharge at Sediment trap basin (Desarenadores) No. 1 and 2 (SEDAPAL)*3 Discharge measurement in Sep. 12 - 14, 2001 by JICADischarge data of EDEGEL at Chosica is observed at the Huampani intake. There is no intake between Chosica SENAMHI station and Huampani intake.
Note: Overflow discharge at La Atarjea intake was assumed to be negligible in the dry season from 1991 to 1997 because discharge observed at Chosica of 20.0 m3/secmight diverted all for potable water production. While daily average discharge of 1.5 m3/sec (or 6.0 m3/sec presuming 6 hours overflow time) of overflow fromflood gates was observed during Aug. 27 to Sep. 9, 2001.
5
2
Table 9.3.1 Flow Balance in Rimac River Basin
3
Chosica(SENAMHI)
Matucana HP
Huinco HP
Sheque intake
Tamboraque intake
Moyopampa HP Huampani HP
La Atarjea(SEDAPAL)
Callahuanca HP Flow loss by infiltrationIndustry/IrrigationA (Santa Eulalia river)
(San Mateo river)
(Rimac river)
80 km
32 km
72 km
7 km
1
3
4
5Huampani intake
9-27

Year Water DemandMaster Plan
Water DemandBLASA
Water DemandBLASA/PM
Water DemandBLASA/INEI
1998 32.291999 30.052000 27.80 32.09 32.46 32.452001 27.46 31.26 31.64 31.602002 28.08 30.27 30.66 30.592003 28.78 29.13 29.52 29.432004 29.48 27.82 28.21 28.102005 29.67 26.34 26.72 26.612006 29.86 26.90 27.29 27.172007 30.06 27.46 27.83 27.702008 30.25 28.01 28.42 28.292009 30.45 28.57 28.99 28.862010 30.64 29.13 29.56 29.422011 31.12 29.70 30.13 30.012012 31.60 30.29 30.70 30.612013 32.09 30.87 31.30 31.222014 32.57 31.47 31.87 31.812015 33.05 32.07 32.46 32.422016 33.55 32.69 33.07 33.052017 34.05 33.31 33.68 33.682018 34.54 33.93 34.29 34.302019 35.04 34.55 34.91 34.922020 35.54 35.17 35.54 35.542021 36.04 35.67 36.04 36.042022 36.54 36.16 36.55 36.542023 37.05 36.66 37.07 37.042024 37.55 37.16 37.59 37.562025 38.05 37.65 38.12 38.072026 38.58 38.16 38.66 38.602027 39.10 38.66 39.20 39.132028 39.63 39.16 39.75 39.672029 40.15 39.67 40.31 40.222030 40.68 40.17 40.87 40.77
Table 9.4.1 Total Water Demand (m3/s)
9-28

Table 9.5.1 Water Resources Development Scenarios and Alternative Cases
Case 1.1 Case 1.2 Case 2.1 Case 2.2 Case 3.1 Case 3.2 Case 3.3
Water Demand:
1)D/I Water Supply CB+L5 CB+L10 CB CB CB+L5 CB+L5 CB+L5
2)Irrigation Demand CV CV+CLC CV+CTP CV+CTP5 CV+CLC+CTP CV+CTP5 CV+CTP
3)Maintenance Flow Mf4.3 Mf4.3 Mf4.3 Mf4.3 Mf4.3 Mf4.3 Mp1.0
4)Total Demand (MCM) 667.7 855.55 861.4 685.73 1049.28 843.41 915.05
Dam: Active Storage
1)Morro de Arica (MCM) 205 245 245 205 245 245 245
2)Paucarcocha (MCM) Not Applicable 55 55 Not Applicable Not Applicable 55 55
3)Capillucas (MCM) 2.8 2.8 2.8 2.8 2.8 2.8 2.8
4)San Jeronimo (MCM) Not Applicable Not Applicable Not Applicable Not Applicable 280 Not Applicable Not Applicable
Power Station:
1)Morro de Arica (MW) 46 50 50 46 50 50 50
2)El. Platanal (MW) 200 220 220 200 220 220 220
3)San Jeronimo (MW) Not Applicable Not Applicable Not Applicable Not Applicable Not Applicable Not Applicable Not Applicable
New Ground Water 3m3/s(94.6MCM)
Water Conveyance L5=5m3/s L10=10m3/s Not Applicable Not Applicable L5=5m3/s L5=5m3/s L5=5m3/s
Irrigation Facilities Not Applicable Not Applicable CTP Full Scale CTP Half Scale CTP Full Scale CTP Half Scale CTP Full ScaleNotesCB: D/I Water in Canete River Basin(34.22MCM), L5: Lima D/I Water Supply 5m3/s(157.68MCM), L10: Lima D/I Water Supply 10 m3/s(315.36MCM),CV: Canete Valley Irrigation(340.20MCM), CLC: Alto Imperial Irrigation(30.17MCM), CTP: Concon-Topara Irrigation (Full Scale 351.41MCM),CTP5: Concon-Topara Irrigation (Half Scale 175.71MCM)Mf4.3: Maintenance Flow 4.3m3/s(135.60MCM), Mp1.0: Maintenance Flow 1.0m3/s(31.54MCM)
Scenario-3Scenario-2Scenario-1
9-29

Table 9.6.1 Alternative Cases for Water Balance Analysis
WithoutProject
With ProjectWith Loss & Irrigation
Case A1 Case B1 Case B2 Case C1Water Demand1) D/I Water supply(*)
2000 ~ 2030
2000,2005, 20102020, 2030
2005 2010, 2030 2005, 2010, 2020,2030
2) Irrigation, losses & otherdemand, Assumed constant
6.0 m3/s 0.67 m3/s 0.67 m3/s 6.0 m3/s
3) Groundwater Supply no 7.68 m3/s 7.68 m3/s 5.0 m3/s
Dam & Water Transfer no Marca III (3.0 m3/s) Marca III + II (9.5 m3/s) Marca III + II, Huascacocha,Mantaro (16.5 m3/s)
Notes,(1) Marca I Project and Yuracmayo Project are treated as the existing condition.(2) Marca III (3.0 m3/s), Marca II (6.5 m3/s), Huascacocha (2.5 m3/s), Mantaro - Carispacha or Cañete(5.0 m3/s) are treated as future projects.(*) D/I : Domestic/Industry
With ProjectWithout Irrigation & Loss
9-30

Table 9.6.2 Result of Water Balance Analysis
Annual Deficit Occurence(MCM) Year
Case 1/20 2/20 4/20 1/20 2/20 4/20A A1 2000 32.09 27.69 1152.94 1151.93 714.36 1991-1992 1989-1990 1994-1995
2005 26.34 21.53 827.19 818.41 284.70 1991-1992 1989-1990 19792010 29.13 24.52 982.38 978.54 357.97 1991-1992 1989-1990 19792020 35.17 30.99 1338.67 1337.10 513.45 1991-1992 1989-1990 19972030 40.17 36.34 1641.39 1637.70 1134.88 1991-1992 1989-1990 1994-1995
B B1 2000 32.09 14.50 328.97 305.46 70.18 1991-1992 1989-1990 19792005 26.34 8.34 80.72 87.87 4.41 1991-1992 1989-1990 19802010 29.13 11.33 185.91 164.59 26.37 1991-1992 1989-1990 19792020 35.17 17.80 494.62 477.77 120.30 1991-1992 1989-1990 19792030 40.17 23.15 773.27 769.51 260.65 1991-1992 1989-1990 1997
B2 2000 32.09 14.50 189.06 199.01 42.38 1991-1992 1989-1990 19932005 26.34 8.34 71.77 60.30 13.28 1991-1992 1989-1990 19972010 29.13 11.33 122.91 107.61 27.85 1991-1992 1989-1990 19932020 35.17 17.80 303.79 316.17 74.14 1991-1992 1989-1990 19952030 40.17 23.15 565.19 565.99 177.64 1991-1992 1989-1990 1995
C C1 2000 32.09 22.69 381.29 416.69 145.39 1991-1992 1989-1990 19952005 26.34 16.53 233.09 236.68 56.22 1991-1992 1989-1990 19972010 29.13 19.52 301.40 314.25 99.48 1991-1992 1989-1990 19952020 35.17 25.99 516.82 532.45 203.86 1991-1992 1989-1990 19952030 40.17 31.34 800.11 801.59 334.89 1991-1992 1989-1990 1995
(*) Peak Deficit : Maximum deficit in specified year.
CategoryPeak
Deficit(*)
(m3/s)RemarksTarget
Year
TotalDemand(m3/s)
9-31


ADMINSITRATIVE AND TECHNICAL ORGANIZATION FOR THE WATER USEIN THE RIMAC RIVER BASIN
EXECUTIVE ORGANIZATION TECHNICAL & ADMINISTRATIVE ORGANIZATION NORMATIVE ORGANIZATION
NormativeTechnical
Agricultural RegionalBoard Lima-Callao
Sub-Administration of theChillón Irrigation
District
Sub-Administration ofthe Lurín Irrigation
District
General Board of Waterand Soil (GBWS)
Sub-Administration ofthe Rímac Irrigation
District
Administrative
Chillón, Rímac & LurínIrrigation District
ATDR
Directive Council of theUsers Board
Rímac River I.D.
Delegates Assembly⇒ Population Use (1)⇒ Agricultural Use⇒ Industrial Use⇒ Other Uses (2)
Water Users Commission
Irrigation Committees
Directive Council of theUsers Board of
Rímac River I.D.
Rates and Collections
Technical Manager
Secretary
Operation & MaintenanceDepartment
Administration andAccounting Department
SUPERVISION, CONTROL AND INSPECTION
(1) Population Use (SEDAPAL)(2) EDEGEL, Cajamarquilla Zinc Refinery, Mines and OthersI.D. = Irrigation District
Autonomous Authority ofthe Rímac River Basin
AA CH
JAPA
N IN
TERN
ATIO
NA
L CO
OPER
ATIO
N
SUPPLEM
ENTA
L INV
ESTIGA
TION
OF
THE STU
DY
ON
INTEG
RA
TED W
ATER
RESO
UR
CES D
EVELO
PMEN
TIN
THE C
AÑ
ETE RIV
ER B
ASIN
IN TH
E REPU
BLIC
OF PER
U
Figure 9.2.2 A
dministrative and Technical O
rganization for the W
ater Use in the R
ímac R
iver Basin
9-33


0.0
10.0
20.0
30.0
40.0
50.0
60.0
70.0
80.0
90.0
100.0
110.0
%
Dis
char
ge (m
3 /sec
)
0 10 20 30 40 50 60 70 80 90 100
Discharge data include diversion water from the Mantaro riverbasin (Marca I) and also include controlled discharge by theYuracmayo reservoir since 1996.
22.1 m3/sec
14.7 m3/sec
JAPA
N IN
TERN
ATIO
NA
L CO
OPER
ATIO
N A
GEN
CY
STUD
Y O
N IN
TEGR
ATED
WA
TER R
ESOU
RC
ES DEV
ELOPM
ENT
INTH
E CA
ÑETE R
IVER
BA
SIN IN
THE R
EPUB
LIC O
F PERU
Figure 9.3.1D
uration Curve of R
imac R
iver (Chosica,
SENA
MH
I) Monthly average 1973-1997

Chosica(SENAMHI)
Matucana hydropower plant
Huinco hydropower plant
Sheque intake
Tamboraque intake
Moyopampa hydropower plant Huampaní hydropower plant
La Atarjea(SEDAPAL)
3B
Callahuanca hydropower
2B
1A
1B
For estimating flow infiltration throughriverbed, 24 hours discharge (one hourinterval) is available to scrutinize flowamount fluctuation.
Flow loss by infiltrationIndustry/Irrigation
4B
Calibration
Data Collection
Observed discharge
Non-observed discharge
5B
4A
3A
2A
Intake
Hydropower plant
Regulating pond
(Santa Eulalia river)
(San Mateo river)
(Rímac river)
JAPA
N IN
TERN
ATIO
NA
L CO
OPER
ATIO
N A
GEN
CY
STUD
Y O
N IN
TEGR
ATED
WA
TER R
ESOU
RC
ES DEV
ELOPM
ENT
INTH
E CA
ÑETE R
IVER
BA
SIN IN
THE R
EPUB
LIC O
F PERU
Figure 9.3.2Schem
atic Diagram
on Water C
onveyance Route
in Rí mac R
iver Basin
Huachipa bridge
9-36

0
5
10
15
20
25
30
35
40
45
50
Time (day)
Dis
char
ge (m
3 /sec
)
Intake Discharge at La Atarjea
Chosica (4 hr time lag)
Loss between Chosica and La Atarjea
Jul.23 24 25 26 27 28 29 30 31 Aug. 1 2 3 4 5 6 7 8 9 10 11 12 13 14 15 16
6 m3/sec
JAPA
N IN
TERN
ATIO
NA
L CO
OPER
ATIO
N A
GEN
CY
STUD
Y O
N IN
TEGR
ATED
WA
TER R
ESOU
RC
ES DEV
ELOPM
ENT
INTH
E CA
ÑETE R
IVER
BA
SIN IN
THE R
EPUB
LIC O
F PERU
Figure 9.3.3R
iver Discharge at C
hosica and La Atarjea (1/2)
9-37
0
5
10
15
20
25
30
35
40
45
50
Time (day)
Dis
acha
rge
(m3 /s
ec)
Intake Discharge at La Atarjea
Chosica (4 hr time lag)
Loss between Chosica and La Atarjea
6 m3/sec
Aug.17 18 19 20 21 22 23 24 25 26 27 28 29 30 31 Sep.1 2 3 4 5 6 7 8 9
JAPA
N IN
TERN
ATIO
NA
L CO
OPER
ATIO
N A
GEN
CY
STUD
Y O
N IN
TEGR
ATED
WA
TER R
ESOU
RC
ES DEV
ELOPM
ENT
INTH
EC
AÑ
ETER
IVER
BA
SININ
THE
REPU
BLIC
OF
PERU
Figure 9.3.3R
iver Discharge at C
hosica and La Atarjea (2/2)
9-38