chapter 7seasgd.csir.co.za/wp-content/uploads/2016/11/ch-7_biodiversity_14... · chapter 7:...
TRANSCRIPT
CHAPTER 7: BIODIVERSITY AND ECOLOGICAL IMPACTS
CHAPTER 7 Biodiversity and
Ecological Impacts: Landscape Processes,
Ecosystems and Species

CHAPTER 7: BIODIVERSITY AND ECOLOGICAL IMPACTS
Page 7-1
CHAPTER 7: BIODIVERSITY AND ECOLOGICAL
IMPACTS: LANDSCAPE PROCESSES, ECOSYSTEMS AND SPECIES
Integrating Author: Stephen Holness1, Amanda Driver2
Contributing Authors: Simon Todd3, Kate Snaddon4, Michelle Hamer2, Domitilla Raimondo2, Fahiema Daniels2
Corresponding Authors: Graham Alexander5, Corinna Bazelet6 , Roger Bills7, Christy Bragg8, Bill Branch9, Peter Bruyns10, Albert Chakona7, Matthew Child8, Ralph Vincent Clarke11, Andre Coetzer12, Willem Coetzer7, Jonathan Colville2, Werner Conradie9, Richard Dean13, Connal Eardley14, Ismail Ebrahim2, Dave Edge12, Dave Gaynor15, Simon Gear16, Dai Herbert17, Mahlatse Kgatla2, Kedibone Lamula2, Given Leballo2, Robin Lyle14, Norma Malatji2, Mervyn Mansell18, Silvia Mecenero12, John Midgley19, Musa Mlambo19, Hlengiwe Mtshali20, John Simaika6, Andrew Skowno2, Herman Staude12, Krystal Tolley2, Les Underhill21, Dewidine van der Colff 2, Simon van Noort22, Lize von Staden2.
1 Nelson Mandela Metropolitan University (NMMU), Port Elizabeth, 6031 2 South African National Biodiversity Institute (SANBI), Pretoria, 0184 3 South African Environmental Observation Network (SAEON) Arid Lands Node, Kimberly, 8306 4 Freshwater Consulting Group, Cape Town, 7800 5 University of the Witwatersrand, Johannesburg, 2000 6 University of Stellenbosch, Stellenbosch, 7600 7 The South African Institute for Aquatic Biodiversity (SAIAB), Grahamstown, 6139 8 Endangered Wildlife Trust, Johannesburg, 1609 9 Bayworld/ Port Elizabeth Museum, Port Elizabeth, 6013 10 University of Cape Town (UCT), Rondebosch, 7701 11 Rhodes University, Grahamstown 12 The Lepidopterists’ Society of Africa (LepSoc) 13 Renu-Karoo Veld Restoration cc, Prince Albert, 6930 14 Agricultural Research Council (ARC), Pretoria, 0001

CHAPTER 7: BIODIVERSITY AND ECOLOGICAL IMPACTS
Page 7-2
15 University of Pretoria, Hatfield, 0028 16 BirdLife South Africa, Johannesburg, 2196 17 KwaZulu-Natal Museum, Pietermaritzburg, 3021 18 Independent Consultant, Pretoria, 0001 19 Albany Museum, Grahamstown, 6139 20 Botanical Society of South Africa, Mayville, 4058 21 Animal Demography Unit, University of Cape Town, Rondebosch, 7701 22 Iziko Museums of South Africa, Cape Town, 8000
Recommended citation: Holness, S., Driver, A., Todd, S., Snaddon, K., Hamer, M., Raimondo, D., Daniels, F., Alexander, G., Bazelet, C., Bills, R., Bragg, C., Branch, B., Bruyns, P., Chakona, A., Child, M., Clarke, R.V., Coetzer, A., Coetzer, W., Colville, J., Conradie, W., Dean, R., Eardley, C., Ebrahim, I., Edge, D., Gaynor, D., Gear, S., Herbert, D., Kgatla, M., Lamula, K., Leballo, G., Lyle, R., Malatji, N., Mansell, M., Mecenero, S., Midgley, J., Mlambo, M., Mtshali, H., Simaika, J., Skowno, A., Staude, H., Tolley, K., Underhill, L., van der Colff, D., van Noort, S. and von Staden, L. 2016. Biodiversity and Ecological Impacts: Landscape Processes, Ecosystems and Species. In Scholes, R., Lochner, P., Schreiner, G., Snyman-Van der Walt, L. and de Jager, M. (eds.). 2016. Shale Gas Development in the Central Karoo: A Scientific Assessment of the Opportunities and Risks. CSIR/IU/021MH/EXP/2016/003/A, ISBN 978-0-7988-5631-7, Pretoria: CSIR. Available at http://seasgd.csir.co.za/scientific-assessment-chapters/

CHAPTER 7: BIODIVERSITY AND ECOLOGICAL IMPACTS
Page 7-3
CONTENTS
CHAPTER 7: BIODIVERSITY AND ECOLOGICAL IMPACTS 7-8
7.1 Introduction and scope 7-8
7.1.1 What is meant by this topic? 7-8
7.1.2 Overview of international experience 7-9
7.1.3 Special features of Karoo ecology and biodiversity 7-12 7.1.3.1 Terrestrial Ecosystems 7-12 7.1.3.2 Plant species diversity and endemism 7-15 7.1.3.3 Terrestrial fauna 7-17 7.1.3.4 Aquatic ecosystems and species 7-22
7.1.4 Relevant legislation and policy 7-25
7.2 Key potential impacts and their mitigation 7-27
7.2.1 Strategic approach to mitigation at the landscape level 7-27
7.2.2 Activities, impacts and mitigation measures 7-30
7.2.3 Cumulative impacts 7-37
7.2.4 Capacity gaps for implementation of mitigation measures 7-39
7.3 Risk assessment 7-42
7.3.1 Identification of areas of EBIS 7-42
7.3.2 How the risks are measured 7-49
7.3.3 Limits of acceptable change 7-49
7.3.4 Risk assessment table 7-50
7.4 Best practice guidelines and monitoring requirements 7-54
7.4.1 Best practice guidelines 7-54
7.4.2 Monitoring requirements 7-55 7.4.2.1 Summary of monitoring requirements and institutional arrangements 7-55 7.4.2.2 Recommended indicator species for monitoring 7-59 7.4.2.3 Monitoring standards & approaches 7-61
7.5 Gaps in knowledge 7-63
7.6 Acknowledgements 7-65
7.7 References 7-66
7.8 Digital Addenda 7A – 7B 7-72
CHAPTER 7: BIODIVERSITY AND ECOLOGICAL IMPACTS
Page 7-4
Tables
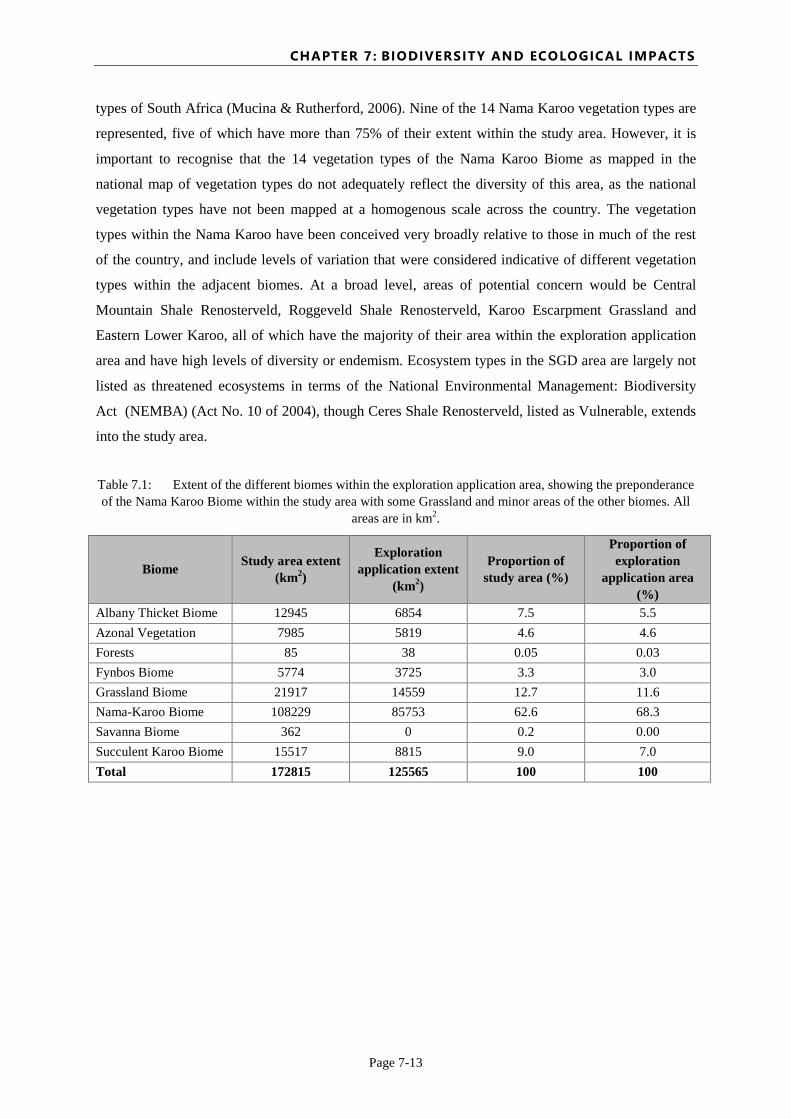
Table 7.1: Extent of the different biomes within the exploration application area, showing the preponderance of the Nama Karoo Biome within the study area with some Grassland and minor areas of the other biomes. All areas are in km2. 7-13
Table 7.2: Strategic application of the mitigation hierarchy at the landscape level, based on the map of EBIS. 7-29
Table 7.3: Activities, impacts and mitigation measures. 7-31
Table 7.4: Extent of areas of EBIS within the study area (hectares and percentage) 7-46
Table 7.5: Summary of features included in each category of EBIS. 7-47
Table 7.6: Consequence levels used in the risk assessment, with thresholds for species, ecosystems and ecological processes. Thresholds for species are linked to thresholds used in IUCN Red List assessments, and those for ecosystems and ecological processes are linked to thresholds used in national assessments of ecosystem threat status and in biodiversity planning in South Africa. 7-51
Table 7.7: Risk assessment table which sets out the assessment of risk for each of the scenarios, with and without mitigation. No SGD takes place in the Reference Case scenario, while limited shale gas production takes place in the Small Gas scenario, and extensive SGD takes place in the Big Gas scenario. 7-52
Table 7.8: Monitoring requirements at the landscape, ecosystem, species and site level, including indicators and responsibilities. 7-57
Table 7.9: Additional information on species and features that could be monitored, with indicators and possible study approaches. Ideally a basket of indicators selected from each level of the hierarchy should be used in an integrated way, based on the characteristics of the receiving environment and assessed risks and impacts for that area. 7-62
Figures
Figure 7.1: a) Jointed cactus (Opuntia aurantica) is an aggressive invasive plant with segmented stems that break off easily when their sharp barbed spines attach to passing animals or people. b) This species can render areas unusable for livestock grazing as the cladodes (leaves) stick to animals’ hooves and mouths leaving them unable to walk or eat. c) Mesquite Prosopis spp. hybrids occupy large tracks of the upper Karoo especially along drainage lines and bottomlands. d) The aptly-named satansbos (Solanum elaeagnifolium) is notoriously difficult to eradicate as it is able to regenerate from small root fragments. 7-15
Figure 7.2: Mean species richness with standard deviation bars within five habitats within the Karoo near to Beaufort West (from Todd, 2003). 7-16
Figure 7.3: Although there are some plant species of conservation concern that are restricted to the plains, the majority of range-restricted endemic plant species are associated with mountains and rocky hills of the Karoo. This may limit the potential impact of SGD on plant species of conservation concern. 7-17
Figure 7.4: Although the national vegetation map identifies relatively few vegetation types within the Nama Karoo, this belies the large amount of landscape variation that is present and that is

CHAPTER 7: BIODIVERSITY AND ECOLOGICAL IMPACTS
Page 7-5
important for the fauna. Many species use different parts of the landscape at different times of the year or even each day. As much of the landscape is very open, drainage lines and other areas of dense vegetation can be especially important for animals. 7-19
Figure 7.5: The same stream a few hours after a large rainfall event (left) and some days thereafter (right), showing how such aquatic ecosystems can come down in spate but dry up very quickly afterwards. 7-23
Figure 7.6: Although the Karoo is arid, it can experience occasional intense showers (left), and due to the low vegetation cover and susceptible soils, erosion can be high (right). 7-23
Figure 7.7: Tadpole shrimps (Triops granarius) are common in pans in the Karoo but spend most of their time as dormant eggs in the soil, sometimes with years between life cycles. 7-25
Figure 7.8: Distance surfaces from shale gas infrastructure, under the Small Gas scenario (left) and the Big Gas scenario (right), illustrating the fragmentation of the landscape by SGD, even where it occupies a small proportion of the landscape. 7-37
Figure 7.9: Cumulative distance curves illustrating the proportion of a 30x30 km block that would be within the x-axis distance from an access road or wellpad under the Small Gas scenario (green) and the Big Gas scenario (red). 7-38
Figure 7.10: The impacts of SGD are likely to be very different in vegetation types with low vegetation cover such as this Gamka Karoo near Laingsburg (left), compared to Thicket vegetation types with a high standing biomass such as this Great Fish Thicket near Riebeeck East (right). 7-39
Figure 7.11: Mountainous and topographically heterogeneous areas are generally more diverse for both fauna and flora than the intervening open plains. A significant proportion of the areas identified as being of high importance for biodiversity are mountainous and therefore would tend not to be suitable for SGD. 7-46
Figure 7.12: Map of Ecological and Biodiversity Importance and Sensitivity (EBIS) in the study area. Protected areas (5% of study area) are legally protected. EBIS-1 areas (13% of study area) contain extremely sensitive features and are irreplaceable. EBIS-2 areas (37% of study area) contain highly sensitive features and/or features that are important for achieving targets for representing biodiversity and/or maintaining ecological processes. Protected areas, EBIS-1 areas and EBIS-2 areas collectively meet targets for representation of biodiversity and maintenance of ecological processes in the study area. EBIS-3 areas (44% of the study area) are natural areas that do not contain currently known sensitive or important features. In EBIS-4 areas (1% of study area) there is no remaining natural habitat. 7-48
Figure 7.13: Map indicating the risk to ecology and biodiversity across four SGD scenarios, with- and without mitigation. 7-53

CHAPTER 7: BIODIVERSITY AND ECOLOGICAL IMPACTS
Page 7-6
Executive Summary Nature of the study area and shale gas development (SGD) impacts 1. The study area includes relatively high levels of biodiversity, including highly sensitive
and unique ecosystems and -species. Seven different biomes and 58 vegetation types, 119 range-
restricted plant species, and 12 globally threatened animal species have been recorded from the study
area. See Section 7.1.3: Special features of Karoo ecology and biodiversity.
2. The Karoo is an arid ecosystem characterised by ecological processes that operate over
extensive areas. In addition, the Karoo is sensitive to disturbance, and disturbance has long-term
impacts; recovery in disturbed areas is generally not spontaneous and rehabilitation is often met with
poor success. See Section 7.1.3: Special features of Karoo ecology and biodiversity.
3. A major concern is that the extensive linear infrastructure associated with SGD will
result in fragmentation of the landscape. Loss of connectivity, edge effects and disruption of
ecological processes associated with a network of linear structures (such as roads, powerlines and
pipelines) are likely to undermine the biodiversity integrity of the study area. This supports the
requirement for landscape-level mitigation, discussed below. This issue is examined in Section 7.2.3:
Cumulative impacts.
4. Impacts on species, ecosystems and ecological processes extend well beyond the actual
activity or physical footprint. For many species the impacts of noise, pollution, erosion and other
disturbance can extend for hundreds of metres or kilometres from the source, and fragmentation of the
landscape can disrupt ecological processes over large areas. Potential impacts across the landscape are
examined in Section 7.2: Key potential impacts and their mitigation.
5. Impacts on species and ecological processes can have cascading effects. Although the
dynamics of a specific impact are difficult to predict, cascading ecological impacts are likely to occur.
Again, this supports landscape-level mitigation whereby a representative sample of the biodiversity of
the study area, as well as key ecological processes, are secured. Impacts are examined in Section 7.2:
Key potential impacts and their mitigation.
Strategic landscape-level approach to mitigation of impacts 6. Mitigation of ecological and biodiversity impacts must take place not only at the site
scale but also at the landscape scale. The scientific assessment has identified areas of Ecological
and Biodiversity Importance and Sensitivity (EBIS), from EBIS-1 (highest) to EBIS-4 (lowest). The
primary mitigation for SGD is avoiding and securing the EBIS-1 and EBIS-2 areas, which
effectively makes EBIS-3 and EBIS-4 areas available for SGD. Strategic mitigation at the

CHAPTER 7: BIODIVERSITY AND ECOLOGICAL IMPACTS
Page 7-7
landscape level is essential, as the impacts of SGD cannot be effectively mitigated on site or at the
operational level. The explanation for this approach is given in Section 7.3: Risk Assessment.
7. EBIS-1 and EBIS-2 areas make up 50% of the study area. Loss or degradation of habitat
in these areas must be avoided and they should be secured through legal mechanisms. This may
involve formal protected area declaration (including through biodiversity stewardship agreements),
but can include other types of stewardship, protection under Section 49 of the MPRDA, appropriate
designation in land use schemes, or protection through other legal means. Securing these areas may
lend itself to a fast-tracked, integrated protected area expansion strategy, similar to Operation Phakisa
in the marine environment. This issue is examined in Section 7.3: Risk Assessment.
8. EBIS-1 areas contain extremely sensitive features and are irreplaceable. Activities
related to SGD in these areas are assessed as very high risk. It is not possible to minimise or offset
impacts of SGD in EBIS-1 areas, and impacts of SGD in these areas would undermine the
ecological integrity of the study area (and more broadly, the Karoo). See Section 7.3: Risk
assessment.
9. EBIS-2 areas contain highly sensitive features and features that are important for meeting
biodiversity targets and/or maintaining ecological processes in the study area. Where SGD activities
in EBIS-2 areas are unavoidable, the impacts must be minimised and residual impacts must be
offset by securing ecologically equivalent sites in EBIS-1 or EBIS-2 areas for the representation of
biodiversity and maintenance of ecological processes. In the case of such offsets, appropriate national
and provincial offset guidelines and methodologies should be applied to ensure no net loss. This issue
is examined in Section 7.3: Risk Assessment.
10. Environmental compliance in EBIS-3 and EBIS-4 areas is still required. This includes
specialist-led assessment of local sensitivities and identification of appropriate mitigation. It is
necessary to ground-truth desktop assessments and avoid unnecessary impacts. Specific impacts are
discussed in Section 7.2.2: Activities, impacts and mitigation measures and monitoring requirements
are discussed in Section 7.4: Best practice guidelines and monitoring requirements.
11. The cumulative and unforeseen impacts of SGD, as well as effectiveness of mitigation,
must be monitored. The outcomes of the monitoring programme need to dynamically inform
ongoing strategic and regional-level decisions on SGD. Monitoring requirements are discussed in
Section 7.4: Best practice guidelines and monitoring requirements.

CHAPTER 7: BIODIVERSITY AND ECOLOGICAL IMPACTS
Page 7-8
CHAPTER 7: BIODIVERSITY AND ECOLOGICAL IMPACTS
7.1 Introduction and scope
7.1.1 What is meant by this topic?
Biodiversity1 is commonly considered to include three components or levels: ecosystem diversity,
species diversity and genetic diversity. This topic deals with biodiversity at the ecosystem and species
level, as well as with the ecological processes at the landscape scale which support this biodiversity.
As discussed in several places in the scientific assessment, the ecological impacts of shale gas
development (SGD) in the arid Karoo environment, in which many ecological processes operate over
extensive spatial areas, are likely to be felt especially at the landscape scale. A focus on landscape
processes and connectivity in the landscape is often difficult to achieve in individual Environmental
Impact Assessments (EIAs), because the spatial scale at which these processes operate is generally
larger than the individual projects for which EIAs will be conducted, so it is particularly important to
address these aspects in the scientific assessment, with its broad spatial scope.
In addition to the strong emphasis on ecosystems and landscape-scale ecological processes, this topic
also covers plant and animal species, focusing on species of special concern, which include threatened
species and species endemic or near-endemic to the study area. An additional focus is on ecological
infrastructure2 and ecosystem services. In particular, aquatic ecosystems, such as rivers and wetlands,
play a key role in underpinning ecological infrastructure, which is important for delivering a range of
services and benefits to people. In the arid Karoo context, ecological infrastructure that is linked to
water-related ecosystem services is especially vital.
The topic covers terrestrial and aquatic biodiversity. The topic of biodiversity and ecological impacts
has links with several other topics, including:
• Water resources (Hobbs et al., 2016);
• Tourism (Toerien et al., 2016);
• Visual impacts (Oberholzer, et al., 2016);
• Noise (Wade et al., 2016);
• Sense of place (Seeliger et al., 2016); and
1 Biodiversity means the variability among living organisms from all sources including, inter alia, terrestrial, marine and other aquatic ecosystems and the ecological complexes of which they are part. It includes diversity within species, between species and of ecosystems. (Convention on Biological Diversity, Article 2). 2 Ecological infrastructure means naturally functioning ecosystems that generate or deliver valuable services to people. It is the nature-based equivalent of built or hard infrastructure, and is just as important for providing services and underpinning socio-economic development (SANBI, 2013).
CHAPTER 7: BIODIVERSITY AND ECOLOGICAL IMPACTS
Page 7-9
• Agriculture (Oettle et al., 2016).
Impacts on these other elements are dealt with in these separate topics. A particularly important split
is the one in aquatic systems: this scientific assessment deals with aquatic ecosystems and species,
while issues related to water as a resource (such as water use) are dealt with in Hobbs et al. (2016).
The approach taken in this scientific assessment is based on of the following key assumptions:
• Avoiding impacts on sufficient area that represents all known aspects of biodiversity (i.e.
sufficient suitable habitat of each distinct type) in a spatial configuration that allows for
ecological processes to be maintained (i.e. that maintains landscape connectivity, that avoids
fragmentation across the entire landscape, and that secures sufficient internal habitat that is
not impacted by edge effects) will result in the long-term persistence of biodiversity.
• Biodiversity issues related to genetic diversity are sufficiently dealt with through the broader
level assessments of ecosystems, species and ecological processes.
• Enough is known about biodiversity and ecological processes in the Karoo to understand the
potential impact of SGD on these components, but it is clear that there are major knowledge
gaps. For example, almost nothing is known of the impact of fragmentation (a key focus of
this scientific assessment) on ecological processes in the Karoo. Further, the understanding of
Karoo invertebrate diversity is very poor. Therefore, the assumption is that by avoiding
impacts on sufficient habitat that is representative of all known biodiversity, in a spatial
configuration that maintains known ecological processes, the needs of unknown and poorly
known aspects of biodiversity will also be met and poorly understood ecological processes
will be allowed to be maintained.
7.1.2 Overview of international experience
SGD has outpaced both research and legislation (Souther et al., 2014; Robbins, 2013), with the result
that many of the negative ecological impacts of SGD are only starting to emerge now as long-term
studies begin to provide results. Brittingham et al. (2014) reviewed the potential impacts of SGD on
ecosystems and species, but acknowledged that actual studies on impacts are currently rare. As a
result, the existing literature contains a lot of speculative conclusions and anecdotal evidence, and
many presumed impacts are inferred based on similar extractive industries such as oil and
conventional gas. Clearly there is no directly relevant information in South Africa as an active
onshore oil and gas industry or any significant industrial activity does not exist in the Karoo.
Comparisons with existing research are useful, but the limitations should be kept in mind, as these
studies have been conducted in different, usually much wetter, ecosystems and the affected
ecosystems and fauna do not always have direct analogues here. To date, the only published study on
CHAPTER 7: BIODIVERSITY AND ECOLOGICAL IMPACTS
Page 7-10
the ecological impacts of SGD in South Africa is that of Todd et al. (2016) who provide a review of
the international literature on SGD and interpret the findings in terms of Karoo ecosystems and risks
posed by the different activities associated with SGD.
Assessing the direct impact of SGD in the form of loss of intact habitat is relatively simple, as this can
easily be determined from the footprint of the development as assessed on the ground or through
satellite imagery. Jones et al. (2014) found that impacts on vegetation disappeared within 25 m of the
development footprint, and that the direct footprint of SGD in their study site in Uzbekistan was less
than 1% of the landscape, which is likely to be similar to the extent of direct habitat loss under the
SGD scenarios considered in this scientific assessment. However, SGD is also likely to generate
significant indirect impacts that extend beyond the direct footprint. Much of this impact is associated
with seismic exploration activities and the development of roads and pipelines that fragment the
landscape (Brittingham et al., 2014). Disturbed areas around wellpads and along roads will increase
the vulnerability of these areas to invasion by alien plants (Gelbard & Belknap, 2003), which may
then spread to intact areas and impinge on ecosystem services, biodiversity and agricultural
production (Jones et al., 2015). The introduction of invasive and non-native plants on vehicles (for
example in seed mixes) is a particular problem and is difficult to avoid. Disturbance generated by road
and pipeline construction and maintenance increases the ability of invasive plants to spread (Brooks &
Berry, 2006; Mortensen et al., 2009). Once present, these invasive species can out-compete native
species and severely reduce habitat quality and ecosystem service delivery (Brooks 2000, Pimentel et
al., 2001; Jones et al., 2015). The impacts of access roads in the Karoo may be higher than most
overseas situations due to the arid conditions and increased propensity for dust to be generated by
vehicles, which may affect vegetation and fauna over broader areas (Trombulak & Frissell, 2000).
Impacts on fauna are more difficult to quantify as behavioural and demographic responses to
disturbance by sometimes elusive species have to be monitored. A range of studies have documented
faunal impact resulting from spills from waste water ponds when blowouts or failure of ponds occur.
A number of instances resulting in mortality of in-stream fish or mammals that drank the water from
affected streams have been documented (Robbins, 2013). Furthermore, animals tend to drown in or be
poisoned by the waste water storage ponds (Wall et al., 2013) as they are often attracted to them
(Hein, 2012; Ramirez, 2009). Under such circumstances storage ponds act as ecological traps for a
wide range of species (Kiviat, 2013). This is likely to be problematic in the Karoo as many animals
are attracted to standing water under the prevailing arid conditions. The best mitigation for this is to
ensure that waste water is kept in closed containers or in suitably sealed ponds covered with shade
cloth. Lights around wells can also cause avian entrapment which occurs particularly during foggy or

CHAPTER 7: BIODIVERSITY AND ECOLOGICAL IMPACTS
Page 7-11
cloudy conditions when birds are attracted to lights and fly around them till exhausted (e.g.
Gauthreaux & Belser, 2006).
Apart from the direct impacts on fauna, there are also indirect impacts on sensitive fauna, usually
through disturbance and noise (see Andrews et al., 2008; Barber et al., 2010; Blickley et al., 2012).
International examples of shy species include Sage Grouse, which could be compared to the various
Korhaan and Bustard species that occur across the Karoo, as well as Moose and Mule deer which
could be seen to have similar responses to large ungulates such as Kudu here. Impacts on fauna
require long-term detailed monitoring and such studies are only just starting to emerge. Many of these
studies are highlighting the cumulative impact of development on sensitive species and the interactive
role that disturbance-related stress plays in breeding success and susceptibility to disease (e.g. Barber
et al., 2010; Gavin & Komers, 2006).
Although habitat loss is a leading cause of ecological impact in many parts of the world, most of the
vegetation types within the Karoo are still largely intact and, while they may have been impacted by
livestock overgrazing and consequent degradation, they retain a significant proportion of their
biodiversity and ecological integrity. However, roads, pipelines and other associated infrastructure
will generate a significant amount of habitat loss and landscape fragmentation within the affected
areas (Jones et al., 2015), especially under Scenario 3 (the Big Gas scenario). The impacts of
fragmentation will be variable, depending on both the habitats and species affected. In addition,
habitat fragmentation is usually associated with increases in other disturbance factors such as noise
and human presence (Brittingham et al., 2014), and while some species are likely to become
habituated to these conditions, it is likely that some species will remain sensitive (Epps et al., 2005;
Sawyer et al., 2006).
As mentioned, it is important to consider the manner in which roads and associated fragmentation will
impact Karoo ecosystems. Large parts of the Karoo consist of low, relatively open shrublands or
shrubby grasslands with regular, relatively open or bare areas. Consequently, most fauna present are
adapted or accustomed to traversing open areas and the loss of cover resulting from smaller roads may
have little effect in these areas. However, in areas of high vegetation cover such as the Thicket Biome
areas in the south-east of the study area and the higher elevation grasslands of the east, the fauna
present are more likely to be averse to traversing open ground or more vulnerable to predation and so
the potential for disruption of dispersal and other processes is higher (e.g. Andrews & Gibbons, 2005;
Epps et al., 2005). A significant increase in faunal impact due to roadkill as a result of increases in
traffic volumes as well as the construction of many new access roads is potentially significant across
the entire study area (Collinson et al., 2015). Impacts on slow reproducing (e.g. tortoises), slow

CHAPTER 7: BIODIVERSITY AND ECOLOGICAL IMPACTS
Page 7-12
moving species (e.g. snakes, tortoises) and species attracted to roads due to the presence of roadkill
themselves (e.g. Bat-eared Foxes, polecats) is of potential concern (Andrews & Gibbons, 2005;
Clarke et al., 2010).
7.1.3 Special features of Karoo ecology and biodiversity
The Karoo is an arid ecosystem characterised by low, unpredictable rainfall and episodic drought
events (Hoffman & Cowling, 1990). This has important implications for the dynamics of vegetation
within the region. Concepts such as succession and gradual, stepwise and predictable changes in
vegetation composition do not apply well in arid ecosystems, and instead ecologists have recognised
the event-driven, non-linear dynamics of arid systems such as the Karoo (Milton & Hoffman, 1994;
Wiegand & Milton, 1996). Recognition is given under this concept to the unpredictable nature of such
systems and their ability to switch quickly from one state to another in response to climatic or biotic
events, without the need to pass gradually through intermediate stages. This has important
implications for physical disturbance in the Karoo and the ability of humans to repair these impacts
(Visser et al., 2004). Many of the shrub species present are long-lived (hundreds of years) and
recruitment occurs infrequently in response to rare sequences of rainfall and climate conditions
(Wiegand & Milton, 1996). As such, it can be very difficult to re-establish the dominant shrub species
in disturbed areas as recovery does not occur spontaneously and active rehabilitation is often met with
poor success (Carrick & Kruger, 2007; Visser et al., 2004). This has important implications for the
manner that SGD should take place within this environment. Disturbance can persist for decades or
even centuries, and many areas are also vulnerable to erosion once the vegetation has been disturbed
(Boardman et al., 2003). Therefore, the primary avenue through which to minimise negative impacts
in this environment is to ensure that the disturbance footprint is kept to a minimum.
Special features related to the following are discussed below:
• Terrestrial ecosystems;
• Plant species diversity and endemism;
• Terrestrial fauna (including mammals, birds, reptiles and invertebrates); and
• Aquatic ecosystems and species.
7.1.3.1 Terrestrial Ecosystems
The study area includes seven different biomes of which the Nama Karoo (Mucina et al., 2006), at
68% of the exploration application area, is by far the most important (Table 7.1). There are 58
vegetation types within the area (out of approximately 430 vegetation types nationally), of which ten
have more than 75% of their extent within the study area, based on the national map of vegetation
CHAPTER 7: BIODIVERSITY AND ECOLOGICAL IMPACTS
Page 7-13
types of South Africa (Mucina & Rutherford, 2006). Nine of the 14 Nama Karoo vegetation types are
represented, five of which have more than 75% of their extent within the study area. However, it is
important to recognise that the 14 vegetation types of the Nama Karoo Biome as mapped in the
national map of vegetation types do not adequately reflect the diversity of this area, as the national
vegetation types have not been mapped at a homogenous scale across the country. The vegetation
types within the Nama Karoo have been conceived very broadly relative to those in much of the rest
of the country, and include levels of variation that were considered indicative of different vegetation
types within the adjacent biomes. At a broad level, areas of potential concern would be Central
Mountain Shale Renosterveld, Roggeveld Shale Renosterveld, Karoo Escarpment Grassland and
Eastern Lower Karoo, all of which have the majority of their area within the exploration application
area and have high levels of diversity or endemism. Ecosystem types in the SGD area are largely not
listed as threatened ecosystems in terms of the National Environmental Management: Biodiversity
Act (NEMBA) (Act No. 10 of 2004), though Ceres Shale Renosterveld, listed as Vulnerable, extends
into the study area.
Table 7.1: Extent of the different biomes within the exploration application area, showing the preponderance of the Nama Karoo Biome within the study area with some Grassland and minor areas of the other biomes. All
areas are in km2.
Biome Study area extent (km2)
Exploration application extent
(km2)
Proportion of study area (%)
Proportion of exploration
application area (%)
Albany Thicket Biome 12945 6854 7.5 5.5 Azonal Vegetation 7985 5819 4.6 4.6 Forests 85 38 0.05 0.03 Fynbos Biome 5774 3725 3.3 3.0 Grassland Biome 21917 14559 12.7 11.6 Nama-Karoo Biome 108229 85753 62.6 68.3 Savanna Biome 362 0 0.2 0.00 Succulent Karoo Biome 15517 8815 9.0 7.0 Total 172815 125565 100 100

CHAPTER 7: BIODIVERSITY AND ECOLOGICAL IMPACTS
Page 7-14
Invasive Alien Plants in the Karoo
Invasive alien plants require management because they may impact biodiversity as well as the provision of ecosystem services which contribute to human livelihoods and well-being (Richardson & Van Wilgen, 2004; Van Wilgen et al., 2008).
In terms of legislation, the Alien and Invasive Species Regulations (2014), promulgated under the National Environmental Management: Biodiversity Act (Act No 10 of 2004) require that land users clear Declared Weeds from their properties and prevent the spread of Declared Invader Plants on their properties.
The Karoo has a long history of alien plant invasion, with the Boetebos (Xanthium spinosum) being the first species to be legislated as a declared invader in 1860. Prickly Pears (Opuntia spp.) were also once a widespread problem in the Karoo but were controlled in most areas by Cactoblastis and Cochineal biocontrol agents.
Disturbance is a major driver of alien plant invasion, and roads in particular have been identified as an avenue of alien plant invasion (Gelbard & Belnap, 2003; Von Der Lippe & Kowarik, 2007). This applies in the Karoo, where most common invasive species are already present at low density and are able to expand rapidly into disturbed areas, aided by the low cover of indigenous species in these areas as well as water subsidies received from adjacent roads and other disturbed or hardened surfaces. As discussed in Section 7.2, roads and other forms of disturbance are among the key potential impacts of SGD in the study area, including but not only because of risks related to invasion by alien species.
Invasive alien species of economic or ecological concern in the Karoo include the various Prosopis hybrids which together occupy more than 1.5 million hectares of the country and generate a significant negative hydrological impact through their use of groundwater and suppression of indigenous species (Dzikiti et al., 2013; Ndhlovu et al., 2011). There are also various Opuntia/Cylindropuntia species and other Cactaceae which reduce grazing capacity and may have thorns which injure animals; Xanthium spinosum which has burrs that affect the quality of wool and mohair; Satansbos (Solanum elaeagnifolium) which is a problem on cultivated lands and overgrazed veld; as well as a number of other significant invasive alien species which are a general problem in disturbed areas including Salsola kali and Argemone ochroleuca.

CHAPTER 7: BIODIVERSITY AND ECOLOGICAL IMPACTS
Page 7-15
Figure 7.1: a) Jointed cactus (Opuntia aurantica) is an aggressive invasive plant with segmented stems that break off easily when their sharp barbed spines attach to passing animals or people. b) This species can render areas unusable for livestock grazing as the cladodes (leaves) stick to animals’ hooves and mouths leaving them
unable to walk or eat. c) Mesquite Prosopis spp. hybrids occupy large tracks of the upper Karoo especially along drainage lines and bottomlands. d) The aptly-named satansbos (Solanum elaeagnifolium) is notoriously difficult
to eradicate as it is able to regenerate from small root fragments.
7.1.3.2 Plant species diversity and endemism
There are 193 endemic or near-endemic plant species out of a total of 2 158 indigenous species known
to occur in the study area. Of the endemic or near endemic species, 119 (Digital Addendum 7A) can
be considered to be of conservation concern because they have ranges and habitat requirements that
are narrow and specific enough to make them vulnerable to development impacts. A large proportion
of these range-restricted species (75 species, or 63%) occur in the mountains and are concentrated in
the botanical centres of endemism, including the Roggeveld Escarpment around Sutherland (46
species), the Cape Midlands Escarpment that includes the Sneeuberg Massif that surrounds Graaff-
Reinet (23 species) and the Nuweveldberge (12 species) just west of Beaufort West. This limits their
vulnerability to impacts of SGD, as mountainous areas tend to be less suitable for SGD. However,
there are 44 range-restricted species that are associated with the open plains of the Karoo. These are
mainly succulent plants from the families Aizoaceae (Vygies especially small succulents within the
genera Aloinopsis, Cylindrophyllum, Peersia, Deilanthe, Stomatium and Pleiospilos); Euphorbiaceae
a
b
c
d

CHAPTER 7: BIODIVERSITY AND ECOLOGICAL IMPACTS
Page 7-16
Where in the Karoo Landscape is Plant Diversity?
In order to understand the potential impact of SGD on the Karoo, it is useful to know the distribution of plant diversity among the different landforms of the Karoo as these will not be equally impacted by SGD. It can be anticipated that SGD will have a disproportionate impact on the plains and relatively low-slope hills and less impact on rocky outcrops and mountains, especially where these are dolerite in origin. A number of studies provide some insight in this regard. Burke et al. (2003) found that species richness of mesas was not significantly higher than the plains near Middelburg, but that the proportion of species shared between plains and mesas declined with increasing size of the mesas. Cowling et al. (1994) compared species richness at paired sites on plains and rocky hills across the Karoo and found that the rocky hills had significantly higher species richness than the adjacent plains. Todd (2003) conducted a detailed vegetation study near Beaufort West and compared species richness within five different habitats and found that calcrete and sandy plains had significantly lower species richness than dolerite hills, shale gravel hills and drainage lines (Figure 7.2). In terms of the proportion of species shared between the different habitats, approximately 25% of the species found on the rocky hills are unique and not found elsewhere, while less than 2% of the species on the calcrete plains are unique to this habitat. The overall implication of these different studies is that development on the open plains would have less impact on plant diversity than development within other habitats. Although there is little supporting data, it is also likely that turnover (β-diversity) across the rocky hills is greater than on the plains (Figure 7.3).
Figure 7.2: Mean species richness with standard deviation bars within five habitats within the Karoo near to Beaufort West (from Todd, 2003).
0
10
20
30
40
50
60
70
80
90
Dolerite Hills Sandy Plains Weathered ShaleGravel
Calcrete Plains Drainage Lines
Spec
ies R
ichn
ess
(Euphorbias) and Apocynaceae (Stapeliads especially in the genera Orbea, Piaranthus, Duvalia and
Hoodia). Although some of these occur on dolerite outcrops, where they are less likely to be
impacted, 25 species are reportedly restricted to clay and gravel flats where they would be highly
vulnerable to the impacts of SGD (see text box below). It is worth pointing out that information on
many plant species is lacking due to the poor historical sampling of the area.

CHAPTER 7: BIODIVERSITY AND ECOLOGICAL IMPACTS
Page 7-17
Figure 7.3: Although there are some plant species of conservation concern that are restricted to the plains, the majority of range-restricted endemic plant species are associated with mountains and rocky hills of the Karoo.
This may limit the potential impact of SGD on plant species of conservation concern. .
7.1.3.3 Terrestrial fauna
The vertebrates of the Karoo are well adapted to the unpredictability of the system through a range of
physiological and behavioural traits. Many larger mammal species have extensive home ranges and
occur at a low density across broad areas. For such species, mobility and the ability to move about the
landscape is a key adaptation allowing them to persist in an arid landscape.
The majority of mammals in the Karoo are species with a widespread distribution that originate in the
Savanna and Grassland biomes. The MammalMap database3 lists approximately 177 indigenous
species for the study area of which at least 11 are confined to protected areas where they are
conservation dependent and cannot be considered free-ranging. Widespread species which occur in
the study area and which are of conservation concern include three species categorised as Vulnerable
on the International Union for Conservation of Nature (IUCN) Red List; Leopard, Panthera pardus,
Black-footed Cat, Felis nigripes, and White-tailed Mouse, Mystromys albicaudatus, and the Critically
Endangered Riverine Rabbit, Bunolagus monticularis. Impacts are likely to be most serious for
3 MammalMap database available at: http://vmus.adu.org.za/
CHAPTER 7: BIODIVERSITY AND ECOLOGICAL IMPACTS
Page 7-18
species that are endemic or near endemic to the study area, which include Grant’s Rock Mouse,
Micaelamys granti, the Riverine Rabbit, a subspecies of Sclater’s Golden Mole, Chlorotalpa sclateri
shortridgei, and the recently described Karoo Rock Sengi, Elephantulus pilicaudus. Of these the most
critical species is the Riverine Rabbit which is recognised as one of the most threatened terrestrial
mammals in southern Africa and is strongly associated with riparian habitat adjacent to seasonally dry
river systems. Two-thirds of its habitat has been fragmented or destroyed in the past 50 years by
human activity. The alluvial soil terraces along seasonal rivers typically support halophytic shrublands
that are essential for Riverine Rabbit forage and cover. The Riverine Rabbit functions as an indicator
species of the condition of river ecosystems, specifically riparian habitat, in the Karoo and its local
extinction in many areas is indicative of degradation, fragmentation and loss of the valuable riparian
vegetation cover caused by over-utilisation and cultivation. Populations become isolated where
riverbanks and floodplains have been transformed for cultivation of crops or other development. Such
isolated populations are less able to persist over the long-term and more vulnerable to local extinction.
Some mammals such as aardvark and porcupine are considered especially important due to the
ecological impact that they have, especially with regard to the diggings they create when foraging,
which creates soil disturbances that are important for plant establishment and the maintenance of
diversity (Bragg et al., 2005). In addition, the burrows they dig are important for other fauna as they
are used by many other animals which do not usually dig their own burrows but use or modify
aardvark or porcupine burrows. Both porcupine and aardvark are considered vulnerable to impact
from SGD, due to poaching, traffic collisions and in the case of aardvark disturbance and noise as
well. These are useful species for monitoring as they are widespread, have broad habitat requirements,
are good indicators of ecological condition, and are vulnerable to impact.
In terms of reptiles, the Karoo is relatively diverse and 35 snake, 49 lizard (including 15 gecko and
two chameleon) and five tortoise and terrapin species have been recorded from the study area. One
tortoise species, the Karoo Padloper, Homopus boulengeri, and two subspecies of the Tent Tortoise,
Psammobates tentorius, are largely restricted to the Karoo and the Karoo Padloper is listed as Near
Threatened. The Plain Mountain Adder, Bitis inornata, which is restricted to the Nuweveldberge, is
the only snake species that is endemic to the study area and it is categorised as Endangered. The
degree of endemism is low for the lizards and most species derive from the Succulent Karoo or
Savanna. Three lizard species, however, are largely restricted to the Nuweveldberg area of the Karoo;
Braack’s Pygmy Gecko, Goggia braacki, Cloete's Girdled Lizard, Cordylus cloetei, and the Crag
Lizard, Pseudocordylus microlepidotus namaquensis. Three other lizard species, the Dwarf Karoo
Girdled Lizard, Cordylus aridus, the Karoo Flat Gecko, Afroedura karroica, and Thin-skinned Gecko
Pachydactylus kladaroderma have much of their distribution in the Karoo.
CHAPTER 7: BIODIVERSITY AND ECOLOGICAL IMPACTS
Page 7-19
Several terrestrial invertebrate groups include species with narrow ranges, but there is insufficient
data to be able to identify endemics with any certainty, and the threat status of most invertebrate
groups has not been assessed according to the IUCN criteria. Butterflies are an exception, with good
data and a recent conservation assessment (Mecenero et al., 2013). Nineteen species or subspecies
recorded from the area have more than 60% of their distribution in the study area, and four of these
are wholly endemic to the area (Aloeides pringlei, Lepidochrysops victori, Thestor compassbergae, T.
camdeboo and Cassionympha camdeboo). Lepidochrysops victori is categorised as Vulnerable, and is
only known from montane grassland in the foothills of the Great Winterberg. Eight terrestrial mollusc
species are endemic to the study area and several of these species are restricted crevices in rocky areas
where there is some moisture (Digital Addendum 7A). Three Orthoptera (grasshopper/katydid)
species are only known from the study area (Digital Addendum 7A), and it is likely that there are
many other endemic invertebrates as well.
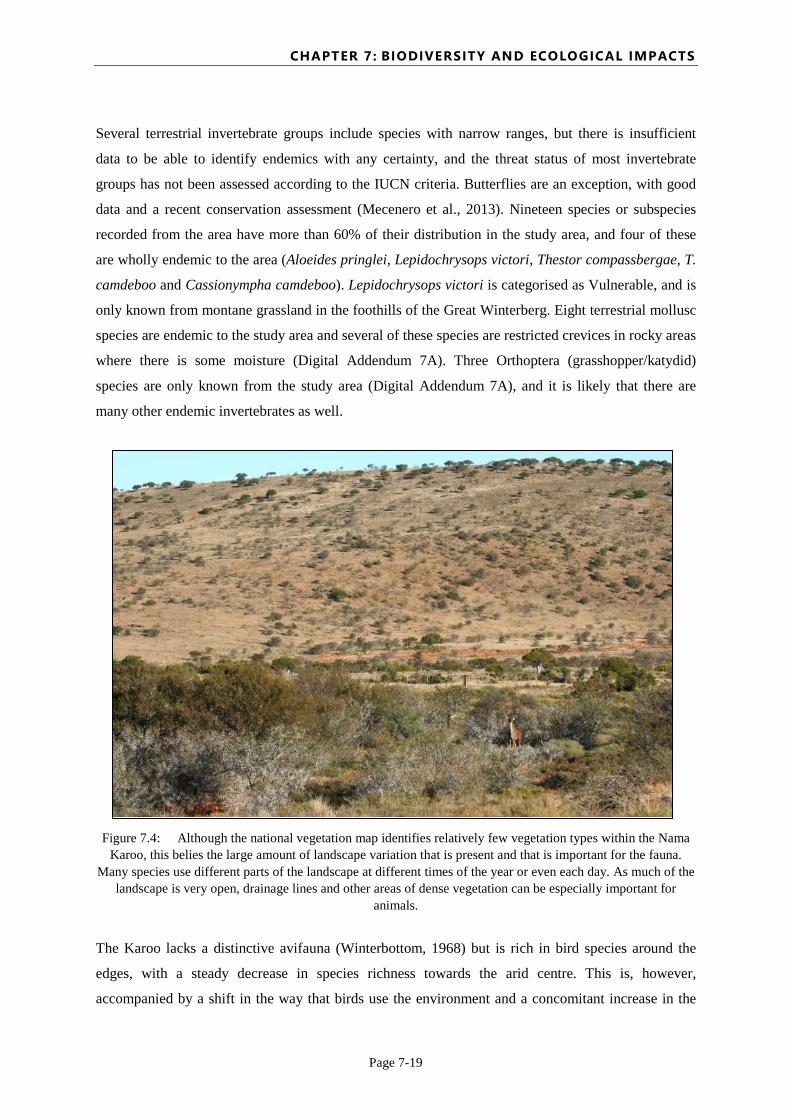
Figure 7.4: Although the national vegetation map identifies relatively few vegetation types within the Nama Karoo, this belies the large amount of landscape variation that is present and that is important for the fauna.
Many species use different parts of the landscape at different times of the year or even each day. As much of the landscape is very open, drainage lines and other areas of dense vegetation can be especially important for
animals.
The Karoo lacks a distinctive avifauna (Winterbottom, 1968) but is rich in bird species around the
edges, with a steady decrease in species richness towards the arid centre. This is, however,
accompanied by a shift in the way that birds use the environment and a concomitant increase in the

CHAPTER 7: BIODIVERSITY AND ECOLOGICAL IMPACTS
Page 7-20
number of nomadic species, with a trend towards high temporal variability in the density of
individuals of resident species (Dean, 1995). There are no families of birds endemic to the Karoo, but
members of the Alaudidae, Cisticolidae, Sylviidae, Muscicapidae and Fringillidae are well
represented. Very few species of birds in the Karoo are considered to be rare throughout most of their
geographic ranges. Most species that are rare in the Succulent and Nama Karoo are common in
substantial parts of their geographic ranges elsewhere. At least ten species that have been recorded in
the study area were categorised as Threatened in the latest national assessment (Taylor et al., 2015)
(Digital Addendum 7A).
There is very little hard data on the impacts of SGD on birds from anywhere in the world, apart from a
recent study in the Appalachian forest (Farwell et al., 2016). Almost all written information on the
impacts on birds lack publication in peer reviewed journals, and whatever has been posted on various
internet sites refers almost entirely to the situation in relatively well-watered sites. However, based on
responses of avifauna to disturbance in general, a number of conclusions regarding the likely impacts
of SGD on avifauna can be reached.
The density of birds in the Karoo is unusually low compared with other biomes. There are no data
available for most of the Nama Karoo, but an estimated density, calculated from counts along
transects, suggests that there are 32 individual birds /km² in plains shrubland on the southern edge of
the Nama Karoo (Dean & Milton, 2001). The following density data are available for 3 common and
widespread Karoo species that make up most of the local community at Tierberg near Prince Albert:
Karoo Long-billed Lark, Certhilauda subcoronata (ca 6 birds/km²), Karoo Chat, Cercomela schlegelii
(ca 10 birds/km²) and Rufous-eared Warbler, Malcorus pectoralis, (ca 10 birds/km). All three of these
species are territorial to some extent; all avoid settlements, even small settlements such as would be
represented by shale gas wellpads. In addition, habitat loss for such species is not equivalent to the
wellpad footprint, as birds may avoid areas as much as 200 m from settlements. Under the Big Gas
scenario, this would result in habitat loss at the landscape scale of as much as 15%, from wellpads
alone. Taking additional habitat loss and disturbance along roads into account, it is not unreasonable
to expect declines of as much as 20% in the abundance of the above species.
A major impact on bird populations and local communities is likely to be through increased vehicular
traffic. A large number of species of mammals, birds and reptiles are killed, both diurnally and
nocturnally, on the roads in the Karoo (Siegfried, 1965), providing food for a number of scavenging
birds, including raptors and crows (Collinson et al., 2015; Dean & Milton, 2003; Dean et al., 2006;
Macdonald & Macdonald, 1985; Malan, 1992; Schmitt et al., 1987; Steyn, 1982; Winterbottom, 1975)
and even small species such as the Fiscal Shrike, Lanius collaris, (pers. obs.). Birds (and other

CHAPTER 7: BIODIVERSITY AND ECOLOGICAL IMPACTS
Page 7-21
animals) eating road kills, and foraging on roads, are vulnerable to themselves becoming roadkill
(Collinson et al., 2015); both raptors and crows have been recorded killed on roads (Dean & Milton,
2003).
Adaptable bird species such as crows may increase in response to human activity, which can have
negative effects on other biota. Crows attracted to roads by the availability of road kills are likely to
also forage in the surrounding shrublands, impacting smaller birds and reptiles. The lights at the
wellpads that are on all night will attract insects, and therefore will attract nightjars, some of which
may settle on roads near the wellpads and get killed on the road. Spotted Thick-knees (Dikkops),
Burhinus capensis, are active in the evenings and sometimes into the night; this species is frequently
killed on roads.
Another hazard to birds is likely to be posed by the water produced from shale gas drilling operations.
In fact, for many birds, this may be the major hazard connected with well sites, and is the most
documented aspect of the problems associated with gas and oil wells. Pits or sludge dams constructed
near well sites to hold produced water may be lethal to birds. Open water is a limited resource in the
Karoo, but a number of nomadic bird species utilise ephemeral ponds for foraging and breeding.
While it is not likely that birds would use ponds immediately adjacent to active drilling activities on
wellpads, there may be negative impacts from spills and there is also the possibility that ponds are left
in place during the production phase when disturbance would be lower and at such time there would
be a strong possibility that birds will land on the water, and species such as swifts and swallows (and
bats), that drink on the wing by flying across ponds, will attempt to land or to drink. The use of
mechanical birds (that look like raptors) perched on the fence surrounding the ponds may be effective
deterrents. Recommendations for “reserve pits” to hold produced water include fencing to keep out
walking animals and netting over the pits to keep out flying animals (Ramirez, 2009).
Flares to burn off excess gas may be another hazard for birds that has not been quantified. Many bird
species migrate and fly through the night to reach their wintering or summering grounds. It is known
that migrant birds flying at night are attracted to lights and may inadvertently stray into the flares.
This hazard cannot be easily mitigated, but its prevalence would depend on the extent of flaring.
Of interest and potential conservation concern in the Karoo are relic species and habitats that are
indicative of a wetter past. These are concentrated along the Great Escarpment and are best
exemplified by the various freshwater molluscs that occur in these areas as well as the presence of Ice
Rats, Myotomys sloggetti, on the highest peaks of the Nuweveldberge, and the presence of an isolated,
CHAPTER 7: BIODIVERSITY AND ECOLOGICAL IMPACTS
Page 7-22
potentially new species of ancient Velvet Worm (Onychophora) in the Graaff-Reinet area (Daniels et
al., 2016).
7.1.3.4 Aquatic ecosystems and species
The Karoo landscape is heavily influenced by the occurrence of dolerite dykes, sills and rings (see
Burns et al. (2016) for a description of these geological features), which control surface and
subsurface drainage patterns and the occurrence of watercourses and wetlands (Woodford &
Chevalier, 2001; Gibson, 2003) (see Hobbs et al. (2016) for definitions of aquatic ecosystems). The
low rainfall across the study area means that evaporation is the dominant component of the water
balance (Allan et al., 1995), and while rainfall drives the inundation periodicity of the aquatic
ecosystems in the area, surface–groundwater interactions are thought to be important for sustaining
them. Most of the surface water ecosystems in the study area are thus intermittent or ephemeral, being
inundated only for brief periods each year, with periods of drought that are predictable in frequency
but unpredictable in duration.
The less common but more perennial springs and seeps associated with Karoo dolerite dykes and sills
occur on peaty soils typically at the base of dolerite cliffs or on dolerite slopes, in depressions along
fractures or topographical breaks, and are fed by groundwater seeping from deep, fractured aquifers,
or even from unconfined alluvial aquifers (Nhleko, 2003). These aquatic ecosystems are one of five
types of aquifer-dependent ecosystems (ADEs) recognised in South Africa (Chevalier et al., 2004;
Colvin et al., 2007).
The ephemeral rivers of the Karoo are highly dependent on groundwater discharge, which occurs at
springs and when groundwater recharge (through precipitation at higher elevations) allows the water
table to intersect with the river channel. The upper reaches of the Salt River (Beaufort West), the
Kamdeboo, Sundays and Brak Rivers (De Aar) are all good examples of these groundwater-fed
watercourses.
Ephemeral rivers are particularly vulnerable to changes in hydrology, as they are specifically adapted
to brief periods of inundation and flow (Figure 7.5). Consequently, pollutants and sediments entering
these watercourses are not regularly diluted or flushed out of the catchment, leading to a lack of
resilience to pollution, erosion and sedimentation (Figure 7.6). The same can be said of ephemeral or
seasonal wetlands, which make up the majority of the lentic systems located in the study area. Many
of these wetlands – predominantly depressions or pans – are endorheic, i.e. isolated from other surface
water ecosystems, usually with inflowing surface water but no outflow.
CHAPTER 7: BIODIVERSITY AND ECOLOGICAL IMPACTS
Page 7-23
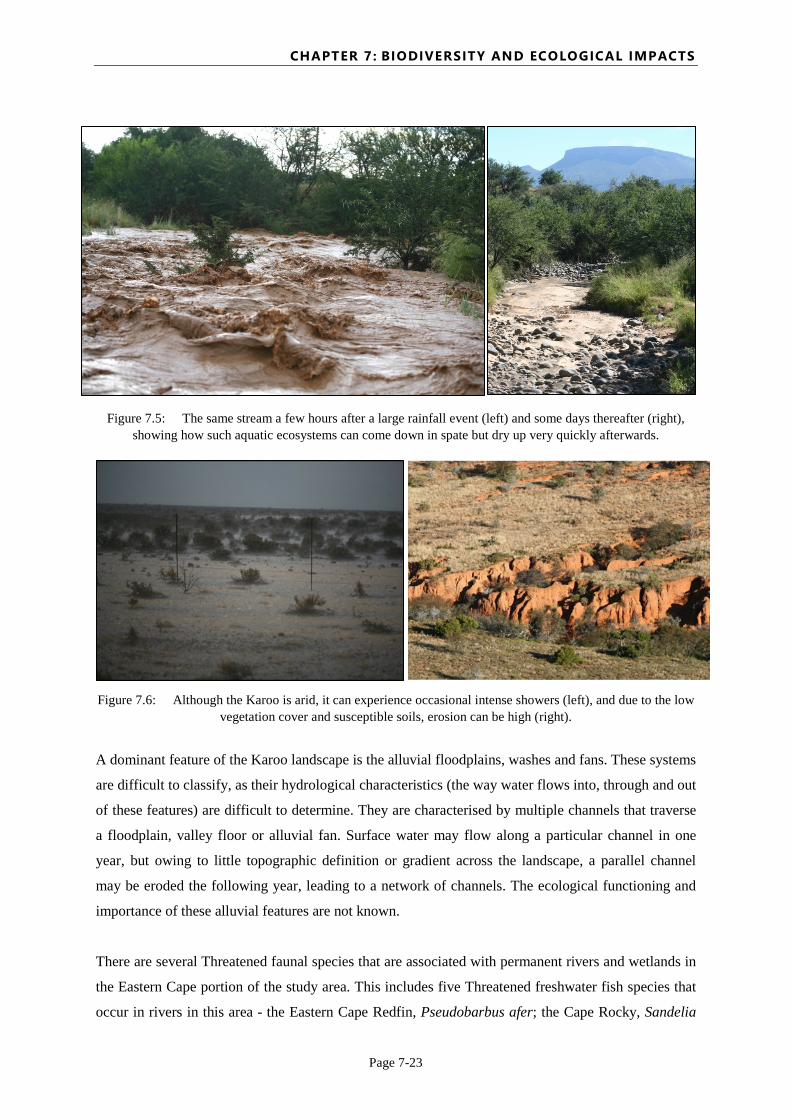
Figure 7.5: The same stream a few hours after a large rainfall event (left) and some days thereafter (right), showing how such aquatic ecosystems can come down in spate but dry up very quickly afterwards.
Figure 7.6: Although the Karoo is arid, it can experience occasional intense showers (left), and due to the low
vegetation cover and susceptible soils, erosion can be high (right).
A dominant feature of the Karoo landscape is the alluvial floodplains, washes and fans. These systems
are difficult to classify, as their hydrological characteristics (the way water flows into, through and out
of these features) are difficult to determine. They are characterised by multiple channels that traverse
a floodplain, valley floor or alluvial fan. Surface water may flow along a particular channel in one
year, but owing to little topographic definition or gradient across the landscape, a parallel channel
may be eroded the following year, leading to a network of channels. The ecological functioning and
importance of these alluvial features are not known.
There are several Threatened faunal species that are associated with permanent rivers and wetlands in
the Eastern Cape portion of the study area. This includes five Threatened freshwater fish species that
occur in rivers in this area - the Eastern Cape Redfin, Pseudobarbus afer; the Cape Rocky, Sandelia

CHAPTER 7: BIODIVERSITY AND ECOLOGICAL IMPACTS
Page 7-24
bainsii; Barbus trevelyani; Pseudobarbus asper; and the Amatola Barb, Barbus amatolicus. Two
Threatened damselfly species, the Kubusi stream-damsel, Metacnemis valida, and the Basking
Malachite, Chlorolestes apricans, are restricted to rocky, fast-flowing streams in the more
mountainous part of the Eastern Cape. Twenty-six frog species have been recorded from the study
area out of a total of 123 species in South Africa. This is a relatively high diversity given the aridity of
much of the area and paucity of perennial water. The only frog species which can be considered
endemic to the Karoo is the Karoo Dainty Frog, Cacosternum karooicum.
The fauna of the more seasonal to ephemeral ecosystems is not well known, but they have been found
to provide aquatic habitat to a diverse array of faunal species that depend on brief periods of
inundation for hatching, mating, feeding and refuge (Anderson, 2000; Hamer & Rayner, 1996; Minter
et al., 2004). For instance, many frogs of the Karoo region breed in temporary pools associated with
watercourses and wetlands, this includes the Karoo Toad, Vandijkophrynus gariepensis, and Karoo
Dainty Frog, Cacosternum karooicum. A great number of other organisms are not confined to these
temporary systems, but derive crucial benefits from them, like migratory birds and many invertebrates
that migrate from permanent to temporary habitats on a regular basis. Connectivity between aquatic
ecosystems, and between aquatic ecosystems and the surrounding terrestrial landscape, is essential for
supporting the fauna of the region, including their need to feed, breed and migrate.
Very little is known of the invertebrate fauna of the watercourses and wetlands of the Karoo region.
Given the constant shift from aquatic to dry phases, ephemeral ecosystems support unique, well-
adapted biotic communities with species that show rapid hatching, fast development, high fecundity,
and short life spans. Organisms that inhabit these ecosystems rely on the production of desiccation-
resistant or dormant propagules (such as eggs, cysts, seeds, spores) to survive the dry period, and then
become active again when the wetland is inundated. The eggs of these organisms can survive in the
sediments for many years, and rapidly hatch when sufficient rain falls. Many taxa will reproduce
asexually several times during the wet season.
The ephemeral pans and rock pools in the Karoo are inhabited by branchiopod crustaceans, commonly
known as fairy shrimps (Anostraca), tadpole shrimps (Notostraca), clam shrimps (Spinicaudata and
Laevicaudata), and water fleas (Cladocera), and also the ostracods or seed shrimps (Lloyd & Le Roux,
1985; and Musa Mlambo, Albany Museum, pers. comm., January 2016). There are several taxa that
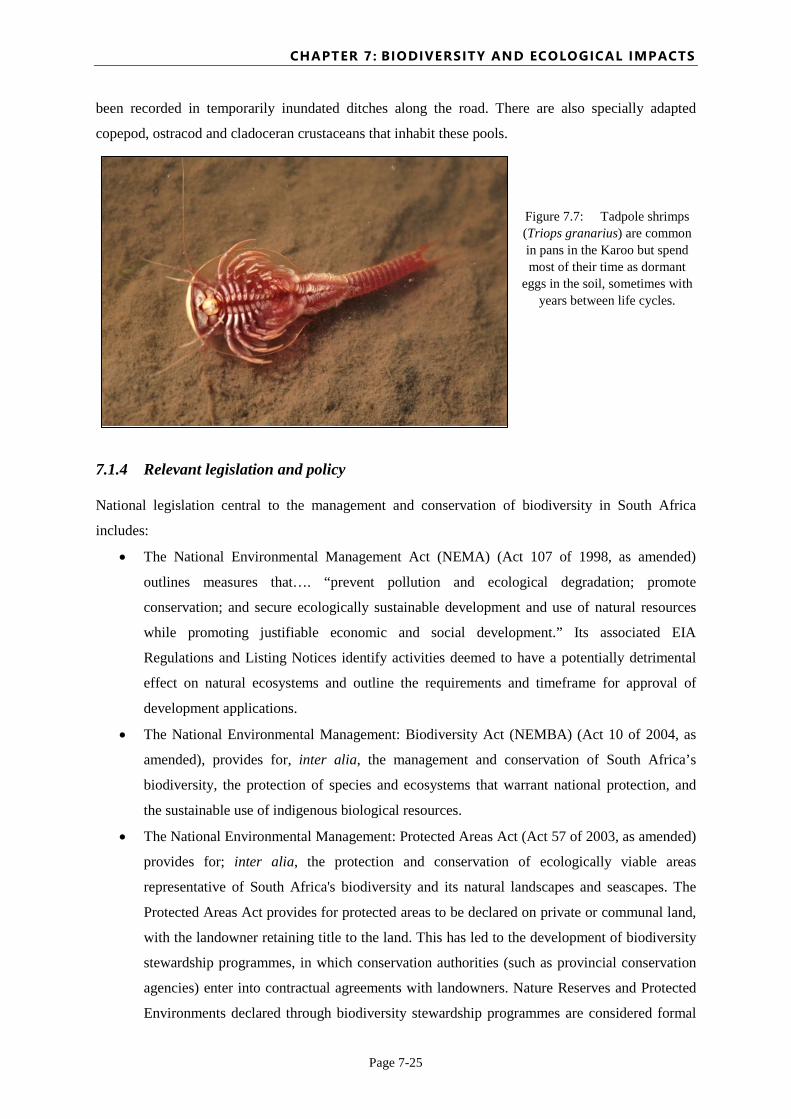
are completely dependent on ephemeral wetlands to complete their life cycle. For example, the
tadpole shrimp, Triops granarius, is reportedly common where mean inundation is less than one
month; this invertebrate reaches sexual maturity within days (Figure 7.7). Two fairy shrimp species
have only been recorded from the study area – Branchipodopsis browni and B. hutchinsoni; both have
CHAPTER 7: BIODIVERSITY AND ECOLOGICAL IMPACTS
Page 7-25
been recorded in temporarily inundated ditches along the road. There are also specially adapted
copepod, ostracod and cladoceran crustaceans that inhabit these pools.
Figure 7.7: Tadpole shrimps (Triops granarius) are common in pans in the Karoo but spend most of their time as dormant
eggs in the soil, sometimes with years between life cycles.
7.1.4 Relevant legislation and policy
National legislation central to the management and conservation of biodiversity in South Africa
includes:
• The National Environmental Management Act (NEMA) (Act 107 of 1998, as amended)
outlines measures that…. “prevent pollution and ecological degradation; promote
conservation; and secure ecologically sustainable development and use of natural resources
while promoting justifiable economic and social development.” Its associated EIA
Regulations and Listing Notices identify activities deemed to have a potentially detrimental
effect on natural ecosystems and outline the requirements and timeframe for approval of
development applications.
• The National Environmental Management: Biodiversity Act (NEMBA) (Act 10 of 2004, as
amended), provides for, inter alia, the management and conservation of South Africa’s
biodiversity, the protection of species and ecosystems that warrant national protection, and
the sustainable use of indigenous biological resources.
• The National Environmental Management: Protected Areas Act (Act 57 of 2003, as amended)
provides for; inter alia, the protection and conservation of ecologically viable areas
representative of South Africa's biodiversity and its natural landscapes and seascapes. The
Protected Areas Act provides for protected areas to be declared on private or communal land,
with the landowner retaining title to the land. This has led to the development of biodiversity
stewardship programmes, in which conservation authorities (such as provincial conservation
agencies) enter into contractual agreements with landowners. Nature Reserves and Protected
Environments declared through biodiversity stewardship programmes are considered formal

CHAPTER 7: BIODIVERSITY AND ECOLOGICAL IMPACTS
Page 7-26
protected areas, and are collectively referred to as contract protected areas (distinguished from
state-owned protected areas).
• The National Water Act (NWA) (Act 36 of 1998) addresses, inter alia, the “protection of the
aquatic and associated ecosystems and their biological diversity”. The Act regulates all water
uses, some of which are non-consumptive but which may impact on the integrity, functioning
and biodiversity of wetlands and watercourses. The process to be followed to obtain
authorisation for these categories of water use relate to the risk associated with the water use,
where authorisation of low risk activities is a simpler, faster process than for full Water Use
Licence Application (WULA). Generally, non-consumptive water uses that impact directly on
a wetland, or which occur within 500 m of a wetland or within the outer edge of the 1 in 100
year floodline or delineated riparian area of a watercourse are of medium to high risk,
requiring a full WULA.
• The Mineral and Petroleum Resources Development Act (MPRDA) (Act 28 of 2002) and its
associated regulations provide for the protection of water resources, and stipulate required
setbacks from wells, in order to protect the integrity of watercourses and wetlands. Section 49
of the MPRDA provides a mechanism for excluding mining from certain areas.
In addition to legislation, several national strategies and plans are central to the management and
conservation of biodiversity in South Africa:
• As a contracting party to the Convention on Biological Diversity (CBD), South Africa is
obliged to develop a National Biodiversity Strategy and Action Plan (NBSAP). Strategic
objectives of the recently revised NBSAP for 2015 to 2025 (Department of Environmental
Affairs (DEA), 2015a) include that the management of biodiversity assets and their
contribution to the economy, rural development, job creation and social wellbeing is
enhanced, and that investments in ecological infrastructure enhance resilience and ensure
benefits to society.
• Spatial assessment and prioritisation of biodiversity based on the principles of systematic
biodiversity planning is strongly embedded in the policy and practice of the biodiversity
sector in South Africa, for example through the National Biodiversity Assessment (NBA)
(Driver et al., 2012), the National Protected Area Expansion Strategy (NPAES) (Government
of South Africa, 2010), the Atlas of Freshwater Ecosystem Priority Areas of South Africa
(FEPA) (Nel et al., 2011), and provincial spatial biodiversity plans. These principles include
the need to conserve a viable representative sample of all ecosystems and species, as well as
the ecological and evolutionary processes that allow biodiversity to persist over time.

CHAPTER 7: BIODIVERSITY AND ECOLOGICAL IMPACTS
Page 7-27
At the provincial level, provincial environmental affairs departments are often the authority for
permitting or authorising for a range of activities, and they provide comments on mining-related
authorisations. Provincial spatial biodiversity plans identify Critical Biodiversity Areas (CBAs) and
Ecological Support Areas (ESAs) which guide such authorisations and comments.
7.2 Key potential impacts and their mitigation
This section identifies and describes potential impacts of SGD on the study area, and recommends
mitigation measures based on the ecology and biodiversity of the area. The mitigation measures are
structured according to the mitigation hierarchy that is widely applied in EIAs – avoid, minimise,
rehabilitate, offset.
Because of the potential cumulative landscape-scale impacts of SGD, the mitigation hierarchy should
be applied not only at the site level in EIAs, but also at a strategic landscape level. A framework for
application of the mitigation hierarchy at the landscape level is set out in Section 7.2.1 (Table 7.2),
followed by more detailed discussion of mitigation measures for specific activities related to SGD in
Section 7.2.2 (Table 7.3). Cumulative impacts are discussed further in Section 7.2.3, and gaps in
capacity for implementing mitigation measures at both the landscape level and site level are outlined
briefly in Section 7.2.4.
As discussed in Section 7.1.3, rehabilitation efforts in the Karoo environment are often met with poor
success, and disturbance can persist for decades or even centuries. This means that the preferred
mitigation measures in this environment are to avoid or minimise impacts, whether at the landscape
level or the site level. In cases where rehabilitation measures are recommended, they are generally
aimed at restoring basic ecological functioning rather than at restoring species composition. In cases
where residual impacts (after avoiding and minimising) need to be offset, ecologically equivalent sites
must be identified and secured. An ecologically equivalent site means a site that contains equivalent
ecological processes, ecosystems and species, and that compensates for the full ecological impact of
the activity as identified through a detailed study.
7.2.1 Strategic approach to mitigation at the landscape level
The table below sets out a framework for mitigation at the landscape level. It is underpinned by the
spatial analysis that identified areas of EBIS in the study area, from EBIS-1 (highest) to EBIS-4
(lowest), as described in Section 7.3.1. Protected areas, EBIS-1 areas and EBIS-2 areas collectively
meet targets for representation of biodiversity and maintenance of ecological processes in the study
area, in a spatial configuration designed to ensure connectivity in the landscape.

CHAPTER 7: BIODIVERSITY AND ECOLOGICAL IMPACTS
Page 7-28
The primary mitigation for SGD in the Karoo as a whole is securing the EBIS-1 and EBIS-2 areas;
which effectively make EBIS-3 and EBIS-4 areas available for SGD. EBIS-1 and EBIS-2 areas should
be secured through legal mechanisms that limit loss and degradation of habitat, such as:
• Establishing or expanding a state-owned protected area;
• Establishing a contract protected area, for example through legally binding biodiversity
stewardship agreements (this could be either a contract Nature Reserve or a contract Protected
Environment, in which landowners enter into a long-term contractual agreement with a
conservation authority);
• Establishing a lower tier biodiversity stewardship agreement (for example, a Biodiversity
Management Agreement or Biodiversity Partnership Area);
• Zoning the land as an appropriate zone (e.g. conservation) in a municipal Land Use Scheme;
• Protection under Section 49 of the MPRDA.
Securing EBIS-1 and EBIS-2 areas may lend itself to a fast-tracked, integrated programme to expand
the protected area network, which takes a strategic approach rather than an ad hoc piecemeal
approach, similar to Operation Phakisa in the marine environment. Biodiversity offsets can also play
an important role in securing EBIS-1 and EBIS-2 areas as protected areas; EBIS-1 and EBIS-2 areas
are first-tier and second-tier receiving areas respectively for biodiversity offsets.
In addition to securing EBIS-1 and EBIS-2 areas, it is critical that an effective set of operating rules is
established for all areas to ensure that overall impacts on the landscape in general, and impacts on
EBIS-1 and EBIS-2 areas in particular, are kept within acceptable limits. Subject to reasonable on-site
operating rules to reduce unnecessary impacts, and careful minimisation of any broader impacts on
adjacent EBIS-1 and EBIS-2 areas, biodiversity loss within EBIS-3 areas could be absorbed without
compromising the overall function and integrity of the Karoo ecosystem as a whole. Impacts restricted
to EBIS-4 areas are unlikely to be of ecological significance.

CHAPTER 7: BIODIVERSITY AND ECOLOGICAL IMPACTS
Page 7-29
Table 7.2: Strategic application of the mitigation hierarchy at the landscape level, based on the map of EBIS.
Ecological and Biodiversity Importance and Sensitivity (EBIS)
Primary focus of mitigation, based on the mitigation hierarchy
Protected areas AVOID
• These areas are legally protected in terms of the Protected Areas Act.
EBIS-1 (highest)
AVOID
• EBIS-1 areas contain extremely sensitive features and are irreplaceable. Because they are irreplaceable, it is not possible to minimise or offset impacts of SGD activities in these areas.
• SDG activities must always be avoided in these areas. • Ideally these areas should be secured through legal mechanisms that
limit habitat loss and degradation. • These are first-tier receiving areas for biodiversity offsets.
EBIS-2
Best option: AVOID Otherwise: MINIMISE AND OFFSET RESIDUAL IMPACTS
• EBIS-2 areas contain highly sensitive features and features that are important for representation of biodiversity and/or maintaining ecological processes.
• Ideally they should be secured through legal mechanisms that limit habitat loss and degradation.
• If they cannot be avoided, then ecologically equivalent sites must be secured through biodiversity offsets.
• These are second-tier receiving areas for biodiversity offsets.
For shale gas exploration in EBIS-2 areas, it may be possible to minimise impacts sufficiently at the site level to achieve no loss or degradation of habitat i.e. no residual impacts. In such cases, an offset will not be required.
For shale gas production in EBIS-2 areas, impacts of production cannot be effectively mitigated on-site or at the operational level: There will always be residual impacts that must be offset.
EBIS-3 MINIMISE
• EBIS-3 areas are natural areas that do not contain currently known sensitive or important features.
• Environmental compliance is required. This includes specialist-led assessment of local sensitivities and identification of appropriate mitigation.
• From a biodiversity and ecological perspective, SGD activities need not be avoided in these areas IF there is no loss or degradation of EBIS-1 and EBIS-2 areas.
• These are third-tier receiving areas for biodiversity offsets. EBIS-4 (lowest) MINIMISE
• EBIS-4 areas have no remaining natural habitat. • Environmental compliance is required. • From a biodiversity and ecological perspective, there is no need to
avoid SGD in these areas; however, there may well be other reasons to avoid SGD in these areas.

CHAPTER 7: BIODIVERSITY AND ECOLOGICAL IMPACTS
Page 7-30
7.2.2 Activities, impacts and mitigation measures
This section focuses in more detail on mitigation measures for those activities associated with SGD
that are most relevant from a biodiversity and ecological point of view. In the Karoo environment,
where transformation for cropping and other intensive agricultural activities is limited, habitat loss at
a local scale is not usually of high significance (with EBIS-1 areas being a clear exception). As
discussed, a major concern is the cumulative and interactive effect of the activities at the landscape
scale, particularly through activities on the land surface that fragment the landscape, and the resulting
impact on spatially extensive ecological processes. The actual drilling footprint is in general less
significant than the ancillary infrastructure and activity, including roads and vehicular activity.
From a terrestrial ecology perspective, the activities of most concern or relevance are removal of
indigenous vegetation and destruction of natural habitat; construction and maintenance of roads,
wellpads and other physical infrastructure; off-road driving; vehicular traffic on roads; and activities
linked to ongoing operation, including human activities such as collection of species of special
interest, disturbance such as light and noise, and industrial accidents. From an aquatic ecological
perspective, the activities of most concern or relevance are waste water management; water extraction
and use; destruction of natural habitat in riparian areas and wetlands; construction and maintenance of
roads that traverse watercourses or wetlands; and off-road driving through watercourses and wetlands.
Table 7.3 sets out activities and their associated impacts, as well as potential mitigation measures
structured according to the mitigation hierarchy (avoid, minimise, rehabilitate, offset). Some impacts
are closely tied to the location and layout of activities. In many cases, careful planning of the siting
and layout of activities away from EBIS-1 and EBIS-2 areas can substantially avoid impacts. The map
of EBIS (see Section 7.3.1) should be used to inform the siting of activities. Others impacts are linked
to the carrying out of ongoing activities as part of operations.

CHAPTER 7: BIODIVERSITY AND ECOLOGICAL IMPACTS
Page 7-31
Table 7.3: Activities, impacts and mitigation measures.
Activity Description Mitigation measures
Exploration Exploration will generate physical disturbance as well as above and below ground noise. Although the noise will be short-lived and probably not of long-term consequence, off-road driving in unsuitable conditions can cause long-term impacts. • Driving of heavy vehicles even once over wet clay floodplain
areas can have major impact as these areas are highly sensitive to change. The whole ecology of the system is dependent on water spreading out over vast flat areas during rainfall events. Tracks left by vehicles after driving over the soil surface when it is wet can cause significant changes in water run-off patterns and will remain in the landscape for decades.
• Many different subterranean animals, including golden moles, use soil vibrations to find prey and the loud noises generated by seismic exploration may have a significant impact on such species, but this is not well known and the severity or extent of this problem should be investigated.
• Although the footprint of exploration is likely to be relatively limited, it may cover a large area.
Avoid - No driving off-road for prospecting when there are wet soil conditions. - No exploration within sensitive habitats such as wetlands, quartz patches, and
rack pavements. Minimise
- Minimise disturbance footprints.
Rehabilitate
- Rehabilitation of disturbed areas on steep slopes and other sensitive areas required.
Vegetation clearing, destruction or other loss of intact vegetation
Vegetation clearing for roads, wellpads, pipeline routes and other infrastructure. This can lead, inter alia, to the following impacts: • Fragmentation of natural habitat, resulting in loss of
connectivity in the landscape. This impact extends far beyond the footprint of the cleared areas themselves, and may impact on all ecological processes in the Karoo. It includes fragmentation of aquatic habitat within wetlands and watercourses.
• Altered surface water flow patterns, e.g. changing sheet flow to concentrated flows, which leads to erosion, altered flow regimes and changes in water availability. Driving on wet clay forms ruts that later develop into dongas or holes too deep for vegetation establishment.
Avoid - Design and layout of infrastructure to avoid restricted habitats and high
sensitivity areas. - No wellpads within EBIS-1 and EBIS-2 areas, unless an offset has been
implemented. - No land application of waste fluids. - No injection/disposal wells. - No direct discharge of waste water to wetlands and watercourses.
Minimise
- All traffic off of public roads should adhere to 40 km/h speed limits or lower. - No off-road driving in wet conditions. In particular, no driving in veld should
take place on clay or fine-textured soils following rain. - Preferably roads should not be fenced off as this increases fragmentation for

CHAPTER 7: BIODIVERSITY AND ECOLOGICAL IMPACTS
Page 7-32
Activity Description Mitigation measures
• Erosion and sedimentation are important ecological processes in the Karoo. Loss and fragmentation of habitat disrupt these processes. Erosion is a particularly high risk on steep slopes, and in drainage lines that lack channel features and are naturally adapted to lower energy runoff with dispersed surface flows (such as unchannelled valley-bottom wetlands), and naturally less turbid freshwater systems.
• Spread of invasive alien species. Altered soil structure, moisture availability and light availability can lead to invasion by weeds and invasive alien plants and animals.
many fauna. - If roads or structures are fenced, use plain strands and not jackal proof fencing
to ensure animals can still move through fences. - Design to use as much common/shared infrastructure as possible with
development in nodes, rather than spread out. - Access routes should use existing roads and tracks before making new roads. - If unavoidable, surface discharge of waste water to the environment must be
monitored to the highest possible water quality standards. - Waste water storage or treatment ponds must be fenced and covered with shade
cloth. Rehabilitate
- All cleared areas that are not being used must be rehabilitated with perennial shrubs from the local environment.
Construction activity and maintenance of roads, wellpads and other physical infrastructure
Construction phase earth moving, construction and the maintenance of roads and other infrastructure will affect runoff amount and quality as well as generate significant amounts of dust. • Dust can have a direct negative impact by covering the
leaves of plants, which affects their growth and reproduction (and wears away the teeth of herbivores such as indigenous antelope and livestock); by degrading the habitat of animals and causing them to move away; and by causing accumulation of sedimentation in adjacent drainage lines which clogs the gills of fish and aquatic invertebrates. This impact can extend quite substantial distances from the construction activity and can last for a long time after the activity is completed.
• Stormwater runoff from roads, buildings, borrow pits and excavation sites may cause erosion and channelling of flow, changes in flow patterns, head-cut and gully erosion, and sedimentation in wetlands and watercourses.
• The disruption of surface drainage patterns where roads are raised above the base level of natural drainage channels or wetlands can cause fragmentation of aquatic ecosystems, and loss of connectivity, and can hamper the movement of aquatic
Avoid - No vehicles, machinery, personnel, construction material, cement, fuel, oil or
waste outside of the demarcated working areas. - No fuel storage, refuelling, vehicle maintenance/washing or vehicle depots
within 50 m of the edge of any wetlands or watercourses. Minimise
- Refuelling and fuel storage areas, and areas used for the servicing, washing or parking of vehicles and machinery located on impervious bases and with bunds around them. Bunds sufficiently high to ensure that all the fuel kept in the area will be captured in the event of a major spillage.
- Use existing bridges for watercourse or wetland crossings wherever possible. - Minimise new crossings over wetlands and watercourses. If wetlands or
watercourses cannot be avoided, ensure that road crossings are constructed using riprap, gabion mattresses, and/or other permeable material to minimise the alteration of surface and sub-surface flow. Drift crossings are preferable to bridge crossings, where feasible.
- Flow of water under roads must be allowed to occur without leading to concentration of surface flow. This can be achieved through designing bridges that span the entire width of aquatic ecosystems where possible, or laying down pipes or culverts to ensure connectivity and avoid fragmentation of surface aquatic ecosystems. Bank stabilisation measures (gabions, eco logs, geofabric,
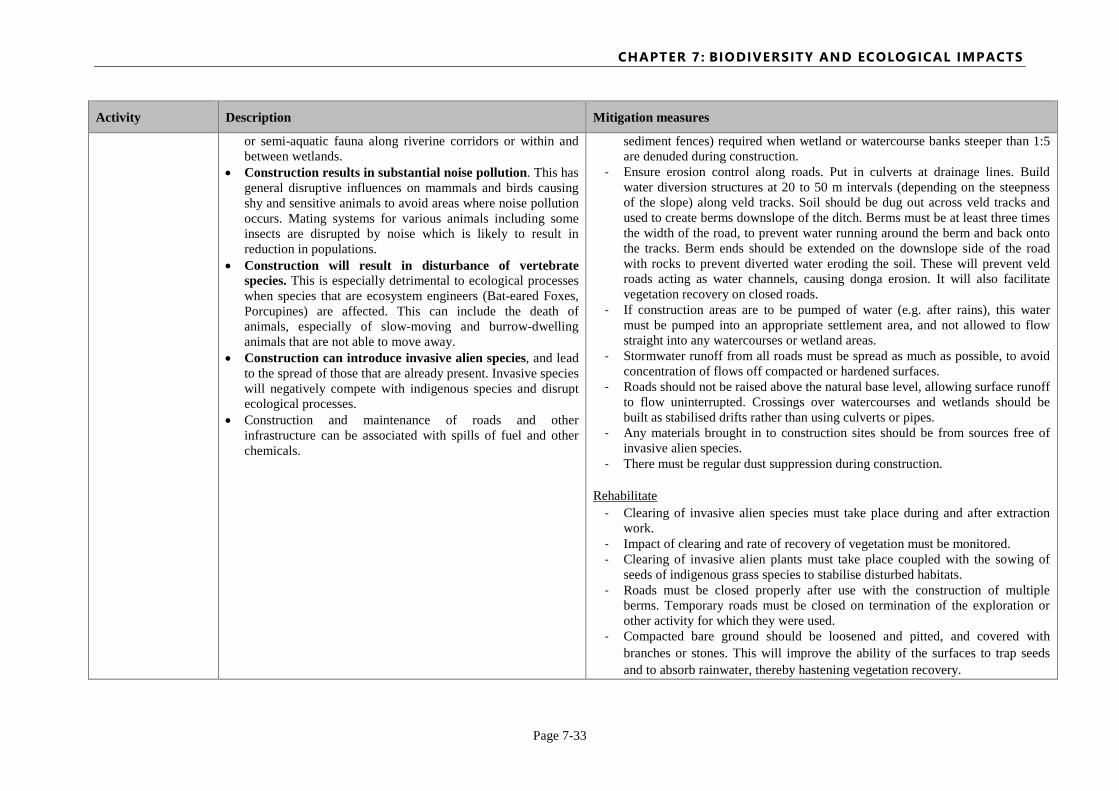
CHAPTER 7: BIODIVERSITY AND ECOLOGICAL IMPACTS
Page 7-33
Activity Description Mitigation measures
or semi-aquatic fauna along riverine corridors or within and between wetlands.
• Construction results in substantial noise pollution. This has general disruptive influences on mammals and birds causing shy and sensitive animals to avoid areas where noise pollution occurs. Mating systems for various animals including some insects are disrupted by noise which is likely to result in reduction in populations.
• Construction will result in disturbance of vertebrate species. This is especially detrimental to ecological processes when species that are ecosystem engineers (Bat-eared Foxes, Porcupines) are affected. This can include the death of animals, especially of slow-moving and burrow-dwelling animals that are not able to move away.
• Construction can introduce invasive alien species, and lead to the spread of those that are already present. Invasive species will negatively compete with indigenous species and disrupt ecological processes.
• Construction and maintenance of roads and other infrastructure can be associated with spills of fuel and other chemicals.
sediment fences) required when wetland or watercourse banks steeper than 1:5 are denuded during construction.
- Ensure erosion control along roads. Put in culverts at drainage lines. Build water diversion structures at 20 to 50 m intervals (depending on the steepness of the slope) along veld tracks. Soil should be dug out across veld tracks and used to create berms downslope of the ditch. Berms must be at least three times the width of the road, to prevent water running around the berm and back onto the tracks. Berm ends should be extended on the downslope side of the road with rocks to prevent diverted water eroding the soil. These will prevent veld roads acting as water channels, causing donga erosion. It will also facilitate vegetation recovery on closed roads.
- If construction areas are to be pumped of water (e.g. after rains), this water must be pumped into an appropriate settlement area, and not allowed to flow straight into any watercourses or wetland areas.
- Stormwater runoff from all roads must be spread as much as possible, to avoid concentration of flows off compacted or hardened surfaces.
- Roads should not be raised above the natural base level, allowing surface runoff to flow uninterrupted. Crossings over watercourses and wetlands should be built as stabilised drifts rather than using culverts or pipes.
- Any materials brought in to construction sites should be from sources free of invasive alien species.
- There must be regular dust suppression during construction. Rehabilitate
- Clearing of invasive alien species must take place during and after extraction work.
- Impact of clearing and rate of recovery of vegetation must be monitored. - Clearing of invasive alien plants must take place coupled with the sowing of
seeds of indigenous grass species to stabilise disturbed habitats. - Roads must be closed properly after use with the construction of multiple
berms. Temporary roads must be closed on termination of the exploration or other activity for which they were used.
- Compacted bare ground should be loosened and pitted, and covered with branches or stones. This will improve the ability of the surfaces to trap seeds and to absorb rainwater, thereby hastening vegetation recovery.

CHAPTER 7: BIODIVERSITY AND ECOLOGICAL IMPACTS
Page 7-34
Activity Description Mitigation measures
- Domestic livestock should be excluded from areas under rehabilitation until the vegetation has recovered sufficiently.
Vehicular traffic on roads
Construction and to a lesser extent operation will significantly increase traffic volumes within the affected areas and this may lead to significant increases in mortality of susceptible species. • Increased vertebrate roadkill is expected to occur. Some
species such as Bat-eared Foxes appear particularly vulnerable to roadkill and may be disproportionately affected.
• Shy animal species may avoid the proximity of busy roads and thus experience habitat loss.
Avoid - No driving off roads. - No driving at night.
Minimise
- Establish culverts for fauna crossings. - Establish and enforce strict speed limits.
Waste water management including treatment, storage and disposal of waste water (flowback and produced water and sewage)
• Waste water ponds that are accessible to animals are likely to cause mortalities from consumption and drowning. Leaks, spills, and spread of contaminants are the most significant concern for freshwater species and also others that depend on access to water.
• Water pollution/contamination from waste water treatment, flowback and produced water, e.g. releases from waste water ponds, or from accidental releases associated with natural flood events; leaking infrastructure (e.g. ponds, closed water treatment units); and spills of waste water. Flowback and produced water is likely to contain drilling fluids, drilling mud, contaminated fossil water, radioactive nucleotides, biocides and other toxins (e.g. heavy metals), and is likely to have a high salinity.
Avoid - No land application of waste fluids. - No injection/disposal wells. - No direct discharge of waste water to wetlands and watercourses.
Minimise
- If unavoidable, surface discharge of waste water to the environment must be monitored, in order to ensure that the water quality guidelines for maintenance of aquatic ecosystems, as provided by Department of Water & Sanitation (DWS), are adhered to. In addition, the regulations regarding the use of water for mining and related activities in order to protect water resources (GN 704/1999 in Government Gazette of 4 June 1999) must be applied (see Hobbs et al., 2016).
- Waste water storage or treatment ponds must be fenced and covered with shade cloth.
- The mining companies must be responsible for dealing with the waste water generated by SGD activities on site.
Water abstraction and use including water used for fracking
Extensive abstraction of water (surface or groundwater) in the arid Karoo environment will result in impacts on inundation/saturation regimes in wetlands, and flow regimes in watercourses. Abstraction of groundwater will also result in localised drawdown of the water table. • Large-scale abstraction of water (surface or groundwater)
Avoid - No groundwater abstraction or drilling of boreholes within 500 m of existing
springs, wellpads or boreholes. - No water abstraction from perched water tables.

CHAPTER 7: BIODIVERSITY AND ECOLOGICAL IMPACTS
Page 7-35
Activity Description Mitigation measures
in the Karoo environment is likely to have a catastrophic effect on the condition of aquatic ecosystems, other water-dependent ecosystems, and associated species. In extreme cases it may cause subsidence.
• Ephemeral and seasonal pools lower down in catchments are more vulnerable as they are more dependent on groundwater.
• Abstraction of water will cause a decline of species dependent on water availability, including amphibians and fish, and may impact availability of breeding habitats for aquatic species.
• Riparian plant species and communities dependant on perched water tables (such as Valchelia karroo, Searsia lancea, Phragmites australis) will be impacted.
• Deeper fossil water (if used for fracking) can contaminate shallower aquifers during fluid migration, and ecosystems dependent on these.
Minimise - Water use must be subject to the determination of a comprehensive Ecological
Reserve, both for surface and groundwater resources. - Sound assessments of water quantity available must be conducted. - Water levels in source water holes must be monitored.
Activities linked to ongoing on-site operations and maintenance
Human presence/activity has impacts such as: increased firewood collection; increased poaching of species for human consumption (e.g. Kudu, Porcupine); killing of animals seen as dangerous (e.g. snakes and spiders); increased collection of species of special interest (e.g. medicinal plants and species popular for the pet trade such as scorpions, baboon spiders and reptiles; trampling of habitats; increased domestic and feral animals which kill indigenous animals, especially birds; and increased fishing in larger river systems (e.g. Sundays River, Fish River). • Disturbance, such as light and noise. This changes
behaviour of species. Impacts can occur over long distances. Noise pollution frightens animals away. Persistent noise results in habitat degradation and impacts on predation and reproduction. Numerous invertebrates groups are negatively impacted by light pollution due to disorientation, and disruption to mating systems. Lights cause prey community change, which affects some bat species; it affects predation on rats by owls and small carnivores; and can disturb behaviour of invertebrates at night.
• Industrial accidents e.g. chemical or fuel spills, lead to contamination of soils and water, and result in habitat
Avoid - Staff should not be permitted to walk into the veld but should remain only on
the wellpads. - No collection of fire wood, medicinal plants, or animals with potential for the
pet trade permitted. - Wells must be sited to avoid ecological buffers determined for the protection of
biodiversity, and adhere to the buffers set by Hobbs et al. (2016) for protection of the water resource.
- No fuel storage, refuelling, vehicle maintenance or vehicle depots within 50 m of the edge of any wetlands or watercourses.
Minimise
- Minimise the amount of lighting at all facilities and use downward-directed low-UV emitting LED lights at wellpads and direct these exclusively to the areas where night-time lighting is required.
- Minimise noise from facilities and infrastructure. - An emergency protocol must be developed that deals with accidents and spills.
This must include methods for absorbing chemicals/oils/fuel, and the transport and disposal of all contaminated material in a suitable hazardous waste site.

CHAPTER 7: BIODIVERSITY AND ECOLOGICAL IMPACTS
Page 7-36
Activity Description Mitigation measures
degradation and mortalities. - Refuelling and fuel storage areas, and areas used for the servicing or parking of vehicles and machinery, should be located on impervious bases and should have bunds around them. Bunds should be sufficiently high to ensure that all the fuel kept in the area will be captured in the event of a major spillage. Water permits must be issued both for use or water as well as discharge.
- Toilets must not be allowed to leak or drain into natural areas. - Ensure sufficient capacity for management of water contamination.
Rehabilitate - Areas contaminated by accidents and spills must be rehabilitated.

CHAPTER 7: BIODIVERSITY AND ECOLOGICAL IMPACTS
Page 7-37
7.2.3 Cumulative impacts
It is often cumulative impacts and related fragmentation of the landscape that are of major concern
from an ecological point of view, rather than the impact of any particular activity at the level of an
individual site. Given the extensive nature of the Karoo, the development of a few widely scattered
wellpads is not likely to generate any impacts of broader significance. However, the cumulative
impact of numerous wellpads and associated infrastructure across an extraction area is likely to
generate significant impacts on ecological patterns and processes.
The different scenarios have the potential to generate different levels of cumulative impact. Under the
Small Gas scenario, the total estimated footprint of development within a 30x30 km block would be
approximately 110 ha of wellpads and up to 61 km of new access road equivalent to approximately 61
ha of transformation assuming that roads are 10 m wide. This represents less than 1% of the 30x30 km
development block. However, this does not adequately indicate the potential for cumulative impact.
Under the Small Gas scenario there is no point more than 5 km from a wellpad or access road and
25% of the area is within 500 m of a wellpad or access road and 48% is within 1 km. By comparison,
under the Big Gas scenario, 54% of the block would be within 500 m of a well or access road and
86% is within 1 km. Clearly, within the Big Gas scenario it is impossible for fauna to avoid the SGD.
The landscape fragmentation impacts of the Small and Big Gas scenarios are illustrated schematically
in Figure 7.8. It is not the extent of direct habitat loss that is of concern, but rather impacts that extend
beyond the footprint such as noise or increased impediments to faunal movement such as fences, as
well as a combination of such factors.
Figure 7.8: Distance surfaces from shale gas infrastructure, under the Small Gas scenario (left) and the Big Gas scenario (right), illustrating the fragmentation of the landscape by SGD, even where it occupies a small
proportion of the landscape.

CHAPTER 7: BIODIVERSITY AND ECOLOGICAL IMPACTS
Page 7-38
Figure 7.9: Cumulative distance curves illustrating the proportion of a 30x30 km block that would be within the x-axis distance from an access road or wellpad under the Small Gas scenario (green) and the Big Gas
scenario (red).
For many small fauna which can complete their life cycle within a few hectares, the main impact of
SGD would be habitat loss roughly equivalent to the development footprint. However, as the mobility
or home range of fauna increases, they are increasingly likely to encounter shale gas infrastructure
and hence potential negative impact. For larger mobile species, typical reported home ranges are in
the order of 2 – 5 km2 for Aardvark, Orycteropus after; 1 – 6 km2 for Aardwolf, Proteles cristatus; 6 –
48 km2 for Caracal, Caracal caracal; 5 – 15 km2 for Black-footed Cat, Felis nigripes; up to 500 km2
for Honey Badger, Mellivora capensis; and up to 21.9 km2 for Kudu, Tragelaphus strepsiceros
(Skinner & Chimimba, 2005). With a projected average well density of one wellpad every 2.25 km2
under the Big Gas scenario; it is clear that resident individuals of these species would need to
negotiate shale gas infrastructure or disturbance on a daily basis. Although many fauna become
habituated to human activity, certain impacts such as roadkill are not conducive to habituation and
cumulative long-term impact may compromise local populations of vulnerable species.
Cumulative impacts result both from the repeated nature of each impact across the landscape as well
as the combined impact of each different impact source. For some species there may be a dominant
source of impact, while for others there is likely to be a combination of contributing factors. In
addition, many impacts are likely to be context specific and would not operate equally across different
habitats or environments. For example, within the Gamka Karoo, there are extensive tracts of stony
ground where vegetation cover rarely exceeds 10%. A 10 m wide gravel road in this area would
hardly be noticed by most resident fauna as they are accustomed or adapted to conditions of low
vegetation cover. In contrast, vegetation cover in the Sundays Noorsveld or adjacent Thicket
Distance (m)
% o
f Blo
ck

CHAPTER 7: BIODIVERSITY AND ECOLOGICAL IMPACTS
Page 7-39
communities may be in the order of 80-90%, and in these areas many species would avoid crossing
such roads or would be vulnerable to predation when doing so (Figure 7.10). The impacts of noise on
the other hand may operate in the other direction as vegetation would dampen noise in the thicket
much more quickly than on the open plains and fauna may also be more tolerant of noise in the thicket
due to the cover it provides.
Figure 7.10: The impacts of SGD are likely to be very different in vegetation types with low vegetation cover such as this Gamka Karoo near Laingsburg (left), compared to Thicket vegetation types with a high standing
biomass such as this Great Fish Thicket near Riebeeck East (right).
Although it is difficult to predict which species would be impacted and to what extent, where these
are ecologically important species, ecosystem-level changes and cascade effects are likely to occur as
a result. Although cumulative impacts are identified here as a likely key impact associated with SGD,
these impacts are hard to quantify due to the large spatial scales over which they are likely to occur
and the difficulty of identifying appropriate indicators for monitoring, compounded by the paucity of
knowledge of the potential impacts of such large-scale disturbance in an environment which has not
experienced anything like it before.
7.2.4 Capacity gaps for implementation of mitigation measures
The implementation of the strategic approach to mitigation set out in Table 7.2, as well as the specific
mitigation measures set out in Table 7.3, assumes the existence of appropriate capacity in a range of
organs of state including regulatory authorities. Capacity is currently weak with regard to some of the
mitigation measures, and would need to be strengthened in order to support their successful
implementation.
A major gap exists in capacity to expand the protected area network to secure EBIS-1 and EBIS-2
areas, either through state-owned and managed protected areas or through contract protected areas in
partnership with landowners. This is essential for achieving the strategic landscape-level approach to
CHAPTER 7: BIODIVERSITY AND ECOLOGICAL IMPACTS
Page 7-40
mitigation set out in Table 7.2. Biodiversity stewardship programmes have a key role to play, as do
mechanisms for private entities to purchase land and transfer it to the state along with an annuitised
lump sum for management for an agreed period. Both of these provide avenues for the
implementation of biodiversity offsets, for which EBIS-1 and EBIS-2 areas are the first-tier and
second-tier receiving areas, respectively.
Biodiversity stewardship is an approach to securing land in biodiversity priority areas through
entering into agreements with private or communal landowners, led by conservation authorities
(SANBI, 2015). Biodiversity stewardship programmes in provincial conservation authorities in the
Northern, Eastern and Western Cape currently lack capacity to enter into new agreements with
landowners, and to support existing agreements with landowners. The Northern Cape Department of
Environment and Nature Conservation (DENC) have recently initiated a biodiversity stewardship
programme but this is largely restricted to the Succulent Karoo, and implementation of biodiversity
stewardship in the province currently relies heavily on Non-Government Organisation (NGO)
support. In CapeNature, the biodiversity stewardship programme is small and its capacity is already
fully allocated to supporting existing agreements with landowners. CapeNature also depends on
resources from the NGO sector to supplement the implementation of biodiversity stewardship. The
Eastern Cape Parks and Tourism Agency (ECPTA) has a small biodiversity stewardship programme,
which, despite limited staffing, has recently secured the declaration of a Protected Environment in the
Compassberg area of the SGD study area. South African National Parks (SANParks) has active
stewardship programmes in the buffer regions around the 5 National Parks in the study area, although
the current focus is on the Mountain Zebra to Camdeboo corridor and contractual National Park
declarations in the north portions of Addo Elephant National Park.
Recommendations in the recently approved Business Case for Biodiversity Stewardship (SANBI,
2015) provide an excellent starting point for addressing these capacity constraints. Implementation of
these recommendations requires proactive support from the DEA and National Treasury to unlock
resources for strengthening biodiversity stewardship programmes.
In addition to lack of capacity for expanding the protected area network in EBIS-1 and EBIS-2 areas
in support of strategic landscape-level mitigation (Table 7.2), the following gaps exist for
implementing the activity-specific mitigation measures proposed in Table 7.3:
At the national level:
• In the DWS:
o Capacity to issue water use licences, and to monitor and enforce conditions of these
licences;

CHAPTER 7: BIODIVERSITY AND ECOLOGICAL IMPACTS
Page 7-41
o Capacity to determine and monitor the implementation of the ecological reserve for rivers
and wetlands in the study area;
o Capacity to determine and implement Resource Quality Objectives for rivers and
wetlands in the study area; and
o Capacity to monitor water quality and aquatic ecosystem condition.
• In DEA:
o Capacity to evaluate and deal with cumulative impacts across the landscape;
o Capacity to process EIAs; and
o Capacity of Environmental Programmes to deal with invasive alien plants.
• In SANParks:
o Capacity to fully implement biodiversity stewardship in buffer regions around National
Parks;
o Capacity to incorporate biodiversity offset receiving areas into the National Park network.
• In the Department of Mineral Resources (DMR); and
o Capacity to declare sensitive areas (e.g. EBIS 1 areas) as off-limits for mining and
prospecting, using Section 49 regulations of the MPRDA.
At the provincial level:
• In provincial conservation authorities (DENC, CapeNature, ECPTA):
o Capacity to implement biodiversity stewardship, as discussed above;
o Capacity to comment on development applications; and
o Capacity to enforce restrictions on collection of firewood, medicinal plants, or animals
with potential for the pet trade.
• In provincial environmental affairs departments (DENC, DEADP, DEDEAT):
o Capacity to process development applications; and
o Capacity to monitor and enforce requirements set out in Records of Decision – this is a
critical concern, and mitigation should include increasing capacity of provinces in this
regard.
At the municipal level:
• Capacity to treat waste water to acceptable limits – this is a critical concern, and mitigation should
include increasing capacity of municipalities in this regard;
• Capacity to manage stormwater, including runoff from roads and new infrastructure;
• Capacity to enforce restrictions on off-road driving, including driving in wet conditions and
driving at night;
• Capacity to enforce speed limits for vehicles on roads;

CHAPTER 7: BIODIVERSITY AND ECOLOGICAL IMPACTS
Page 7-42
• Capacity to develop and implement emergency protocols for dealing with accidents and spills of
hazardous materials;
• Capacity to enforce restrictions on movement of shale gas staff into natural areas beyond SGD
sites;
• Capacity to accommodate shale gas staff in towns – important for limiting impacts at SGD sites;
and
• Capacity to develop Land Use Schemes in terms of the Spatial Planning and Land Use
Management Act (SPLUMA) (Act 16 of 2013) – a key mechanism for protection of EBIS-1 and
EBIS-2 areas is to zone them appropriately (e.g. conservation) in Land Use Schemes.
Among consultants and specialists:
• Small number of biodiversity specialists (e.g. freshwater ecologists, botanists, zoologists, taxon
experts) able to do site assessments and specialist reports for EIAs; and
• Limited capacity at museums, in science councils and universities to assist with identification of
material collected in EIAs, especially for animals.
7.3 Risk assessment
This section begins with a brief explanation of how ecologically important and sensitive areas, which
form the basis of the risk assessment, were identified. More detail is available in Digital Addendum
7B. It goes on to discuss the approach used for measuring risk, and the limits of acceptable change. It
concludes with a risk assessment table which links the areas of EBIS to degrees of risk, with and
without mitigation.
7.3.1 Identification of areas of EBIS
A hybrid approach to identifying areas of EBIS was taken, combining multi-criteria analysis with
systematic biodiversity planning (also known as systematic conservation planning). The multi-criteria
part of the analysis allows for identification of the ecologically important and sensitive areas features
in the landscape where the whole feature falls within a specific level of sensitivity or importance (e.g.
a riparian area or a buffer around a protected area). However, in landscapes such as the Karoo, where
there is a great deal of choice of location for meeting targets for biodiversity features, it is usually not
necessary to secure the whole ecosystem or habitat to ensure the ongoing integrity of the area, but
nevertheless necessary to ensure that enough area of each feature remains intact. A multi-criteria
approach does not allow for the identification of a set of areas which, if secured, would allow Karoo
ecosystems, key ecological processes and important species to persist. Hence, a systematic
biodiversity planning approach was also applied. This approach, which is widely accepted in South
CHAPTER 7: BIODIVERSITY AND ECOLOGICAL IMPACTS
Page 7-43
Africa as best practice for the identification of spatial biodiversity priorities (see Section 7.1.4), aims
to identify a set of areas which meets targets for all biodiversity features in a way that is ecologically
sustainable, efficient and least conflicting with other activities and land uses. See Cadman et al.
(2010) for an explanation of South Africa’s systematic approach to prioritising within multi-use
landscapes to conserve biodiversity and promote ecosystem resilience.
The biodiversity features on which the analysis was based included the full set of biodiversity pattern
features (e.g. the individual habitat types and areas for key species) and ecological process features
(e.g. portions of the landscape supporting key ecological process features such as hydrological
processes or adaptation to climate change impacts).
Targets were set for the significant biodiversity pattern and ecological process features found within
the landscape. These targets refer to the portion of the historical extent of a particular feature which
needs to be kept intact in order for that feature to persist into the future. Targets were carefully
determined in order to ensure that sufficient of each type of feature was included in the set of areas of
EBIS. Targets for ecosystems, species and ecological process areas were set.
The approach aims to identify a configuration of sites which is ecologically sustainable. Although the
total quantity of each feature is important to ensure that sufficient area is kept intact, in many ways a
more important issue is making sure that the prioritised areas are linked together in an ecologically
connected way across the landscape. It is critical that the individual areas that are identified are
connected in a way that allows ecological process to take place at a variety of spatial scales. These
scales can range from broad landscape-level linkages which are important for climate change
adaptation, through to hydrological processes occurring in catchments and linked groundwater
systems, to local-level processes such as pollination or the movement of small mammals. The analysis
aims to identify a set of areas which fully secures all these key ecological processes across the
landscape.
The set of areas is designed to be efficient and least conflicting with other land uses. Where possible,
sites are selected which meet targets for a range of biodiversity features rather than just for a single
feature. This ensures that the most important areas are selected, and also allows the targets to be met
in the smallest possible area. Wherever possible, the analysis also aims to select areas which are in the
best possible ecological condition, as these sites are likely to retain the fullest suite of biodiversity
features and are more likely to persist into the future than sites in poorer ecological condition.

CHAPTER 7: BIODIVERSITY AND ECOLOGICAL IMPACTS
Page 7-44
Importantly, the approach identifies a coherent set of areas which together meet targets for
representation of biodiversity and maintenance of ecological processes in an efficient way. A key
issue is that this whole identified set of priority areas needs to be kept ecologically intact (via means
such as development controls, appropriate zoning in land use scheme, biodiversity offsets, or
biodiversity stewardship and other forms of protected area expansion) in order to secure the Karoo’s
biodiversity against landscape-scale impacts in the remaining areas. Should any of the prioritised
areas be lost, ecologically equivalent sites would need to be identified to sufficiently secure
biodiversity and ecological integrity. Because the current set of areas of EBIS is as efficient as
possible, any loss of these areas would require larger alternate areas to be selected to offset any loss.
The approach is built on the concept of spatial optimisation. Instead of identifying a large number of
areas across the landscape with moderate levels of biodiversity importance, which could result in
impacts being spread throughout the landscape and could compromise the ecological integrity and
functioning of the entire area, an optimal set of areas has been identified. If kept intact, these areas
would ensure that the ecological integrity of the Karoo is retained. This set of priority areas contains
both irreplaceable sites (i.e. sites for which there is no choice of an equivalent site for meeting the
targets for the biodiversity features concerned) and optimal sites (i.e. sites identified through the
systematic biodiversity planning process as being the best option for meeting targets). In some cases
there is little choice, and although a site is flagged as optimal rather than being truly irreplaceable, few
viable alternatives may exist and it may not in practice be possible to find other sites to meet targets.
In other cases, viable alternatives may be available and some exchange of sites (e.g. as part of a
biodiversity offset process) could be possible.
The analysis builds in the concepts of both ecological importance and sensitivity. Importance refers to
the sites which are most needed for meeting biodiversity targets (in other words are most
irreplaceable) while sensitivity refers to sites containing features which are highly vulnerable to
disturbance or where recovery is slow.
Four levels of EBIS were identified:
EBIS-1 – areas that contain extremely sensitive features, such as key habitat for rare, endemic or
threatened species, or features that perform critical ecological functions. These sites are
irreplaceable (i.e. no ecologically equivalent sites exist and there is no exchangeability between
sites). SGD activities must be avoided in these areas, as impacts of SGD in these areas would
undermine the ecological integrity of the Karoo. Ideally these areas should be secured through
appropriate zoning, development controls, or protected area expansion through stewardship and
other mechanisms.
CHAPTER 7: BIODIVERSITY AND ECOLOGICAL IMPACTS
Page 7-45
EBIS-2 – areas that contain highly sensitive features and/or features that are important for
achieving targets for representing biodiversity and/or maintaining ecological processes. These
areas represent the optimal configuration for securing the species, ecosystems and ecological
processes of the Karoo. Impacts of SGD in these areas are undesirable, and any impact would
need to be offset and ecologically equivalent sites identified to represent the same suite of
biodiversity features that were impacted.
EBIS-3 – other natural or semi-natural areas that do not contain currently known sensitive or
important features, and are not required for meeting targets for representing biodiversity or
maintaining ecological processes. Provided that EBIS-1 and EBIS-2 areas are secured, loss of
habitat in EBIS-3 areas should not compromise the ability to achieve biodiversity targets in the
Karoo, as long as the impacts in EBIS-3 areas do not extend into adjacent areas of higher
importance or sensitivity. However, if any impacts occur in EBIS-2 areas, additional sites from
EBIS-3 areas may be required as alternatives for representing biodiversity and maintaining
ecological processes.
EBIS-4 – areas in which there is no remaining natural habitat, e.g. urban areas, larger scale highly
degraded areas, large arable intensively farmed lands. SGD activities in these sites should result in
minimal biodiversity loss, as long as the impacts do not extend to adjacent EBIS-1 or EBIS-2
areas.
The extent of the study area falling within each of these categories of importance and sensitivity is
provided in Table 7.4, a map of the categories is shown in Figure 7.12, and a summary of features
included in each category is provided in Table 7.5. See Digital Addendum 7B for more detail on the
methodology.

CHAPTER 7: BIODIVERSITY AND ECOLOGICAL IMPACTS
Page 7-46
Figure 7.11: Mountainous and topographically heterogeneous areas are generally more diverse for both fauna and flora than the intervening open plains. A significant proportion of the areas identified as being of high
importance for biodiversity are mountainous and therefore would tend not to be suitable for SGD.
Table 7.4: Extent of areas of EBIS within the study area (hectares and percentage)
Extent (Hectares) Extent (%) Protected areas 828 191 5 EBIS-1 2 253 544 13 EBIS-2 6 348 763 37 EBIS-3 7 593 740 44 EBIS-4 156 900 1
Total 17 181 138 100

CHAPTER 7: BIODIVERSITY AND ECOLOGICAL IMPACTS
Page 7-47
Table 7.5: Summary of features included in each category of EBIS.
Features included
Ecological and Biodiversity Importance and Sensitivity (EBIS)
Protected areas
EBIS-1 Irreplaceable sites (no choice exists)
EBIS-2 Optimal sites (some choice exists)
EBIS-3 Sites not required to meet targets
EBIS-4 No site-specific ecological or biodiversity importance
Biodiversity features
-- • Wetlands, springs (including intact buffers)
• Specific sites important for Threatened species and for range-restricted endemic or near-endemic species (fauna and flora)
• High priority habitat for Threatened species or for range-restricted endemic or near-endemic species
• Rivers and associated habitats (including intact buffers)
• Special habitats e.g. rocky outcrops, escarpment areas, riparian vegetation
• Sites selected through a systematic biodiversity planning process to meet targets for terrestrial or aquatic ecosystems in an efficient configuration that aligns with other biodiversity features and priority areas
• Severely modified areas that retain some importance for supporting ecological processes (e.g. agricultural fields within buffers around rivers and wetlands)
• Natural habitat which is not irreplaceable and has not been selected as part of the optimal sites
• Areas that have been severely or irreversibly modified and that are not important for supporting provision of ecological processes
Other biodiversity priority areas
• Areas declared or recognised in terms of the Protected Areas Act
-- • Incorporates all Freshwater Ecosystem Priority Areas (FEPAs), both rivers and wetlands
• Includes Critical Biodiversity Area One (CBA 1) from relevant provincial biodiversity plans
• Buffers around protected areas (intact areas)
• UNESCO Biosphere Reserve
-- --

CHAPTER 7: BIODIVERSITY AND ECOLOGICAL IMPACTS
Page 7-48
Figure 7.12: Map of Ecological and Biodiversity Importance and Sensitivity (EBIS) in the study area. Protected areas (5% of study area) are legally protected. EBIS-1 areas (13% of study area) contain extremely sensitive features and are irreplaceable. EBIS-2 areas (37% of study area) contain highly sensitive features and/or features that are important for achieving targets for representing biodiversity and/or maintaining ecological processes. Protected areas, EBIS-1 areas and EBIS-2 areas collectively meet
targets for representation of biodiversity and maintenance of ecological processes in the study area. EBIS-3 areas (44% of the study area) are natural areas that do not contain currently known sensitive or important features. In EBIS-4 areas (1% of study area) there is no remaining natural habitat.

CHAPTER 7: BIODIVERSITY AND ECOLOGICAL IMPACTS
Page 7-49
7.3.2 How the risks are measured
For biodiversity and ecological impacts, risk is measured in terms of disruption of ecological
processes, loss or degradation of ecosystems, and/or loss of species. The degree of risk is assessed
against targets for maintaining the functioning of all key ecological processes, maintaining a
proportion of each ecosystem in good ecological condition, retaining all threatened species, and
retaining a representative sample of all endemic or near-endemic species. In measuring and assessing
risk, a key focus is on the need to maintain the ecological integrity of the landscape as a whole, rather
than simply on retaining individual biodiversity features in and of themselves. Protected areas, EBIS-
1 areas and EBIS-2 areas collectively meet targets for representation of biodiversity and maintenance
of ecological processes in the study area, in a spatial configuration that ensures connectivity in the
landscape. The assessment of risks can therefore be expressed in terms of loss or degradation of these
areas.
Opportunity is measured in terms of strengthening protection of ecological processes, ecosystems and
species, for example through protected area expansion (including through biodiversity stewardship
contracts) and/or biodiversity offsets, especially in EBIS-1 and EBIS-2 areas. It is possible to mitigate
almost all impacts in EBIS-2 areas by securing ecologically equivalent sites. This opportunity to
mitigate risk through securing sufficient intact areas is a viable and practical approach to dealing with
impacts associated with SGD, so long as sufficient areas are properly secured before any large-scale
impacts occur, and broad regional impacts of development are carefully managed through the
application of robust site-level management procedures even in EBIS-3 and EBIS-4 areas.
7.3.3 Limits of acceptable change
The limits of acceptable change relate to the ability to meet biodiversity targets for ecological
processes, ecosystems and species, which underpin the identification of areas of EBIS. As discussed
in Section 7.3.1, the identification of these areas is based on targets for biodiversity features relating
to biodiversity pattern and ecological processes.
No loss or degradation of EBIS-1 areas is acceptable. These areas are irreplaceable and no
ecologically equivalent areas exist for securing the features they contain.
In EBIS-2 areas, loss or degradation is acceptable only if ecologically equivalent sites are identified
and secured through biodiversity offsets or equivalent mechanisms. An ecologically equivalent site
means a site that contains equivalent ecological processes, ecosystems and species, and that
compensates for the full ecological impact of the activity as identified through a detailed study. In

CHAPTER 7: BIODIVERSITY AND ECOLOGICAL IMPACTS
Page 7-50
addition, loss or degradation of EBIS-2 areas will result in the need to identify additional sites from
within EBIS-3 for inclusion in EBIS-2, in order to meet targets for ecological processes, ecosystem
and/or species. The limits of acceptable change in EBIS-2 areas are determined by the ability to find
ecologically equivalent sites in the remaining intact EBIS-3 areas.
Loss or degradation of In EBIS-3 areas is acceptable, as long as there is no impact on EBIS-1 or
EBIS-2 areas. Activities that are authorised in EBIS-3 areas need to be assessed for potential impacts
on EBIS-1 or EBIS-2 areas.
In EBIS-4 areas, site-level impacts are not significant from a biodiversity or ecological point of view.
Change is acceptable as long as it does not impact on EBIS-1 or EBIS-2 areas.
7.3.4 Risk assessment table
Table 7.7 sets out the assessment of risk for each of the scenarios, based on the consequences and
likelihood of occurrence of impacts of SGD, with and without mitigation. The consequence levels
used in Table 7.7 have been calibrated based on a series of thresholds, set out in Table 7.6. The
thresholds for species are linked to thresholds used in IUCN Red List assessments, and those for
ecosystems and ecological processes are linked to thresholds used in national assessments of
ecosystem threat status and in biodiversity planning in South Africa.
The assessment of risk with mitigation is based strongly on the application of the mitigation hierarchy
at the landscape scale, as set out in Section 7.2.3, based on the map of EBIS shown in Figure 7.12. As
discussed in Section 7.2.1, the primary mitigation for SGD in the Karoo as a whole is securing the
EBIS-1 and EBIS-2 areas, which effectively makes EBIS-3 and EBIS-4 areas available for SGD. This
sort of strategic mitigation at the landscape level, in addition to mitigation at the site or operational
level is essential in order to reduce risk levels.
EBIS-1 and EBIS-2 areas need to be retained in a natural state and secured through appropriate
zoning or legal mechanisms that limit habitat loss or degradation in these areas. As long as EBIS-1
and EBIS2 areas have been secured, overall ecological integrity and retention of the biodiversity value
of Karoo ecosystems would be ensured. Subject to reasonable on-site operating rules to reduce
unnecessary impacts, and careful minimisation of any broader impacts on adjacent EBIS-1 and EBIS-
2 areas, biodiversity loss within EBIS-3 areas could be absorbed without compromising the overall
function and integrity of the Karoo ecosystem as a whole. Impacts restricted to EBIS-4 areas are
unlikely to be of ecological significance.

CHAPTER 7: BIODIVERSITY AND ECOLOGICAL IMPACTS
Page 7-51
Table 7.7 shows that under the Big Gas scenario without mitigation, the risk is very high for EBIS-1
areas and high for EBIS-2 areas – it is very likely that there would be impacts with extreme
consequences for the biodiversity and ecological features in EBIS-1 areas and severe consequences
for those in EBIS-2 areas. With mitigation, the risk is reduced to moderate. Although there is no
change in the consequence level of impacts in EBIS-1 and EBIS-2 areas, the likelihood of occurrence
of these impacts is substantially reduced, as mitigation requires avoiding SGD activities altogether in
EBIS-1 areas and avoiding or offsetting impacts in EBIS-2 areas. This strategic form of mitigation at
the landscape level allows for the risks of SGD to be reduced to moderate levels even under a Big Gas
scenario.
Figure 7.13 presents a risk map of impacts on ecology and biodiversity across four SGD scenarios,
with and without mitigation.
The same logic applies under the Small Gas scenario where risk levels with mitigation are moderate
for EBIS-1 areas and low for EBIS-2 areas. Under the Exploration Only scenario with mitigation,
EBIS-1 areas must be avoided altogether, and impacts in EBIS-2 areas must be minimised with
thorough application of the strategic mitigation measures set out in Table 7.2, resulting in very low
risk levels.
Risk levels drop off rapidly as one moves away from EBIS-1 and EBIS-2 areas, emphasising the
importance of locating infrastructure and activities associated with SGD outside of these areas.
Table 7.6: Consequence levels used in the risk assessment, with thresholds for species, ecosystems and ecological processes. Thresholds for species are linked to thresholds used in IUCN Red List assessments, and
those for ecosystems and ecological processes are linked to thresholds used in national assessments of ecosystem threat status and in biodiversity planning in South Africa.
Consequence level →
Slight Moderate Substantial Severe Extreme
Impact ↓ Species of special concern
Reduction in population or occupied area*
<20% (Least Concern, LC)
20-30% (Near Threatened, NT)
30-50% (Vulnerable, VU)
50-80% (Endangered, EN)
80-100% (Critically Endangered, CR)
Ecosystems (habitat types)
Reduction in intact area**
<20% (Least Threatened, LT)
20-40% (Least Threatened, LT)
40-60% (Vulnerable, VU)
60-80% (Endangered, EN)
80-100% (Critically Endangered, CR)
Ecological processes
Disruption of ecological functioning***
<20% 20-40% 40-60% 60-80% 80-100%
* In relation to national distribution (except for keystone species – in relation to study area). ** In relation to national distribution. *** In relation to their functioning within the study area.
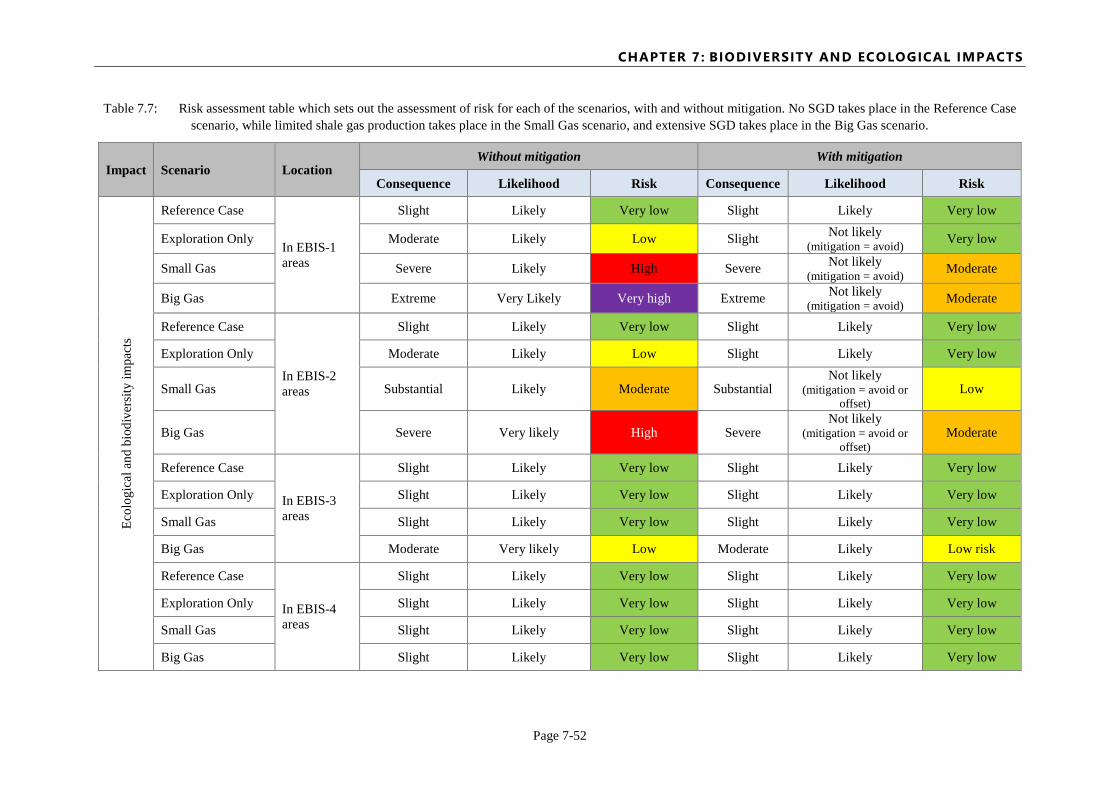
CHAPTER 7: BIODIVERSITY AND ECOLOGICAL IMPACTS
Page 7-52
Table 7.7: Risk assessment table which sets out the assessment of risk for each of the scenarios, with and without mitigation. No SGD takes place in the Reference Case scenario, while limited shale gas production takes place in the Small Gas scenario, and extensive SGD takes place in the Big Gas scenario.
Impact Scenario Location Without mitigation With mitigation
Consequence Likelihood Risk Consequence Likelihood Risk
Ecol
ogic
al a
nd b
iodi
vers
ity im
pact
s
Reference Case
In EBIS-1 areas
Slight Likely Very low Slight Likely Very low
Exploration Only Moderate Likely Low Slight Not likely (mitigation = avoid) Very low
Small Gas Severe Likely High Severe Not likely (mitigation = avoid) Moderate
Big Gas Extreme Very Likely Very high Extreme Not likely (mitigation = avoid) Moderate
Reference Case
In EBIS-2 areas
Slight Likely Very low Slight Likely Very low
Exploration Only Moderate Likely Low Slight Likely Very low
Small Gas Substantial Likely Moderate Substantial Not likely
(mitigation = avoid or offset)
Low
Big Gas Severe Very likely High Severe Not likely
(mitigation = avoid or offset)
Moderate
Reference Case
In EBIS-3 areas
Slight Likely Very low Slight Likely Very low
Exploration Only Slight Likely Very low Slight Likely Very low
Small Gas Slight Likely Very low Slight Likely Very low
Big Gas Moderate Very likely Low Moderate Likely Low risk
Reference Case
In EBIS-4 areas
Slight Likely Very low Slight Likely Very low
Exploration Only Slight Likely Very low Slight Likely Very low
Small Gas Slight Likely Very low Slight Likely Very low
Big Gas Slight Likely Very low Slight Likely Very low

CHAPTER 7: BIODIVERSITY AND ECOLOGICAL IMPACTS
Page 7-53
Figure 7.13: Map indicating the risk to ecology and biodiversity across four SGD scenarios, with- and without
mitigation.

CHAPTER 7: BIODIVERSITY AND ECOLOGICAL IMPACTS
Page 7-54
In summary:
EBIS-1 areas are irreplaceable. Any SGD-related activities in these areas are assessed as very high
risk. Impacts in these areas would undermine the ecological integrity of the study area (and more
broadly the Karoo).
The primary mitigation for SGD is securing EBIS-1 and EBIS-2 areas, which effectively makes
EBIS-3 and EBIS-4 areas available for development. Strategic mitigation at the landscape level,
involving avoidance and securing of EBIS-1 and EBIS-2 areas, is essential as the impacts of SGD
cannot be effectively mitigated on-site or at the operational level.
EBIS-1 and EBIS-2 areas make up an estimated 50% of the study area. Loss or degradation of
habitat in these areas must be avoided, and they should be secured through appropriate legal
mechanisms. This may involve formal protected area declaration (including through biodiversity
stewardship agreements), but can include other types of stewardship, protection under Section 49 of
the MPRDA, appropriate designation in a land use scheme, or protection through other legal means.
Securing EBIS-1 and EBIS-2 areas may lend itself to a fast-tracked, integrated protected area
expansion strategy, similar to Operation Phakisa in the marine environment.
Where impacts in EBIS-2 areas are unavoidable, these should be offset by securing ecologically
equivalent sites. Appropriate national and provincial biodiversity offset guidelines and
methodologies should be applied to ensure no net loss.
Environmental compliance in EBIS-3 and EBIS-4 areas is still required. This includes specialist-
led assessment of local sensitivities and identification of appropriate mitigation and it is necessary in
order to ground-truth desktop assessments and avoid unnecessary impacts. Specific impacts are
discussed in Section 7.2.1 and monitoring requirements are discussed in Section 7.4.
7.4 Best practice guidelines and monitoring requirements
7.4.1 Best practice guidelines
Best practice guidelines for SGD are captured broadly in the strategic mitigation measures set out in
Table 7.2 as well as in the activity-specific mitigation measures set out in Table 7.3. In many cases,
more detail on the application of activity-specific mitigation measures, especially those dealing with
minimising or rehabilitating impacts, must be specified at the EIA stage. Detailed requirements for
site-level monitoring should also be specified at the EIA stage, related to the specific characteristics of
the receiving environment.

CHAPTER 7: BIODIVERSITY AND ECOLOGICAL IMPACTS
Page 7-55
EIAs for SGD projects should include Biodiversity Specialist Studies, with more comprehensive
studies required at higher levels of EBIS. Best practice guidelines for Biodiversity Specialist Studies
within EIAs are outlined in Brownlie (2005) and De Villiers et al. (2005). EBIS-1 areas should be
avoided altogether for SGD. This recommendation notwithstanding, should an SGD application go
ahead in an EBIS-1 area, the highest level (i.e. most comprehensive) Biodiversity Specialist Study
would be required. In EBIS-2 areas, the highest level of Biodiversity Specialist Study is required. In
EBIS-3 areas, a less comprehensive Biodiversity Specialist Study is required. In EBIS-4 areas, the
lowest level of Biodiversity Specialist Study is required. If SGD takes place in the study area, specific
guidelines for different levels of Biodiversity Specialist Study for EIAs for SGD should be developed,
equivalent to those developed as part of the recent SEA for Wind and Solar Energy (DEA, 2015b).
In addition, the Mining & Biodiversity Guideline (DEA et al., 2013) provides guidance on best
practices for integrating biodiversity considerations in mining EIAs, and for managing impacts on
biodiversity at different stages of the mining life cycle, from exploration through to closure.
7.4.2 Monitoring requirements
7.4.2.1 Summary of monitoring requirements and institutional arrangements
Monitoring is essential for assessing the impacts associated with SGD at the landscape, ecosystem and
species level, and for informing appropriate responses. Monitoring should be linked to the
biodiversity targets and limits of acceptable change which are discussed in Section 7.3, and should
thus focus on species of special concern, ecosystems or habitat types, and ecological processes. In
addition, because of the importance of cumulative impacts at the landscape scale in the context of the
Karoo (see Section 7.2.2), monitoring should also take place at the landscape level.
Monitoring requirements from the species level through to the landscape level, including indicators
and responsibilities, are summarised in Table 7.8, followed by more detailed recommendations on
indicator species. Monitoring requirements do not change dramatically across the phases of SGD.
This is because SGD is not distinctly partitioned and, apart from exploration, multiple phases of
activity from well establishment to production happen concurrently in an SGD block.
In addition to monitoring once activities associated with SGD are underway, there is a need for
baseline monitoring to establish reliable baselines for the study area. This is especially important
given the large information gaps on many aspects of the biodiversity and ecology of the area (as
discussed in Section 7.5). Depending on the natural variability of the variable of concern, as much as

CHAPTER 7: BIODIVERSITY AND ECOLOGICAL IMPACTS
Page 7-56
five years’ worth of data could be required to establish a reliable baseline, against which trends during
and after SGD can be evaluated. This is particularly important in the ephemeral aquatic ecosystems
which characterise the Karoo, as they have a high intrinsic variability in terms of aquatic community
responses to inundation patterns.
Institutional arrangements and responsibilities are fundamental to the success of monitoring efforts.
There is a need for independent monitoring by third parties, not just monitoring by the SGD
companies themselves. This will generally be led by government. SGD companies could be required
to contribute to the cost of such government-led monitoring in proportion to the scale of their
activities.
As highlighted in Table 7.8, the responsibility for SGD-related monitoring is shared across several
organisations. These include the South African Environmental Observation Network (SAEON),
which has an important role in landscape-level monitoring and maintaining benchmark sites for the
evaluation of SGD impacts, as well as SANBI, provincial conservation authorities and DWS. Some of
the capacity gaps discussed in Section 7.2.4 relate to monitoring requirements, and these would need
to be addressed. In some cases there is potential for NGOs to play a vital supporting role.
It is important for SGD-related monitoring efforts to be co-ordinated. This requires an organ of state
to convene the different organisations, researchers and other partners involved in monitoring, and
SAEON may have a role to play in this regard. In addition, a system or process should be in place for
integrating monitoring data from the site level, the ecosystem level and the landscape level into a
coherent set of information for the study area as a whole, which can be used to inform planning and
decision-making. Information from monitoring should feed into SANBI’s programme of monitoring
and reporting on the state of biodiversity nationally.

CHAPTER 7: BIODIVERSITY AND ECOLOGICAL IMPACTS
Page 7-57
Table 7.8: Monitoring requirements at the landscape, ecosystem, species and site level, including indicators and responsibilities.
Feature of concern
Impact of concern Indicator(s)
(WHAT)
Selection of monitoring sites
(WHERE) Approach (HOW) Responsibility (WHO) Phase
Landscape-level Loss of overall ecological integrity
- Progress in securing EBIS-1 and EBIS-2 areas through formal protection
- Landscape-scale fragmentation relative to baseline prior to SGD (metric to be determined)
- Across whole study area
- Across whole
study area
- Based on protected area data, annually
- Using aerial or satellite imagery or other appropriate data, annually
- DEA, SANBI - SAEON
Baseline Planning Construction Operations Decommissioning Monitoring and Evaluation (M&E) (post-closure)
Aquatic ecosystems and ecological processes
Loss of wetland extent and disruption of ecological functioning
- Assessment of changes in baseline extent of wetlands, watercourses and riparian areas
- Key wetlands, watercourses and riparian areas to be identified from EBIS map, representative of all aquatic ecosystem types in study area
- Desktop assessment to be done annually, using National Wetland/ Rivers Map as baseline, and aerial or satellite imagery for comparison.
- DWS, in collaboration with provincial conservation authorities
Baseline Planning Construction Operations Decommissioning M&E (post-closure)
Terrestrial ecosystems/ habitat types
Reduction in intact area
- Extent of each ecosystem/ habitat type still intact relative to baseline prior to SGD
- All habitat types in study area, including special habitats (e.g. quartz patches)
- Based on land cover data and other data on ecological condition, annually
- SANBI, SAEON Baseline Planning Construction Operations Decommissioning M&E (post-closure)

CHAPTER 7: BIODIVERSITY AND ECOLOGICAL IMPACTS
Page 7-58
Feature of concern
Impact of concern Indicator(s)
(WHAT)
Selection of monitoring sites
(WHERE) Approach (HOW) Responsibility (WHO) Phase
Species of special concern
Reduction in numbers or distribution
- Densities and distribution of indicator species – see recommended species below
- Species-dependent - Various e.g. mark-recapture studies, camera trapping, fixed effort counts
- Timing depends on species
- Conservation authorities
- NGOs - Citizen science
programmes
Baseline Planning Construction Operations Decommissioning M&E (post-closure)
Site-level monitoring
Compliance with mitigation measures
- Various, depending on the mitigation measure concerned
- More detail to be specified in EIA
- All areas with SGD activities
- In many cases important to include control sites as well as impact sites
- More detail to be specified in EIA
- Various, depending on the mitigation measure concerned
- Depends on measure being monitored
- More detail to be specified in EIA
- Shale gas companies (Environmental Compliance Officers)
- Provincial environmental affairs departments
Construction Operations Decommissioning

CHAPTER 7: BIODIVERSITY AND ECOLOGICAL IMPACTS
Page 7-59
7.4.2.2 Recommended indicator species for monitoring
Although within any particular area or region of the Karoo, there are specific species of conservation
concern that should be monitored to ensure that they are not impacted by SGD, there are also some
more widespread species prevalent across large parts of the Karoo, which by dint of their ecological
role or specific characteristics lend themselves to monitoring. These are briefly described below with
reference to the type of issues or processes that these species represent. The advantage of using these
more common and widespread species for monitoring is firstly, that impacts of SGD can be compared
across regions or areas of different SGD intensity and secondly, these species are common and as
such it should be more practical or feasible to monitor their abundance and response to SGD and
thirdly, these species have been identified as being important or indicative of certain impacts due to
their specific characteristics or vulnerabilities.
• Tortoises are widespread across the Karoo and are vulnerable to roadkill as well as illegal
collection for food or trade. Tortoises are not highly mobile and as such, are representative of the
local area equivalent to their home range, up to around 100 ha for the Leopard Tortoise,
Stigmochelys pardalis (McMaster & Downs 2009). Tortoise movement and abundance is
relatively easily assessed through radio tracking as well as mark-recapture studies and due to their
longevity, lend themselves to long-term monitoring. As tortoises are present across the whole
SGD area, they are identified as potentially good indicators of SGD impact across the whole study
area.
• Aardvark are relatively wide ranging with average home ranges of 3.5 km2 (van Aarde et al.
1992) and occur across the entire SGD area. This species is considered especially important as it
creates fine-scale disturbance which is important for vegetation dynamics in arid ecosystems and
its disused burrows are also used by a wide variety of other organisms including Ant-eating Chat,
Porcupine, Aardwolf, tortoises, foxes, and various other small mammals and birds. As it has a
moderately-sized home range, it is indicative of processes operating at the farm level and
probably occurs at a relatively low but consistent density across the Karoo. This species is likely
to be vulnerable to disturbance, poaching and roadkill and as it is generally not persecuted by
farmers.
• Other animals of potential importance for monitoring include Bat-eared Foxes, which are
particularly vulnerable to roadkill; Steenbok, which are common, widely distributed small
antelope vulnerable to poaching; Riverine Rabbits which are Critically Endangered and indicative
of riparian vegetation condition within the Central Karoo. Kudu are not present across the whole
study area, but occupy the majority of the east and central part of the study area. Kudu are wide-

CHAPTER 7: BIODIVERSITY AND ECOLOGICAL IMPACTS
Page 7-60
ranging and not restricted by standard livestock fencing and tend to avoid noise and disturbance.
As such they are likely to be good indicators of disturbance impacts on sensitive species.
The above examples focus largely on fauna, but there are likely a range of plant species that are also
useful indicators, but these vary more across the study area and as such, there are likely to be a
number of such species that would be useful depending on the exact location of SGD activity. Species
that are likely to be useful indicators are species that are habitat specialists or are used for medicinal
purposes or sought after by collectors. Potential target species include Boophone disticha, Pelagonium
sidoides, the various cycads that occur within the study area, Dioscorea elephantipes, Gasteria spp.
Euphorbia spp. and Pleiospilos spp. and other dwarf succulents.
Our limited knowledge of the species that inhabit the aquatic ecosystems of the more arid parts of
the SGD study area, their ranges, population sizes, and habitat requirements, is a constraint on the
determination of the best aquatic indicator species. In the absence of spatially comprehensive records
of aquatic faunal species, assessments of the condition of aquatic ecosystems in South Africa tend to
focus more on community composition at a taxonomic level higher than species. Knowledge of the
distribution, densities and sensitivity of key indicator species is limited. This is particularly so for
lentic (non-flowing water) species, and those that occur in the ephemeral aquatic ecosystems
characteristic of the more arid parts of the study area. The collection of baseline data from these
ecosystems is essential for the determination of indicator species. For instance, diatoms, which occur
in wetlands and in rivers and are biotic indicators in comprehensive Ecological Reserve studies, can
be collected and identified during the dry or wet phases, and are possibly good indicators of
disturbance (Taylor et al., 2007). Zooplanktonic groups hatch and breed rapidly after the inundation of
wetlands and rivers, and the succession of species throughout the wet phase are likely to respond to
changes in water quality and quantity.
In the more mesic parts of the study area, sensitive fish species such as the Eastern Cape Redfin,
Pseudobarbus afer; the Cape Rocky, Sandelia bainsii; Barbus trevelyani; Pseudobarbus asper and
the Amatola Barb, Barbus amatolicus, are likely to be good indicators of changes in water quality and
quantity in watercourses. The sensitive damselfly species, the Kubusi stream-damsel, Metacnemis
valida, and the Basking malachite, Chlorolestes apricans are also restricted species that should be
monitored. Several other riverine macro-invertebrate families, such as the Heptageniid mayflies and
Notonemourid stoneflies, are known to be sensitive to deterioration in water quality and are thus
suitable indicator species in perennial rivers, where their distribution is well documented.
CHAPTER 7: BIODIVERSITY AND ECOLOGICAL IMPACTS
Page 7-61
7.4.2.3 Monitoring standards & approaches
The overall aim and purpose of monitoring shale gas activities in the Karoo should be to minimise,
control and mitigate the impacts associated with SGD (Esterhuyse et al., 2014). As such, it is critical
that monitoring is based on reliable baseline data as well as explicit statements on limits of acceptable
change and the actions that should be taken when these limits are breached (Lindenmayer et al.,
2013). However, there is a high risk that monitoring programs will fail to detect when a threshold has
been breached and a consequent failure to implement interventions timeously. Consequently,
monitoring programs must explicitly evaluate their ability to actually detect directional change against
the backdrop of the high natural variability of arid systems (Fairweather, 1991). This ability needs to
conform to a predefined standard and inform the intensity of monitoring required. As the natural
variability of a system will influence how many samples are required to achieve the desired level of
statistical power, the specific details of the required sample sizes will only become apparent with
baseline monitoring. Using the initial results of baseline studies to define the final sampling protocol
to be used in the long-term, is one of the most important aspects of adaptive management that should
be implemented for monitoring SGD. Exactly what the desired thresholds for the statistical power of a
monitoring program should be, cannot be defined here, but must represent a compromise between
sampling effort and the consequences of failing to detect a decline beyond a certain specified
threshold. For species of high conservation concern or significant ecological role, the bar should be
set higher than for less important species or processes. By way of example, for a species of significant
concern, a monitoring program could implement a level of sampling intensity that would provide a
75% chance of detecting a 30% drop in the population and a 90% chance of detecting a 50% drop,
whichever yields the greatest sample effort. The thresholds used would correspond to those limits of
acceptable change defined in Table 7.6.
Ultimately for monitoring to inform management and policy, it must be question driven, and if one is
to identify potential interventions triggered when limits of acceptable change are breached, then these
have to be underpinned by conceptual models of how the system works (Lindenmayer & Likens,
2010). In the context of the Karoo there are many unknown variables, and a coordinated approach is
required to address the fundamental knowledge gaps in the face of SGD. Furthermore, in order to
ensure that cumulative and emergent impacts are not overlooked through single SGD applications, an
over-arching research and monitoring agenda should be developed. Salient variables, indicators and
approaches are listed below in Table 7.9. Through the monitoring and study of these variables, the
impacts of SGD can be better understood and more effective mitigation and avoidance measures
developed and implemented.

CHAPTER 7: BIODIVERSITY AND ECOLOGICAL IMPACTS
Page 7-62
Table 7.9: Additional information on species and features that could be monitored, with indicators and possible study approaches. Ideally a basket of indicators selected from each level of the hierarchy should be used in an integrated way, based on the characteristics of the receiving environment and assessed risks and impacts for that area.
Target Examples of target taxa/features Indicators Sample approaches
Species • Local endemics • Threatened species • Ecologically important species
• Density • Sub-population numbers • Age-structure • Reproductive success
• Mark-recapture studies • Camera trapping • Fixed-effort counts • Repeat photography • Roadkill/mortality counts
Habitats
• Quartz patches • Pans • Drainage lines • Localised habitats and landscape features
• Extent • Counts • Composition • Diversity
• Fine-scale mapping • Repeat photography • Fixed plots
Terrestrial ecosystems • Vegetation types • Broad plant communities • Medium- to large faunal community
• Extent • Fragmentation • Diversity • Predator-prey ratios • Grazing pressure
• Remote sensing/satellite imagery • Camera trapping • Collars/satellite tracking • Fixed plots
Aquatic ecosystems
• Water-dependent ecosystems • Riparian vegetation • Pans • Aquatic fauna
• Discharge (rivers) • Water depth (wetlands) • Silt loads in rivers • Water quality • Stream flow • Topsoil loss rates & distribution • Species presence/absence/abundance • South African Scoring System
• Vadose zone monitoring • Fixed riparian plots • Flow rates of springs • Rapid Habitat Assessment Method or
Index of Habitat Integrity (rivers) • EcoStatus indicators (rivers: riparian
vegetation, invertebrates, fish), • WET-Health (wetlands: geomorphology,
hydrology, vegetation)
Broad-scale processes • Wide-ranging mammals • Large birds • Predators
• Dispersal • Connectivity • Gene flow
• Mark-recapture • DNA studies • Collars/satellite tracking
CHAPTER 7: BIODIVERSITY AND ECOLOGICAL IMPACTS
Page 7-63
7.5 Gaps in knowledge
The map of EBIS and the overall assessment presented in this assessment are based on the best
available data. However, data gaps and limitations remain, especially in relation to species
information, impacts on ecological infrastructure, understanding of complex ecological interactions
and feedback including trophic cascades, and knowledge of distributions of key features such as
wetlands and groundwater dependent ecosystems. Given these uncertainties; use of the precautionary
principle when making decisions about SGD is recommended.
In general, species occurrence data are fragmented across several different collection institutions (e.g.
museums, South African Institute for Aquatic Biodiversity (SAIAB), Agricultural Research Council
(ARC)), different formats are used for the data, and for locality data the levels of accuracy for co-
ordinates vary. The exceptions to this are where SANBI or other Threatened Species projects have
compiled integrated datasets across institutions, and cleaned and geo-referenced these. This is the case
for reptiles and butterflies, and threatened and restricted range plants. There is only a limited amount
of data for the area in general and it is under sampled for all taxa. This limits data availability and
usefulness for the SGD scientific assessment. There is also incomplete knowledge of ecological
requirements of many species of special concern, as well as interactions, cascading effects and
impacts on processes. Should SGD proceed, it will be critical to improve the comprehensiveness and
coverage of data on threatened- and keystone species.
The map of wetlands used in this assessment is based on the National Wetland Map (2011 version),
which was edited and supplemented by limited newly digitised wetland data from SPOT imagery, as
well as newly available data on dry river beds. However, there are still gaps in the map of wetlands.
Data on hydrological areas are inconsistent across the study area, and ideally data quality should be
improved. At such time as the National Wetland Map is updated, the new map should be used to
revise the identification of areas of EBIS.
These data limitations mean that the current map of EBIS is appropriate for broad-scale planning, but
not for fine-scale identification of sensitive features that may be present at a particular site. As such,
the map provided here does not negate the need for specialist input when development is proposed or
is taking place at a site level. Within any particular area, there are likely to be sensitive habitats and
species present and specialist input should be obtained for any shale gas-related development, and
mitigation and avoidance measures should be implemented as appropriate. This may require
additional mapping of sensitive features at a fine scale (e.g. 1:10 000) to support EIA and local-level
decision-making processes.

CHAPTER 7: BIODIVERSITY AND ECOLOGICAL IMPACTS
Page 7-64
In addition to these data limitations in relation to the map of EBIS, there are limitations with regard to
knowledge of the potential impacts of SGD on biodiversity and ecology. Impacts related to SGD are
not well known anywhere in the world and completely unknown in South Africa. As a result, many of
the presumed impacts are based on theoretical considerations and impacts associated with other
similar industries. However, factors that make SGD unique and different from most other typical
forms of development include the following:
• The very high traffic volumes that are required to bring the large amount of material that is
required for SGD to site on a continuous basis. This may result in long-term impacts on and
declines in sensitive species. As there are various different avenues by which traffic can
generate impact, such as through noise, vibration, direct disturbance, and collision, it is
difficult to predict the identity and severity of impact on all affected species.
• The potential extent and dispersed nature of SGD is comparatively large relative to other
types of development that could take place in the Karoo. As a result, many impacts that would
otherwise be confined to a small area may occur over a broad area and the cumulative impact
of this may be large. Furthermore, some impacts such as disturbance or noise may extend well
beyond the footprint of the development itself, and when the development occurs in a
dispersed manner across the landscape as in SGD there may be few refuges remaining for
sensitive species. There is also poor knowledge about specific species’ responses to impacts
(e.g. light impacts on nocturnal species and communities, and soil vibrations impact on
ground-living species).
Another key knowledge gap is the lack of a conceptual model of the relationships between
groundwater, aquatic ecosystems and climate in the study area. Monitoring is needed to collect
information for baselines and trends in this regard. This means that there is not yet sufficient
knowledge to set critical thresholds for abstraction and pollution of groundwater in relation to impacts
on surface water ecosystems. This is also highlighted in Hobbs et al. (2016).
The above limitations notwithstanding the map of EBIS and accompanying risk assessment table
(Table 7.7), together with the recommended mitigation measures, constitute a sound resource for
limiting the impacts of SGD on the biodiversity and ecology of the Karoo. In addition, use of the
precautionary principle when making decisions on SGD is recommended. The knowledge gaps
discussed above reinforce the importance of securing EBIS-1 and EBIS-2 areas to ensure that, even if
there are significant unforeseen impacts in the areas which are developed, the overall functioning and
ecological integrity of the Karoo is maintained.

CHAPTER 7: BIODIVERSITY AND ECOLOGICAL IMPACTS
Page 7-65
7.6 Acknowledgements
This assessment is the product of collaboration between many people. The integrating author role was
shared jointly and equally between Stephen Holness and Amanda Driver. Stephen’s role included
leading the spatial analysis of ecological and biodiversity importance and sensitivity. Major inputs
from the contributing authors included Simon Todd on terrestrial ecology of the Karoo; Kate Snaddon
on freshwater ecology of the Karoo; Michelle Hamer and Domitilla Raimondo on species, which
involved synthesising all the species information for the study area; and Fahiema Daniels on spatial
data and mapping.
The integrating and contributing authors would like to thank the many corresponding authors for their
valuable contributions. Richard Dean provided the section on avifaunal (bird) species in the
assessment. Andrew Skowno developed the integrated habitat map that was used as the basis for the
spatial analysis. Kedibone Lamula and Norma Malatji contributed to improving the mapping of
wetlands and dry river beds. Ismail Ebrahim organised inputs from botanical specialists and together
with Lize von Staden managed the process of producing spatial data for endemic plant species.
Hlengiwe Mtshali and Dewidine van der Colff georeferenced records for endemic plant species.
Mahlatse Kgatla and Given Leballo assisted with mapping animal species.
Data and input on species came from a wide range of experts: Graham Alexander, Bill Branch,
Werner Conradie and Krystal Tolley contributed the reptile and amphibian information; Corey
Bazelet contributed data and input on the Orthoptera (grasshoppers); Roger Bills and Albert Chakona
provided input on fish and Willem Coetzer provided data from the SAIAB databases and performed
some preliminary analysis on the fauna; Christy Bragg and Dave Gaynor provided input on mammals;
Jonathan Colville provided input and data for insects; Connal Eardley provided input and data on
bees; Andre Coetzer and Herman Staude assisted with extracting lepidopteran data; Dave Edge and
Silvia Mecenero provided data and analyses for butterflies; Simon Gear provided input on birds; Dai
Herbert provided data on terrestrial snails; John Midgley provided data from the Albany Museum
collections for insects; Musa Mlambo provided data from the Albany Museum collections for
freshwater invertebrates; and also gave input on invertebrates in ephemeral waterbodies; Mervyn
Mansell provided data on the Neuroptera; Robin Lyle provided data for the mygalomorph spiders;
Simon van Noort provided input on insects; John Simaika provided information on dragonflies and
Les Underhill provided data and input on birds. For the plants, Peter Bruyns provided data on the
Apocynaceae and Vincent Ralph Clarke provided data for the Great Escarpment Mountains. The input
of Graham Kerley (NMMU), Marinda Koekemoer (SANBI) and Cornelia Klak (UCT) in expert
workshops is appreciated. Sue Milton, independent botanical consultant, is thanked for participating

CHAPTER 7: BIODIVERSITY AND ECOLOGICAL IMPACTS
Page 7-66
in the workshop and also for providing information on priority sites for plants. Dr Helga van der
Merwe provided advice on sampling sites for field work.
The integrating and contributing authors would also like to that the peer reviewers of the chapter;
Margaret Brittingham, Karen Esler, Timm Hoffman, Joe Kiesecker, and Sue Milton-Dean, for their
valuable comments and insights.
Photographs were provided by Simon Todd.
7.7 References
Allan D.G., Seaman, M.T. & Kaletja, B. 1995. The endorheic pans of South Africa. In: Cowan, G.I. (ed), Wetlands of South Africa. Department of Environmental Affairs and Tourism, Pretoria, South Africa. 75-101.
Anderson, M.D. 2000. The status of flamingos in the Northern Cape Province, South Africa. Ostrich, 71, 425-437.
Andrews, K.M., & Gibbons, J.W. 2005. How do highways influence snake movement? Behavioral responses to roads and vehicles. Copeia, 4, 772-782.
Andrews, K.M., Whitfield Gibbons, J. & Jochimsen, D. 2008. Ecological effects of roads on amphibians and reptiles: a literature review. Herpetological Conservation, 3, 121-143.
Barber, J.R., Crooks, K.R. & Fristrup, K.M. 2010. The costs of chronic noise exposure for terrestrial organisms. Trends in Ecology & Evolution, 25(3), 180-189.
Berliner, D. & Desmet, P. 2007. Eastern Cape Biodiversity Conservation Plan Handbook.
Blickley, J.L., Blackwood, D. & Patricelli, G.L. 2012. Experimental evidence for the effects of chronic anthropogenic noise on abundance of Greater Sage-Grouse at leks. Conservation Biology, 26, 461–471.
Boardman, J., Parsons, A.J., Holland, R., Holmes, P.J. & Washington, R. 2003. Development of badlands and gullies in the Sneeuberg, Great Karoo, South Africa. Catena, 50(2), 165-184.
Bragg, C.J., Donaldson, J.D. & Ryan, P.G. 2005. Density of Cape porcupines in a semi-arid environment and their impact on soil turnover and related ecosystem processes. Journal of Arid Environments, 61(2), 261-275.
Bredenkamp, C.L. In prep. A Flora of the Eastern Cape Province. Strelitzia. South African National Biodiversity Institute, Pretoria.
Brittingham, M.C., Maloney, K.O., Farag, A.M., Harper, D.D. & Bowen, Z.H. 2014. Ecological risks of shale oil and gas development to wildlife, aquatic resources and their habitats. Environmental Science & Technology, 48(19), 11034-11047.
Brooks, M.L. & Berry, K.H. 2006. Dominance and environmental correlates of alien annual plants in the Mojave Desert, USA. Journal of Arid Environments, 67, 100-124.
Brooks, M.L. 2000. Competition between alien annual grasses and native annual plants in the Mojave Desert. The American Midland Naturalist, 144(1), 92-108.
Brownlie, S. 2005. Guideline for Involving Biodiversity Specialists in EIA Processes: Edition 1. CSIR Report No ENV-S-C 2005 053 C. Republic of South Africa, Provincial Government of the Western Cape, Department of Environmental Affairs & Development Planning, Cape Town.
Burke, A., Esler, K.J., Pienaar, E. & Barnard, P. 2003. Species richness and floristic relationships between mesas and their surroundings in southern African Nama Karoo. Diversity and Distributions, 9(1), 43-53.

CHAPTER 7: BIODIVERSITY AND ECOLOGICAL IMPACTS
Page 7-67
Burns, M., Atkinson, D., Barker, O., Davis, C., Day, L., Dunlop, A., Esterhuyse, S., Hobbs, P., McLachlan, I., Neethling, H., Rossouw, N., Todd, S., Snyman-Van der Walt, L., Van Huyssteen, E., Adams, S., de Jager, M., Mowzer, Z. and Scholes, R. 2016. Scenarios and Activities. In Scholes, R., Lochner, P., Schreiner, G., Snyman-Van der Walt, L. and de Jager, M. (eds.). 2016. Shale Gas Development in the Central Karoo: A Scientific Assessment of the Opportunities and Risks. CSIR/IU/021MH/EXP/2016/003/A, ISBN 978-0-7988-5631-7
Cadman, M., Petersen, C., Driver, A., Sekhran, N., Maze, K. & Munzhedzi, S. 2010. Biodiversity for Development: South Africa’s Landscape Approach to Conserving Biodiversity and Promoting Ecosystem Resilience. South African National Biodiversity Institute, Pretoria.
Carrick, P.J. & Krüger, R. 2007. Restoring degraded landscapes in lowland Namaqualand: Lessons from the mining experience and from regional ecological dynamics. Journal of Arid Environments, 70(4), 767-781.
Chevallier, L., Gibson, L.A., Nhleko, L.O., Woodford, A.C., Nomquphu, W. & Kippie, I. 2004. Hydrogeology of Fractured-rock Aquifers and Related Ecosystems within the Qoqodala Dolerite Ring and Sill Complex, Great Kei Catchment, Eastern Cape. Water Research Commission Report No. 1238/1/05, Pretoria, 126 pp.
Clark, R.W., Brown, W.S., Stechert, R. & Zamudio, K.R. 2010. Roads, interrupted dispersal, and genetic diversity in timber rattlesnakes. Conservation Biology, 24(4), 1059-1069.
Collinson, W., Parker, D., Patterson-Abrolat, C., Alexander, G. & Davies-Mostert, H. 2015. Setjhaba SA, South Africa: A South African perspective of an emerging transport infrastructure. In: van der Ree, R., Smith, D.J. & Grilo, C. Handbook of Road Ecology. Wiley Blackwell, Chichester. pp 439-447.
Collinson, W.J., Parker, D.M., Bernard, R.T., Reilly, B.K., & Davies-Mostert, H.T. 2015. An inventory of vertebrate roadkill in the greater Mapungubwe Transfrontier conservation area, South Africa. South African Journal of Wildlife Research, 45(3), 301-311.
Colvin, C., le Maitre, D., Saayman, I. & Hughes, S. 2007. Aquifer Dependant Ecosystems in Key Hydrogeological Typesettings in South Africa. Report for the Water Research Commission by Natural Resources and the Environment, CSIR. Water Research Commission Report No TT301/07.
Cowling, R.M., Esler, K.J., Midgley, G.F. & Honig, M.A. 1994. Plant functional diversity, species diversity and climate in arid and semi-arid southern Africa. Journal of Arid Environments, 27(2), 141-158.
Daniels, S.R., Dambire, C., Klaus, S. & Sharma, P.P. 2016. Unmasking alpha diversity, cladogenesis and biogeographical patterning in an ancient panarthropod lineage (Onychophora: Peripatopsidae: Opisthopatus cinctipes) with the description of five novel species. Cladistics DOI: 10.1111/cla.12154.
De Villiers, C., Driver, A., Clarke, B., Euston-Brown, D., Day, L., Job, N., Helme, N., Holmes, P., Brownlie, S. & Rebelo, T. 2005. Fynbos Forum Ecosystem Guidelines for Environmental Assessment in the Western Cape. Botanical Society of South Africa, Cape Town.
Dean, W.R.J, Milton, S.J. & Anderson, M.D. 2006. Use of road kills and roadside vegetation by Pied and Cape Crows in semi-arid South Africa. Ostrich, 77,102-104.
Dean, W.R.J. & Milton, S.J. 2001. The density and stability of birds in shrublands and drainage line woodland in the southern Karoo, South Africa. Ostrich, 72, 185-192.
Dean, W.R.J. & Milton, S.J. 2003. The importance of roads and road verges for raptors and crows in the Succulent and Nama-Karoo, South Africa. Ostrich, 74(3&4), 181-186.
Dean, W.R.J. 1995. Where Birds are Rare or Fill the Air: the Protection of the Endemic and the Nomadic Avifaunas of the Karoo. PhD thesis, Zoology Dept, University of Cape Town. 298 pp.
Department of Environmental Affairs (DEA), Department of Mineral Resources, Chamber of Mines, South African Mining and Biodiversity Forum, & South African National Biodiversity Institute. 2013. Mining and Biodiversity Guideline: Mainstreaming Biodiversity into the Mining Sector. Pretoria. 100pp.
Department of Environmental Affairs (DEA). 2015a. South Africa’s 2nd National Biodiversity Strategy and Action Plan, 2015 – 2025. Pretoria, Department of Environmental Affairs.
Department of Environmental Affairs (DEA). 2015b. Strategic Environmental Assessment for Wind and Solar Photovoltaic Energy in South Africa. CSIR Report Number: CAIR/CAS/EMS/ER/2015/B. Stellenbosch.

CHAPTER 7: BIODIVERSITY AND ECOLOGICAL IMPACTS
Page 7-68
Desmet, P. & Marsh, A. 2008. Namakwa District Biodiversity Sector Plan.
Driver, A., Sink, K.J., Nel, J.L., Holness, S.H., Van Niekerk, L., Daniels, F., Jonas, Z., Majiedt, P.A., Harris, L. & Maze, K. 2012. National Biodiversity Assessment 2011: An Assessment of South Africa’s Biodiversity and Ecosystems. Synthesis report. South African National Biodiversity Institute & Department of Environmental Affairs, Pretoria.
Dzikiti, S., Schachtschneider, K., Naiken, V., Gush, M., Moses, G. & Le Maitre, D.C. 2013. Water relations and the effects of clearing invasive Prosopis trees on groundwater in an arid environment in the Northern Cape, South Africa. Journal of Arid Environments, 90, 103-113.
Epps, C.W., Palsbøll, P.J., Wehausen, J.D., Roderick, G.K., Ramey, R.R. & McCullough, D.R. 2005. Highways block gene flow and cause a rapid decline in genetic diversity of desert bighorn sheep. Ecology Letters, 8(10), 1029-1038.
Esterhuyse, S., Avenant, M., Watson, M., Redelinghuys, N., Kijko, A., Glazewski, J. & Vos, A.T. 2014. Development of an Interactive Vulnerability Map and Monitoring Framework to Assess the Potential Environmental Impact of Unconventional Oil and Gas Extraction by Means of Hydraulic Fracturing. Water Research Commission Report No. 2149/1, 14 pp.
Fairweather, P.G. 1991. Statistical power and design requirements for environmental monitoring. Marine and Freshwater Research, 42(5), 555-567.
Farwell L.S., Wood, P.B. & George, G.A. 2016. Shale gas development effects on the songbird community in a central Appalachian forest. Biological Conservation, 201, 78-91.
Gauthreaux Jr, S.A. & Belser, C.G. 2006. Effects of artificial night lighting on migrating birds. In: Rich, C. & Longcore, T (eds). Ecological Consequences of Artificial Night Lighting. Island Press, Washington, DC, USA, pp 67-93.
Gavin, S.D. & Komers, P.E. 2006. Do pronghorn (Antilocapra americana) perceive roads as predation risk? Canadian Journal of Zoology, 84, 1775–1780.
Gelbard, J.L. & Belnap, J. 2003. Roads as conduits for exotic plant invasions in a semiarid landscape. Conservation Biology, 17, 420–432.
Gibson, L.A. 2003. The Detection of Wetlands Using Remote Sensing in Qoqodala, Eastern Cape. Masters thesis. School of Architecture, Planning and Geomatics, University of Cape Town.
Government of South Africa. 2010. National Protected Area Expansion Strategy 2008: Priorities for Expanding the Protected Area Network for Ecological Sustainability and Climate Change Adaptation. Government of South Africa, Pretoria.
Hamer, M. & Rayner, N.A. 1996. A note on the unusual crustacean community of a temporary pool in the Northern Cape. Southern African Journal of Aquatic Sciences, 22, 100-104.
Hein, C.D. 2012. Potential impacts of shale gas development on bat populations in the northeastern United States. Austin, Texas: Bat Conservation International.
Hobbs, P., Day, E., Rosewarne, P., Esterhuyse, S., Schulze, R., Day, J., Ewart-Smith, J., Kemp, M., Rivers-Moore, N., Coetzee, H., Hohne, D., Maherry, A. and Mosetsho, M. 2016. Water Resources. In Scholes, R., Lochner, P., Schreiner, G., Snyman-Van der Walt, L. and de Jager, M. (eds.). 2016. Shale Gas Development in the Central Karoo: A Scientific Assessment of the Opportunities and Risks. CSIR/IU/021MH/EXP/2016/003/A, ISBN 978-0-7988-5631-7
Hoffman, M.T. & Cowling, R.M. 1990. Vegetation change in the semi-arid eastern Karoo over the last 200 years: an expanding Karoo-fact or fiction? South African Journal of Science, 86(7-10), 286-294.
Jones, I.L., Bull, J.W., Milner‐Gulland, E.J., Esipov, A.V. & Suttle, K.B. 2014. Quantifying habitat impacts of natural gas infrastructure to facilitate biodiversity offsetting. Ecology and Evolution, 4(1), 79-90.
Jones, N.F., Pejchar, L. & Kiesecker, J.M. 2015. The energy footprint: how oil, natural gas, and wind energy affect land for biodiversity and the flow of ecosystem services. BioScience, DOI: 10.1093/biosci/biu224224.
Kiviat, E. 2013. Risks to biodiversity from hydraulic fracturing for natural gas in the Marcellus and Utica shales. Annals of the New York Academy of Sciences, 1286, 1–14.

CHAPTER 7: BIODIVERSITY AND ECOLOGICAL IMPACTS
Page 7-69
Lindenmayer, D.B. & Likens, G.E. 2010. The science and application of ecological monitoring. Biological Conservation, 143(6), 1317-1328.
Lindenmayer, D.B., Piggott, M.P. & Wintle, B.A. 2013. Counting the books while the library burns: why conservation monitoring programs need a plan for action. Frontiers in Ecology and the Environment, 11(10), 549-555.
Lloyd, J.W. & Le Roux, A. 1985 A Conservation Assessment of the Verneukpan-Copperton Area. Department of Nature and Environmental Conservation, Cape Town, South Africa.
Macdonald, I.A.W. & Macdonald, S.A. 1985. The demise of the solitary scavengers in southern Africa - the early rising crow hypothesis. In: Bunning, L.J. (Ed.) Proceedings of the Birds and Man Symposium. Witwatersrand Bird Club, Johannesburg. pp 321-335.
Magee, A.R. & Boatwright, J.S. (eds). In prep. Plants of the Karoo: A Conspectus of the Nama-Karoo and Adjacent Summer-Rainfall Regions of the Northern and Western Cape Provinces. Strelitzia. South African National Biodiversity Institute, Pretoria.
Malan, G. 1992. Nest-lining used by Pale Chanting Goshawks in the Little Karoo, South Africa. Gabar, 7, 56-61.
McMaster, M.K. & Downs, C.T. 2009. Home range and daily movement of leopard tortoises (Stigmochelys pardalis) in the Nama-Karoo, South Africa. Journal of Herpetology, 43(4), 561-569.
Mecenero S., Ball J.B., Edge D.A., Hamer M.L., Henning G.A., Krüger M., Pringle E.L., Terblanche R.F. & Williams M.C. (eds). 2013. Conservation Assessment of Butterflies of South Africa, Lesotho and Swaziland: Red List and Atlas. Saftronics, Johannesburg and Animal Demography Unit, Cape Town.
Milton, S.J. & Hoffman, M.T. 1994. The application of state‐and‐transition models to rangeland research and management in arid succulent and semi‐arid grassy Karoo, South Africa. African Journal of Range & Forage Science, 11(1), 18-26.
Minter, L.R., Burger, M., Harrison, J.A., Braack, H.H., Bishop, P.J. & Kloepfer, D. 2004. Atlas and Red Data Book of the Frogs of South Africa, Lesotho and Swaziland. SA/MAB series 9, 360 pp.
Mortensen, D.A. Rauschert, E.S., Nord, A.N. & Jones, B.P. 2009. Forest roads facilitate the spread of invasive plants. Invasive Plant Science and Management, 2(3), 191-199.
Mucina, L. & Rutherford, M.C. (eds). 2006. The Vegetation of South Africa, Lesotho and Swaziland. Strelitzia 19. South African National Biodiversity Institute, Pretoria.
Mucina, L., Rutherford, M.C., Palmer, A.R., Milton, S.J., Scott, L., Lloyd, J.W., ... & Euston-Brown, D.I. W. 2006. Nama-Karoo biome. The Vegetation of South Africa, Lesotho and Swaziland. Strelitzia, 19, 324-347.
Ndhlovu, T., Milton-Dean, S.J. & Esler, K.J. 2011. Impact of Prosopis (mesquite) invasion and clearing on the grazing capacity of semiarid Nama Karoo rangeland, South Africa. African Journal of Range & Forage Science, 28(3), 129-137.
Nel J.L., Driver A., Strydom W., Maherry A., Petersen C., Roux D.J., Nienaber S., van Deventer H, Smith-Adao L.B. & Hill L. 2011. Atlas of Freshwater Ecosystem Priority Areas in South Africa: Maps to Support Sustainable Development of Water Resources. WRC Report No. TT 500/11, Water Research Commission, Pretoria.
Nhleko, O.L. 2003 Implications of the Geological Structure of The Qoqodala Dolerite Ring Complex For Groundwater Dynamics. Masters thesis. Department of Earth Sciences, Faculty of Natural Sciences, University of the Western Cape, Cape Town.
Oberholzer, B., Lawson, Q., Klapwijk, M., Young, G., Anderson, M. and Orton, J. 2016. Visual, Aesthetic and Scenic Resources. In Scholes, R., Lochner, P., Schreiner, G., Snyman-Van der Walt, L. and de Jager, M. (eds.). 2016. Shale Gas Development in the Central Karoo: A Scientific Assessment of the Opportunities and Risks. CSIR/IU/021MH/EXP/2016/003/A, ISBN 978-0-7988-5631-7
Oettle, N., Lindeque, L., du Toit, J., Samuels, I., Osler, A., Vetter, S. and van Garderen, E.A. 2016. Impacts on Agriculture. In Scholes, R., Lochner, P., Schreiner, G., Snyman- Van der Walt, L. and de Jager, M. (eds.). 2016. Shale Gas Development in the Central Karoo: A Scientific Assessment of the Opportunities and Risks. CSIR/IU/021MH/EXP/2016/003/A, ISBN 978-0-7988-5631-7

CHAPTER 7: BIODIVERSITY AND ECOLOGICAL IMPACTS
Page 7-70
Pimentel, D., McNair, S., Janecka, J., Wightman, J., Simmonds, C., O’Connell, C. & Tsomondo, T. 2001. Economic and environmental threats of alien plant, animal, and microbe invasions. Agriculture, Ecosystems & Environment, 84(1), 1-20.
Ramirez Jr, P. 2009. Reserve pit management: risks to migratory birds. Cheyenne (WY): US Fish and Wildlife Service.
Richardson, D.M. & Van Wilgen, B.W. 2004. Invasive alien plants in South Africa: how well do we understand the ecological impacts? South African Journal of Science, 100, 45-52.
Robbins, K. 2013. Awakening the Slumbering Giant: how horizontal drilling technology brought the endangered species act to bear on hydraulic fracturing. Case Western Reserve Law Review, 63(4), 13-16.
Sawyer, H., Nielson, R.M., Lindzey, F. & McDonald, L.L. 2006. Winter habitat selection of mule deer before and during development of a natural gas field. Journal of Wildlife Management, 70(2), 396-403.
Schmitt, M.B., Baur, S. & von Maltitz, F. 1987. Observations on the Jackal Buzzard in the Karoo. Ostrich, 58, 97-102.
Seeliger, L., de Jongh, M., Morris, D., Atkinson, D., du Toit, K. and Minnaar, J. 2016. Impacts on Sense of Place. In Scholes, R., Lochner, P., Schreiner, G., Snyman- Van der Walt, L. and de Jager, M. (eds.). 2016. Shale Gas Development in the Central Karoo: A Scientific Assessment of the Opportunities and Risks. CSIR/IU/021MH/EXP/2016/003/A, ISBN 978-0-7988-5631-7
Siegfried, W.R. 1963. A preliminary evaluation of the economic status of Corvidae and their control on sheep farms in the Great Karoo. CDNEC Investigational Report 4:1-16.
Skinner, J.D. & Chimimba, C.T. 2005. The Mammals of the Southern African Sub-region. Cambridge University Press.
Skowno, A.L., Holness, S.D. & Desmet, P. 2009. Biodiversity Assessment of the Central Karoo District Municipality. DEAP Report EADP05/2008
Snijman D.A. (ed.). 2013. Plants of the Greater Cape Floristic Region, Vol. 2: the Extra Cape Flora. Strelitzia 30. South African National Biodiversity Institute, Pretoria.
South African National Biodiversity Institute (SANBI). 2013. Ecological infrastructure: nature delivering services. SANBI Factsheet, August 2013, 2nd edition. 4pp.
South African National Biodiversity Institute (SANBI). 2015. The Business Case for Biodiversity Stewardship. A report produced for the Department of Environmental Affairs. Developed by Cumming, T., Driver, A., Pillay, P., Martindale, G., Purnell, K., McCann, K. & Maree, K. South African National Biodiversity Institute, Pretoria.
Souther, S., Tingley, M., Popescu, V., Hayman, D., Ryan, M., Graves, T. & Terrell, K. 2014. Biotic impacts of energy development from shale: Research priorities and knowledge gaps. Frontiers in Ecology and the Environment, 12(6), 330–338.
Steyn. P. 1982. Birds of Prey of Southern Africa. David Phillip, Cape Town, South Africa.
Taylor J.C., Harding, W.R. & Archibald, C.G.M. 2007. A Methods Manual for the Collection, Preparation and Analysis of Diatom Samples. Water Research Commission Project K5/1588.
Taylor, M.R., Peacock, F. & Wanless, R.M. (eds). 2015. The 2015 Eskom Red Data Book of Birds of South Africa, Lesotho and Swaziland. BirdLife South Africa.
Thenkabail, P.S. 2016. Remote Sensing Handbook; Volume 3: Remote Sensing of Water Resources, Disasters, and Urban Studies.
Todd, S. 2003. Final Report to the Conservation Farming Project, Beaufort West Study Site. http://biodiversityadvisor.sanbi.org/industry-and-conservation/conservation-and-agriculture/agricultural-research/conservation-farming-project/
Todd, S.W., Hoffman, M.T., Henschel, J.R., Cardoso, A.W., Brooks, M. &Underhill. L.G. 2016. The Potential Impacts of Fracking on Biodiversity of the Karoo Basin, South Africa. In: Proposed Hydraulic Fracturing in the Karoo. Juta, Cape Town.

CHAPTER 7: BIODIVERSITY AND ECOLOGICAL IMPACTS
Page 7-71
Toerien, D., du Rand, G., Gelderblom, C. and Saayman, M. 2016. Impacts on Tourism in the Karoo. In Scholes, R., Lochner, P., Schreiner, G., Snyman- Van der Walt, L. and de Jager, M. (eds.). 2016. Shale Gas Development in the Central Karoo: A Scientific Assessment of the Opportunities and Risks. CSIR/IU/021MH/EXP/2016/003/A, ISBN 978-0-7988-5631-7
Trombulak, S.C. & Frissell, C.A. 2000. Review of ecological effects of roads on terrestrial and aquatic communities. Conservation Biology, 14(1), 18-30.
Van Aarde, R.J., Willis, C.K., Skinner, J.D. & Haupt, M.A. 1992. Range utilization by the aardvark, Orycteropus afer (Pallas, 1766) in the Karoo, South Africa. Journal of Arid Environments, 22, 387-394.
Van Wilgen, B.W., Reyers, B., Le Maitre, D.C., Richardson, D.M. & Schonegevel, L. 2008. A biome-scale assessment of the impact of invasive alien plants on ecosystem services in South Africa. Journal of Environmental Management, 89(4), 336-349.
Visser, N., Botha, J.C. & Hardy, M.B. 2004. Re-establishing vegetation on bare patches in the Nama Karoo, South Africa. Journal of Arid Environments, 57(2), 155-177.
Von Der Lippe, M. & Kowarik, I. 2007. Long-distance dispersal of plants by vehicles as a driver of plant invasions. Conservation Biology, 21, 986–996.
Wade, A., Jongens, A. and van Niekerk, W. 2016. Noise Generated by Shale Gas- Related Activities. In Scholes, R., Lochner, P., Schreiner, G., Snyman- Van der Walt, L. and de Jager, M. (eds.). 2016. Shale Gas Development in the Central Karoo: A Scientific Assessment of the Opportunities and Risks. CSIR/IU/021MH/EXP/2016/003/A, ISBN 978-0-7988-5631-7
Wall, J., Vile, M. & Cousins, K. 2013. Shale Gas Development in Australia: Potential Impacts and Risks to Ecological Systems. Australian Council of Learned Academics: Ecological Australia 67 pp.
Wiegand, T. & Milton, S.J. 1996. Vegetation change in semiarid communities. Vegetation, 125(2), 169-183.
Winterbottom, J.M. 1968. A check list of the land and fresh water birds of the western Cape Province. Annals of the South African Museum, 53, 1-276.
Winterbottom, J.M. 1975. Notes on the South African species of Corvus. Ostrich, 46, 236-237.
Woodford, A.C. & Chevallier, L. 2002. Hydrogeology of the Main Karoo Basin: Current Knowledge and Future Research Needs. Water Research Commission Report No TT 179/02, 466 pp.

CHAPTER 7: BIODIVERSITY AND ECOLOGICAL IMPACTS
Page 7-72
7.8 Digital Addenda 7A – 7B
SEPARATE DIGITAL DOCUMENT
Digital Addendum 7A: Species of special concern in the study area
Digital Addendum 7B: Methodology used to identify areas of Ecological and Biodiversity Importance and Sensitivity (EBIS)