chapter · chapter e 1-214. general note. early interest in the statisticsof prices was evident at...
TRANSCRIPT
Chapter
E 1-214. General note.
early interest in the statistics of prices was evident at the be-ginning of the 19th century, with the appearance in 1806 of SamuelBlodgett, A Statistical the United States of America, which included a collection of prices for 16 importantcommodities in 5 markets for Many other contemporaryaccounts contained references t o prices, but the first seriousto summarize comprehensive price for the United States in theform of index numbers was made by Horatio C. Burchard, Directorof the Mint. His report to the Secretary of the Treasury in 1881contained wholesale prices for many individual articles and an indexnumber (which contains some serious inadequacies). In 1886, aspecial report containing retail prices of about 60 “necessaries of life”was included in volume 20 of the Tenth Census, Report on the Statistics
in Industries, by Joseph D. Weeks (usuallycalled the Weeks Report). No summary figures were included inthis volume.
In 1891, a Senate Resolution led to collection of a voluminousbody of data which covered wholesale prices for 1840-1891and retailprices for a 28-month period ending September 1891, for more than200 commodities. The information assembled was summarized byRoland P. Falkner, whose indexes have been widely used as evidence of price changes for 1840-1891. These indexes were prepared as estimates of changes in wage cost of living, but, in actuality,they were indexes of wholesale prices for one month of each year.Their technical adequacy was the subject of considerable controversya t the time, but the deficiencies in the indexes do not detract fromthe historical value of the basic price data collected for the SenateCommittee and published in the “Aldrich Reports,” including Whole-sale Prices, Wages, and Transportation (4 parts), Senate Report No.1394, 1893, and Retail Prices and Wuges (3 parts), Senate Report No. 986, 1592.
In 1900, Roland Falkner extended his indexes to with quota-tions for 142 articles collected by the Department of Labor, with someadjustments in his methods. The results are published in Depart-ment of Labor Bulletin No. 27, Wholesale Prices: 1890 to 1899,237-313. In 1902, the Department of Labor began publication ofits index of wholesale prices, which has continued since withoutinterruption.
Interest in price measurements following the upturn in prices after1897 led to the preparation of a number of wholesale price indexes for the United States, in addition t o the official Department of Laborindex series. John R. Commons published an index of wholesaleprices of 66 commodities for in the Quarterly Bulletin ofthe of Economic Research for July and October 1900.street’s indexes of wholesale prices of about 96 commodities were established in 1897 and carried back t o 1890. Dun’s index numbersof wholesale prices for about 350 commodities were published inDun’s Review on a continuous basis beginning in 1901 and graduallyextended back to 1860. These last 2 series were expressed as sumsof actual prices rather than in the conventional index number form.Several other relatively short-lived series were also compiled duringthe next to years.
After 1902, when the Department of Labor’s wholesale price index was continuously available, additions to wholesale price index numberswere mainly to obtain a better historical perspective. In 1932, theseries of wholesale price indexes for 1720-1932 were completed by
G. F. Warren and F. A. (see series E 52-63). Part of thiswork was done under the auspices of the International ScientificCommittee on Price History referred to below.
Walter B. Smith and Arthur H. Cole computed wholesale com-modity price indexes covering 1792-1862 for Fluctuations AmericanBusiness, Harvard Economic Studies, Harvard UniversityPress, Cambridge, 1935. The series include wholesale commodityprice indexes for Boston, 1792-1820; for Boston, York, andPhiladelphia, and New York (primarily),
Wholesale prices in Cincinnati were assembled from newspapers for 1844-1914 and an index published by Henry E. White in Whole-sale Prices at Cincinnati and New York, University Agricul-tural Experiment Station, Memoir 182, Ithaca, 1935.
The most extensive historical price investigations, however, were undertaken under the auspices of the International Scientific Com-mittee on Price History. The results for 6 important marketingcenters were summarized by Arthur Cole in WholesalePrices in the United States, 861, Harvard University Press,Cambridge, 1938. The historical indexes are given in series E
Wholesale price indexes were compiled by Frederick C. Mills forcommodities grouped according t o economically significant factors.Mills’ studies of price relationships and price movements contain anumber of special indexes which he derived by recombining price relatives for commodities in the Bureau of Labor Statistics in-dexes. These indexes include some special commodity groupingsnot used by BLS, crops, as well as classifications by stage ofprocessing and by durability. Some series were first published by the National Bureau of Economic Research (NBER) for 1890-1931in Economic Tendencies in the No. 21, New York, 1932,
Additional indexes for 1913-1935 appeared in Pricesin Recession and Recovery, NBER, No. 31, New York, 1936, pp.491-547. Indexes through June 1943 were included in an appendixt o Prices in a War Economy, NBER, Occasional Paper No. 12,October 1943, and through March 1948 in The of PostwarPrices, NBER, Occasional Paper No. 27, July 1948.
The volume of information available for wholesale prices is notmatched at the retail level, especially for the early years. The officialConsumer Price Index of the BLS was initiated in with a food index. The Eighteenth Annual Report of the of Labor,
Cost of Living and Retail Prices of Food contained an index ofretail prices of food for 1890-1903 weighted by family consumption in 1901. This food index was continued until the end of World War I,when it became one component group of a comprehensiveliving” index, originated as part of a study of cost of living in ship-building cities in 1918 and 1919. Supplementary price informationhad been collected by the over the years, and a comprehensiveindex was compiled back t o 1913. Since World War I, the index hasundergone a number of changes in coverage and methodology, mostof them in the direction of improvement in the quantity and qualityof data. At present, the index is issued monthly under the officialtitle Consumer Price Index, in brief press releases, in detailed reports,and in the Monthly Labor Review (see text for series
The National Industrial Conference Board also compiled asumer Price Index from 1918 to 1968, This index was similar to theBLS Consumer Price Index but the collection of data was primarilyby mail instead of by personal visit. A description of theindex as it was compiled before discontinuance is included theAugust 1954 issue of Management Record.
183
E 1-122 PRICES PRICE INDEXES
The index numbers of prices received and paid by farmers compiledby the Department of Agriculture were also initiated after WorldWar I; see chapter K, series K 344-353.. Prior to 1913, except for the data in the Weeks Report and the
Reports, readily available retail price data are extremely spottyand inadequate. As a result, many of the indexes widely used toapproximate changes in retail prices, rest entirely or partially onchanges in wholesale prices, A serious limitation in these indexesis that allowance was not made for the slow-moving rents and servicesnor was account always taken of the difference in movement betweenwholesale and retail prices of commodities. Falkner’s indexes re-ferred to above, for example, were calculated entirely from wholesaleprice information. Adjustments t o wholesale price movements com-bined with available BLS retail prices formed the basis for Douglas’index of the cost of living (series 185). The only “cost-of-living”indexes now available for any years before 1913, computed from retail price data, are Wesley Mitchell’s Relative Cost Living for 1860to 1880, the Consumer Price Index for to 1880 compiled by EthelHoover (series E and Rees’ cost-of-living index, 1890-1914(series E 186). The cost-of-living index computed by Wesley C.Mitchell for Gold, Prices, and Wages Under the Greenback Standard,University of California Publications in Economics, vol. 1, Berkeley,March 1908, p. 91, utilized a portion of the retail data in the WeeksReport for 1860-1880. The Mitchell series was included as one of thelinks in the cost-of-living index estimate of the Federal Reserve Bankof New York (series E 183). The Hoover Consumer Price Index for 1851-1880 was based largely on a summarization of all of the usableretail price information from the Weeks Report, with some additionsfrom other sources. The Rees’ cost-of-living index utilized some components of the Douglas’ index, but most of the data were compiledfrom mail-order catalogs, newspapers, and other sources.
Over the years there has been considerable improvement in thequality of the price reporting, in the scope of the data, and in theconstruction of index numbers. The lists of commodities that arenow included in the price collection program cover a wider range ofgoods in the market, and services are represented in the consumerprice indexes. Commodities and services are now defined fairly pre-cisely and the current collection methods give the opportunity ofsecuring supplementary data on discounts, terms of delivery, andother necessary information to measure price change. Data forweighting systems for index numbers can now be taken from thegreatly improved expenditure studies, censuses, and other officialstatistics.
As the indexes and price reports were extended to earlier years,many of these advantages making for better price measures were notpresent. The range of commodities and services for which informa-tion could be obtained from surviving records was very limited. Atthe wholesale level, the commodity coverage was limited primarily t oraw materials and goods in the early stages of processing. Thelimited coverage of finished goods, especially after the Civil War,is an important factor in the interpretation of price changes. Atretail, the available price data were relatively scant and the emphasiswas on food and dry goods prices, with little information for otherless important commodities and for rents and services. The perennialproblem of changes in qualities, changes in consumer tastes, anddemographic and other changes which are still present to some extentin the current indexes, become accentuated as price comparisons aremade over longer periods of time.
The newspapers and other sources from which prices were assembledfor the early years give only brief or vague descriptions for the com-modities quoted and the compiler could not always be assured thatquotations over time were for the same quality. Incomplete files,nominal prices, and nonpublication in some issues were among themany other problems encountered. Data obtained from records ofsurviving firms raise the further question of how well these survivingfirms represented the movement of prices for all firms for the periodunder consideration.
E 1-22. Implicit price deflators for gross national product, 1929-1970.
Source: 1929-1963, U.S. Office of Business Economics, The Na-tional Income and Product Accounts of the United States, 1929-1965;1964-1967, National Income and Product Accounts,tables 8.1 and 8.4; U.S.Bureau of Economic Analysis, Survey of Current Business, July 1972, tables 8.1 and 8.4.
The implicit defiator for total gross national product (GNP) isthe ratio of GNP in current prices to GNP in constant prices. It isa weighted average of the price indexes used t o deflate the componentsof GNP; the implicit weights are expenditures in the current periodvalued in prices of the base year 1958. The implicit deflator measuresthe price change of a particular “market basket” since 1958. How-ever, the market basket for any other period is not necessarily thesame as for the base year 1958. Consequently, a comparison of thedeflator for the current period with any period other than the baseyear measures both the effect of the difference between the weightsin the two periods and the change in the price of a fixed market basket.
The deflation is not performed at the level of individual commodi-ties: components that encompass expenditures on an array of com-modities are deflated. On a quarterly basis, 142 components ofGNP are deflated as shown below.
Gross national product 142Personal consumption expenditures-__ 41Private fixed investment 42Change in business inventories 10Exports 3Imports 3Government purchases of goods and services 43
The components are deflated with conventional, fixed weightedprice indexes that combine price relatives for individual types ofcommodities included in the expenditure component. Therefore, the implicit deflator involves current period weighting among thecomponent price indexes, and fixed weighting within the components.
Differences between changes in the implicit deflator and the fixedweighted indexes are due to the shift in the weights in the implicitdeflator. If the composition of expenditures shifts toward those components that have increased in price at an above-average ratesince the price base period of 1958, the implicit deflator increases more than a fixed weighted index. If the composition shifts in theother direction, the implicit defiator increases less than a fixedweighted index.
Strictly speaking, the implicit deflator increases more (less) thana fixed weighted price index that has as its weight base the initial or terminal period of the span being compared if there is a positive(negative) correlation between the shifts in the weights in the implicitdeflator and the changes since 1958 in the component price indexes. When the fixed weighted index has another period as its weight base,the difference also depends on the shift in the composition of realGNP between the weight base period and the initial or terminal period of the span being compared.
E 23-122. General note.Wholesale price indexes are compiled from prices in primary
markets; that is, prices pertaining t o the first major commercialtransaction for each commodity. The quotations are usually selling prices of manufacturers or producers. A few prices are reported bytrade associations and organized exchanges, and some are taken from trade publications or from other Government agencies which collectquotations as part of their regular work. They are not prices re-ceived by wholesalers, distributors, or jobbers.
In addition t o the indexes presented here, brief descriptions of thecoverage and calculation techniques for other indexes may be foundin G. F. Warren and F. A. Wholesale Prices for Years,1720-1 University Agricultural Experiment Station,Memoir 142, Ithaca, 1932, pp. and in BLS Bulletin No. 284,Index Numbers Wholesale Prices in the United States and Foreign
184

WHOLESALE PRICE INDEXES E 23-51
Countries, 1921, pp.Mitchell’s “The Making and Using of Index Numbers.”
This bulletin also contains Wesley C.
See also general note for series E 1-214.
E 23-39. Wholesale price indexes (BLS), by major product groups,
Source: U.S. Bureau of Labor Statistics, Handbook of Labor Sta-tistics, 2971, Bulletin 1705, p. 276.
The current BLS wholesale price indexes were begun in 1952 butcalculated to 1947, using new samples of items and new weights. However, the official index begins with January 1952, and does notreplace the 1926 base series as the official index for 1947-1951. Thenew series of indexes was spliced to the former series (converted)by linking as of January 1947. The former group indexes werespliced with new ones when the value aggregate of commoditiesin the former group represented 50 percent or more of the value ofshipments in 1947 for all commodities (priced and unpriced) in thegroup. The index has been shown with 1967 as the base year since1971. Prior t o 1971, the period was the base from 1962and the 1947-49 period from 1952 to 1961.
With the revision in 1952, the conceptual definition of the indexwas not altered, but major changes in coverage and methods wereadopted. The list of priced commodities was expanded from 947t o approximately 1,800, embracing nearly 5,000 separate series. By1970, the sample of priced commodities numbered approximately 2,450 and the number of separate price series totaled 7,725. Theclassification scheme in effect from 1952 t o 1970 was revised somewhatin January 1967, providing a more meaningful and flexible structurewithout changing the basic concept of the structure. The 1967scheme substituted a n 8-digit coding system for the former 6- and7-digit system permitting a number of special group indexes to beincluded in the regular classification of the index.
The weighting factors for each commodity represent the value ofshipments for the specific commodity priced and for all others in thesame group which are known (or assumed) to have price movementssimilar to those for the commodity priced. By this method of weight-ing, values for all commodities in a group are accounted for and thegroup automatically has its proper representation in theties index. The weight universe includes the net selling value of allcommodities included in the producing and processing sector of theeconomy including sales for exports and imports consumption butexcluding interplant transfers, military goods, construction, realestate, transportation, securities, printing and publishing, and trans-actions for services.
The indexes are calculated as averages of relatives weighted byvalues of shipments. This is algebraically equivalent t o quantityweighted aggregative indexes but allows for more flexibility in pro-cessing. As in all the official indexes, the linking process is usedwhen there are changes in lists of commodities, changes in weightingfactors, or other changes making for noncomparability. In the caseof quality changes, adjustments are made to obtain month-to-monthrelatives for the same quality insofar as possible. If the change indescription is minor, direct comparisons are made between the priceof the old and the new items. For major quality changes, effortsare made to secure from the producer a n estimate of the proportionof the gross price change due to quality differences and t o a pricechange. When such information cannot be obtained, the new qualityis linked into the index, thus assuming that the full price change isdue to quality change.
Since the revised index was initiated in 1952, there have been fourchanges in the weighting factors. Value of shipments in 1952 and1953were introduced in 1955 and only relatively minor changes weremade in the list of items priced. Another revision in the weightingfactors to represent value of shipments in 1954 was introduced begin-ning 1958. Other revisions include introduction of 1958 value of ship-ments in 1961and 1963 values in 1967. Policy has been to revise theweighting structure of the index periodically when data from indus-trial censuses become available, generally at 5-year intervals.
1890-1970.
Most of the prices in the index are collected by mail directly fromthe manufacturer or other producer. A few are reported by tradeassociations or organized exchanges and some are obtained from authoritative trade publications or from other government agencies that collect price data for their regular work.
The indexes shown here are annual averages of monthly figures.Before 1952, the monthly prices used were averages of 1-day-a-weekprices. From 1952 to 1966, prices were, for the most part, those ofTuesday of the week including the 15th of the month. From 1967t o 1970, the pricing date was Tuesday of the week including the 13thof the month. However, for some commodities another day mayhave been used as a more representative day.
Whenever possible, prices are obtained a t the production pointor a t the central marketing point. Delivered prices are used only when it is the practice of the industry t o quote prices on this basis.Prices obtained from manufacturers or other producers are subjectt o the applicable trade and quantity discounts. Cash discountsare deducted from the price when it is determined that most buyersavail themselves of the reduced prices. Excise taxes are excludedfrom the price. Freedeals or allowances are used when possible in arriving a t the netprice to be used for index calculation. Nominal prices are usedwhen they are indicative of the market situation and no other priceis available.
For a more complete description of techniques used in compilingthe index, see BLS Bulletin No. 1458, Handbook of Methods Surveysand Studies, 1966, chap. 11.
Closeout sales prices are usually not used.
See also general note for series E 23-122.
E Wholesale price indexes (BLS),by major product groups,
Source: 1890-1950, BLS, Handbook of Labor Statistics,1950 edition,p. 118; 1951, 1951 supplement to the Handbook, p. 42.
Since 1902, when BLS began regular publication of wholesaleprice indexes, there have been a number of changes in lists of items,weighting factors, base periods, and methods of computing the indexes.Detailed descriptions of the early unweighted index numbers, andlater the weighted indexes, are included in various annual bulletins on wholesale prices beginning with the Bulletin No. 39, issued inMarch 1902. The figures shown in series E 40-51 are weightedindex numbers of the fixed base weighted aggregative type.
In 1914, BLS recalculated its series back to 1890 using as weightsthe quantity of each priced item marketed in 1909 but retained thebase 1890-99. The system of classification for group indexes wasgenerally according to origin rather than end use and each commoditywas included in only one group index. For 1914-1921, the indexseries were continued with little change except for expanding thelist of priced items and the indexes several times. In 1920the year 1913 was adopted as the base period in order to provide aprewar standard for measuring price changes.
In 1921, a revision of the indexes extended the commodity coverage to include about 400 items as compared with 280 to 325 in previousyears. The weighting factors were changed to represent the quantity of each priced item marketed in 1919. At this time an importantchange was made in the method of grouping commodities. Articlesproperly classified in more than one major group were included inthe appropriate groups with their total weights but, in the
index, the weights for such articles were counted only once.In addition, a rearrangement of commodities within groups was madeto provide separate indexes for 37 subgroups.
When the 1926 base period was adopted in 1927, the indexes wererecalculated back to 1913 with new sets of weights (seeBLS BulletinNo. 473, Wholesale Prices, 1913 to 1927, pp. 2-5). The figures for1890-1912 were converted, not recalculated in detail.
I n subsequent years, the weighting factors were brought up todate from time to time. Major additions to the lists of priced itemsin 1931 and again in 1940 provided better coverage of manufacturedarticles than in earlier indexes. By 1951, when these indexes were
185
1890-1951.
E 52-72 PRICES AND PRICE INDEXES
1949-1951- _ _ _
1932-1933.-----...---------1931
discontinued, the number of subgroups for which separate series were available had been enlarged to 49. The indexes shown here areannual averages of monthly figures.
Because of changes in the list of commodities and in the weightingfactors, the indexes were calculated by the chain relative method. Inthis way, comparisons between any two periods were based on thesame commodities with the same weights. Throughout the wholeperiod, the weight used for each priced commodity was the quantitymarketed for that class of commodity. Classes of commodities notrepresented by an item in the list priced were not represented in theweighting factors.
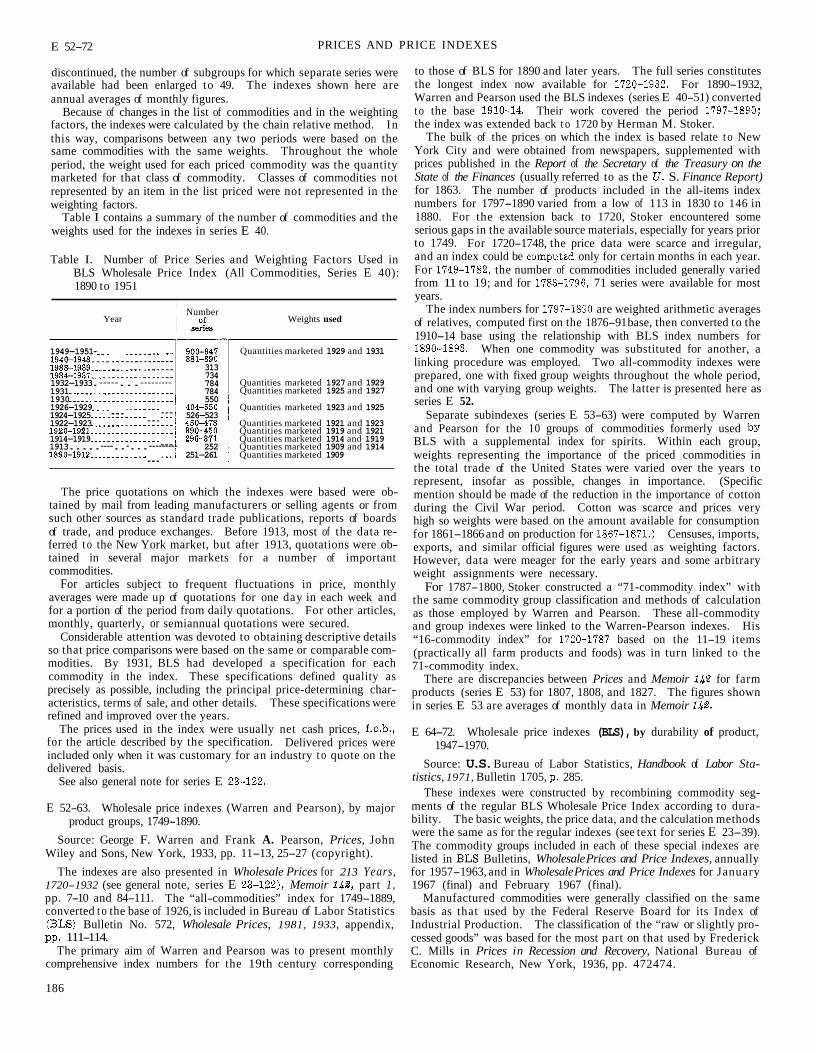
Table I contains a summary of the number of commodities and theweights used for the indexes in series E 40.
313734784784
Quantities marketed 1929 and 1931
Quantities marketed 1927 and 1929Quantities marketed 1925 and 1927
Table I. Number of Price Series and Weighting Factors Used inBLS Wholesale Price Index (All Commodities, Series E 40):1890 to 1951
NumberYear Weights used
1930 5501926-1929 _ _ _ _ _ _ Quantities marketed 1923 and 19251924-1925 _ _ _ 526-5231922-1923 Quantities marketed 1921 and 1923
Quantities marketed 1919 and 19211914-1919 _ _ _ Quantities marketed 1914 and 19191913.....----..-...--------- 252 Quantities marketed 1909 and 1914_ _ _ 251-261 Quantities marketed 1909
The price quotations on which the indexes were based were ob-tained by mail from leading manufacturers or selling agents or fromsuch other sources as standard trade publications, reports of boardsof trade, and produce exchanges. Before 1913, most of the data re-ferred t o the New York market, but after 1913, quotations were ob-tained in several major markets for a number of importantcommodities.
For articles subject to frequent fluctuations in price, monthlyaverages were made up of quotations for one day in each week andfor a portion of the period from daily quotations. For other articles,monthly, quarterly, or semiannual quotations were secured.
Considerable attention was devoted to obtaining descriptive details so that price comparisons were based on the same or comparable com-modities. By 1931, BLS had developed a specification for eachcommodity in the index. These specifications defined quality as precisely as possible, including the principal price-determining char-acteristics, terms of sale, and other details. These specifications were refined and improved over the years.
The prices used in the index were usually net cash prices,for the article described by the specification. Delivered prices were included only when it was customary for an industry t o quote on thedelivered basis.
See also general note for series E
E 52-63. Wholesale price indexes (Warren and Pearson), by major
Source: George F. Warren and Frank A. Pearson, Prices, JohnWiley and Sons, New York, 1933, pp. 11-13, 25-27 (copyright).
The indexes are also presented in Wholesale Prices for 213 Years,1720-1932 (see general note, series E Memoir part 1,pp. 7-10 and 84-111. The “all-commodities” index for 1749-1889,converted t o the base of 1926, is included in Bureau of Labor Statistics
Bulletin No. 572, Wholesale Prices, 1981, 1933, appendix,
The primary aim of Warren and Pearson was to present monthlycomprehensive index numbers for the 19th century corresponding
186
product groups, 1749-1890.
111-114.
to those of BLS for 1890 and later years. The full series constitutesthe longest index now available for For 1890-1932,Warren and Pearson used the BLS indexes (series E 40-51) convertedt o the base Their work covered the periodthe index was extended back t o 1720 by Herman M. Stoker.
The bulk of the prices on which the index is based relate t o NewYork City and were obtained from newspapers, supplemented withprices published in the Report of the Secretary of the Treasury on theState of the Finances (usually referred to as the S. Finance Report)for 1863. The number of products included in the all-items indexnumbers for 1797-1890 varied from a low of 113 in 1830 to 146 in1880. For the extension back to 1720, Stoker encountered someserious gaps in the available source materials, especially for years prior to 1749. For 1720-1748, the price data were scarce and irregular, and an index could be only for certain months in each year.For the number of commodities included generally variedfrom 11 to 19; and for 71 series were available for mostyears.
The index numbers for are weighted arithmetic averagesof relatives, computed first on the 1876-91base, then converted to the1910-14 base using the relationship with BLS index numbers for
When one commodity was substituted for another, alinking procedure was employed. Two all-commodity indexes were prepared, one with fixed group weights throughout the whole period,and one with varying group weights. The latter is presented here asseries E 52.
Separate subindexes (series E 53-63) were computed by Warren and Pearson for the 10 groups of commodities formerly used BLS with a supplemental index for spirits. Within each group,weights representing the importance of the priced commodities inthe total trade of the United States were varied over the years torepresent, insofar as possible, changes in importance. (Specificmention should be made of the reduction in the importance of cottonduring the Civil War period. Cotton was scarce and prices veryhigh so weights were based on the amount available for consumptionfor 1861-1866 and on production for Censuses, imports,exports, and similar official figures were used as weighting factors.However, data were meager for the early years and some arbitraryweight assignments were necessary.
For 1787-1800, Stoker constructed a “71-commodity index” withthe same commodity group classification and methods of calculationas those employed by Warren and Pearson. These all-commodityand group indexes were linked to the Warren-Pearson indexes. His“16-commodity index” for based on the 11-19 items(practically all farm products and foods) was in turn linked to the 71-commodity index.
There are discrepancies between Prices and Memoir for farmproducts (series E 53) for 1807, 1808, and 1827. The figures shownin series E 53 are averages of monthly data in Memoir
E 64-72. Wholesale price indexes (BLS),by durability of product,
Source: U.S.Bureau of Labor Statistics, Handbook of Labor Sta-tistics, 1971, Bulletin 1705, 285.
These indexes were constructed by recombining commodity seg-ments of the regular BLS Wholesale Price Index according to dura-bility. The basic weights, the price data, and the calculation methodswere the same as for the regular indexes (see text for series E 23-39).The commodity groups included in each of these special indexes arelisted in Bulletins, Wholesale Prices and Price Indexes, annuallyfor 1957-1963, and in Wholesale Prices and Price Indexes for January1967 (final) and February 1967 (final).
Manufactured commodities were generally classified on the samebasis as that used by the Federal Reserve Board for its Index ofIndustrial Production. The classification of the “raw or slightly pro-cessed goods” was based for the most part on that used by FrederickC. Mills in Prices in Recession and Recovery, National Bureau ofEconomic Research, New York, 1936, pp. 472474.
1947-1970.
WHOLESALE PRICE INDEXES E 73-122
73-86. Wholesale price indexes (BLS), for economic sectors, by
Source: U S . Bureau of Labor Statistics, 1913-1946, Bulletin 1235,Wholesale Prices and Price Indexes, 1957, p. 26 (these series on a1926 base appear in the following publications: 1913-1941, Handbookof Labor Statistics, 1941 edition, p. 733; 1942-1946, Bulletin 947,Wholesale Prices, p. 6); 1947-1970, Bulletin 1705, Handbook ofLabor Statistics, 1971, p. 286.
Although the basic weights, the price data, and the calculationmethods for these indexes were the same as those used for the regularindexes, the series shown comprise two parts, one for 1903-1946 andthe second for 1947-1970. Prior to the revision of the regular Whole-sale Price Index in 1952 (which was carried back toeach commodity in the WPI was classified in one of three groups:Raw, semimanufactured, or manufactured. The prices wereweighted using quantities as specified for series E The list of commodities included in each classification is shown in BLS Bulletin473, p. 62.
The more refined economic sector classification used for 1947-1970required adjustments to these procedures. Many commodities were considered to fall appropriately in more than one category. For1947-1966, the base weight for each such article was, therefore, dis-tributed among the economic sectors on the basis of percentage dis-tributions by end use, derived from the BLS interindustry studiesfor 1947. From 1967 to 1970, the 1958 interindustry study of theCommerce Department’s Office of Business Economics was used asa guide. The same price series was used in several sectors when a commodity was classified in more than one sector. It was recognizedthat this procedure had some disadvantages, but it was believed t ohave little effect on the measurement of price trend.
In splicing the two parts, the index for “raw materials” was con-sidered as most nearly comparable with the new “crude materials forfurther processing”; “semimanufactured” with “intermediate materials, supplies, and components”; and “manufactured” with “finished goods.”
stage of processing, 1913-1970.
E 87-89. Wholesale price indexes (BLS), by 2 levels of processing,for identical commodities, 1890-1926.
Source: U.S.Bureau of Labor Statistics, Bulletin No. 440, Whole-sale Prices, 1890 to 1926, pp. 28-29, 1926.
These series were calculated for the first time in 1915, were extended back to 1890, and continued through 1926. The items in each of theindexes were selected from those included in the BLS regular whole-sale price index (see series E 40). The indexes are fixed weight aggregative indexes, derived by weighting the price series with theestimated quantity of each article marketed in 1919. Similar figuresfor 1890-1914 on the 1914 base, using 1909 quantity weights may befound in BLS Bulletin No. 181,WholesalePrices, pp. 28-29.
E 90-122. General note.The inadequacy of the available statistics on commodity-price and
wage movements over long periods of time led to the formation ofthe International Scientific Committee on Price History in 1929. Inthe United States, the attention of this Committee was directed toproviding long series of prices for important commodities for pre-CivilWar years. Price history research was initiated or expanded for 6 important markets-Philadelphia, Charleston, S.C., Cincinnati, NewOrleans, New York City, and Boston. Information is presented hereonly for the first 4 of these markets.
The results of the investigations in all 6 areas were summarized in the form of wholesale price index numbers by the individual re-search directors and presented by Arthur H. Cole in Wholesale Com-modity Prices in the United States, 1700 to 1861, Harvard UniversityPress, Cambridge, 1938. A statistical supplement to Cole’s reportcontains the actual monthly quotations for approximately 45 com-modities for the years covered in each market.
The source materials for the price data included newspapers, mer-
chants price lists, account books, and similar records that could belocated. Differences in the availability of price and weighting datafrom area to area contributed to differences in the indexes derived,particularly with respect to the appropriate base periods, the lengthof the series, and the classifications of commodities for subindexes.
90-96. Wholesale price indexes (Taylor), for Charleston, S.C.,
Source: Arthur H. Cole, Wholesale Commodity Prices in the UnitedStates, 1700-1861, Harvard University Press, Cambridge, 1938, pp.
155-157,and (copyright).See also articles by George Rogers Taylor, “Wholesale Commodity
Prices a t Charleston, S. C., Journal of Economic History,February 1932, 356-377, and “Wholesale Commodity Prices atCharleston, S.C., August 1932 supplement to theJournal, pp.
1732-1861.
See also general note for series E 90-122.Taylor’s research in commodity prices was summarized in separate
index numbers for 8 different periods. The choice of time periods was made partly t o reflect business conditions in Charleston andpartly to take account of availability of data. Newspapers andoriginal manuscript materials produced price series for a maximumof 32 items for 1818-1842 and a minimum of 6 for 1732-1747. Gapswere relatively frequent and no quotations a t all appeared for
Indexes for each period were weighted arithmetic averages of pricerelatives, with weights representing the approximate importance ofeach commodity in South Carolina commerce. The weights were unchanged for all years within each time period but were changedfrom period to period. An all-commodities series was made up ofprices for 6 articles for 10 articles for 1748-1761, and16 articles for In each period, rice represented 50 t o 64percent of the total weight. For the 5 later time intervals, weightedsub-indexes were combined with group weights based on the followingtotal number of price series: 1780-1791, 20; 1796-1812, 18;1822, 13; 1818-1842, 32; 1843-1861, 20. During these years, theimportance of rice declined from about 37 percent of the total weightt o 5 to 7 percent, while the importance of cotton increased from zeroin 1791 t o almost 36 percent in
The all-commodity series (E 90) was obtained by splicing theindexes for the separate periods.
E 97-110. Wholesale price indexes (Bezanson), for Philadelphia,
Source: Anne Bezanson, Robert D. Gray, and Miriam Hussey, Wholesale Prices in Philadelphia, part I, Industrial Re-search Study No. 29, Philadelphia, 1936, p. 392. (Copyright, Uni-versity of Pennsylvania; reprinted by permission.)
unweighted geometric average, 1784-1861.
See also general note for series E 90-122.Records of prices for Philadelphia provided continuous price re-
ports for 186 series covering 140 different commodities for1861 and 205 series for commodities for 1819-1861. Monthlyrelative prices for the individual commodities and changes in thedescription of the commodities quoted are included in part of thesource, published as Industrial Research Study No. 30. Bezanson and her associates have also computed indexes for 1852-1896, cor-responding to those for the earlier part of the century, which areavailable in a Bureau of Labor Statistics (BLS) pamphlet, WholesalePrice Indexes for Philadelphia, Totals.
Indexes for all commodities and for subindexes using different modes of classification were computed as unweighted geometricaverages of price relatives. Two all-commodities indexes were pre-pared, one based on 140 commodities (series E 97) and one for amore limited period for commodities.
In addition to the subindexes selected for inclusion here, othersubindexes for commodity groupings generally comparable to thoseof the BLS were also calculated. All indexes are available on amonthly basis.
187
E 111-134 PRICES PRICE
E 111. Wholesale price indexes (Bezanson), for Philadelphia,weighted arithmetic average, 1720-1861.
Source: See source for series E 97-110.For the colonial period, Bezanson and her associates obtained some
price data for 82 series. Because of the gaps in the data, however,indexes for the early years were based on prices for many fewercommodities.
Indexes for were computed as unweighted arithmeticaverages of relatives of prices for the same 12 commodities for thefull period. The source also includes an unweighted geometric index of 20 commodities for
E 112-114. Wholesale price indexes (Berry), for Cincinnati,
Source: Series E 112,1816-1860,Arthur Cole, Wholesale Com-modity Prices in the United States, 1700-1861, Harvard UniversityPress, Cambridge, 1938, p. 185 (averages of the monthly data werecomputed from the source); 1861, estimated by Ethel Hoover fromseries E 113 and E 114 with weights shown in Cole (cited above), p. 81. Series E 113-114,Thomas S. Berry, Western Prices Before 1861, Harvard University Press, Cambridge, 1943, p. 564. (Copy-right.)
1861.
See also general note for series E 90-122.These indexes were weighted arithmetic averages of price relatives,
computed for 3 separate time periods which were spliced to obtainthe continuous series. For 1816-1825, prices for 21 commoditieswere assembled, 13 “identified with northern agriculture” and 8“not identified with northern agriculture.” For 1824-1846, thetotal was 37 with 20 in the first category and 17 in the second. For1846-1861, the total was 50, with 29 for northern agriculture, and21 for other. The weighting factors for the first period were esti-mated from New Orleans receipts in 1825, while those for the 2later periods were based on receipts at Cincinnati forand Berry’s analysis is accompanied by many tabula-tions of supplementary data, including actual prices for individual articles.
E 115-117. Wholesale price indexes (Berry), for Ohio River Valley,1788-1817.
Source: Thomas Berry, Western Prices Before 1861, Harvard
See also general note for E 90-122.In his study of Cincinnati prices, Berry encountered considerable
difficulty in obtaining price information for years before 1816. He enlarged his geographical coverage for the market t o include Lexing-ton and Louisville, Ky., and Pittsburgh, Pa., and was successful in constructing 14 commodity price series for from data in “account books of backwoods merchants” and from local journals.
The indexes were computed as unweighted averages of price rela-tives. The annual prices used t o obtain the relatives were mediansof all Ohio Valley quotations for each item each year.
E 118-122. Wholesale price indexes (Taylor), for New Orleans,
Source: Arthur Cole, Wholesale Commodity Prices in the UnitedStates, Harvard University Press, Cambridge, 1938, pp.
(copyright),
University Press, Cambridge, 1943, pp. 563-564 (copyright).
See also general note for series EA considerable difference was found in the volume of information
available for New Orleans from decade to decade. Therefore, New indexes were prepared for 4 separate time periods. Data
for 8 commodities, primarily agricultural, were combined into anindex for “Louisiana” products for 1800-1812 (July). For a partof this period, 1804-1812 (April), 2 series were constructed, 1 for
188
29 domestic products and the other for 15 imported goods. For 2later periods, the volume of data was sufficient t o set up 3 sub-indexes, classifying the commodities by origin. The number ofarticles included was: For 1815-1842, Louisiana products, 34 otherdomestic products, and 11 foreign imports; for 1840-1861, the corre-sponding numbers of articles were 4, 37, and 8.
All of the index numbers were calculated using the method ofweighted averages of relatives. The weights in the several timeperiods represented the importance of the various commodities in the trade of New Orleans.
The all-commodities index (series E 118) was obtained by splicingthe “all-commodities” indexes for the different periods.
E 123-134. General note.
The wholesale prices for selected commodities from 1800 through1970 provide an indication of price levels (in current dollars) forselected basic commodities at a particular point in time. Due tothe changes in descriptions (specifications) for the commodities, inmarkets from which prices were obtained, in quality of the productwhich takes place over time, and other factors which affect prices,these series provide only a general indication of price trends.
From among the several hundred commodities for which wholesale prices have been published in various reports, 12 were selected forpublication in the form of actual prices. Generally, consideration was given t o representation of commodities in different productgroups, importance in trade, and the length of the series available.
The descriptions for each commodity insofar as they could bedetermined and the sources from which the prices were compiled areshown below in the detailed notes for each series. When annualaverages were not available in the original source, they were com-puted for this publication. If 12 monthly figures were presented, asimple average was calculated, but if only quarterly figures were given, straight line interpolation was used to estimate missing months.
It was not possible to obtain one continuously comparable series for the full period. The data were assembled from several sources for each commodity and there were, frequently, changes in the basisof quotation even in the same source. Two prices are shown foryears in which a change in the series occurred, if it was possible toobtain the information. In some series, mostly prior t o 1890, changesin the basis of quotation occurred and no overlapping prices wereavailable. Such changes are noted below in the text for each series.
Prices for earlier years for some commodities are available in thesame sources as those indicated for 1800, and in other publications. Because of limitations of time and space, however, figures prior to1800 were not included in this chapter. For example, prices of wheatback to 1700 may be found in the publication by Cole, cited as thesource for wheat prices for Wheat prices in the NewEngland colonies at 10-year intervals for 1630-1750 are includedwith prices for several other commodities in Bureau of Labor Statis-tics Bulletin History of Wages in the United States From ColonialTimes to 1928,
The Annual Report of the Director of the Mint, cited as the sourcefor practically all series for some part of the period 1825-1880, wasused despite the lack of commodity descriptions. The prices in-cluded in this report were summaries of the New York prices includedin the U.S. Finance Reports of 1863, 1873, and 1874 which had beencompiled from the newspaper, The New York Shipping and Com-mercial List. Prices for were also compiled from this source. Such descriptions as appear in the notes for each series ofprices taken from U.S. Finance Reports were obtained from the re-port for 1863.
An alternate source for many of the price series included in theAldrich Reports (cited for data prior to 1890) is Monthly SummaryCommerce and Finance in the United States, 57th Congress, 2d Session,House Doc. No. 15, part 1, 1902, 59-100. The Summary coversnot only the years included in the Report, but also extendsthe data through July 1902.
WHOLESALE PRICES E 123-129
123. Wheat, 1800-1970.
Source: Arthur H. Cole, Wholesale CommodityPrices in the United States, 1700-1861, Statistical Supplement, vard University Press, Cambridge, 1938 (copyright);A n n u a l Report of the Director of the Mint to the Secretary of the Treasuryfor the Fiscal Y e a r Ended J u n e 30 , 1881, 5 0 ; Whole-sale Prices, Wages , and Transportation, Senate Report No. 1394,52d Congress, 2d Session, part 2, 1893, 61 (one of the reportsusually referred to as the Reports) ; compiledfrom Bureau of Labor Statistics reports and records. In general,annual average prices, when available, were taken from annual reports, Wholesale Prices and Inderes, through the year 1963.Thereafter, annual average prices were computed from monthly pricesas published in monthly reports, Wholesale Prices and Price Indexes.
For 1800-1825, prices are for Philadelphia (commodity descriptionnot available). For 1825-1880,prices are for New York, “Northern”wheat; the 1863 Finance Report (from which these prices were partially compiled) shows prices for for most years, 1863, but for a few years prices refer to “North River,” “prime white,“ “western,” “western red,” or “mixed and red.” For1890, prices are for “wheat No. 2, Winter, Chicago.” For 1890-1913,prices are for Chicago “Range No. 1Northern Spring and Nc. 2 RedWinter” in carlots. For 1913-1948, prices are for Kansas City,“NO. 2, hard (ordinary)” in carlots. For 1949-1961, prices are forKansas City, “No. 2, hard winter, closing spot market price, carlots,
track.” From 1962 t o 1970, prices are for Kansas City, “No. 1,hard winter.”
See also general note for series E
E 124. Wheat flour, 1800-1970.Source: See sources cited for series E 123; 1800-1825, source A;
1825-1870,source B; source C, 79; 1890-1970, source D.For 1800-1825, prices are for Philadelphia, “Superfine” flour, per
barrel of 196 pounds. For 1825-1870, prices are for New York,“Superfine” flour, per barrel. For 1870-1890, prices were provided by a New York firm (commodity description not available). For 1890-1913, prices are for “winter straights, New York,” perbarrel. For 1913-1943, prices are for “Straights, hard winter, white, in carlots, Kansas City,” per barrel. During 1943, the basisof quotation was changed from per barrel t o flour in sacks, per 100pounds. For prices are for “hard winter, bakery, shortpatents, plain or enriched, in 100-pound sacks, carlots, mill,Kansas City,” per 100 pounds. During 1918 and a part of 1946,prices were quoted on the standard provided under governmentregulation.
See also general note for series E 123-134.
E 125. Sugar, 1800-1970.Source: See sources for series E 123; 1800-1825, source A;
1860, source B; 1860-1890, source C, 114; 1890-1970, source D.For 1800-1825, prices are for the Philadelphia market. Prices
for 1800 refer t o “Muscovado, brown”; 1801-1802 (Oct.),vado”; 1802 (Oct.), “Muscovado, first quality”; 1813
(Apr.), “Muscovado, unspecified”; 1815 (May)-1825,“Muscovado, prime.” For 1825-1860, prices are for New York,‘‘Cuba” sugar; the 1863 U.S. Finance Report (from which the data were compiled) quoted “Muscovado” for 1825-1829 and 1845-1860,“Cuba Muscovado” for 1830-1836 and “Cuba” for 1837-1844. For1860-1890, prices are for “Refined, granulated” sugar (no marketspecified). For 1890-1946, prices are for New York, “Granulated”sugar. Prices were quoted for sugar in barrels until 1955 when thebasis of quotation was changed t o 100-pound paper bags. For1947-1970, the description was amplified to “granulated, domestic,cane, refined, New York,” per pound. Prices for 1934-1970 includethe excise tax of cents per pounds, effective in May 1934.
See also general note for series E 123-134.
E 126. Cotton, raw, 1800-1970.
Source: 1800-1890, B. Hammond, T h e Cotton Indus t ry ,a n Essay in Amer ican Economic History, American Economic Asso-ciation, New Series No. I, Macmillan, New York, 1897, p. 358;1890-1970, see source D for series E 123.
For 1800-1890, prices refer to “Middling uplands” cotton for theNew York market and are available back to 1790. For 1800-1820,prices are estimates made by merchants or government officials.For 1821-1890, prices were taken from James L. Watkin, Productionand Price of Cotton One Hundred Years , published by the Depart-ment of Agriculture, 1895. For 1890-1941, prices are for New York,“Upland, Middling” cotton, spot. In 1936, inch” was addedto the description. For 1941-1954 (July), prices are for “Middling,15/16 inch,” 10 spot market average. For 1954 (Aug.),the number of markets included in the average was increased from10 to 14. The July 1954 average for 10 markets was $0.342 perpound and for 14 markets, $0.341 per pound. For 19561957, prices are for “Middling, 1-inch,’’ 14 spot market average.In Aug. 1956, the average for staple was $0.348 per pound and for 1-inch staple $0.357 per pound. Beginning Sept. 1962,prices are for 15-market average. Beginning July 1968, prices arefor middling,” 12 spot market average.
See also general note for series E 123-134.
E 127. 1813-1970.
Source: See sources cited for series E 123; 1813-1825, source A;1825-1850, source B, p. 60; source C, p. 387; 1890-1970,source D.
For prices are for Philadelphia, “Merino clean” woolexcept for 1819 and 1820 when description was “Merino” wool. For
prices are for New York, “Merino” wool. For1890, prices are for Boston, “Ohio, fine fleece, scoured.” For1913, prices are for, “Domestic, Ohio, fine fleece (x and xx grades),scoured”; for 1913-1945, for Boston, “Domestic, Territory, staple,fine and fine medium, scoured”; for 1946-1949for Boston, “Domestic, Territory, staple, fine combing, graded, scoured.” For 1950-1970,the description was changed with no difference in price level t o“Domestic, fine, good French combing and staple, clean basis.”
See also general note for series E 123-134.
E 128. Cotton sheeting, 1800-1969.
Source: See sources cited for series E 123; 1800-1847, source A;1847-1890, source C, 155; 1890-1969, source D.
Prices are for Philadelphia, “Russian, unspecified” for 1800-1804,“Russian, brown” for and and “Russian, halfbleached” for Prices were shown “per piece” (approx-imately 100 yards). For prices are for “sheeting, brown, 4-4, Atlantic A,” per yard (no market specified). For 1890-1912,prices are for “brown, Indian head, 4-4, 2.85 yards t o pound, factory.” For 1913-1941, description same except that the width designationwas changed in 1913 to “36-inch” instead of andcarded yarn” was added in 1923. For (May), prices arefor “Unbleached, 2.85 yards per pound, Class A, non-feeler, mill.” For 1943 (May)-1947, description sameexcept for change from t o “48 For 1948-1969,prices are for “Unbleached (series 2.85 yardsper pound, Class A, nonfeeler, mill.” The January 1948 pricefor the former description was $0.279 and for thenew description 48x48) was $0.289 per pound.
See also general notes for series E 123-134.
E 129. Coal, anthracite, 1800-1970.
source B; 1890-1970, source D.Source: See sources cited for series E 123; 1800-1825, source A;
For 1833-1890,

E 130-186 PRICES AND PRICE INDEXES
I ron and Steel Association, Statistics of the American andF o r e i g n Iron T r a d e s for 1896, Philadelphia, 1897, p. 91.
Prices are for Philadelphia, “Virginia” coal for 1800-1811 anda n d “Domestic” for 1812 and 1813. There was no de-
scription for 1826-1833. For 1825-1833, prices are for New York,“anthracite coal (Schuylkill).” For 1833-1890, prices are for“Schuylkill white ash lump” coal, by the cargo, at Philadelphia,per gross ton. For 1890-1970, prices are for “Pennsylvania anthra-cite, chestnut,” b u t the basis of quotation was changed several times. For 1890-1928, the basis was “New York Tidewater,” pergross ton ; for 1928-1931, “destination on tracks,” per gross ton;for 1931-1947, per net ton pounds); and 1947-1970,cars” per net ton.
See also general note for.series E 123-134.
130. Steel rails,Source: 1847-1890, American Metal Market and Daily Iron and
Steel Report, M e t a l Statistics, 1921, p. 91. (Reprinted with permis-sion of American Metal Market, Fairchild Publications, Inc., N.Y.,
copyright.)F o r prices are for “Iron rails, Eastern Pennsylvania
mill” (production of steel rails did not exceed production of ironrails until 1877). The source also shows prices of iron rails of thisdescription for For 1867-1870, prices are for New York “Steel rails, Bessemer,” per gross ton. For 1871-1890, prices arefor “Steel rails, Pennsylvania mill.” For 1891-1913, prices are for“Bessemer, Standard, mill, Pittsburgh,” per long ton; for1913-1946, for “Open hearth, standard, mill”; for 1947-1953(April), for “Standard, heavier than 60 pounds, No. 1 open hearth,
mill” (refinement of previous specification and quoted per 100pounds-no break in series); thereafter, for “Standard, carbon steel, No. 1 open hearth, 115 pounds per linear yard, control cooled, basequant i ty , mill.”
For 1891-1970, see source D for series E 123.
See also general note for series E 123-134.
131. Nails, 1800-1969.Source: See sources cited for series 123; 1800-1828, source A;
1828-1834, source B, p. 54; 1890-1969, source D. For 1835-1890,see source for series E 129, 1833-1890, p. 87. (For 1835-1849,prices were compiled from the Report the Secretary of the Treasury,1849; for 1850-1859, by the American Iron and Steel Association from t h e books of the Duncannon Iron Company; and for 1860-1890,by an official of the Duncannon Iron Company.)
For1827, prices are for “Cut nails, all sizes’’; for other years, “assorted sizes.’’ For 1828-1834, prices are for New York, “Nails, cut.”For 1835-1890, prices are for “Cut nails.” For 1890-1953, pricesrefer t o “wire, 8 penny, fence and common, 100-pound keg, Pittsburgh.” “Base price” was added to the description in 1926and fence nails were not included after 1947. For 1953-1959,pricesrefer t o “wire, carbon steel 8d, common, carload lots, mill.”T h e April 1953 price for the former specification was $7.41, andfor t h e new specification, $7.33 per 100 pounds. “Packed in fiber-board boxes” was added to the description for 1955. “Carload lots” was changed t o “in lots of 30,000 lb. or over” in Oct. 1960. Changewas n o t considered t o affect comparability of prices before or after.
For 1800-1828, prices are for the Philadelphia market.
See also general note for series E 123-134.
132. Copper, 1800-1969.Source: See sources cited for series E 123; 1800-1825, source A;
source B, p. 52; 1890-1970, source D. For 1860-1889,see source for series E 130, 1847-1890, 299.
prices are for the Philadelphia market. Prices are“Copper in sheets,” 1800-1801 (Apr.) and 1805
(June) ; “Sheathing unspecified,” 1801 1809(July)-1818 (Apr.), and 1824 “Sheathing, cold rolled,”
190
(May); and “Sheathing unspecified,” 1818(Aug.). For 1825-1860, prices are for New York, “Sheathing.”For 1860-1889, prices are for New York, “Lake Copper.” The priceshown for 1890 is the same as that in Metal Statistics, 1921. For1890-1907,prices are for New York, “Lake for 1907-1927,for “Copper ingot, electrolytic, early delivery, refinery in New York”; for 1927-1953, for “Copper, electrolytic, delivered, Connecticut Valley”; and for for “Copper ingot, electrolytic.
See also general note for series E 123-134.
E 133. Turpentine, 1800-1969.Source: See sources cited for series E 123; 1800-1825, source A;
source B, p. 56; 1840-1890, source C, p. 240; 1890-1969,source D.
For prices are for the Philadelphia market, per barrel (31% gallons per barrel). No description was available, but acomparison of prices indicates that they may be for “soft” turpen-tine. For prices are for the New York market (nodescription is available). For 1840-1890, prices are for New York,“Spirits of turpentine.” For 1890-1942, prices are for “Southern,barrels, at New York.” The description was amplified in 1936 bythe addition of “carlots, ex dock, gum spirits.” Forprices refer to “Gum spirits, bulk, Savannah, For1956 (Oct.), quotations are for “Spirits of turpentine, tank cars, atNew York.” The Jan. 1952 price for the former specification (Savannah) was $0.80 per gallon and for the new (New York), $0.76 per gallon. For 195.6 (Jan.) prices are for “gum,tank cars” a t New York. For 1959 prices are forcarlots or truckload quantities car or trucks at processing plantsin Georgia and Florida. “Midpoint of range for week” was added in 1961.
See also general note for series E 123-134.
E 134. Brick, 1849-1969.Source: See sources cited for series E 123; 1849-1890, source
p. 222; 1890-1969,source D.For 1849-1890, prices are for “common domestic building” (market
not indicated). For 1890-1933, prices are for “Common, Red,Domestic, at New York”; 1933-1947, for “Common building, plant” (composite of approximately 50 firms); for 1947-1961, for“Building brick, plant or New York dock” (composite ofapproximately 25 firms); and for 1962-1969, for “Building brick,
plant.” Changes in list of firms from time to time did notresult in any significant differences in the annual average prices.
See also general note for series E 123-134.
E 135-186. General note.An appropriate name for indexes of retail price changes has been
the subject of considerable discussion. Most indexes that have a tsome time been called “cost-of-living” indexes measure changes inretail prices for the goods and services families buy. Insofar aspossible, the retail prices are for the same list of items in the samelocalities, the same qualities, and the same quantities from oneperiod t o the next. The indexes, therefore, measure changes incosts for living in the same way and in the same place.
Generally, people tend to think of the amount of money they spendfor commodities and services as their cost of living. Changes intotal expenditures reflect changes in costs resulting from differencesin the or manner of living, such as shifts in the kinds of goodsand services bought, and may represent a better or a worse standardthan at some earlier date.
The term “Consumer Price Index” was adopted by the Bureau ofLabor Statistics (BLS) and the National Industrial Conference Boardafter much controversy during World War regarding the BLS Cost
Living For a discussion of differences in concept and meas-urement of the cost of living, see the Report of the President’s Commit-tee o n Cost of Living, Office of Economic Stabilization, 1945.
CONSUMER PRICE INDEXES E 135-166
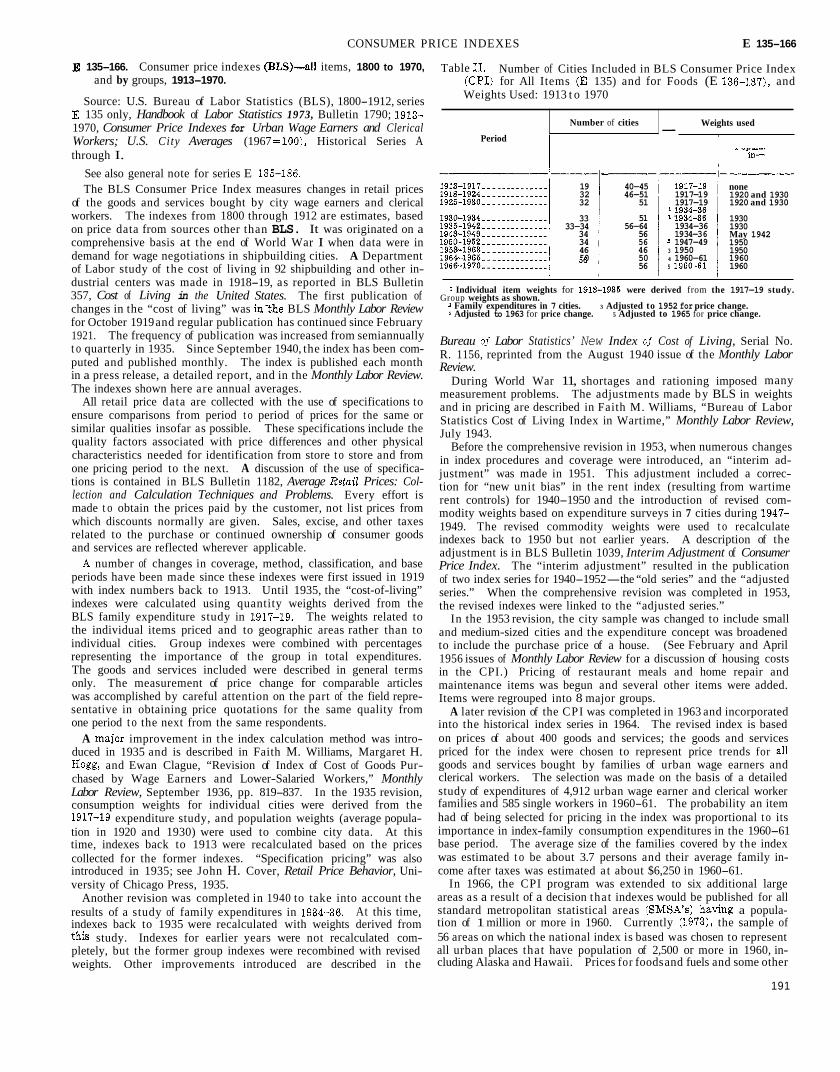
Number of cities
135-166. Consumer price indexes items, 1800 to 1970,
Source: U.S. Bureau of Labor Statistics (BLS), 1800-1912, series135 only, Handbook of Labor Statistics 1973, Bulletin 1790;
1970, Consumer Price Indexes for Urban Wage Earners and ClericalWorkers; U.S. City Averages (1967 Historical Series Athrough I.
and by groups, 1913-1970.
See also general note for series EThe BLS Consumer Price Index measures changes in retail prices
of the goods and services bought by city wage earners and clericalworkers. The indexes from 1800 through 1912 are estimates, basedon price data from sources other than BLS. It was originated on acomprehensive basis at the end of World War I when data were in demand for wage negotiations in shipbuilding cities. A Departmentof Labor study of the cost of living in 92 shipbuilding and other in-dustrial centers was made in 1918-19, as reported in BLS Bulletin357, Cost of Living in the United States. The first publication ofchanges in the “cost of living” was BLS Monthly Labor Reviewfor October 1919and regular publication has continued since February1921. The frequency of publication was increased from semiannually t o quarterly in 1935. Since September 1940, the index has been com-puted and published monthly. The index is published each monthin a press release, a detailed report, and in the Monthly Labor Review.The indexes shown here are annual averages.
All retail price data are collected with the use of specifications toensure comparisons from period t o period of prices for the same orsimilar qualities insofar as possible. These specifications include thequality factors associated with price differences and other physicalcharacteristics needed for identification from store t o store and fromone pricing period to the next. A discussion of the use of specifica-tions is contained in BLS Bulletin 1182, Average Prices: Col-lection and Calculation Techniques and Problems. Every effort ismade t o obtain the prices paid by the customer, not list prices fromwhich discounts normally are given. Sales, excise, and other taxes related to the purchase or continued ownership of consumer goodsand services are reflected wherever applicable.
number of changes in coverage, method, classification, and baseperiods have been made since these indexes were first issued in 1919with index numbers back to 1913. Until 1935, the “cost-of-living”indexes were calculated using quantity weights derived from theBLS family expenditure study in The weights related tothe individual items priced and to geographic areas rather than to individual cities. Group indexes were combined with percentages representing the importance of the group in total expenditures.The goods and services included were described in general termsonly. The measurement of price change for comparable articles was accomplished by careful attention on the part of the field repre-sentative in obtaining price quotations for the same quality fromone period t o the next from the same respondents.
A improvement in the index calculation method was intro-duced in 1935 and is described in Faith M. Williams, Margaret H.
and Ewan Clague, “Revision of Index of Cost of Goods Pur-chased by Wage Earners and Lower-Salaried Workers,” MonthlyLabor Review, September 1936, pp. 819-837. In the 1935 revision,consumption weights for individual cities were derived from the
expenditure study, and population weights (average popula-tion in 1920 and 1930) were used to combine city data. At thistime, indexes back to 1913 were recalculated based on the pricescollected for the former indexes. “Specification pricing” was alsointroduced in 1935; see John H. Cover, Retail Price Behavior, Uni-versity of Chicago Press, 1935.
Another revision was completed in 1940 to take into account theresults of a study of family expenditures in At this time,indexes back to 1935 were recalculated with weights derived from
study. Indexes for earlier years were not recalculated com-pletely, but the former group indexes were recombined with revisedweights. Other improvements introduced are described in the
Weights used--
Table Number of Cities Included in BLS Consumer Price Indexfor All Items 135) and for Foods (E and
Weights Used: 1913 t o 1970
Period
193232
3333-34
34344650
40-4546-51
51
5156-64
5656465056
1917-191917-19
1934-3619 34-361947-49
3 19504 1960-615
none1920 and 19301920 and 1930
19301930May 19421950195019601960
Individual item weights for were derived from the 1917-19 study.
Family expenditures in 7 cities.Adjusted to 1963 for price change.
Group weights as shown.3 Adjusted to 1952 for price change.
5 Adjusted to 1965 for price change.
Bureau Labor Statistics’ New Index Cost of Living, Serial No.R. 1156, reprinted from the August 1940 issue of the Monthly LaborReview.
During World War 11, shortages and rationing imposed manymeasurement problems. The adjustments made by BLS in weights and in pricing are described in Faith M. Williams, “Bureau of LaborStatistics Cost of Living Index in Wartime,” Monthly Labor Review,July 1943.
Before the comprehensive revision in 1953, when numerous changes in index procedures and coverage were introduced, an “interim ad-justment” was made in 1951. This adjustment included a correc-tion for “new unit bias” in the rent index (resulting from wartimerent controls) for 1940-1950 and the introduction of revised com-modity weights based on expenditure surveys in 7 cities during1949. The revised commodity weights were used t o recalculateindexes back to 1950 but not earlier years. A description of theadjustment is in BLS Bulletin 1039, Interim Adjustment of ConsumerPrice Index. The “interim adjustment” resulted in the publicationof two index series for 1940-1952-the “old series” and the “adjusted series.” When the comprehensive revision was completed in 1953,the revised indexes were linked to the “adjusted series.”
In the 1953 revision, the city sample was changed to include small and medium-sized cities and the expenditure concept was broadenedto include the purchase price of a house. (See February and April1956 issues of Monthly Labor Review for a discussion of housing costsin the CPI.) Pricing of restaurant meals and home repair andmaintenance items was begun and several other items were added.Items were regrouped into 8 major groups.
A later revision of the CPI was completed in 1963 and incorporatedinto the historical index series in 1964. The revised index is basedon prices of about 400 goods and services; the goods and servicespriced for the index were chosen to represent price trends forgoods and services bought by families of urban wage earners andclerical workers. The selection was made on the basis of a detailed study of expenditures of 4,912 urban wage earner and clerical worker families and 585 single workers in 1960-61. The probability an itemhad of being selected for pricing in the index was proportional t o itsimportance in index-family consumption expenditures in the 1960-61base period. The average size of the families covered by the indexwas estimated t o be about 3.7 persons and their average family in-come after taxes was estimated at about $6,250 in 1960-61.
In 1966, the CPI program was extended to six additional largeareas as a result of a decision that indexes would be published for allstandard metropolitan statistical areas a popula-tion of 1 million or more in 1960. Currently the sample of56 areas on which the national index is based was chosen to representall urban places that have population of 2,500 or more in 1960, in-cluding Alaska and Hawaii. Prices for foodsand fuels and some other
191
E 167-184 PRICES AND PRICE INDEXES
goods and services are obtained monthly in all cities. Prices formost other goods and services are obtained monthly in the 5 largestareas and every three months in the remaining 51 or smallurban places. Rents are surveyed bimonthly in the 5 largest areasand every 3 months in other areas. Separate indexes are computedfor 23 large areas. A comprehensive discussion of these and otherimprovements is contained in BLS Bulletin 1517, The Consumer PriceIndex: History and Techniques.
Food prices are obtained from about 1,800 food stores, including all important types of food retailers in each city. Rent figures arecollected from tenants for approximately 40,000 rental units selectedfrom block listings of the total rental housing market in each city.Prices for other goods and services are obtained from about 16,000retail and service establishments patronized by wage earner andclerical families and including department stores, specialty shops,etc., with a minimum of 4 quotations per item per SMSA or urbanplace in most cases. Retail stores and service establishments arestratified by type of outlet and by area of the SMSA, centralbusiness district, neighborhood, and suburban pricing areas.
Price collection for the majority of goods and services is made bypersonal visit of BLS field representatives. Food prices are col-lected by local agents; for some items mail or telephone collection issupplemented by occasional personal visits.
The indexes are calculated using a variation of the base quantityweighted index formula. In practice, the aggregates are obtained by applying price relatives to “value weights” representing the costof 1960-61 quantities as determined from the 1960-61 ConsumerExpenditure Survey. The base period importance of an item se-lected with certainty for pricing in the index represents the annual average expenditure made for the item by the index population inthe 1960-61 period. The base period importance of other items represents the expenditure made for that item and in addition a“pro rata” share of the weight of items not selected for pricing. In-dexes for individual areas are computed using the expenditure weights for each area. National indexes are calculated by combining areadata with weights representing 1960 population.
The standard reference base of the Consumer Price Index presentedhere is The index was changed to this base from itsprevious base of effective with release of the indexfor January 1971. The official standard reference base of the CPIwas 1957-59 from 1962 through 1970, 1947-49 from 1953through 1961, from 1940 through 1982, 1923-25= 100from through 1939, and 1913 from 1913 through 1934.
For a more complete description of the Consumer Price Index, seeHandbook o j Methods f o r Surveys and Studies, BLS Bulletin 1458,Chapter 10, or BLS Bulletin 1517 cited above.
See also general note for series E
E 167-173. Consumer price indexes for special groups,
Source: U.S. Bureau of Labor Statistics, Handbook LaborStatistics, p. 255.
These indexes are based on a reclassification of the items pricedfor the Consumer Price Indexes (series E 135-166). The basicweights, price data, and calculation methods were the same as thoseused for the regular CPI. For a more complete description of theindex, see BLS Bulletin 1517 cited above (E
1970.
See also general note for series E 135-186.
E 174-182. Consumer price index (Hoover), 1851-1880.Source: Ethel D. Hoover, “Prices in the 19th Century,” Studies
in Income and Wealth, vol. 24, 1960, National Bureau of EconomicResearch, New York (copyright).
See also general note for series E 135-186.The basic price data for these series are from Joseph D. Weeks,
“The Average Retail Prices of Necessaries of Life,” Report on Sta-tistics oj Wages in Manufacturing Industries, Tenth Census, vol. 20,
192
Averages of retail prices for 58 commodities were calculatedby making simple averages of the prices reported for each item byone or two storekeepers in approximately 40 cities. The consistencyof price movement and price level between prices identified as of“June and those as “year” averages led to the inclusion of allprices t o calculate an all-city average for each year. In calculatingthe relative prices for each commodity, a comparability procedurewas used; that is, for each year two average prices wereone comparable with the preceding year and the other comparable with the following year. Data for these 58 commodities were sup-plemented with estimates of price change for services (shoe repairsand medical care) as well as some additional items important in family spending estimated from other sources. The number of priceseries included in each of the index groups was food, 40; clothing, 12;rents, 2; fuel and light, 5; and other, 7.
Relative prices for the individual commodities were combinedwith value weights derived from the study of family expenditures inMassachusetts in 1875, supplemented by detailed expenditures of232 families as given in the Aldrich Reports (WholesalePrices, part 1,pp. 62-63). The formula for calculation of the index was the alge-braic equivalent of the Laspeyre index.
E 183. Cost-of-living indexes (Federal Reserve Bank of N.Y.),
Source: Federal Reserve Bank of New York, of EstimatedCost Living in the United States (1938 revision, mimeographed).
Indexes for 1820-1952 converted t o the 1947-49 base and figuresshowing purchasing power of the dollar “in terms of retail prices”for the same period are available in a mimeographed release withsame title dated March 17, 1953.
1913.
See also general note for series EThis index was obtained by splicing together parts of indexes al-
ready available to approximate a continuous series. No adjustmentswere made t o the original series other than those necessary to convertt o a common base period. Indexes for 1820-1839 were taken fromAlvin H. Hansen’s cost-of-living indexes which were based on whole-sale prices for these years. For 1840-1859, the indexes used werealso obtained from Hansen’s index which had in turn utilized theweighted index of wholesale prices (assuming all unpriced itemsmoved with all priced items) computed by Roland P. Falkner forthe Senate Committee on Finance. The Falkner indexes for1891 may be found in Senate Report No. 1394 (Aldrich Report), WholesalePrices, Wages,and Transportation, S . Senate Committeeon Finance, 1893, p. 93. For 1860-1879, the Federal Reserve Bankused the relative cost-of-living series prepared by Wesley C. Mitchell,who calculated his index from retail price data for 60 of the “neces-saries of life” included in the Weeks Report. The original series maybe found in Mitchell’s Gold, Prices, and Wages Under the GreenbackStandard, University of California Publications in Economics, vol. 1,Berkeley, March 1908, p. 91. For 1880-1889, the indexes were those of W. Randolph Burgess in Trends of School Costs (see seriesE 184). For 1890-1909, Paul Douglas’ “Most Probable Index of theTotal Cost of Living for Workingmen” (see series E 185) as pub-lished in American Economic Review, March 1926 supplement, p. 22,was used. Indexes for 1920-1912 were derived from theliving index for Massachusetts appearing in the Department of Laborand Industries of the Commonwealth of Massachusetts, Report ofthe Commission on the Necessaries of Life, February 1920, p. 118.
E 184. Cost-of-living index (Burgess),Source: The Review Economics and Statistics, February 1934, vol.
XVI, No. 2, p. 26 (copyright, Harvard College, Cambridge).For original data in dollars, see W. Randolph Burgess, Trends of
School Costs, Russell Sage Foundation, New York City, 1920, p.See also general note for series E 135-186.To determine changes in the purchasing power of teacher’s salaries
for his study of Trends in School Costs, Burgess compiled the series,

ECOST-OF-LIVING INDEXES RETAIL PRICES
“Cost of Living Per Week for a Small Family Using the Same Amount of the Same Commodities Over the Entire Period.” This series is based on prices for 10 foods important in wage earners’ spending.Quantity weights, derived from BLS 1901-1902 consumer expendi-ture studies, were used to combine prices of the 10 foods. On theassumption that other less important items fluctuated with foodprices, the total food cost was adjusted upward to approximate thetotal weekly cost for all items for a typical wage earners’ family ofman, wife, and two children. The factor used for adjustment wasbased on the ratio of food costs to total costs in 1901. The sourceof the price data is indicated by general reference to BLS, the Massa-chusetts Bureau of Statistics of Labor, the Reports, recordsof purchases by the Army and Navy, and miscellaneous publications.
E 185.Source: Paul Douglas, Real Wages in the United States,
1926, Houghton Mifflin Company, Boston and New York, 1930,p. 60 (copyright).
Cost-of-living index (Douglas),
See also general note for series E This index was called the “Most Probable Index of the Movement
of the Total Cost of Living for Workingmen” by Douglas, who con-structed the series for his study of real wages during this period.The all-item indexes are available for two base periods, 1890-1899and 1914.
For 1890-1914, the sources of the price data were BLS wholesaleand retail reports. The available retail prices for foods were supple-mented with wholesale prices for additional foods. These wholesaledata were adjusted for the variation in movement between retailand wholesale prices for identical foods. Wholesale prices were alsoadjusted to approximate retail prices for clothing, fuel and light,furniture, tobacco, and spirits. The combined index for all items isa weighted arithmetic average of price relatives, using weights de-rived from the BLS consumer expenditure study of 1901-1902. Noestimates were made for rent movements because of lack of data.For 1913-1926, the individual city indexes in the BLSLiving Index” were combined with city population weights.
E 186. Cost-of-living index (Rees), 1890-1914.Source: National Bureau of Economic Research, Thirty-eighth
Annual Report, New York, May 1958, pp. 59-60 (copyright).Rees’ cost-of-living index was based largely on retail prices. Doug-
las’ estimates were adopted for food a t retail, and tobacco andspirits a t wholesale prices (see text for series E but retail. datawere assembled to compute new components for fuel, rent, clothing,and housefurnishings. Prices for gas obtained from utility com-panies, and retail prices of kerosene as used for the New Jersey Statecost-of-living index, were included in fuels. Wholesale prices of coalwere included before 1907 and for kerosene before 1898. Rents for
cities were compiled from newspaper advertisements. Prices for clothing and housefurnishings were compiled from mail-ordercatalogs.
The index is a weighted average of price relatives, using weightsderived largely from the BLS consumer expenditure study of1902.
E Retail prices of selected foods in cities (BLS),
Source: U.S. Bureau of Labor Statistics (BLS), 1890-1922, Bulletin396, Retail Prices, to pp. 8-10; 1923-1934, BLS Bulletin635, Retail Prices of Food pp. 77-89; 1935-1939,Serial No. R.1172 (August Retail Prices, pp. 28-35; 1940-1970, annual or biennial bulletins, Retail Prices of Food (including Serial No. R. 1264,and Bulletins 707, 799, 899, 938, 965, 1032, 1055, 1141, 1183, 1217,1254, 1301,1446, and 1632).
While there were scattered statistics of prices of many individualcommodities in various publications, i t was not until 1901, when
began the collection of food prices on a regular basis, that a
1970.
regular price collection program was initiated by the Federal Govern-ment. At that time, information was secured from dealers’ booksfor 1890-1901. Since then, retail prices of food have been obtainedby BLS, first a t annual intervals, then monthly or semimonthly.
AS the pricing program was expanded to other commodities andservices purchased by families for daily living, the available resources and review of data requirements for the over-all Consumer PriceIndex resulted in sampling and methodology changes for foods.The growth in importance‘ of some foods and declines for others, changes in kinds and sizes of packages, different methods of prepara-tion of foodsfor retail stores, and similar developments were taken into consideration in the adjustments made to the list of foods priced. Ofthe many foods included for most of the period since 1890, only 16were selected for publication here.
The list of cites in which food prices were collected changed overthe years. I n the main, the cities covered were industrial localities
30 to 40 States up to 1952. Beginning in 1953, the collection offood prices was restricted to the 46 cities included in the CPI. In1964, pricing was extended to 50 areas. Six additional metropolitanareas were added in 1966 making the sample 56 metropolitan areas or urban places. See text for series E 135-166.
The number of stores in city reporting food prices, after theinitial collections through 1904, generally ranged from 25 in thelarger cities to in the smaller cities until 1932. Average pricesfor the United States were obtained by making simple averages ofquotations from the total number of firms reporting for each foodfor 1915-1932. Average relative prices for each commodity wereapplied to prices in 1915 to estimate national averages for1914. Some chain stores were added to the samples as their salesvolumes became significant in each city.
During 1932-1934 the store samples were expanded, particularlyin the larger cities, and the method of averaging prices was adjustedto reflect food sales by chain and independent stores in each city.National averages were obtained by combining weighted city aver-ages with the use of consumption and population weights. Refine-ments to the sampling and the weighting system have been introduced from time t o time (see “Store Samples for Retail Food Prices,”Monthly Labor Review, January 1947).
During the revision of the CPI in the late comparablerevised national averages were calculated back to 1923. The na-tional averages shown here are those estimated by price relativesfor 1890-1915, simple averages of quotations from all for
and weighted city averages beginning with 1923.Food price data were collected by use of mail schedules and oc-
casional personal visits until 1934. Since that year, all prices havebeen collected by personal visit of BLS representatives. Changes indescriptions for the foods priced, the cities covered, sizes and designsof samples of stores, and methods of processing introduce somecomparabilities into the series.
Before the comprehensive CPI revision in 1964 BLS had publishedmonthly city average retail food prices which were simply weighted means of the quotations used in the calculation of index numbers.However, the implementation of two recommendations of the PriceStatistics Review Committee of the National Bureau of EconomicResearch concerning use of broader, less detailed specifications andthe introduction of replicated samples resulted in data which couldnot be processed to meaningful average prices. Therefore, an esti-mating technique was adopted which takes advantage of the improvedcoverage resulting from broader specifications and those well-definedprices available. A set of average prices, called “benchmarks,”computed periodically, usually once a year, through the exclusion ofall prices of items not meeting the exact requirements of a narrowly-defined specification. Once established, these benchmark prices areadjusted each by the change in prices reflected in the index.more detailed and technical explanation of this estimating procedureis available in “Calculation of Average Food Prices,”Labor Review, January 1965.
Prices are for general all-purpose white
193

E PRICES AND PRICE INDEXES
The size of package on which quotations were secured were:1928, 1/8 or 1/4 of a barrel although some smaller units were alsoincluded; 1929-1938, 1 2 or 24 lb. sack; 1939-1942, 5-12 lb. sack;1943-1970, 5 lb. sack.
Prices are for white bread, pan style, excluding allspecialty type bread. For 1913-1936, prices were obtained from bakeries for 16 or 18 ounces in the dough and converted t o 16 ouncesbaked weight. Both wrapped and unwrapped breads were included.Beginning in 1937, prices have been obtained primarily from grocerystores for the volume-selling size loaf of wrapped bread. The bakedweight as given on the wrapper or reported by the store was con-verted t o 16 ounces.
National averages have not been computed for 1890-1912. Pricesfor individual firms are available in the early retail price bulletins.
E 189, round steak. For 1890-1939, the averages include quota-tions for the best cut of the best grade handled in each store for wholeround or top round, mostly bone-in. For 1940-1970, prices were for top round, bone-in, U.S. choice grade (comparable to U.S. goodgrade prior t o the changes in grades by the Department of Agriculturein 1950).
For 1913-1939, quotations were reported forthe best cut of the best grade handled in each store and include bothbone-in and boneless. Since then, all quotations have been for“bone-in” roasts, The grade priced for 1940-1970 was the sameas for round steak. Beginning in 1951, the more precise descriptionof the cut was “blade pot-roast cut from upper part of shoulder before rib roast and behind neck, U. S. choice, bone-in.”
National averages have not been computed for 1890-1912. Pricesfor individual firms are available in the early retail price bulletins.
E 191, pork chops. For 1890-1935, quotations were for loin chops of the best grade handled. Rib chops and chops from the thick end of the loin were excluded. From 1935 through May 1970, prices wereobtained for center cut loin chops of U.S. No. 1 grade. Since May1970, no grade has been specified.
Most of the quotations included in the average were for sliced bacon for all years. In the early years (probably before1930) bacon was sliced when sold and prices for slab bacon may beincluded. Sliced and packaged bacon has been priced since about1930 in 1pound or two pound packages of cellophane or similarmaterial. Grade descriptions were: 1890-1942, best but not fancy grade; 1943-1945, first quality or fancy grade; 1946-1963, standardGrade A; since 1964, best quality.
All prices refer to creamery butter, 92 to 93 scoreor better for 1890-1942 and 92 score for 1943-1970. Tub or printbutter was priced up to 1940, roll or print in 1941 and 1942, packageof 4 sticks or quarters for 1943-1946, and package print or roll, in-cluding quarters for 1947-1970.
E 194, eggs. Averages are for fresh eggs for all years. For1942, prices are for the highest grade sold in volume in each store;for 1943-1944, U.S. extras or Grade A; for 1945-1952, the highestgrade and size sold in volume in each store; since 1953, large Grade Aeggs in most cities, although some ungraded eggs included in somesmall cities.
Until 1935, prices are for fresh fluid milk,raw or pasteurized, no grade designation, in quart bottle or in bulk, delivered to homes; for raw or pasteurized milk of thedominant grade in each city in quart bottles or cartons; for 1947-1949,same grades, but sizes included 1-quart, and 4-quart con-tainers in many cities: for 1950-1956, pasteurized milk, homogenized or nonhomogenized, without Vitamin D, of the volume-selling gradein each city in quart or half-gallon cartons or bottles; for 1957-Septem-ber 1966, pasteurized, homogenized milk with Vitamin D added,3.25 percent or over butterfat content in quart or half-gallon cartonsor bottles; beginning in October 1966, prices are for half-gallon con-tainers; since May 1970, prices are for fresh whole milk, pasteurized,homogenized, Vitamin D added.
194
E 188, bread.
E 190, chuck roast.
E 192, bacon.
E 193, butter.
E 195, milk, delivered.
E 196, oranges. California and Florida oranges of the varietyand size constituting the bulk of sales each month were quoted from1919 t o about 1935. After that time, the size range was narrowedto include only size 176-220 in standard box of U.S. No. 1 grade(good quality).
White or Irish potatoes, excluding largetypes, have been priced consistently for all years in the quantities in which sales have customarily been made. The designation of U.S.No. 1 grade was added in 1935.
E 198, tomatoes, canned. The volume selling brands of cannedtomatoes, standard grade, in No. 2 can were priced for 1919-1954.For 1955-1970, the description was expanded to specify “small andlarge pieces, with a maximum of 50 percent liquid, standard grade(C)” and the can size was changed to No. 303. Prices for 1919-1954have been converted to No. 303 can.
Dried beans, white, navy, or pea beans, No. 1choice, hand picked, packaged or bulk were priced for 1915-1970.For 1949-1952, California small white beans were also included andfor 1953-1970, Great Northern beans.
E 200, coffee. For 1913-1970, whole bean or ground roasted coffee was priced. Bulk or packaged coffee was quoted up t o 1938.For 1939-1955, coffee in cans, glass, cardboard, or paper containers were averaged. For 1956-1970, prices are for ground roasted coffeein airtight cans only.
E 201, margarine. Prices are for uncolored oleomargarine, animaland vegetable, in 1-pound cartons for 1919-1948. For 1949 and1950, uncolored vegetable margarine in 1-pound cartons was quoted.For 1951-1970, averages are for colored vegetable margarine in1-pound cartons.
E 202, sugar. Prices are for white granulated cane or beet sugar but the size package has varied over the years. For 1890-1916,prices for the volume-selling quantity were quoted; for 1917-1928,1 pound; for 1929-1942, 10 pounds; and for 1943-1970, 5 pounds. For a short period during World War the 2-pound unit was theonly one available.
E 197, potatoes.
E 199, navy beans.
E 203-213. General note.
The collection of retail prices for fuel and light was initiated in1911 with coal and gas data for After that time, theprogram was expanded to include gas, electricity, and the heatingfuels used in important quantities in the cities covered. Prices werecollected semiannually up to 1920 and a t quarterly or monthly in-tervals from 1920 on. The indexes shown here are annual averages.
The number of cities for which prices for this group have beencompiled has varied widely. Before 1947, city coverage had gradually been extended until fuels prices and utility rates were obtained in 51cities. In 1947, this program was cut back to the 34 cities in theConsumer Price Index (CPI). The CPI revision in 1952 resulted inchanging the city sample and enlarging the number t o 46 cities. An-other revision, effective in 1964, enlarged the sample t o 50 urbanareas. In 1966, six additional areas were included.
The changing importance of particular kinds of fuel in particularlocalities, coupled with the overall change in the area sample over theyears, produced many changes in the volume of data for the indexes.The amount of supplementary information for deriving weights hasvaried also. In order to produce continuous index numbers, allchanges in samples and methods of averaging were handled by thelinking process.
All prices have been collected by mail from retailers and utilitycompanies in each city, except reports for electricity which have beensecured through the Federal Power Commission since 1937.
The terms of sale for the quotations were net cash payment basis,delivered to the residential consumer in specified quantities. Chargesfor special services were excluded, but all applicable sales taxes wereincluded. Annual averages were computed using standard Bureau ofLabor Statistics (BLS) procedures.
RETAIL PRICE INDEXES E
The following BLS bulletins contain the history of the collection andpublication of prices for this group: Bulletin 664, Changes in RetailPrices of Electricity, pp. 17-19; Bulletin 628, Changes inRetail Prices of Gas, pp. 48-52; Bulletin 950, ResidentialHeating Fuels; Retail Prices, 15.41-48, pp. These reports contain references t o earlier bulletins and include other index and price series.
E 203. Retail price indexes of electricity for residential use, composite,
Source: U.S. Bureau of Labor Statistics (BLS), Retail Price Indexesof Fuels and Utilities (formerly Fuels and Electricity) January 1972.
See also general note for series EThis composite is an extension backward of a current BLS series.
For 1913-1934, the index is based on the average price per kilowatt-hour for the average amount of electricity used by families in eachof the 32 cities included in the Consumer Price Index (CPI). Averageprices for the 32 cities were combined as simple averages.
In 1938, a new method of computation for the revised CPI wasinaugurated, and data were extended back t o 1936. Net monthly bills for typical residential services were calculated from rate schedulesfor each city. The number of cities in the composite included 34cities for 46 cities for 1953-1963, 50 cities for 1964-1965,and 56 cities for 1966-1970.
For theperiod 25, 40, 100, and 250 kilowatt-hour monthly netbills were priced. From December 1952 t o December 1963, threeservices were priced-40, 100, and 200 kilowatt-hours. With therevision of the CPI in 1964, the composite of services priced was changed to 100, 250, and 500 kilowatt-hours. The new composite included the entire 50-city sample for 1964 and 1965, and the entire56-city sample for 1966-1970.
The net monthly bills for the typical services were first combined into a n index for each city by using weights approximating the im-portance of each of the services in that city. The city indexes werethen combined with the consumption and population weights ofthe CPI.
1913-1970.
Changes also have been made in the typical services.
E 204. Retail price indexes of electricity for residential use, 100kilowatt-hours, 1923-1970.
Source: See source for series E 203.See also general note for series EThis index is based on net monthly bills for one,of the typical
services included in the composite, series E 203. When the newmethod of calculation was inaugurated in 1938, net monthly billswere obtained from rate schedules supplied by the companies or inBLS files. Originally, the indexes were calculated on the 1923-25base and converted to later base periods when the CPI was revised.
For 1923-June 1947, the cities in the series totaled (includingthe 34 CPI cities). Theweights used for 1923-June represented the number of residentialcustomers as of December 31, 1935. Since July 1947, the weightshave been the CPI consumption and population factors.
Thereafter, only CPI cities were included.
E 205. Retail price indexes of gas for residential use, composite,1935-1970.
Source: See source for series E 203.See also general note for series E 203-213. .This composite is another backward extension of a current
series. It combines data used to produce the indexes for “residentialheating” and “other than residential heating.”
When price collection for gas was begun by the BLS in 1911, themajority of the cities were served with manufactured gas. As aresult of the increasing trend to use of natural gas, the numbercities for which the BLS obtained prices for manufactured gas declined from 35 of 39 cities in and 42 of cities in 1923, to none of the
CPI cities since 1957. While manufactured gas was being phasedout, the use of natural gas increased. In 1913, only 8 or 9 of 50 citieswere using natural gas; 18 of 50 cities were using natural gas in 1935,33 of 46 cities in 1957, 49 of 50 cities in 1964, and 55 of the 56 CPIcities from 1966 t o 1970.
The use of natural gas for residential heating grew in importance as additional pipelines made natural gas available t o more and morecities. Although gas for residential heating was not included in theCPI before 1953, a special study in 1943 provided information on thevolume of sales for residential heating as of 1940 and rate scheduledata back t o 1935 for cities in which natural gas was an importantheating fuel.
In 1935, the BLS adopted the method of computing net monthlybills based on a definite number of heat units (therms of 100,000British Thermal Units each) for each of 4 services-10.6, 19.6, 30.6,and 40.6 therms. These services were for use other than residentialheating.
E 206. Retail price indexes of gas for residential heating, 1935-1970.
Source: See source for series E 203.See also general note for series E 203-213.For the period 1935-1946, 27 of the 51 cities used for utility pricing
were included in residential heating. For 1947-1952, 1 6 of 34 citieswere included; for 1953-1963, 28 of 46 cities; for 1964-1965, 46 of 50CPI urban areas; and, from 1966-1970, 50 of the 56 areas.
The price for each city was calculated as an average of the ratesper therm in all of the heating rate blocks of the rate schedule,weighted by the total number of therms sold by the gas companyin that rate block for residential heating. For the averagerates per therm for the various cities were then combined, using totalthermal sales for residential heating in each city as weights. For1953-1970, they were combined with consumption and populationweights in the CPI.
E 207. Retail price indexes of gas for other than residential heating, composite, 1935-1970.
Source: See source for series E 203.See also general note for series E 203-213.In 1935, BLS began pricing net monthly bills based upon a definite
number of heat units (therms of 100,000 BTU each) for each of 4selected services--10.6, 19.6, 30.6, and 40.6 therms. These 4 typicalservices were continued from 1935 through 1952. Fornet monthly bills for 10 and 25 therms were used and, for 1964-1970,net monthly bills of 10, 25, and 40 therms. This method of calcu-lating prices has provided a better measure of price changes since differences in heating values over time could be taken into account.
Indexes based on 10.6 and 30.6 therms back to 1923 and a descrip-tion of the adopted in 1936 are included in BLS Bulletin 628,Changes in Retail Prices of Gas.
The number of cities included was 34 for 1935-1952 and 46 for1953-1963. With the revised of 1964, 49 of cities were pricedfor gas other than residential heating, and, in 1966, this went to 56of 56 CPI cities. For the methods of combining monthly bills used,see text for series E 203.
E 208. Retail price indexes of gas for other than residential heating, 10 therms, 1935-1970.
Source: See source for series E 203.See also general note for series E and text for E 207.For 1935-June 1947, the net monthly bill for 10.6 therms was
computed for each city, and cities were combined on the basis ofnumber of residential customers as of December 1946. For July1947-1970,prices were obtained for 10 therms and city averages werecombined with the consumption and population weights of the CPI.
196

E 209-214 PRICES PRICE
Annual averages were estimated from quarterly figures for1951,and from monthly figures beginning in 1952.
E 209. Retail price indexes of gas for other than residential heating, 25 therms,
Source: See source for series E 203.
See also general note for series E 203-213 and text for series E 207.With the revision of January 1964,pricing of 25 and 40 therm net
bills was initiated. Pricing occurred in 40 of the 50 CPI cities inDecember 1963 and was increased to 55 of 56 CPI cities when theCPI was expanded in December 1965. For frequency of collectionand methods employed to combine city data, see text for series E 208.
E 210. Retail price indexes of fuel oil and coal for residential use, 1935-1970.
Source: See source for series E 203.
See also general note for series This is a composite index combining consumption and population
weights of fuel oil and coal used for the individual CPI commodities.In addition to fuel oil No. 2, the commodities priced for this indexincluded, for varying periods of time, fuel oils No. 3 and No. 4,kerosene, anthracite, and bituminous coal. Pricing of petroleumfuels, other than fuel No. 2,was discontinued in 1964.
E 211. Retail price indexes of No. 2 fuel oil for residential use, 1970.
Source: See source for series E 203.
See also general note for series E 203-213.Retail prices of petroleum fuels were first collected in 24 cities in
1937 and data were obtained back to 1935. Thereafter, the numberof cities was increased as fuel oil for heating became more important. Beginning in 1947,the city coverage was restricted to those included in the CPI and, through 1963,usually covered about 20 cities. For1964 and 1965,30 of the 50 CPI cities were covered and, from 1966t o 1970,32 of 56 CPI cities were covered.
The prices from which the index was computed refer to prices per 100 gallons delivered in “the amount usually delivered a t one time.”No. 2 fuel oil has been priced continuously and, for 1939-1947,No. 3oil also was priced and included. Average prices for each city weresimple averages of quotations from a sample of dealers. For1938,city averages were combined with CPI consumption and popu-lation weights. For 1939-1946,weighting factors to combine cityaverages were obtained from 1941 shipments t o each city as measuredby Office of Price Administration rationing authorities. CPI weightswere again employed after 1946 to obtain the US. averages.
E 212. Retail price indexes of Pennsylvania anthracite for residential
Source: U.S.Bureau of Labor Statistics, Retail Prices and
See also general note for series E 203-213.
use, stove size, 1913-1962.
of Fuels and Electricity, December issues.
Data for the early years by type of coal for each firm reportingwere published in BLS Bulletin 105,Retail Prices, 1890-1911. Similardata for 1912-1917 are included in later issues of Retail Prices. Sincethe first collection, BLS has continuously obtained retail prices forall locally important fuels.
This index was based on average prices per net ton delivered atthe curb or in the bin if there was no extra charge. Prices fromdealers in each city always have been combined as a simple averagefor each city. For 1913-1928,city averages were combined also on anunweighted basis. Through a revision of method in 1936,city averageprices for 1929-1952were weighted by fixed weights based on anthra-cite shipments to each city by rail during the year ending July 1936.For the city averages were combined with consumption and population weights of the CPI.
Cities for which anthracite prices were obtained varied partly be-cause of change in consumer demand and partly due t o CPI revisions.Generally the number of cities has declined until, with the revision ofJanuary 1964, indexes of retail prices for anthracite coal were nolonger published.
E 213. Retail price indexes of bituminous coal for residential use, alldomestic sizes, 1913-1962.
Source: See source for series E 212.See also general note for series E 203-213.For methods of collection and averaging of prices, see text for
series E 212. Generally, the index was based on unweighted averages of all prices for all sizes and types of bituminous coal for 1913-June1947,and on city averages weighted with CPI weighting factors forJuly 1947-1962. Publication of this series also was discontinuedeffective with the January 1964 revision of the CPI.
E 214. Rent indexes (Warren and Pearson) for dwelling units 5
Source: George F. Warren and Frank A. Pearson, Prices,John Wileyand Sons, New York, 1933, 267 (copyright).
See also G. F. Warren and F. A. Pearson, WholesalePrices for 213Years, 1720-1 University Agricultural Experiment Sta-tion, Memoir Ithaca, New York, 1932,p. 27.
Therental data were obtained from the special report by J. D. Weeks,“Report on the Average Retail Prices of Necessaries of Life in theUnited States” in volume 20 of the Tenth Census of the UnitedStates, pp. 104-107.
large cities, 1860-1880.
The method of calculating this index was not indicated.
More Recent Data for Historical Statistics Series* *Statistics for more recent years in continuation of many of the still-active series shown here appear in annual issues of the Statistical Abstract of the States, beginning with the 1975 edition. For* direct linkage of the historical series to the tables in the Abstract, see Appendix I in the Abstract. **
196

IMPLICIT PRICE DEFLATORS
Series E 1-22. Implicit Price Deflators for Gross National Product: 1929 to 1970[Index numbers, See series F 5 for GNP price deflator data for 1869-19281
E 1-12
Year
Grossnationalproduct
1
135.2128.2122.3117.6113.9
110.9108.8107.2105.8104.6
103.3101.6100.097.594.0
90.989.688.387.585.6
80.279.179.674.666.7
59.758.256.853.047.2
43.943.243.944.542.7
42.642.239.340.244.8
49.350.6
Personal consumption expenditures
Total Durablegoods
I-129.3123.5118.4114.4111.5
108.8107.4106.1104.9103.9
102.9101.3100.0
97.794.8
9 2 . 892.591.790.588.6
82.981.782.377.970.5
65.463.259.954.848.7
45.545.145.646.544.7
44.443.540.642.347.9
53.655.3
108.9106.1103.4100.398.7
99.6110.4100.4100.8100.6
100.9101.4100.098.494.9
91.992.994.395.494.2
87.886.886.382.776.8
75.971.564.269.350.4
46.546.046.745.843.6
43.744.741.943.249.1
55.3
Non-durablegoods
4
127.7122.2117.1113.0110.7
106.9104.9104.0102.8101.9
101.299.9
100.097.794.9
93.694.293.994.393.3
86.085.688.583.674.3
68.766.262.555.647.7
43.843.244.046.444.8
44.542.738.037.744.1
51.654.5
Services
5
140.1133.2126.9122.2118.3
115.1113.1110.9109.0107.6
105.8103.0100.097.394.6
92.090.087.783.680.0
76.374.372.167.962.7
58.757.555.352.749.8
47.947.747.746.845.0
44.444.343.648.352.7
55.756.1
Gross private domestic investment
Fixed investment
Total
Total Structure!
6 7 8
182.2126.4120.4115.9111.8
109.3107.6106.0104.9103.9
103.4102.6100.098.594.0
89.086.886.685.383.1
77.574.773.966.758.5
51.551.149.346.542.0
39.037.738.237.834.6
34.333.730.631.635.2
37 9
130.0123.0117.5113.8110.2
107.5105.7104.5104.1103.4
102.9102.2100.097.992.4
86.784.884.082.680.4
74.472.870.764.556.3
5151.049.947.8
40.038.739.338.835.6
35.934.931.632.935.8
38.139.9
42.7
152.6141.0129.8124.0118.9
114.7111.1108.9107.1105.6
104.0102.7100.0
98.693.4
88.186.084.983.279.3
72.971.271.564.454.4
49.248.646.841.336.4
33.933.133.934.430.2
30.628.927.927.631.1
34.035.7
Producer?durable
equipmer
9
120.1115.5112.c109.106.
103.9103.0102.3102.3102.1
102.2102.0100.097.591.8
85.984.083.582.280.9
75.273.670.364.657.5
51.751.951.1
46.3
43.442.243.041.438.5
38.738.834.539.141.1
43.044.6
Residential
Total
10 11
140.0137.7
7123.1117.4
114.2112.3108.9106.7
104.5103.1100.099.897.4
92.990.491.990.888.6
82.5
80.871.759.7
54.951.647.043.340.3
36.935.735.534.331.3
29.830.127.127.333.6
37.138.1
137.1129.5123.1117.4
114.3112.4109.0106.8105.0
104.4103.1100.099.897.4
92.990.391.891.088.4
82.578.280.571.359.4
64.651.146.843.440.6
37.235.935.734.431.2
29.730.127.127.433.7
37.138.0
Farm
12
134.9132.9125.6122.6116.1
1 1 0 . 1108.2107.2104.6104.9
105.0103.0100.0100.597.7
93.491.993.386.892.2
82.982.785.778.663.5
58.555.848.842.036.3
32.332.031.833.332.2
50.730.826.726.232.1
38.03 9 . 1
197

E 13-22
Total
PRICES PRICE INDEXES
Series E 1-22. Price Deflators for Gross National Product: 1929 to 1970-Con.
FederalYear
13
Government purchases of goodsand services
1 4
130.3124.3118.9114.3111.6
108.3107.0105.8104.7103.7
102.8101.4100.097.994.5
91.690.889.689.087.4
81.480.681.476.368.2
62.662.060.955.548.7
44.748.944.645.343.4
43.543.039.940.945.7
50.451.7
157.6144.0135.1123.5124.0
119.4115.7111.8109.0107.1
102.4100.096.492.1
87.184.181.381.078.5
71.871.068.162.955.3
52.658.158.950.944.0
38.537.988.333.437.6
37.036.834.533.436.3
37.938.6
149.2134.5126.5121.5113.8
115.5112.2108.0105.6105.2
104.2102.2100.095.891.7
86.933.531.431.279.4
73.069.36 5 . 657.3
53.153.354.952.546.6
40.240.840.540.740.5
37.037.433 .181.984.5
34.136.0
Stateandlocal
15
165.0153.6144.R136.4129.4
123.5119.5116.3113.2109.4
102.6100.097.392.7
87.535.382.880.676.9
70.863.966.460.453.2
43.646.144.642.339.2
37.336.336.837.135.9
37.036.635.033.836.6
33.739.1
[Indexnumbers, 1958 =
Goodsoutput
16
122.3117.3113.1109.9107.4
105.0103.5103.0102.6101.9
101.4100.6100.097.994.3
91.691.690.691.491.0
84.384.686.481 .172.6
65.164.664.259.250.5
45.244.245.146.744.8
45.044.239.233.945.0
53.9
Final sales
Services
17
44.244.244.443.742.3
41.641.540.844.543.1
50.651.4
Structures
18
35.734.635.035.132.2
31.531.629.527.933.2
36.437.7
B y sector
Private
Total Business
19 20
129.0123.2113.0114.0110.9
108.3106.6105.4104.4103.5
102.6101.3100.097.994.5
91.690.389.789.187.5
81.68081.776.568.4
62.762.861.356.149.2
45.244.445.345.944.1
44.243.840.641.546.2
5 1 . 152.2
Householdsand,
institutions
21
185.5172.5159.4
138.1
131.7126.4120.9116.2112.3
108.8104.0100.096.292.4
39.837.985.482.078.1
74.472.671.068.163.1
52.245.237.633.7
32.132.031.632.030.2
29.429.229.231.434.5
37.333.9
22
183.8171.0159.1147.7140.3
133.5123.4121.5116.6113.6
108.6104.2100.093.388.7
34.079.576.674.470.5
67.164.760.858.555.4
43.343.339.737.334.7
36.036.8
36.536.5
34.734.333.533.734.5
34.134.1
198

PRICE
Series E 23-39. Wholesale Price Indexes (BLS), by Major Product Groups: 1890 to 1970
Motorvehicles
andequip-ment
E 23-39
35.236.734.836.537.5
39.441.940.740.241.9
Indus-trial
ities
Farmprod-ucts
Proc-essedfoodsand
feeds
prod-uctsand
appare
Hidesskins,
andrelatecprod-ucts
Fuelsand
relatedprod-uctsand
power
Chem-icalsand
alliedprod-ucts
andplasticprod-ucts equip-
ment
35
F u r ntureand
household
36
miner;prod-ducts
Miscel-laneousprod-ucts
Lumbe.and
woodprod-ucts
andalliedprod-ucts
Metaland
prod-ucts
34
102.6
96.493.E91.391.291.9
92.492.390.491.089.2
82.176.976.373.973.8
66.363.062.554.944.3
39.639.089.039.138.5
37.837.638.039.434.5
33.833.930.729.932.6
36.240.238.838.841.4
All
itiesYear
24 25 26 27 28 29 30 31 32
113.7125.2113.3100.0100.2
95.996.493.591.691.0
95.398.892.493.598.5
97.192.694.394.497.2
89.377.784.073.447.2
41.240.637.735.632.7
27.424.824.126 .522.4
21.422.319.01 6 . 018.6
22.925.024.125.026.5
37 38 3 9
109.9104.9102.2100.097.7
95.995.294.593.793.3
93.092.292.090.287.6
110.46
102.6c
96.694.794.594.894.5
94.994.894.693.390.7
87.387.687.488.691.1
81.878.782.876.562.3
54.653.653.3
45.1
40.539.840.544.541.7
41.338.634.033.637.6
44.649.150.049.351.6
110.0106.0102.5100.098.5
96.495.294.794.894.8
95.395.393.693.390.8
86.985.084.884.18 6 . 1
78.075.376.970.858.0
53.052.351.55 0 . 74 7 . 3
44.043.343.445.242.2
41.441.637.837.339.9
45.248.649.350.053.2
110.1108.6103.5
103.6
94.:
91.7
94.282.982.081.9
77.377.681.380.199.1
86.379.984.283.361.1
52.952.252.752.848.4
45.242.841.646.942.7
40.238.836.332.838.6
44.948.954.448.344.8
105.9101.098.9
100.097.8
95.593.796.396.797.2
96.195.395.399.194.0
91.291.392.690 .190.3
87.186.290.576.964.4
60.159.557.856.254.6
51.452.354.655.554.5
52.652.447.650.348.3
56.259.460.463.271.5
102.299.999.8
100.099.4
99.098.397.999.1
100.7
101.8101.6102.0101.299.1
98.598.997.796.5
101.7
88.987.695.993.770.5
65.264.864.163.357.0
62.451.5
54.552.0
51.749.647.4
108.6105.4103.4100.097.8
95.995.596.896.399.2
103.1102.9103.3103.4103.8
102.490.489.195.5
105.4
85.970.572.870.570.8
70.572.773.671.661.5
57.161.258.960.051.0
47.347.040.238.344.2
62.059.468.286.2
113.6
111.4106.4103.2100.0
93.992.892.292.091.9
92.091.389.487.681.8
75.773.472.270.670.5
63.1
58.253.746.4
42.242.142.442.842.1
41.441.3
107.
100.198.1
96 .!97..
97.:
99.:99.198.595.5
93.392.991.990.191.8
34.782.981.677.067.1
63.263.161.461.857.2
53.852.652.854.148.8
48.148.544.644.550.5
54.955.856.357.759.1
97.:97.1
97.t
97.297. c95.E94.891.3
87.585.183.380.180.1
75.473.571.666.359.3
55.753.552.452.350.2
49.149.150.051.750.5
50.450.447.244.647.7
51.051.251.850.352.5
108.5104.7102.8100.098.6
98.598.397.398.698.6
98.8100.398.195.191.2
86.383.883.684.079.4
111.0108.8102.5100.0105.9
98.794.696.098.096.3
97.297.5
103.999.596.9
98.2104.7106.2117.2124.2
106.7101.6117.5109.490.9
78.575.575.064.850.3
41.440.042.052.949.5
48.140.031.429.539.7
54.264.1
1964- _ _ _
_ _ _1958
_ _ _1954- _ _ _1952- _ _ __ _ _
86.586.435.683.483.9
1950-_ _ _1949- _ _ __ _ _ 79.2
78.076.573.5
_ _ __ _ _
1936-
1934-
1930- _ _ _1928-1927-1926-
3Y.1
ities
trial Farmcommod- products
ities
Allcommod-
ities
23
Allcommod-
ities
23
Year Year Year
23 24 25
54.6 67.153.1 61.1 55.6 60.454.4 57.4 55.7 54.1
43.743.543.7
I I
199

9'980'68
86
6'869'601
801
9'801
9'860'601
L'LL
8'69
6989
09
8'
O'PP
Z'
8'86
1'801
3'08
982 983'88
8L
9'98
8'
E'PL
I'LL
I'LL
LZT
Z'PP
E'PP
5'88
"091
001,
98
" 06
.
8'9L
P'OL
0 ' 8 6
8'6018'98
8'08
8'06
0'00196
2 '08
98
66
3'801
, 681
8'
6'
9'
9'99
L
8'96
9'96
8'88
B'OL
"GL
3'08
Z'PP
L'LP
08
69
96
86001
6P1
,
1'89
6'089'989'68
9'968'001
5' 161
=
9'99
Z'8P
L'LP
8'99
9'06
0'1016'66
P'OLE '
66
5'901
5'891
899'99
99
9'69
8'99
P800
9'86
3'001
99
,
Z'ZE
8'19
8'691'89
9'881
L 96
869 '801
0 001
98
0'08
8'088' 98
9'8L
8'861'801
8'901

E 52-63WHOLESALE PRICE
Series E 52-63. Wholesale Price Indexes (Warren and by Major Product Groups: 1749 to 1890
Year
52
8231868532
85931011103
1009091106110
126133136130
135151158162174
18519313310489
939593111105
110108978883
8482829083
8377
8292
95112110115114
10090959594
9196979899
10398103106102
106125147151151
170182162131126
7167757168
7282879989
72728939
99102103
102
112128138133140
1481621138675
7782769584
9898837771
7162597258
58
485364
6586828489
7564696361
5859585962
676164
64
6887117
11s
10481
Foods
54
8679868678
8493103114106
969093115
120126122
139154171167173
18018912310789
969997123116
126117989584
8488879684
8472778090
102126128
128
107931009998
9410099100
101
18'
14:
Hidesand
roducts
55
74808692101
105
107108109
11310095109104
123128132130126
128134126132146
15216413310890
102115110139121
104100847065
6764566657
6366697286
809080
78
7470768591
91
91
91
10:11:
7:7:
56
103999898
100
105109116119119
128114115125138
141151175177170
179194197220245
266264206147120
119120123
129
125124119113115
116111113117122
125125114132140
146159157167177
170161162161
181181
191
21123:
2925'24:
andlighting
7271727070
7277899291
928098108127
128135148153152
134166149144160
2141971258780
9893909797
102
1029387
959393
88
96903794111
122121
111101111
11:
131131
13t
13:
15'
14!1419'
52
1816
Metalsand
metal
58
123116121119110
109124144157150
166134126141157
175194243257203
200227225248278
306354236180152
149150154173174
176191186144141
147155170186191
189179172183204
204220219243241
206201205212209
209227234243269
279242247257261
270285279277
399464
356
59
8481808182
81
858883
8174723084
90101106107102
101110116120128
118114886963
6564677873
7170676461
6158616164
6459586267
6570707053
5252514949
4749515152
5048495050
535556
57
Chem-
anddrugs
60
90
1039799
100105110114120
120120127136140
14917618175177
199227204229283
300297234206174
175168168171176
178174169156153
154
153156164
178187188203220
9194949294
99105110109109
117105109118123
184149160159154
164178178196220
214222165124110
117118121130128
129129128118
114110111117110
10710899113121
128
Spirits
62
74807779
7981338081
8882828686
8878
7374
7886117146154
150106452821
2324232730
3127221920
2121222420
2120191719
2125252525
2319222223
1919192121
2219202121
2224293134
4148373431
Miscel-laneous
63
8980737574
7878939390
9190889598
98111115125120
128136153162170
17518914612298
9898102107114
103103968986
8892999986
8596109111113
108122120119130
126109105110111
111117
112110
114119119118129
124144149156177
202246261234204
201

E 52-72 PRICES AND PRICE INDEXES
Series E 52-63. Wholesale Price Indexes (Warren and Pearson), by Major Product Groups: 1749 to
108.9105.3101.7100.0100.9
96.994.795.195.695.1
95.495.196.594.992.6
91.893.793.997.1
90.687.295.589.2
110.2 112.0106.2 107.7102.6 103.5100.0 100.099.1 97.9
96.3 95.894.8 94.694.3 93.594.5 93.594.4 93.6
94.8 94.194.6 94.0 93.8 92.292.8 90.9 90.0 87.5
86.6 82.285.7 79.485.0 78.485.1 76.787.0 76.3
78.4 69.6 75.5 67.378.2 65.472.3 59.4
1aneo
111.4108.0102.2100.0103.7
98.194.995.996.995.7
96.296.599.196.594.6
94.396.998.6104.7109.7
97.593.3103.895.7
123.6114.199.6100.0107.4
103.296.688.387.993.8
92.197.892.9104.9116.8
104.886.594.999.5102.6
78.197.182.0
All Farmmodities products
Year
Chem-Building icalsmaterials and!Hides
and Textileleather products
products
Metalsand
metalproducts
Foods Fuel andlighting
Spirits All com-modities
52
Year
I 54 65 56 62
2927232223
2423252427
2524262631
25232219
171615
63
332350336327328
309300290301348
322310304299284
259258240240
247250236.
.
.
75 27873 32379 27982 27485 280
85 270 84 25283 23280 23071 236
59 48360 53857 45559 44058 519
51156 49353 43155 37755 445
51 42751 52351 4425458
225227226
Series E 64-72. Wholesale Price Indexes (BLS), by Durability of Product: 1947 to 1970= 1001
All commodities Manufactures Raw or slightly processed goods
Nondurable Total Durable--I! 67 I! 68
Nondurable Total Durable Nondurable
7269 70 71
108.2104.6101.5100.0100.0
96.893.794.895.195.0
95.294.895.494.792.4
110.7107.6102.3100.0103.5
97.894.896.497.495.8
96.496.499.496.093.4
93.797.698.9
110.1
97.994.2104.296.6
91.292.291.993.898.4
37.784.391.886.0
202
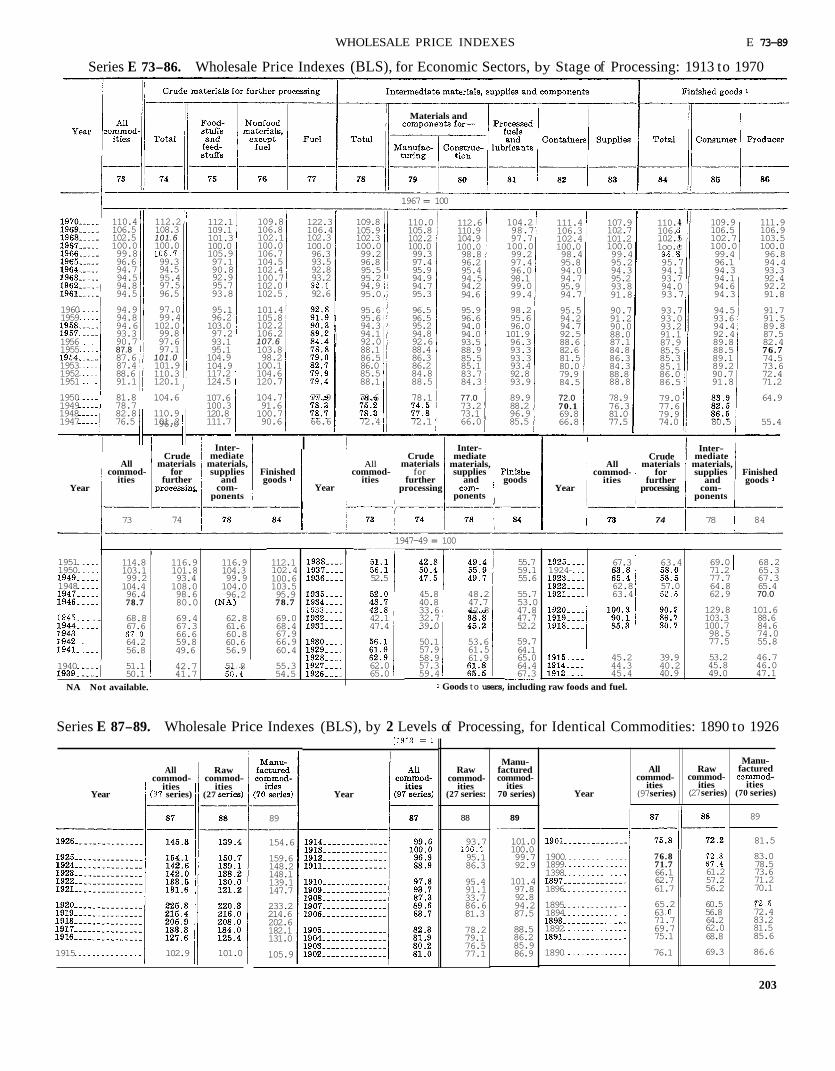
WHOLESALE PRICE INDEXES E 73-89
Series E 73-86. Wholesale Price Indexes (BLS), for Economic Sectors, by Stage of Processing: 1913 to 1970
Materials and
1924-67.3 63.4
62.8 57.063.4
19511950
1948
..
114.8 116.9103.1 101.899.2 93.4104.4 108.096.4 98.678.7 80.0
68.8 69.467.6 67.3
66.664.2 59.856.8 49.6
112.1102.4100.6103.595.978.7
69.068.467.966.960.4
55.354.5
Allcommod-
ities(97series)Year
Rawcommod-
ities(27series)
190018991398
1896
76.871.7
61.266.162.7 57.2
56.261.7
18951894
1892
1890
65.2 60.556.863
71.7 64.262.069.7
75.1 68.8
69.376.1
1967= 100
104.298.797.7100.099.297.496.098.199.099.4
98.295.696.0101.996.393.393.393.492.893.9
89.988.296.985.5
111.4106.3102.4100.098.495.894.094.795.994.7
95.594.294.792.588.682.681.580.079.984.5
72.070.169.866.8
107.9102.7101.2100.099.495.294.395.293.891.8
110.4106.102.51oo.c
95.794.193.794.093.7
93.793.093.291.187.985.585.385.186.086.5
79.077.679.974.0
112.1109.1101.3100.0105.997.190.892.995.793.8
95.196.2103.097.293.195.1104.9104.9117.2124.5
107.6100.3120.8111.7
110.0105.8102.2100.099.397.495.994.994.795.3
112.6110.9104.9100.098.896.295.494.594.294.6
112.2108.3101.6100.0
99.394.595.497.596.5
109.8106.8102.1100.0106.7104.5102.4100.7102.0102.5
110.4106.5102.5100.099.896.694.794.594.894.5
122.3106.4102.3100.096.393.592.893.2
92.6
109.8105.9102.3100.099.296.895.595.294.995.0
109.9 111.9106.5 106.9102.7 103.5100.0 100.099.4 96.896.1 94.494.3 93.394.1 92.494.6 92.294.3 91.8
95.6 96.595.6 96.5
95.294.394.1 94.8! 92.0 92.688.1 88.486.5 86.386.0 86.285.5 84.888.1 88.5
101.4105.8102.2106.2107.6103.898.2100.1104.6120.7
95.996.694.094.093.588.985.585.183.784.3
90.791.290.088.087.184.886.384.388.888.8
78.976.381.077.5
1960 94.9 97.01959 94.8 99.4
94.6 102.093.3 99.8
1956 90.7 97.61955 87.8 97.1
87.6 101.01953 87.4 101.91952 88.6 110.31951 91.1 120.1
94.5 91.793.6 91.594.4 89.892.4 87.589.8 82.488.5 76.789.1 74.589.2 73.690.7 72.491.8 71.2
1950 81.8 104.61949 78.7
96.01948 82.8 110.91947 76.5 101.2
104.791.6100.790.6
77.073.273.166.0
77.9 78.6 78.1
66.6 72.4 72.1
64.9
80.5 55.4
I !Inter-mediate
materials,supplies
andcom-
ponents
Inter-mediate
materials,supplies
ponents
and goods
I
Inter-mediate
materials,supplies Finished
and goodscom-
ponents
Allcommod-
ities
Crudematerials
forfurther
processing
Crudematerials
forfurther
processing
Crude
ities further
All materials
Year
commod- forAll
commod-ities
Finishedgoods
Year Year
73 74 74 78 84
I
1947-49 = 100
52.5
I I
55.759.155.6
55.753.047.847.752.2
59.764.165.064.467.3
69.0 68.271.2 65.377.7 67.364.8 65.462.9 70.0
116.9104.399.9104.096.2 45.8 48.2
40.8 47.7 33.6 42.832.739.0
129.8 101.6103.3 88.6100.7 84.698.5 74.077.5 55.8
62.861.660.860.656.9
42.147.4
50.1 53.657.9 61.558.9 61.957.359.4
53.2 46.745.8 46.049.0 47.1
45.2 39.944.3 40.245.4 40.9
1940 51.1 42.750.1 41.7
NA Not available.
51 8 62.065.0
Goods t o users,including raw foods and fuel.
Series E 87-89. Wholesale Price Indexes (BLS), by 2 Levels of Processing, for Identical Commodities: 1890 to 1926=
! Manu-facturedcommod-
ities70 series)
Manu-factured
ities(70 series)
All Rawcommod- commod-
ities itiesYear series) (27
Rawcommod-
ities(27 series:
88
93.7
95.186.3
95.491.133.786.681.3
78.279.176.577.1
itiesYear
89
101.0100.099.792.9
8989
81.5
83.078.573.671.270.1
72.483.281.585.6
86.6
154.6
159.6148.2148.1139.1147.7
233.2214.6202.6182.1131.0
101.497.892.894.287.5
88.586.285.986.91915 102.9 101.0 105.9
I
203

E 90-96 PRICES AND PRICE INDEXES
Series E 90-96. Wholesale Price Indexes (Taylor), for Charleston, South Carolina: 1732 to 1861
Year
Allcommoditie
100)
Allcommod-
ities(1818-42=
c.products(1762-74= 100)Year
All c.commod- products
ities (1762-74(1818-42 = 100)= 100)
90 95
606 5
3 989275
7784
3 12511796
s.products,
All S. C. other than Foreignexport C. imports’staples export
staples
ommodities export
All
(1818-42= 100)
commoditii
90
Other thans. c.exportstaples
93, 94
Year
--91 I / 92 I 93 94
1843-61
i
1813-22 = 100
949490
10697
9888847778
877367YO75
706866
7485
83107103108121
10898938681
8282858792
1099398
108101
110133179
1010
11
1718’
14’12:10
8’10’O!
11:
13f
12:
12214L
97
OE
3 19213E
14411311299
123116
182111969 190
888586
10085
827474
166969294
109
9593897984
919092
107105
102106106
105116
106125114 116
115 10810399 1089 1 9692 97
102 12386 8579 66
105 11088 83
77 75 7971 74 67
110
1796-1812 100
106100
9 185838892
105102
9091
118
108110106108122
72
77 6685 8079 7476 7094 10097 101
111 116101 10098 10693 96
120 122
108 114117 125 114 123 108 108128 134
7485
83107103108121
10893938681
8282
8792
1099398
101
110133179
6781
75108
8892
129
12897947870
7872807783
1389994
100103
121131220
90114123
124
10091939188
80858 18796
848294
10892
97133160
83909290
100
9 19 1898986
9397
103104104
110102111122118
114128135
C. products Imported(1762-74 100) (1781,1784-91
95 96
10610686879798
110119113128142142
8486
170 1503 137 3 146
3 3
All s. c. Allcommod- products commod-
ities (1762-74 ities(1818-42 = 100) Year (1818-42= 100) = 100)
s. c.products(1762-74= 100)
95
Year Year
90 90 90 95I
1129783
10096886945
466470
66 8576 97
67
62
72
6160
1766 82 10510880
62 7987I1765
Combination for 1796 t o 1822 designated as “Other than South Carolina export staples.”Includes goods imported from abroad and from other parts of the United States.
3 Based on part of year only.
204
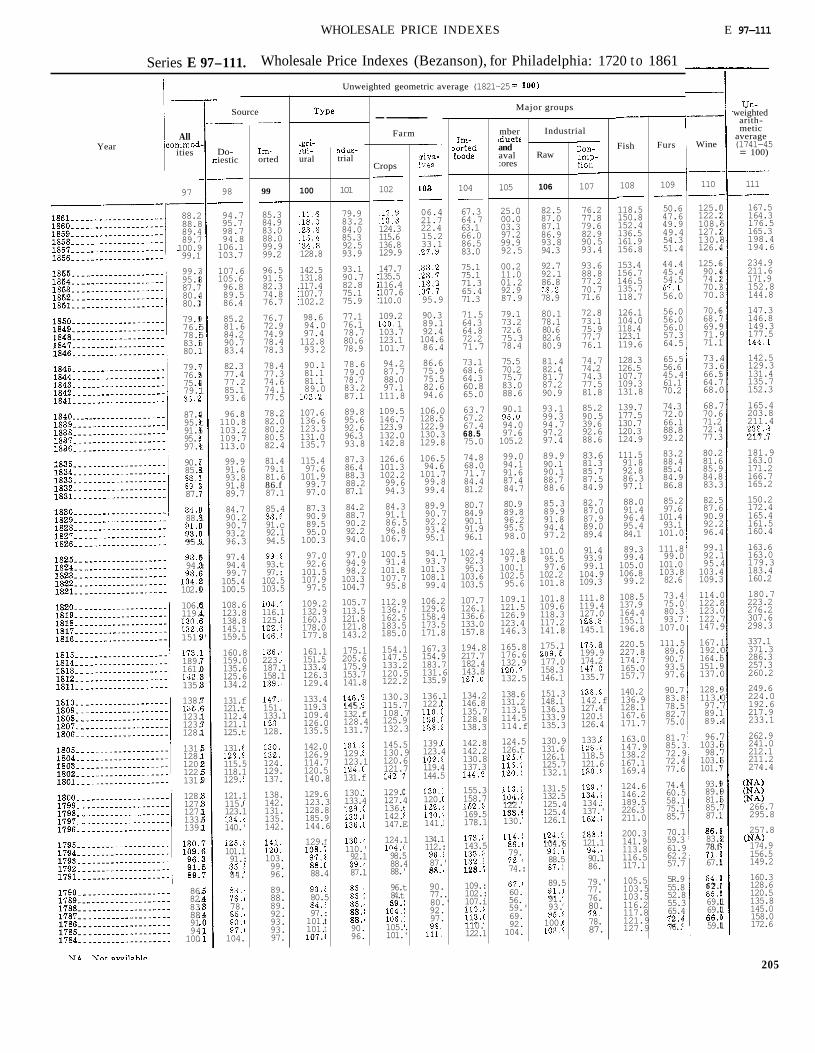
WHOLESALE PRICE INDEXES E 97-111
Crops
102
124.3115.6136.8129.9
147.7135.5116.4107.6110.0
109.21
103.7123.1101.7
94.287.788.097.1111.8
109.5146.7123.9132.0142.8
126.6101.3102.299.694.3
84.391.186.596.8106.7
100.591.4101.8107.795.8
112.9136.7162.5183.5185.0
154.1147.5133.2120.5122.2
130.3115.7108.7125.9132.3
145.5130.9120.6121.7
129.c127.4136.142.147.E
124.1
98.588.488.'
96.t84.t
105..101.'
Series E 97-111. Wholesale Price Indexes (Bezanson), for Philadelphia: 1720 to 1861Unweighted geometric average (1821-25
Major groups weightedarith-metic
average
= 100)(1741-45
Source
ortedFish
---Farm
Do-iestic
98
94.795.798.794.8106.1103.7
107.6105.696.889.586.4
85.281.684.290.783.4
82.377.477.285.193.6
96.8110.8103.2109.7113.0
99.991.693.891.889.7
84.790.290.793.296.3
97.494.499.7105.4100.5
108.6123.8138.8145.1159.5
160.8159.0135.6125.6134.2
131.f121.t112.4121.1125.t
131
115.5118.1129.
121.1115.123.1
140.'
101.191.:
84.
78.
104.
mber
andaval:ores
Industrial
ural
Allities
97107
Year
06.421.722.415.233.1
95.9
90.389.192.4104.686.4
86.675.975.582.694.6
106.0128.5122.9130.3129.8
106.594.6101.799.899.4
89.990.792.293.495.1
94.193.7101.3108.199.4
106.2129.6158.4173.5171.8
167.3154.9183.7131.6135.9
136.1122.
139.123.4
119.4144.5
120.
141.I
134.1112.:
87.'
90.77..80.'92.97.
Furs Winetrial Raw
108
118.5150.8152.4136.5161.9156.8
153.4156.7146.5135.7118.7
126.1104.0118.4123.1119.6
128.3126.5107.7109.3131.8
139.7177.5130.7120.3124.9
111.591.892.886.397.1
88.091.496.495.484.1
89.399.4105.0106.899.2
108.5137.9164.4155.1196.8
220.5227.8174.7165.0157.7
140.2136.9128.1167.6171.7
163.0147.9138.2167.1169.4
124.6146.2189.5226.3211.0
200.3141.9113.8116.5117.1
105.5103.5103.5116.2117.8121.9127.9
109
50.647.649.949.454.351.4
44.445.454.5
56.0
56.056.056.057.364.5
65.556.645.461.170.2
74.372.066.188.892.2
83.288.485.484.986.8
85.297.6101.493.1101.0
111.899.0101.0103.882.6
73.475.080.393.7107.0
111.589.690.793.597.6
90.783.878.582.775.0
81.785.372.972.477.6
74.460.558.175.185.7
70.159.361.962.257.7
5R.955.852.855.365.4
76..
110 111104
67.364.763.166.086.583.0
75.175.171.365.471.3
71.564.364.872.271.7
73.168.664.360.865.0
63.767.267.468.575.0
74.868.071.784.481.2
80.784.990.191.996.1
102.492.395.3103.6103.5
107.7126.1136.6133.0157.8
194.8217.7182.4143.8
134.2146.8135.7128.8138.3
142.8142.2130.8137.3
155.3158.7
169.5178.1
143.5
109.:102.:107.i
110.122.1
105 10699
85.384.983.088.099.999.2
96.591.582.374.876.7
76.772.974.978.478.3
78.4
74.674.177.5
78.282.080.280.582.4
81.479.181.686.f87.1
85.4
91.c92.194.5
93.t97.:102.5103.5
116.1125.
223.187.1158.1
151.133.1
128.
124.129.137.
138.142.131.135.142.
103.99.96.
89.88.89.92.93.93.97.
77.3
100 101
125.0122.2108.5127.2130.8126.4
125.690.474.270.370.3
70.668.769.971.971.1
73.473.666.564.768.0
68.770.671.272.477.3
80.281.685.984.883.3
82.587.690.992.296.4
99.192.195.4103.4109.3
114.0122.8123.0122.7147.9
167.1192.0164.5151.9137.0
128.9113.097.789.189.4
96.7103.598.7103.6101.7
93.989.981.585.787.1
83.278.f
67.1
6 2 . I
69.169.1
59.1
167.5164.3176.5165.3198.4194.6
25.000.003.397.299.992.5
00.211.001.292.987.9
79.173.272.675.378.4
75.570.275.783.088.6
90.1
94.097.6105.2
99.094.191.687.484.7
80.989.896.295.598.0
102.897.8100.1102.595.6
109.1121.5126.9123.4146.3
165.8176.6132.9
132.5
138.6131.2113.5114.5114.f
124.5126.t
122.
130.
79.
74.:
60.56.59.'69.92.104.
82.587.087.186.993.894.3
92.792.186.8
78.9
80.178.180.682.680.9
81.482.481.787.290.9
93.199.394.797.297.4
89.990.190.188.788.6
85.389.991.894.497.2
101.095.597.6102.2101.8
101.8109.6118.3117.2141.8
175.1
177.0158.3146.1
151.3148.1136.3133.9135.3
130.9131.6126.1125.7132.1
131.5132.5125.4125.4126.1
104.6
88.5
89.5
91.93.
100.
76.277.879.682.990.593.4
93.688.877.270.771.6
72.873.175.977.776.1
74.774.274.377.581.8
85.290.539.692.688.6
83.681.385.787.584.9
82.787.087.989.089.4
91.493.999.1104.9109.3
111.8119.4127.0
145.1
199.9174.2
135.7
142.f127.4120.5126.4
133.
118.5121.6
134.137.'
121.1
90.186.
79.'77.76.80.
78.87.
a
128.8
142.5131.8117.4107.7102.2
98.694.097.4112.893.2
90.181.181.189.0
107.6136.6123.3131.0135.7
115.497.6101.999.797.0
87.390.989.595.0100.3
97.092.6101.5107.997.5
109.2132.9160.3178.0177.8
161.1151.5133.4126.3129.4
133.4119.3109.4126.0135.5
142.0126.9114.7120.5140.8
129.6123.3128.8185.9144.6
129.f
88.4
80.5
97.:101.t101.t
79.983.284.085.392.593.9
93.190.782.875.175.9
77.176.178.780.678.9
78.679.078.783.287.1
89.895.692.696.393.8
87.386.488.388.287.1
84.288.790.292.294.0
97.094.998.2103.3104.7
105.7113.5121.8121.8143.2
175.1205.6175.9153.7141.8
145.132.f128.4131.7
129.123.1
131.f
130.133.4
110.'92.1
87.1
90.96.
88.288.889.489.7100.999.1
99.395.887.780.480.3
79.976.578.583.580.1
79.776.575.479.1
87.495.t91.595.:97.t
90.:85.1
87.'
88.1
95..
94.:
102.1
106.1119..
151.'
189.161.
135.
138.
123.123.128.
131.128.120.122.131.
128.127.127.133.139.
234.9211.6171.9152.8144.8
147.3146.8149.3177.5
142.5129.3131.4135.7152.3
165.4203.8211.4
217.I
181.9163.0171.2166.7165.2
150.2172.4165.4161.5160.4
163.6163.0179.3183.4160.2
180.7223.2276.2307.6298.3
337.1371.3286.3257.3260.2
249.6224.0192.6217.9233.1
262.9241.0212.1211.2274.4
266.7295.8
257.8
174.9156.5149.2
160.3128.6120.5135.8145.0158.0172.6
86.82.83.88.9194,100
205
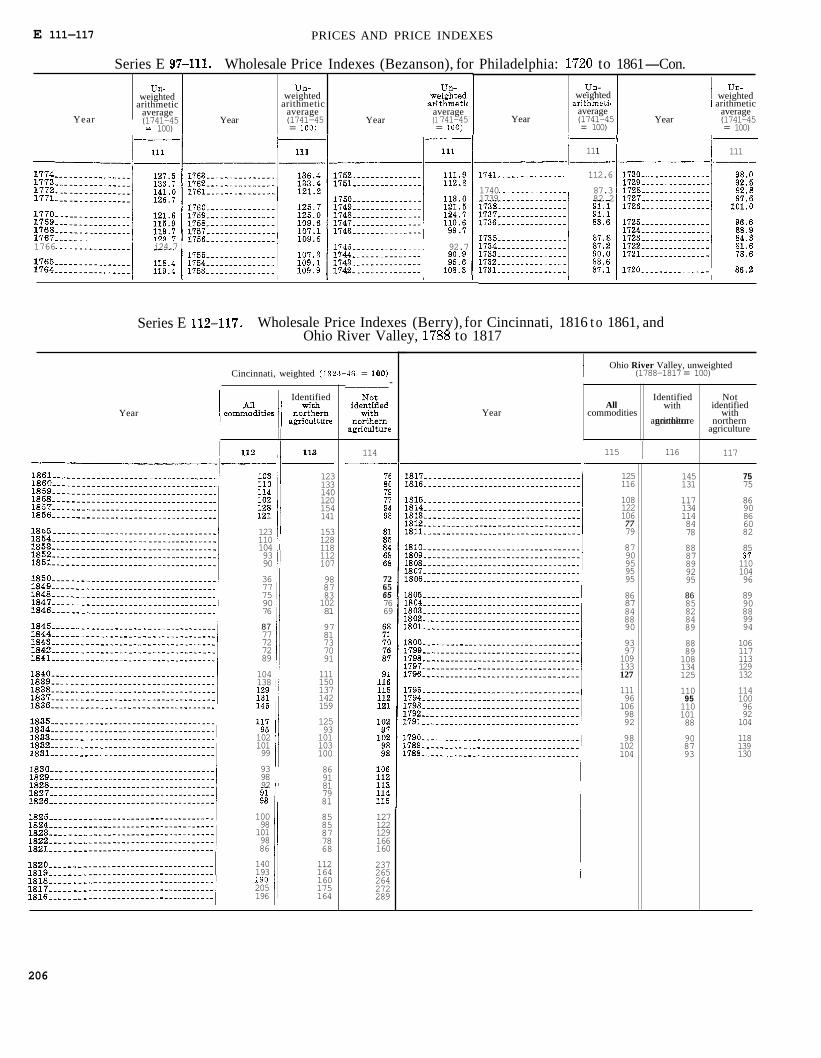
E 111-117 PRICES AND PRICE INDEXES
Year
Series E Wholesale Price Indexes (Bezanson), for Philadelphia: to 1861-Con.
weighted
average
= 100)(1741-45
weightedarithmetic
weightedarithmetic
average(1741-45
100)Year
weightedarithmetic
average(1741-45=
Year
Allcommodities
Identifiedwith
agriculture northern
average(1741-45=
average
= 100)Year (1741-45Year
111 111
112.6
1740 87.31739 82.2
92.71766 i24.7
Series E Wholesale Price Indexes (Berry), for Cincinnati, 1816 t o 1861, andOhio River Valley, to 1817
Ohio River Valley, unweighted (1788-1817= 100)Cincinnati, weighted =
____-Not
identifiedwith
northernagriculture
Identified
Year Year
115 116 117114
145131
1171341148478
8887899295
8685828489
8889108134125
1109511010188
908793
7575
8690866082
85
11010496
8990889994
106117113129132
1141009692104
118139130
123133140120154141
153128118112107
98878310281
9781737091
111150137142159
12593101103100
8691817981
8585877868
112164160175164
125116
1081221067779
8790959595
8687848890
9397109133127
111961069892
98102104
1231101049390
3677759076
8777727289
104138
7265657669
10210199
939892
127122129166160
237265264272289
100981019886
140193
205196
206
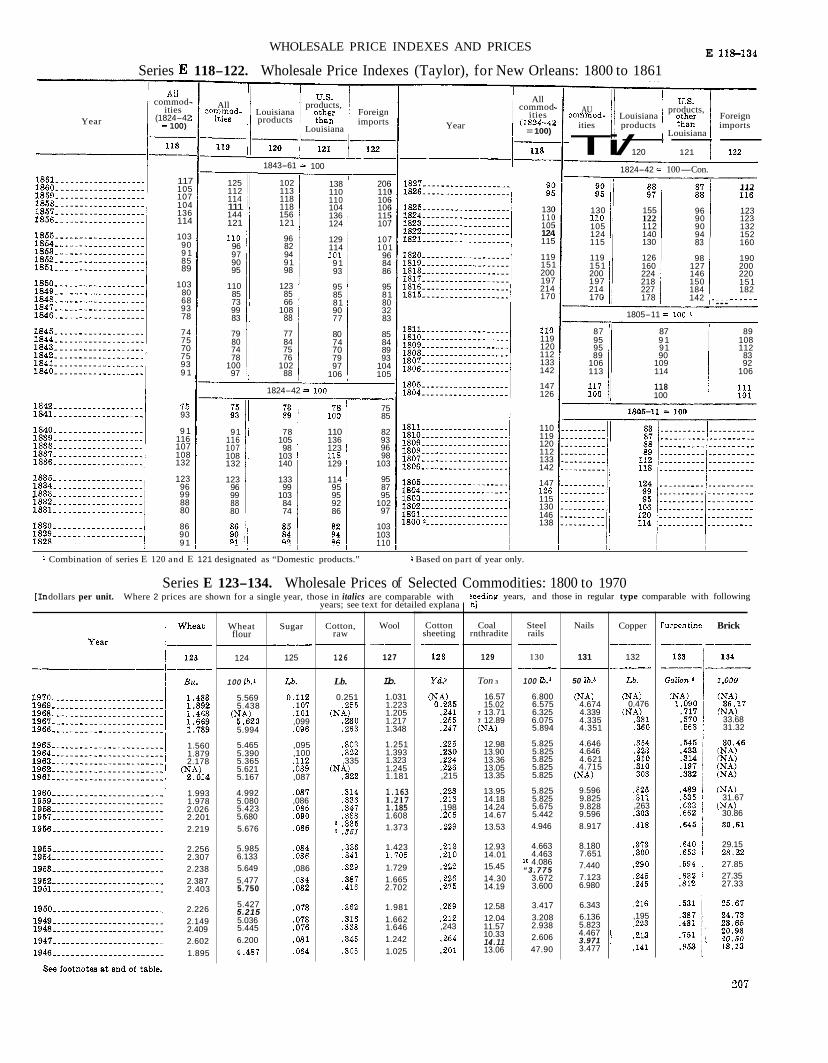
WHOLESALE PRICE INDEXES AND PRICES ESeries 118-122. Wholesale Price Indexes (Taylor), for New Orleans: 1800 to 1861
All products,products
Louisiana
Louisiana Foreignimports
commod-ities
100)(1824-42Year
AU products,Louisiana Foreign
ities products imports Louisiana
Allcommod
ities
=100)Year
---Ti/120 121
1824-42 100-Con.
112
1843-61 100
117105107104136114
103909 18589
10380689378
74757075939 1
93
9 1116107108132
12396998880
86909 1
1301 1 0105124115
119151200197214170
119120112133142
147126
110119120112133142
147
115130146138
125 102112 113114 118111 118144 156121 121
9696 8297 9490 9195 98
110 12385 8573 6699 10883 88
79 77 80 8474 7578 76
100 10297 88
138 206110 110110 106104 106 136 115124 107
129 107114 1 0 1
969 1 8493 86
95 9585 8181 8090 32 77 83
80 8574 8470 8979 9397 104
106 105
130 155 96 123122 90 123
105 112 90 132124 140 94 152 115 130 83 160
119 126 98 190151 160 127 200200 224 146 220197 218 150 151214 227 184 182170 178 142 _ _ _
1805-11
87 87 8995 9 1 10895 91 11289 90 83
106 109 92 113 114 106
1181001824-42
7585
82939698
103
958795
10297
103103110
91 78 110116 136105107 98 123108 103132 140 129
123 133 11496 99 9599 103 95 88 84 9280 74 86
Combination of series E 120 and E 121 designated as “Domestic products.” Based on part of year only.
Series E 123-134. Wholesale Prices of Selected Commodities: 1800 to 1970[Indollars per unit. Where 2 prices are shown for a single year, those in italics are comparable with
years; see text for detailed explana years, and those in regular type comparable with following
Wheatflour
Sugar
125
Wool
127
Cottonsheeting
Steelrails
130
100
6.8006.5756.3256.0755.894
5.8255.8255.8255.8255.825
5.8255.8255.6755.4424.946
4.6634.4634.086
“ 3 . 7 7 53.6723.600
3.4173.2082.9382.60647.90
Copper
132
0.476
,263
,195
BrickCoalrnthradite
129
Ton 3
16.5715.02
7 13.717 12.89
12.9813.9013.3613.0513.35
13.9514.1814.2414.6713.53
12.9314.0115.4514.3014.19
12.5812.0411.5710.3314.1113.06
Nails
131
50
4.6744.3394.3354.351
4.6464.6464.6214.715
9.5969.8259.8289.5968.917
8.1807.6517.4407.1236.980
6.3436.1365.8234.4673.9713.477
Cotton,raw
126124
100
5.5695.438
5.994
5.4655.3905.3655.6215.167
4.9925.0805.4235.6805.676
5.9856.1335.6495,4775.750
5.4275.2155.0365.4456.200
,099
,095,100
,087
,086
,086
Lb.0.251
,335
Lb.1.0311.2231.2051.2171.348
1.2511.3931.3231.2451.181
1.1631.2171.1851.6081.373
1.423
1.7291.6652.702
1.9811.6621.6461.2421.025
,215
,198
,243
33.6831.32
31.67
30.86
1.5601.8792.178
1.9931.9782.0262.2012.219
2.2562.3072.2382.3872.403
2.2262.1492.4092.6021.895
29.15
27.8527.3527.33

E PRICES PRICE INDEXES
Series E 123-134. Wholesale Prices of Selected Commodities :1800 t o 1970-Con.[Indollars per unit]
Year
Wheat
--123
1.6641.6041.4401.189
1.2011.123
1.040,932,724,494
1.324
1.3721.496
1.6701.2321.1121.218
2.4552.4182,1592.2961.329
1.290
1.049
1.0971.200
1.0101.039
,865
1.0331.1981.154
1.057'11.2231.2521.6851.320
1.4031.5171.7871.7801.581
,797
Wheatflour
124
1003.1813.1843.1705.448
4.752
4.3073.3724.3645.6065.441
6.1975.7554.6333.1043.570
4.8655.7946.408
6.6867.252
7.6785.9305.3536,1307.034
11.58010.69510.30210.5516.091
5.6124.1253.847
4.6863.984
4.6915.4514.2913.9883.615
4.5434.8263.5923.4893.309
3.8493.3824.1454.3613.620
3.2312.7503.2834.1224.905
4.652
6.5406.1205.8176.119
6.2757.0437.7359.0208.895
8.8958.6329.101
10.8069.898
10.21810.72811.49812.14110.245
Sugar
125
Lb.0.054
,055
,049
,044
,045,047
,049,044,043
,047,051
,058
,055,074,084,059,062
,078,077
,056
,043,051
,049
,045
,053
,046,045,051
,045
,044
,062
,106
Cotton,raw
126
0.226,212,206
,104
,119,123
,064,085
,135,191
,176
,235
,293,212
,145
,121
,089
070
,086
,094
,113
120
,150
,170
Wool
127
Lb.
1,1881.1831.195
1.091
,723
1.159
1,1071.152
1.3921.4071.8791.238
1.6041.7751.8151.568
,707
,659
,615
.
1.028
1.0451.1531.1981.5681.068
Cottonsheeting
128
0.153
,107
,135
,120
,068
,074
099
,125
Coal
129
Ton11.8911.4710.8910.31
10.01
9.569.149.449.379.74
9.599.64
10.0610.8811.4012.77
12.7212.8913.0010.9810.9511.48
11.1911.3710.8810.6010.53
9.508.276.865.945.57
5.385.325.315.285.00
4.814.824.824.824.86
4.824.834.834.464.83
3.923.653.553.743.66
2.983.544.173.943.46
3.35
4.044.214.054.00
4.104.424.544.614.53
4.532.703.222.593.87
4.394.554.273.744.46
Steelrails
130
42.9440.0040.0040.00
40.00
40.0040.004141.8936.63
36.38
89.3342.3843.00
43.0043.0043.00
43.0043.00
43.0043.0043.0040.6945.65
53.8349.2656.0040.0033.33
80.0030.0030.0028.0028.0028.00
28. 0028.0028.0028.0028.00
28.0028.0028.0028.0027.38
82.2928.1317.6313.7528.00
24.3824.0028.1330.0029.92
31.7829.2529.8337.0834.52
28.5230.7537.7548.6061.08
67.5248.2142.2145.5859.25
68.7594.28
120.58111.94102.52
Nails
131
502.8502,5502.5502.550
2.550
2.5502.4612.5752.7732,229
2.6282.6232.0892,0501.978
2,1912.6672.676
2.6382.750
2.8202.9893.0352.6103.056
4.1878.5188.6003.6332.596
1.7461.6791.8191.7401
1.8881.9172.1002.1171.958
1.8961.9062.0752.1042.365
2.6332.3881.4381.4852.925
1.6521.9922.1902.467
2.9652.002.002.032.302.27
2.332.893.063.473.09
3.682.692.812.572.98
3.423.994.905.464.62
Copper
132
Lb.0.120
,132
,148,132
,134
,134
,137
,158
,190
,356
urpentin
133
0.794,776
,314,294
,500,529
,447
,930
1.1711.150
1.7341.210
,473
,634
,628
,373
,477
,322,292,274
,292
,380
,408
,298
,497
--
Brick
134
1,00015.8914.2918.4313.21
12.69
12.1312.0512.0012.0511.74
11.7712.0010.53
9.199.54
10.02
10.1010.73
.oo1816.46
14.7017.0419.8117.3415.21
21.8515.9611.938.898.04
6.055.536.566.765.89
5.726.395.106.168.55
8.107.495.915.395.77
5.255.695.754.945.06
5.315.006.835.775.71
6.567.006.527.407.58
6.366.528.147.58
6.945.264.894.945.71
7.007.44
9.969.31
208

WHOLESALE PRICES
Series E 123-134. Wholesale Prices of Selected Commodities: 1800 t o 1970-Con.
Steelrails
130
123-134
Nails
131
dollars
0.135,162
,087
,098
Cottonsheeting
128
0.140,153
,513
,072,075,074
,073
8.508.45
8.107.677.928.578.92
9.269.229.60
10.5610.508.628.538.749.28
10.0010.249.448.999.179.94
10.529.80
14.5015.0016.0016.0016.6016.9917.9619.4720.0022.6821.6019.0419.0421.5825.1722.5020.6921.8321.2719.2116.0016.0017.3517.38
,
Brick
134
Coal,rnthraeite
Wheat Wheatflour
Wool Copper
132
L b .
,243,230
,343
,339,219,223
,302
,212
,449
,430
'urpentine
133
0.427
,639
1.5252.9782.9241.574
,460,453,401
,427
Year 124 125 126 127123
Bu.
1.3731.6512.5412.8442.945
2.1601.9421.6401.3901.425
1.4951.4361.3251.6751.755
2.4352.2101.390
1.075
1.2751.2401.1751.3651.085
1.040,975
1.1401.185
1.0551.2451.9201.7751.7801 .220
1.1931 .2601.1851.0701.2451.218
1.1031.3641.248
1.3441.9812.4061.9421.5651.4821.6221.7741.8461.7961.2481.0001.3081.3791.9531.3571.1'31.1931.835
129
3
4.395.313.864.375.80
7.868.396.064.143.39
3.403.253.433.874.11
4.495.193.703.463.34
3.643.623.503.803.90
3.163.203.274.186.79
4.915.005.276.726.644.844.845.23
10.217.089.05
10.7210.9211.3410.929.16
,325
1.134
1009.281
5.7257.9129.1647.920
7.7068.0625.6905.1654.965
5.1905.1104.2955.7856.420
8.9455.7805.0054.520
5.5504.5105.9606.6855.060
4.9354.6704.8555.5705.585
5.2957.3007.9569.1407.4955.8654.9805.5655.7705.7104.9856.4525.5805.1404.8105.1306 . 1 25.616.846.584.784.716.899.97
11.729.808.578.118.949.34
10.069.656.865.537.127.27
10 .078.21
6.9010.4010.03
Lb.
0.240,290,249
,432
1.015
,122
,103
,110,095,121
,112,079
,077,073,079,095
,133
,175,129
,097,100,099
,093
0.898,905
1.1331.313
1.6801.7701.515
1.0251.093
1.048
,9131.070
,343
,323
,320,442
,424
,539
,750
1.3333.312
.
-.
1,000
8.4011.3312.0810.8511.44
9.678.276.414.163.88
4.495.003.964.214.29
4.314.895.424.634.69
4 . 8 53.85
4.404.875.175.926.97
7.087.855.133.472.75
3.133.863 . 5 33.723.92
4.104.764.853.133.28
3.714.004.254.504.50
4.754.50
4.755.25
5.506.126.006.006.006.005.505 .005.805.605.507.107.507.086.767.21
7.338.879.809.809.809.809.679.60
10.9012.8312.5011.258.508.509.339.509.509.509.509.50
10.5010.5010.5211.6510.6710.67
I - - - - - - - -_ _ - _ _ _ - _ - -2.219 I _ _ _. ____--2.368 I _ _ _ _2.8773.5422.9023.688
NA Not available.'Beginning 1943 per 100 pounds; for prior years, per 196-lb. barrel.Beginning 1847' (in regular type), per yard; for prior years, "per piece"; see
3 Beginning 1825 (in regular type), per ton: for years, per 80-lb. bushel.
5 Beginning 1961, per 50 lb.; for prior years per 100Beginning 1825 (in regular type), per gallon; for years, per barrel.
7 11-month average.
Beginning 1947, per 100 pounds; for prior years, per gross ton. price.January price.
14 December price.through December.

E PRICES AND PRICE INDEXES
Series 135-166. Consumer Price Indexes Items, 1800 to 1970, and by Groups, 1913 to 1970=
Allitems
Housing
Allfoods Cereals
Total bakeryand
prod-ucts
Total
149
Rent
150
125.6126.8107.8100.0119.6105.0107.5108.6107.0113.2
116.3111.1109.4100.099.797.995.990.685.583.3
116.3109.8104.2100.097.294.592.991.790.689.6
114.9108.9103.6100.099.194.492.491.289.989.1
90.288.687.786.283.682.381 7
78.777.2
88.787.386.684.381.480.280.580.179.577.8
88.087.188.584.982.281.682.883.084.3
52.452.252.651.750.049.3
Read-and
recre-ation
42.041.642.248.041.541.1
35.2 37.334.6 36.4_ _ _ 35.6 38.533.4 39.736.9 38.736.5 39.2 71.0 29.5
TotalMen'sand
boys'Total
160
Private
161
112.7107.2103.2100.097.295.994.393.092.590.6
111.1106.5103.0100.097.596.394.793.493.091.9
101.3100.098.898.398.498.297.396.1
116.1111.5105.4100.096.193.792.791.990.990.4
117.1112.4105.7100.096.594.092.891.690.489.9
89.689.686.083.373.877.473.379.577.3
90.691.187.484.7
78.980.382.480.875.8
89.688.237.587.385.884.184.584.685.386.1
88.9 91.687.2 91.287.4 90.887.8 90.986.4 90.485.0 89.886.0 90.686.4 91.487.1 92.486.7 93.6
79.080.183.378.267.561.558.554.652.344.8
80.180.582.778.366.158.355.953.450.943.7
68.266.461.855.550.347.847.947.943.144.2
72.572.368.261.554.351.351.451.452.345.9
1950....................
1946........................................1944....................1943....................1942....................1941....................
........
42.743.044.043.743.042.6
43.644.245.846.544.243.3
42.842.443.043.241.1
41.6 50.440.9 50.041.6 50.741.8 51.039.7 48.6
1940
1938....................1937....................
82.182.983.083.0
1935.-84.586.2
__-
Foodawayfromhome
148
119.9111.6105.2100.095.190.988.987.385.483.2
81.479.377.274.972.270.870.168.9
.
Food
Food a t home
Fish
141
118.0107.2101.6100.096.790.888.290.390.586.9
85.084.983.478.077.077.178.778.281.883.4
73.174.574.164.356.051.549.248.938.629.6
26.223.924.023.923.323.2
Dairyprod-ucts
142
111.8106.7103.3100.095.890.089.788.989.289.8
88.486.585.984.782.380.280.382.984.481.0
72.673.480.573.264.9
62.552.949.344.0
39.837.739.241.439.938.3
Fruits and-- vegetables
Year
Sugarand
sweetsProc-essed
145
109.2106.5105.6100.0100.698.3101.599.294.096.7
92.996.292.386.888.285.584.885.383.384.6
74.877.281.085.268.663.062.562.357.245.8
43.242.544.448.646.048.4
Meat
143 144 146
115.1109.1103.4100.097.099.0100.796.088.488.4
90.189.787.884.081.683.58130.179.378.6
75.874.373.275.860.653.353.353.563.344.8
40.842.441.242.541.942.5
147
104.6101.9100.0100.9101.5102.391.290.191.5
91.592.1101.4109.1109.9105.1117.498.896.295.6
86.761.356.851.8
139
117.6111.4102.3100.0102.693.987.388.790.188.3
87.288.892.232.874.577.183.784.290.291.0
80.376.28171.350.189.239.141.340.735.3
31.432.132.535.382.833.4
140
108.4109.0103.1100.0106.7101.298.2100.4102.096.5
106.9105.2115.4116.8119.8136.7131.3145.4149.2148.6
141.8148.1157.1141.7134.5119.5116.8113.094.979.0
73.372.680.981.278.273.9
135 136 137 138
103.3100.4100.097.793.892.592.1
88.9
113.7108.2103.2100.0100.395.593.292.291.090.4
102.4
96.995.995.094.092.9
94.993.892.791.790.9
84.679.783.778.077.573.271.873.377.766.9
61.665.463.660.3
56.353.053.339.731.1
87.185.484.783.079.978.877.675.874.372.6
66.565.465.859.848.141.941.841.440.537.6
91.790.489.187.585.984.383.280.376.273.2
70.468.065.161.159.258.858.658.558.657.2
56.256.056.054.251.950.6
Othergoods
andervices
166
116.0109.1104.6100.097.294.292.090.689.188.5
87.886.184.483.381.079.879.878.676.672.8
69.968.766.863.858.856.954.753.350.749.2
48.346.946.145.744.544.6
113.2105.1120.0114.1119.3120.5116.6139.4131.6144.1
118.4137.1142.3136.9115.0112.0105.0110.393.076.5
89.688.891.087.284.484.185.886.287.832.8
74.573.576.670.6
50.749.650.345.138.4
72.870.969.865.260.659.158.156.856.253.7
I Housing-Con. Apparel Transportation
Foot-wear
159
__-House-
ingsand
opera-tion
Fuel and utilitiesI --
Fueland
coal
andgirls'
Houseurnish-ings
PublicYear
158 162
128.!112.'104.1100.195.:
90.:
84.1
76.72.
65.
57.
48.'45.40.36.34.33.
33.33.33.
33.33.3232.32.33.
163
120.113.106.100.
81.
76.
67.
61.
53.52.51.48.44.42.41.39.38.
36.36.36.36.36.
164
109.104.
97.95.94.93.92.
90.88.
34.81.77.76.76.75.74.
68.68.
66.59.55.53.49.45.41.
40.39.37.36.
165151 152 153
110.1105.6103.1100.097.094.692.793.291.591
89.289.838.790.385.982.381.281.578.076.5
72.770.368.658.451.348.047.145.243.140.5
37.137.838.137.436.8
155
111.4108.1103.9100.098.097.197.697.798.198.7
99.399.0
99.98.199.2101.1102.9103.4106.0
95.594.998.392.780.073.368.663.161.454.0
50.550.9
52.448.447.6
154
113.4109.0104.4100.097.095.395.094.693.893.7
93.893.192.391.989.989.990.991.391.1
.......
113.4103.7104.7100.097.595.996.092.891.389.3
87.385.333.980.777.876.776.977.776.976.6
74.474.972.268.764.562.460.054.150.047.7
46.145.345.243.742.541.8
1969............1967............1966............
107.3102.8100.9100.099.699.499.499.499.499.4
117.7111.8105.3100.095.390.088.4
87.135.9
1964............1963............1962............1961............
85.182.279.077.875.471.670.870.070.171.6
95.993.891.789.987.385.183.583.0
1960............1959............1958............1957............1955............1954............1958............1952..............1951
.......
36.989.995.189.877.572.268.563.660.952.7
81.281.079.177.177.479.680.380.681.081.4
63.362.362.857.546.041.040.038.436.432.3
31.330.631.031.029.429.0

E 135-173CONSUMER PRICE INDEXES
Series E 135-166. Consumer Price Indexes Items, 1800 to 1970, and by Groups, 1913 to 1970-Con.
Year
= 1001
items
135
Yearitems
135_-1868...1866...
404244
1841...
272828282931
3032323433
1823... 36404042464648511884....
27272727
2727282929
1908...2827272827
2727272625
2525252525
1861...
4647
3027
1813...1812...
55635851504747484447
1853...2727262827
2827252525
19251924 _ _ _192319221921
52.5
51.150.253.6
1880...1879...
2928293232
3130293082
1872...
3334363636
1826...1825...1824....
32323334343433
1805...
1800....
454545435051
2526272727
1849... 25252628
Year
items, Ailexclud- items,
ing excludingfood shelter
1970
1965
1962
19601959.........1958
1956
19551954
116.7 114.4110.1 109.0104.4 104.1100.0 100.096.7 97.4
94.5 94.693.2 93.292.0 92.190.8 90.989.7 89.9
88.8 88.987.3 87.685.7 86.983.8 84.481.1 81.7
79.7 80.679.5 81.079.0 81.0
81.481.582.776.868.1
64.161.658.456.0
76.276.87 7 . 872.262.9
58.656.653.851.6
Housing
Food a titems home,
Year total
Apparel,total items
Year I Allitems
Year
135
itemsYear
Housefurnish-
ingsRent
150
50.754.162.870.0
73.976.07 7 . 879.781.0
81.881.57 8 . 67 6 . 774.5
64.955.251.050.150.5
49.949.649.6
156
40.436.938.243.2
47.548.549.049.750.8
51.652.653.153.065.2
84.671.153.639.633.0
80.129.429.2
155
46.642.442.949.3
34.130.631.537.8
61.062.363.4
69.5
48.444.745.143.746.7
60.0 61.551.8 54.6
1918 45.1 49.0_ _ _ 38.4 42.632.7 33.1
32.767.453.541.635.6
31.930.529.8
381869... 40
Series E Consumer Price Indexes (BLS), for Special Groups: 1935 to 197011967= 1001
Commodities ServicesCommodities Services
ng rentTotal TotalTotal
Allitems,
shelter
168
80.879.2
73.172.673.968.559.0
53.652.251.347.742.4
39.939.740.441.640.3
89.8
All items,exclud-
Year
Excluding foodExcluding food
Total Exclud-ing rentTotal Non-
durableTotal
169
87.085.9
78.878.380.475.062.4
56.354.754.049.643.3
40.640.241.042.641.0
40.5
172 173169
113.5108.4103.7100.098.2
95.794.693.692.892.0
91.590.790.688.685.9
85.185.986.7
170
112.5108.1103.7100.097.5
96.295.694.894.193.4
93.192.791.590.587.8
86.987.588.5
171
113.1108.8104.1100.097.0
94.893.592.791.891.2
90.789.388.287.685.3
83.583.583.1
172 173 167 170 171
64.561.8
58.756.954.351.149.1
48.247.546.445.644.2
43.643.543.442.641.3
40.9
62.259.3
56.054.551.949.046 .7
45.144.242.140.338.6
38.138.138.137.837.4
37.6
121.6112.5105.2100.095.8
92.290.288.586.885.2
83.580.378.575.672.7
70.969.567.3
123.7113.8105.7100.095.3
91.589.287.385.588.9
81.979.076.473.370.1
68.266.764.8
1952 77.51951 75.7
88.3 82.487.5 82.0
48.0 44.747.7 44.3
211
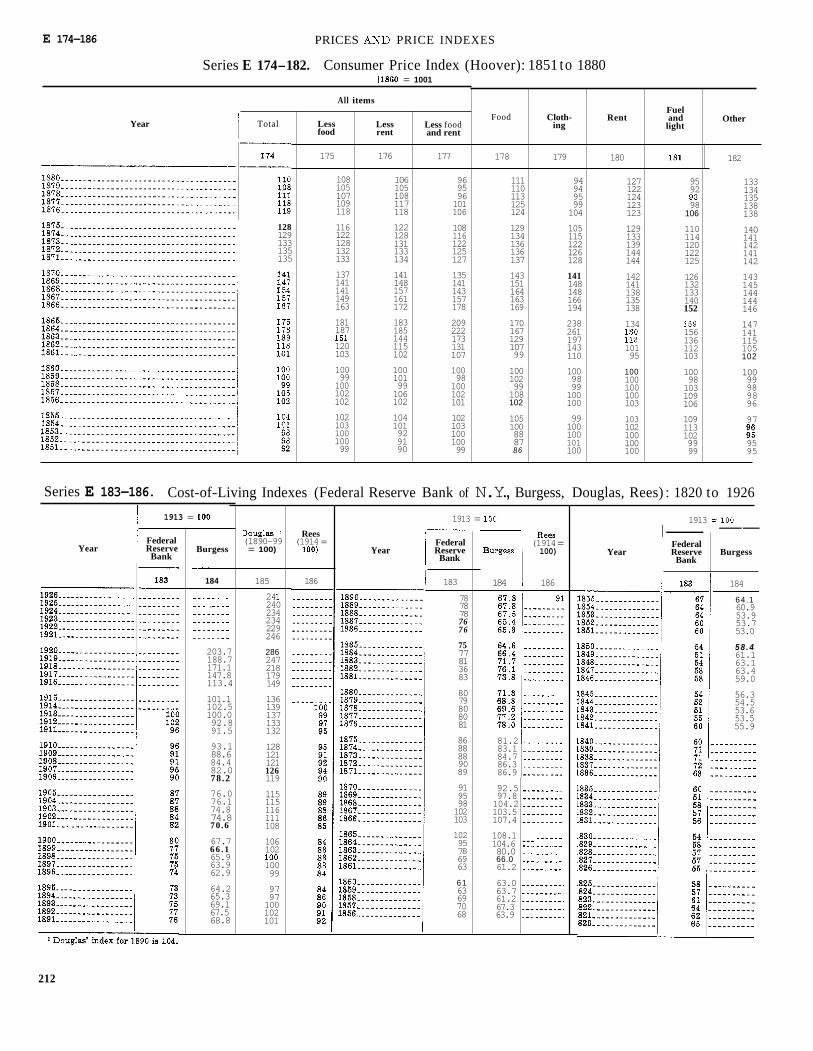
E 174-186
83.184.786.386.9
PRICES PRICE INDEXES
Series E 174-182. Consumer Price Index (Hoover): 1851 to 1880= 1001
All items
92.597.8104.2103.5107.4
108.1104.680.066.061.2
63.063.761.267.363.9
Fuelandlight
_ _ _
Food Cloth-ing
Rent OtherYear Total Lessfood
Lessrent
Less foodand rent
175 176 177 178 179 180 182
133134135138138
140141142141142
143145144144146
147141115105102
10099989896
97
9595
108105107109118
116122128132133
137141141149163
181187
120103
10099100102102
10210310010099
106105108117118
122128131133134
141148157161172
183185144115102
969596101106
108116122125127
135141143157178
209222173131107
10098100102101
10210310010099
111110113125124
129134136136137
94949599104
105115122126128
141148148166194
238261197143110
1009899100100
99100100101100
127122124123123
129133139144144
142141138135138
9592
98106
110114120122125
126132133140152
156136112103
10098103109106
1091131029999
128129133135135
143151164163169
17016712910799
10010299108102
105100888786
134
10195
100100100100103
103102100100100
10010199106102
104101929190
Series E 183-186. Cost-of-Living Indexes (Federal Reserve Bank of N.Y., Burgess, Douglas, Rees) : 1820 to 19261913 = 19131913 =
I---Burgess
(1890-99= 100)
Rees(1914=Federal
Year ReserveBank
FederalYear Reserve
BankFederal
Year ReserveBank
(1914=100)Burgess
184 184 186185 186 183 184
.
203.7188.7171.1147.8113.4
101.1102.5100.092.891.5
93.188.684.482.078.276.076.174.874.870 .6
67.76 6 . 165.963.962.9
64.265.369.167.568.8
24240234234229246
286247218179149
136139137133132
128121121126119
115115116111108
106102
10099
9797100102101
787878767 6
7577813683
8079808081
8688889089
919598102103
10295786963
6 163697068
64.160.953.953.753.0
5 8 . 461.163.163.459.0
56.354.553.653.555.9
81.2
212

PRICES
Series E Retail Prices of Selected Foods in U.S.Cities 1890 to 1970
E
[Incents per unit indicated]
Meats Other
rine
201
Lb.29.827.827.928.428.7
27.926.127.528.128.6
26.928.029.429.928.9
28.929.929.4
30.330.841.440.328.3
24.124.123.622.117.1
I17.519.213.5
18.313.513.2
19.9
27.0
28.330.1
29.3
31.6
41.3
..... .
......
.
.
....
. ..
.
Dairy products and eggs Fruits and vegetables
Bacon Milk,
195
62.960.657.455.5
52.652.852.052.252.4
52.050.650.650.048.4
46.246.046.848.446.2
41.242.243.639.235.2
31.231.231.030.027.2
25.624.425.025.024.0
23.422.420.821.426.2
28.22828.428.228.0
27.826.827.826.229.2
33.431.027.822.418.2
17.617.817.817.417.0
16.816.216.015.614.8
14.414.414.414.013.6
13.613.413.413.413.6
13.613.613.613.613.613.6
Navybeans
199
Lb.19.219.619.618.219.8
17.516.717.817.417.0
16.717.218.016.116.3
17.617.0
1 6 . 1
15.316.422.021.314.0
11.410.710.19.07.4
6 .66.26.39.66.7
6.26 . 15.35.28 . 1
11.714.111.89.49.4
10.39.9
10.99.98 .2
11.412.617.317.911
7.8
Bread
steak189
Lb.130.2126.7114.3110.3110.7
108.4103.9106.4107.8103.6
107.3104.293.688.2
90.390.791.5
111.2109.3
93.685.390.575.652.1
40.641.443.943.539.1
36.436.034.939.134.1
36.028.125.729.735.4
42.646.043.788.737.1
36.234.834.332.334.4
39.588.936.929.024.5
23.023.622.319.917.5
17.416.415.915.214.5
14.014.114.014.718.8
13.212.912 .712.512.4
12.312.212.412.412.412.3
roast
190
Lb.72.570.463.560.762.2
59.556.860.362.359.4
61.664.163.352.548.4
50 .151.452.973.574 .1
6 1 . 655.564.451.5
28 .128.830.229.325.5
23.523.422.825.722.3
24.017.516.018.522.7
28.631.429.625.223.7
22.321.620.819 .721.2
26.227.026.620.91 7 . 1
1 6 . 116.716.0
Porkchops
191
Lb.116.2112.2102.9100.4106.3
97.388.088.289.887.9
85.885.391.886.678.2
79.386.382.780.379.4
75.474.377.272.148.5
37 .137.340.3
34.8
27.980.482.936.734 .1
36 .125.519.821.529.6
36.237.535.237.239.9
37.031.030.333.034.9
42.342.339.031.922.7
20.322.021.019.217.9
19.217.416.016.615.2
13.913.714.014.113.0
11.911.210.910.810.7
11.011.211.811.110.910.7
Coffee SugarToma-toes,
198
20.419.517.7
16.116.015.515.716.0
15.9
17.015.015.2
15.1114.6
14.814.8
12.412.813.916.312.6
10.310.110.69.97.7
7.27.27.57.98 .0
8.68.87.77.88.5
10.210.89.9
10.09.9
11.110.810.511.310.2
12.513 .6
2 1
FlourYear
188
Lb.24.323.022 .422 .222.2
20.920 .721.621 .220 .9
20.31 9 . 719.318 .817.9
17 .717 .216.41 6 . 0
14.314.013.912.510 .4
8.88.88.98 .78 . 1
8 .07.98.68.68.2
8.38.37 . 17 .07.7
8.68.88.99.29.3
9.38.98.88 .79.9
11.510.09.89.27.3
7 .06 . 35 . 6
192
94.987.881.483.795.4
81.366.768.370.371.2
65.566.579.373.857.3
65.981.778.564.967.2
63.766.576.977.753.3
41.141.143.139.434.3
27.331.936.741.340.7
41.329.122.624.236.6
42.543.944.447.850.8
47.138.439.739.842.7
52.355.452.941.028.7
26.927.527.024.424
25.522.420.720 .119.6
18.118.018.217.715.8
14.313.413 .112.712.6
13.018.514.212.9
12.E
193
Lb.86.684.683.683.082.2
75.474.475.075.276.3
74.975.374.274.372.1
70.972.479.085.581.9
72.972.586.780.571.0
50.7
52.747.341 .1
36.032.534.740.739.5
36.031.527.827.835.8
46.455.556.956.353.6
55.252.255.847.951.7
70.167.857.748.739.4
35.836.238.337.433.7
35.934.532.832.730.4
29.028.028.528.726.5
26.125.124.423.923.8
24.926.128.327.527.425.5
194
61.462.152.949 .159.9
52.753.955.154.057.3
57.353.060.457.360.2
60.658.569.867.373.7
60.469.672.369.658.6
58.154.557.248.439.7
33.132.136.536.237.1
37.632.528.830.235.0
44.552.750.348.751.9
55.451.049.944.450.9
68.162.856.948.137.5
34.135.334.534 .132.3
33.731.929.729.027.8
27.227.125.924.721.9
20.720.919.918.919.2
20.619.922.422.122.120.8
196
86.483.896.676.679.9
77.888 .190.479.377.7
74.866.476.057.958.3
52.855.449.050 .648.7
49.351.844.743.449.9
48.546.044.335.731.0
29 .128.926.738.933.6
22.031.927.330.235.0
57.144.758.652.051.6
57.144.849.757.449.6
63.253.2 .
.
.
.
197
89.78 1 . 676.374.774.9
93.775 .765 .163.262.9
71.863.362.657.167.7
56.452.653.876.050.8
46.154.656.950.346.8
49.346.545.634.223.5
23.924.721.327.931.9
19.123.023.017.024.0
86.032.027.038.049.0
36.028.030.028.031.0
63.038.032.043.027.0
15.018.017.022.022.0
17.019.019.018.017.0
17.018.017.018.018.0
14.015.016.014.012.0
14.015.017.014.018.016.0
Lb.91.176.576.476.982.3
83.381.669.170.873.6
75.3
101.7103.4
93.0110.889.286 .886.3
79.455.4
46.934.4
30.530 .130.028.323.6
21.222.423.225.524.3
26.926.429.432.8
39.5
48.247.450.2
50.442.636.936 .136.3
47 .0
30.229.9
30.029.729
43.3
202
658.958.158.459.659.4
58.156.757.057.056.0
55.454.555.254.653.3
53.853.652.352.351.9
49.147.949.048.235.4
32.132.430.626.422.6
21.519.019.824.023.8
25.324.519.516.018.0
23.025.526.527.530.0
30.524.523.525.529.0
40.536.033.535.022.0
2117.016.517.517.0
18.018.016.515.514.5
16.01613.512.512.5
12.512.514.014.012.5
12.011.512.514.C
62.060.9
60.2
59.0
67.958.558.9
58.257.2
55.252.8
52 .152.652.851.550.6
48.747.647.048 .638.4
33.433.684.234.128.6
26.027.226.628.227.9
28.227.526.525.0
30.532.034.536.0
35.0
49.536.540.0
97.056.548.546.540.0
31
30.029.5
29 .30.0
3
2 9 . 32R.O28.
. . .
Average of January-September.

E 203-214 PRICES AND PRICE INDEXES
E Retail Price Indexes of Electricity, Gas, and Fuel for Residential Use: 1913 to 1970= except as otherwise indicated]
Electricity Coal (1957-59 = 100)Gas
Other than residential heatingFuel oiland coal
Fuel oil,No. 2
Composite anthracite,stove size
Bituminous,all domestic
sizesResidential
heatingYear Composite100
Composite 10 Therms 3 25 Therms
204 205 206
107.4102.6101.1100.0100.4
99.9100.299.9
100.0100.7
100.192.389.384.483.5
82.978.776.672.770.5
69.969.568.668.067.3
68.068.568.969.170.4
208 209 210 211
109.3105.4103.2100.096.9
94.492.594.692.792.6
89.090.689.494.890.2
213207
109.4103.1100.8100 .0100.0
99.398.698.398.197.7
96.191.188.183.181.5
79.777.276.074.673.4
73.673.570.568.267.6
68.769.669.970.670.9
203
106.2102.8100.9100.099.1
99.199.6
100.1100 11 0 0 . 1
99.898.597.195.995.5
95.294.093.692.491.5
108.5102.8101.0100.0100.2
99.699.399.098.999.0
97.791.688.683.782.3
81.077.976.474.172.7
73.172.869.867.466.9
68.068.869.269.970.1
107.4102.6100.7100.0100.3
100.299.399.499.39 9 . 1
97.394.692.488.687.7
108.4102.3100.7100 .01 0 0 . 1
110.1105.6103.1100.097.0
94.692.793.291.591.0
89.289.888.790.335.9
82.381.281.578.076.5
98.198.9
100.0101.194.5
88.689.293.187.886.6
78.174.870.362.857.9
52.150.347.645.043.2
41.139.139.840.042.6
41.444.244.045.549.6
51.351.652.153.2
52.552.452.451.351.6
49.041.034.931.728.3
26.226.226.1
102.4101.699.898.494.6
91.390.390.488.686.9
90.890.689.788.990.0
93.794.294.494.595.0
95.796.798.399.8
102.0
105.3110.9119.9121.2122.4
124.4126.7131.4133.8136.7
137.6139.1140.1143.1144.7
142.1142.3137.5137.0140.8
144.5149.2
88.988.990.289.189.8
91.691.792.392.392.7
93.995.296.497.799.9
104.3107.3110.4111.4115.5
119.6123.4128.6133.4137.7
140.5144.1147.3
72.770.368.658.451.3
85.082.079.166.456.2
73.774.074.374.674.9
62.662.963.364.865.0
48.047.145.243.140.5
53.452.250.448.345.9
43.342.948.242.942.0
41.240.938.038.241.2
43.843.944.546.04 6 . 3
70.971.470.669.770.4
71.672.372.575.081.4
38.237.137.838.137.4
40.538.642.444.538.5
45.04 5 . 651.35 0 . 353.0
52.94 0 . 638.93 5 . 92 9 . 1
27.72 8 . 12 7 . 4
Denotes first year for which figures include Alaska and Hawaii.Combination of 100, and 500 from 1964 to 1970; 40, 100, and 200
from 1953 1963; 25, 40, 100, and 250 from 1935 to 1952; and the“average consumption” in each component city prior t o 1935.
Combination of 10, 25, and 40 therms from 1964 to 1970; 10 and 25 therms from1953 to 1965; and 10.6, 19.6, 30.6, and 40.6 therms prior to 1953.
3 10 therms, 10.6 therms, prior to 1953.25 therms, 1953-1970; 30.6 therms, prior to 1953.Includes fuel oils No. 2 and 3 from 1939 through 1947.December only.
Series E 214. Rent Indexes (Warren and for Dwelling Units in 5 Large Cities: 1860 to 1880100. Covers Boston, Philadelphia, Cincinnati, Louisville, and Louis]
Index--Year
214
Index
214Year