chapter four departmental financial … · 52 chapter four departmental nancial statements evaluate...
TRANSCRIPT

49
DEPARTMENTAL FINANCIAL STATEMENTS
CHAPTER FOUR

50
CHAPTER FOUR · Departmental financial statements
GPO Box 707 CANBERRA ACT 2601 19 National Circuit BARTON ACT Phone (02) 6203 7300 Fax (02) 6203 7777
INDEPENDENT AUDITOR’S REPORT
To the Minister for Industry, Innovation and Science
Opinion
In my opinion, the financial statements of the Department of Industry, Innovation and Science for the year ended 30 June 2017:
(a) comply with Australian Accounting Standards and the Public Governance, Performance and Accountability (Financial Reporting) Rule 2015; and
(b) present fairly the financial position of the Department of Industry, Innovation and Science as at 30 June 2017 and its financial performance and cash flows for the year then ended.
The financial statements of the Department of Industry, Innovation and Science, which I have audited, comprise the following statements as at 30 June 2017 and for the year then ended:
Statement by the Secretary and Chief Financial Officer; Statement of Comprehensive Income; Statement of Financial Position; Statement of Changes in Equity; Cash Flow Statement; Administered Schedule of Comprehensive Income; Administered Schedule of Assets and Liabilities; Administered Reconciliation Schedule; Administered Cash Flow Statement; and Notes to and forming part of the financial statements, comprising a Summary of Significant Accounting
Policies and other explanatory information.
Basis for Opinion
I conducted my audit in accordance with the Australian National Audit Office Auditing Standards, which incorporate the Australian Auditing Standards. My responsibilities under those standards are further described in the Auditor’s Responsibilities for the Audit of the Financial Statements section of my report. I am independent of the Department of Industry, Innovation and Science in accordance with the relevant ethical requirements for financial statement audits conducted by the Auditor-General and his delegates. These include the relevant independence requirements of the Accounting Professional and Ethical Standards Board’s APES 110 Code of Ethics for Professional Accountants to the extent that they are not in conflict with the Auditor-General Act 1997 (the Code). I have also fulfilled my other responsibilities in accordance with the Code. I believe that the audit evidence I have obtained is sufficient and appropriate to provide a basis for my opinion.
Key Audit Matters
Key audit matters are those matters that, in my professional judgement, were of most significance in my audit of the financial statements of the current period. These matters were addressed in the context of my audit of the financial statements as a whole, and in forming my opinion thereon, and I do not provide a separate opinion on these matters.

51
CHAPTER FOUR · Departmental financial statements
Key audit matter
Completeness and accuracy of royalty revenue
I focused on this balance given the significant value of royalty revenue collected and reported by the Department of Industry, Innovation and Science (Industry) and the complexities associated with its administration.
The collection of royalties is reliant on administrative functions performed by other parties and is dependent on information provided by taxpayers in a self-assessment regime. The absence of an effective assurance framework over the collection and administration of royalties increases the risk of inaccurate or incomplete royalty revenue.
In 2015–16, a moderate audit finding was reported in the ANAO Report No. 33 2015–16 Audits of the Financial Statements of Australian Government Entities for the Period Ended 30 June 2016.
For the year ended 30 June 2017, Industry reported royalty revenue of $950.106m.
How the audit addressed the matter
To audit the collection of administered royalty revenue, I performed the following audit procedures: evaluated the design and effectiveness of
Industry’s framework to obtain assurance over the completeness of North West Shelf royalty revenue collections; activities relating to the collection of Joint Petroleum Development Area and Ranger Uranium Mine royalties;
re-performed, on a sample basis, a selection of key assurance activities undertaken by Industry for its royalty revenue streams;
examined, on a sample basis, supporting documentation to assess the accuracy of royalty revenue earned for 2016–17;
examined large royalties received after 30 June 2017 to identify potential significant unrecorded royalty revenue; and
analysed the relationship between production and commodity prices to assess the reasonableness of royalty revenue.
Accountable Authority’s Responsibility for the Financial Statements
As the Accountable Authority of the Department of Industry, Innovation and Science the Secretary isresponsible under the Public Governance, Performance and Accountability Act 2013 for the preparation and fair presentation of annual financial statements that comply with Australian Accounting Standards and the rules made under that Act. The Secretary is also responsible for such internal control as the Secretary determines is necessary to enable the preparation and fair presentation of financial statements that are free from material misstatement, whether due to fraud or error.
In preparing the financial statements, the Secretary is responsible for assessing the Department of Industry, Innovation and Science’s ability to continue as a going concern, taking into account whether the entity’s operations will cease as a result of an administrative restructure or for any other reason. The Secretary is also responsible for disclosing matters related to going concern as applicable and using the going concern basis of accounting unless the assessment indicates that it is not appropriate.
Auditor’s Responsibilities for the Audit of the Financial Statements
My objective is to obtain reasonable assurance about whether the financial statements as a whole are free from material misstatement, whether due to fraud or error, and to issue an auditor’s report that includes my opinion. Reasonable assurance is a high level of assurance, but is not a guarantee that an audit conducted in accordance with the Australian National Audit Office Auditing Standards will always detect a material misstatement when it exists. Misstatements can arise from fraud or error and are considered material if, individually or in the aggregate, they could reasonably be expected to influence the economic decisions of users taken on the basis of the financial statements.
As part of an audit in accordance with the Australian National Audit Office Auditing Standards, I exercise professional judgement and maintain professional scepticism throughout the audit. I also:
identify and assess the risks of material misstatement of the financial statements, whether due to fraud or error, design and perform audit procedures responsive to those risks, and obtain audit evidence that is sufficient and appropriate to provide a basis for my opinion. The risk of not detecting a material misstatement resulting from fraud is higher than for one resulting from error, as fraud may involve collusion, forgery, intentional omissions, misrepresentations, or the override of internal control;
obtain an understanding of internal control relevant to the audit in order to design audit procedures that are appropriate in the circumstances, but not for the purpose of expressing an opinion on the effectiveness of the entity’s internal control;

52
CHAPTER FOUR · Departmental financial statements
evaluate the appropriateness of accounting policies used and the reasonableness of accounting estimates and related disclosures made by the Accountable Authority;
conclude on the appropriateness of the Accountable Authority’s use of the going concern basis of accounting and, based on the audit evidence obtained, whether a material uncertainty exists related to events or conditions that may cast significant doubt on the entity’s ability to continue as a going concern. If I conclude that a material uncertainty exists, I am required to draw attention in my auditor’s report to the related disclosures in the financial statements or, if such disclosures are inadequate, to modify my opinion. My conclusions are based on the audit evidence obtained up to the date of my auditor’s report. However, future events or conditions may cause the entity to cease to continue as a going concern; and
evaluate the overall presentation, structure and content of the financial statements, including the disclosures, and whether the financial statements represent the underlying transactions and events in a manner that achieves fair presentation.
I communicate with those charged with governance regarding, among other matters, the planned scope and timing of the audit and significant audit findings, including any significant deficiencies in internal control that I identify during my audit.
From the matters communicated with those charged with governance, I determine those matters that were of most significance in the audit of the financial statements of the current period and are therefore the key audit matters. I describe these matters in my auditor’s report unless law or regulation precludes public disclosure about the matter or when, in extremely rare circumstances, I determine that a matter should not be communicated in my report because the adverse consequences of doing so would reasonably be expected to outweigh the public interest benefits of such communication.
Australian National Audit Office
Kristian Gage Executive Director
Delegate of the Auditor-General
Canberra
6 September 2017

53
CHAPTER FOUR · Departmental financial statements

54
CHAPTER FOUR · Departmental financial statements
Department of Industry, Innovation and Science Statement of Comprehensive Income for the year ended 30 June 2017
The above statement should be read in conjunction with the accompanying notes, including the budget variance commentaries.
2017 2016 Original Budget
Notes $'000 $'000 $'000 NET COST OF SERVICES Expenses
Employee benefits 1.1A 293,456 306,781 314,957 Suppliers 1.1B 165,340 167,058 148,813 Grants 1.1C 3,499 7,822 210Depreciation and amortisation 3.2A 38,089 42,351 43,486 Finance costs - 122 - Write-down and impairment of assets 1.1D 16,854 51 - Losses from asset sales 338 14 - Other expenses 604 712 728
Total expenses 518,180 524,911 508,194
Own-Source Income Own-source revenue
Sale of goods and rendering of services 1.2A 67,826 57,565 62,862 Interest 63 98 - Rental income 4,468 700 - Other revenue 1.2B 12,191 9,465 6,099
Total own-source revenue 84,548 67,828 68,961
GainsForeign exchange gains 3 - - Reversals of previous asset write-downs and impairments 2 5,186 - Other gains 1.2C 24,852 125 728
Total gains 24,857 5,311 728 Total own-source income 109,405 73,139 69,689 Net cost of services (408,775) (451,772) (438,505) Revenue from Government 1.2D 365,838 400,205 395,710 Deficit attributable to the Australian Government (42,937) (51,567) (42,795)
OTHER COMPREHENSIVE INCOME
Items not subject to subsequent reclassification to net cost of services Changes in asset revaluation reserve (2,166) 2,746 -
Total other comprehensive income/ (loss) (2,166) 2,746 -
Total comprehensive loss attributable to the Australian Government (45,103) (48,821) (42,795)

55
CHAPTER FOUR · Departmental financial statements
Department of Industry, Innovation and Science Statement of Financial Position as at 30 June 2017
The above statement should be read in conjunction with the accompanying notes, including the budget variance commentaries.
2017 2016 Original Budget
Notes $'000 $'000 $'000 ASSETS Financial assets
Cash and cash equivalents1 3.1A 13,761 30,732 5,328Trade and other receivables1 3.1B 104,446 144,413 162,053 Accrued revenue 3,394 2,186 2,635
Total financial assets 121,601 177,331 170,016
Non-financial assets Land and buildings 3.2A 108,061 132,168 119,498 Property, plant and equipment 3.2A 53,815 52,934 48,699 Laboratory equipment 3.2A 24,560 25,013 22,225 Intangibles 3.2A 48,699 42,265 51,683 Inventories 2,337 2,468 2,198Prepayments 9,401 8,483 8,112
Total non-financial assets 246,873 263,331 252,415
Total assets 368,474 440,662 422,431
LIABILITIES Payables
Suppliers 3.3A 17,662 20,040 47,169 Grants 270 1,177 1,983Other payables 3.3B 45,406 56,531 40,556
Total payables 63,338 77,748 89,708
Provisions Employee provisions 6.1A 85,851 98,863 79,967 Other provisions 3.4A 1,747 20,825 16,557
Total provisions 87,598 119,688 96,524
Total liabilities 150,936 197,436 186,232 Net assets 217,538 243,226 236,199
EQUITY Contributed equity 471,444 452,029 482,057 Asset revaluation reserve 9,079 11,245 8,499Accumulated deficit (262,985) (220,048) (254,357)
Total equity 217,538 243,226 236,199
1. Restatement of comparatives as a result of reclassification of special account from Trade and other receivables to Cash and cashequivalents, as per the Financial Reporting Rule.

56
CHAPTER FOUR · Departmental financial statements
Dep
artm
ent o
f Ind
ustr
y, In
nova
tion
and
Scie
nce
Stat
emen
t of C
hang
es in
Equ
ity
for t
he y
ear e
nded
30
June
201
7
The
abov
e st
atem
ent s
houl
d be
read
in c
onju
nctio
n w
ith th
e ac
com
pany
ing
note
s, in
clud
ing
the
budg
et v
aria
nce
com
men
tarie
s.
Ret
aine
d ea
rnin
gs
Ass
et re
valu
atio
n re
serv
e 20
17
2016
O
rigin
al B
udge
t 20
17
2016
O
rigin
al B
udge
t $'
000
$'00
0 $'
000
$'00
0 $'
000
$'00
0 O
peni
ng b
alan
ce
Bal
ance
car
ried
forw
ard
from
pre
viou
s pe
riod
(220
,048
) (1
68,4
81)
(211
,562
) 11
,245
8,
499
8,49
9A
djus
ted
open
ing
bala
nce
(220
,048
) (1
68,4
81)
(211
,562
) 11
,245
8,
499
8,49
9
Com
preh
ensi
ve in
com
e D
efic
it fo
r the
yea
r (4
2,93
7)
(51,
567)
(4
2,79
5)
- -
- O
ther
com
preh
ensi
ve in
com
e
- -
- (2
,166
) 2,
746
- To
tal c
ompr
ehen
sive
inco
me
(42,
937)
(5
1,56
7)
(42,
795)
(2
,166
) 2,
746
-To
tal c
ompr
ehen
sive
inco
me
attri
buta
ble
to
A
ustra
lian
Gov
ernm
ent
(42,
937)
(5
1,56
7)
(42,
795)
(2
,166
) 2,
746
-
Clo
sing
bal
ance
attr
ibut
able
to A
ustr
alia
n G
over
nmen
t (2
62,9
85)
(220
,048
) (2
54,3
57)
9,07
9 11
,245
8,
499

57
CHAPTER FOUR · Departmental financial statements
Dep
artm
ent o
f Ind
ustr
y, In
nova
tion
and
Scie
nce
Stat
emen
t of C
hang
es in
Equ
ity
for t
he y
ear e
nded
30
June
201
7
The
abov
e st
atem
ent s
houl
d be
read
in c
onju
nctio
n w
ith th
e ac
com
pany
ing
note
s, in
clud
ing
the
budg
et v
aria
nce
com
men
tarie
s.
Con
trib
uted
Equ
ity
Tota
l Equ
ity
2017
20
16
Orig
inal
Bud
get
2017
20
16
Orig
inal
Bud
get
$'00
0 $'
000
$'00
0 $'
000
$'00
0 $'
000
Ope
ning
bal
ance
B
alan
ce c
arrie
d fo
rwar
d fro
m p
revi
ous
perio
d 45
2,02
9 38
8,20
5
452,
052
24
3,22
6 22
8,22
3
248,
989
A
djus
ted
open
ing
bala
nce
452,
029
388,
205
452,
052
243,
226
228,
223
248,
989
Com
preh
ensi
ve in
com
e D
efic
it fo
r the
yea
r -
- -
(42,
937)
(5
1,56
7)
(42,
795)
O
ther
com
preh
ensi
ve in
com
e
- -
- (2
,166
) 2,
746
- To
tal c
ompr
ehen
sive
inco
me
--
-(4
5,10
3)
(48,
821)
(4
2,79
5)
Tota
l com
preh
ensi
ve in
com
e at
tribu
tabl
e to
Aus
tralia
n G
over
nmen
t -
- -
(45,
103)
(4
8,82
1)
(42,
795)
Tran
sact
ions
with
ow
ners
D
istr
ibut
ion
to o
wne
rs
Res
truct
urin
g(1
3,90
5)
(14)
-
(13,
905)
(1
4)
- Ap
prop
riatio
n (e
quity
retu
rns)
(4
48)
- -
(448
) -
- C
ontr
ibut
ions
by
owne
rs
Equ
ity in
ject
ion
- App
ropr
iatio
ns
4,88
035
,369
4,
567
4,88
0 35
,369
4,
567
Dep
artm
enta
l cap
ital b
udge
t (D
CB
) 28
,888
28
,469
25
,438
28
,888
28
,469
25
,438
To
tal t
rans
actio
ns w
ith o
wne
rs
19,4
15
63,8
24
30,0
05
19,4
15
63,8
24
30,0
05
Clo
sing
bal
ance
attr
ibut
able
to A
ustr
alia
n G
over
nmen
t 47
1,44
4 45
2,02
9 48
2,05
7 21
7,53
8 24
3,22
6 23
6,19
9
Acc
ount
ing
Polic
y
Equ
ity In
ject
ions
A
mou
nts
appr
opria
ted
whi
ch a
re d
esig
nate
d as
‘equ
ity in
ject
ions
’ for
a y
ear (
less
any
form
al re
duct
ions
) and
Dep
artm
enta
l Cap
ital B
udge
ts (D
CB
s) a
re re
cogn
ised
dire
ctly
in c
ontri
bute
d eq
uity
in th
at y
ear.
Res
truct
urin
g of
Adm
inis
trativ
e A
rran
gem
ents
N
et a
sset
s re
ceiv
ed fr
om o
r rel
inqu
ishe
d to
ano
ther
Aus
tralia
n G
over
nmen
t ent
ity u
nder
a re
stru
ctur
ing
of a
dmin
istra
tive
arra
ngem
ents
are
adj
uste
d at
thei
r boo
k va
lue
dire
ctly
aga
inst
con
tribu
ted
equi
ty.
Oth
er D
istri
butio
ns to
Ow
ners
Th
e Fi
nanc
ial R
epor
ting
Rul
e re
quire
s th
at d
istri
butio
ns to
ow
ners
be
debi
ted
to c
ontri
bute
d eq
uity
unl
ess
it is
in th
e na
ture
of a
div
iden
d.

58
CHAPTER FOUR · Departmental financial statements
Department of Industry, Innovation and Science Cash Flow Statement for the year ended 30 June 2017
The above statement should be read in conjunction with the accompanying notes, including the budget variance commentaries.
2017 2016 Original Budget
Notes $'000 $'000 $'000 OPERATING ACTIVITIES Cash received
Appropriations1 466,862 452,219 400,475 Sale of goods and rendering of services 72,045 62,728 62,862 Net GST received 16,822 17,007 14,949 Rental income 4,845 781 - Other 7,436 11,004 6,310
Total cash received 568,010 543,739 484,596 Cash used
Employees 303,873 309,707 317,719 Suppliers 179,929 182,611 163,357 Grants 4,904 9,492 210Section 74 receipts transferred to OPA 76,536 67,855 - Other 2,491 1,866 215
Total cash used 567,733 571,531 481,501 Net cash from/(used by) operating activities 277 (27,792) 3,095
INVESTING ACTIVITIES Cash received
Proceeds on sales of property, plant and equipment 154 140 - Total cash received 154 140 -Cash used
Purchase of property, plant and equipment 25,468 20,956 25,438 Purchase of intangibles 17,025 18,890 8,307
Total cash used 42,493 39,846 33,745 Net cash used by investing activities (42,339) (39,706) (33,745)
FINANCING ACTIVITIES Cash received
Appropriations - Contributed equity 10,057 34,288 4,567Appropriations - Departmental Capital Budget 29,697 28,866 25,438
Total cash received 39,754 63,154 30,005 Cash used
Restructuring - Special accounts cash transferred out2 14,663 - - Total cash used 14,663 - -Net cash from financing activities 25,091 63,154 30,005
Net increase/(decrease) in cash held (16,971) (4,344) (645)
Cash and cash equivalents at the beginning of the reporting period 30,732 8,198 5,973
Adjustment to opening balance - Special Accounts1 - 26,878 -
Cash and cash equivalents at the end of the reporting period 3.1A 13,761 30,732 5,328
1. Restatement of comparatives as a result of reclassification of special account from Trade and other receivables to Cash and cashequivalents, as per the Financial Reporting Rule.
2. Transfer of special account to the Department of Environment and Energy as a result of the Administrative Arrangements Order ofthe 19 July 2016.

59
CHAPTER FOUR · Departmental financial statements
Department of Industry, Innovation and Science Budget Variance Commentary - Departmental for the year ended 30 June 2017
The above statement should be read in conjunction with the accompanying notes, including the budget variance commentaries.
Budget Variance Commentary The below table provides commentary for major differences between the actual and the original budgeted amounts that were first presented to parliament in respect of the reporting period from the department’s 2016-17 Portfolio Budget Statements (PBS).
Variances are considered to be 'major' based on the following criteria:
• the variance between budget and actual is greater than 10% and $10 million; or
• an item below this threshold that is considered important for the reader's understanding or is relevant to anassessment of the discharge of accountability and to an analysis of performance of the entity.
Where an item was not originally budgeted for in the PBS, for example asset revaluations, rental income and sale of asset adjustments, explanation will only be provided if the variance is considered to be 'major'.
Explanations of major variances Affected line items/statements
Transfer of the Energy function to the Department of the Environment and Energy as a result of the Administrative Arrangements Order of the 19 July 2016 (net assets relinquished of $13.905 million)
Statement of Comprehensive Income - Revenue from Government ($26 million), Employee Benefits ($18 million) Statement of Financial Position - Appropriation receivables ($26 million), Employee Provisions ($8 million) Cash Flow Statement - Employee Payments ($8 million) Statement of Changes in Equity – Restructuring ($14 million)
Transfer of an accommodation lease to the Department of Communications and the Arts (net gain of $9 million in Comprehensive Income)
Statement of Comprehensive Income - Write-down and impairment of asset ($16 million), Other Gains ($25 million) Statement of Financial Position – Land and buildings ($16 million), Other Provisions ($19 million), Other Payables ($6 million).
Due to the timing of the original 2016-17 budget, the estimate for Suppliers Expense was set prior to a number of subsequent events occurring including increased costs associated with managing the Grants Hub including the Centre for Defence Industry Capability, which is offset by an increase in revenue. This has led to higher than budgeted Suppliers. This increase has been reflected in the 2016-17 Additional Estimates
Lease straight lining was budgeted in Suppliers Payables and has subsequently moved to Other Payables in the Additional Estimates to align with the financial statements
Statement of Comprehensive Income - Suppliers Expense
Statement of Financial Position - Suppliers Payables
Reclassification of special account balances from receivables to cash as per the Financial Reporting Rule
Budgeted section 74 receipts transferred to OPA are not shown separately in the cash flow statement but are netted off against operating cash received from appropriations
Statement of Financial Position - Cash and cash equivalents, Trade and other receivables
Cash Flow Statement – Appropriations, Section 74 receipts transferred to OPA ($77 million)

60
CHAPTER FOUR · Departmental financial statements
Department of Industry, Innovation and Science Administered Schedule of Comprehensive Income as at 30 June 2017
The above statement should be read in conjunction with the accompanying notes, including the budget variance commentaries.
2017 2016 Original Budget
Notes $'000 $'000 $'000 NET COST OF SERVICES Expenses
Employee benefits 2.1A 7,026 6,352 7,500Suppliers 2.1B 76,412 89,677 94,070 Fees 40 40 40Subsidies 2.1C 168,489 221,917 151,998 Grants 2.1D 490,589 427,335 477,500 Depreciation and amortisation 4.2A 1,227 726 993Write-down and impairment of assets - 2,288 - Payments to corporate Commonwealth entities 2.1E 1,054,797 991,012 1,044,409
Total expenses 1,798,580 1,739,347 1,776,510
IncomeRevenue Taxation revenue
Snowy Hydro land tax - 174 171Tradex receipts 942 1,301 800
Total taxation revenue 942 1,475 971
Non-taxation revenue Fees from regulatory services 2.2A 49,882 37,936 43,256 Fees 5,875 4,473 60,208 Interest 9,572 6,656 8,871Dividends 2.2B - 23,595 22,100 Royalties 950,106 979,091 701,046 Other non-taxation revenue 24,231 19,734 10,641
Total non-taxation revenue 1,039,666 1,071,485 846,122 Total revenue 1,040,608 1,072,960 847,093
GainsReversals of previous financial instruments impairments 248 - -
Total gains 248 - -Total income 1,040,856 1,072,960 847,093 Net cost of services (757,724) (666,387) (929,417) Deficit on continuing operations (757,724) (666,387) (929,417)
OTHER COMPREHENSIVE INCOME Items subject to subsequent reclassification to net cost of services
Changes in asset revaluation reserve 114,515 (38,159) - Total other comprehensive income 114,515 (38,159) -Total comprehensive loss (643,209) (704,546) (929,417)

61
CHAPTER FOUR · Departmental financial statements
Department of Industry, Innovation and Science Administered Schedule of Assets and Liabilities as at 30 June 2017
The above statement should be read in conjunction with the accompanying notes.
2017 2016 OriginalBudget
Notes $'000 $'000 $'000 ASSETS Financial assets
Cash in special accounts 82,509 104,917 106,979 Trade and other receivables 4.1A 118,847 112,405 113,350 Other investments 4.1B 3,660,784 4,036,341 3,916,230 Accrued revenue 84,618 73,276 64,725
Total financial assets 3,946,758 4,326,939 4,201,284
Non-financial assets Leasehold improvements 4.2A 192 231 126Property, plant and equipment 4.2A 197 324 365Intangibles 4.2A 3,825 4,671 1,429
Total non-financial assets 4,214 5,226 1,920
Total assets administered on behalf of Government 3,950,972 4,332,165 4,203,204
LIABILITIES Payables
Suppliers 4.3A 12,523 11,735 7,197Subsidies 4.3B 38,559 53,419 29,224 Grants 4.3C 44,570 48,690 60,814
Total payables 95,652 113,844 97,235
Provisions Employee provisions 6.1B 1,875 1,519 1,113
Total provisions 1,875 1,519 1,113
Total liabilities administered on behalf of Government 97,527 115,363 98,348
Net assets 3,853,445 4,216,802 4,104,856

62
CHAPTER FOUR · Departmental financial statements
Department of Industry, Innovation and Science Budget Variance Commentary - Administered for the year ended 30 June 2017
The above statement should be read in conjunction with the accompanying notes.
Budget Variance Commentary
The below table provides commentary for major differences between the actual and the original budgeted amounts that were first presented to parliament in respect of the reporting period from the department’s 2016-17 Portfolio Budget Statements (PBS).
Variances are considered to be 'major' based on the following criteria: the variance between budget and actual is greater than 10% and $10 million; oran item below this threshold that is considered important for the reader's understanding or is relevant to an assessment of thedischarge of accountability and to an analysis of performance of the entity.
Where an item was not originally budgeted for in the PBS, for example asset revaluations adjustments, explanation will only be provided if the variance is considered to be 'major'.
Explanations of major variances Affected line items/statements
Transfer of the Energy function (including investment in Snowy Hydro Limited) to the Department of the Environment and Energy
Unrealised budgeted proceeds from the auction of offshore petroleum exploration permits
Increase in realised sales prices for Liquid Natural Gas (LNG)
Timing differences for payments between financial years due to eligibility of milestone payments, adjusted at Additional Estimates: Clean Energy Initiative Programme; Victorian Innovation Investment Fund; Bindaree Beef; Entrepreneurs’ Programme
Lower demand for Entrepreneurs’ Programme
New measure announced during 2016-17 after finalisation of the 2016-17 PBS - Tasmania Jobs and Investment Fund
Higher demand for assistance under the Automotive Transformation Scheme
Investment in the Australian Nuclear Science and Technology Organisation increased due to its acquisition during the year of the Australian Synchrotron
Statement of Assets and Liabilities - Other Investments ($540 million); Schedule of Comprehensive Income - Dividends
Schedule of Comprehensive Income - Fees ($55 million)
Schedule of Comprehensive Income - Royalties ($249 million) Statement of Assets and Liabilities - Accrued Revenue ($20 million)
Statement of Assets and Liabilities - Net effect: Grants payable ($18 million), Cash in special accounts ($29 million)
Schedule of Comprehensive Income - Suppliers Expenses ($17 million)
Statement of Assets and Liabilities - Cash in special accounts ($4 million); Schedule of Comprehensive Income - Other Revenue ($8 million), Grants expense ($4 million)
Schedule of Comprehensive Income - Subsidies Expenses ($17 million); Statement of Assets and Liabilities - Subsidies Payable ($9 million)
Schedule of Comprehensive Income – Asset Revaluation Reserve; Statement of Assets and Liabilities - Administered Investments ($123 million)

63
CHAPTER FOUR · Departmental financial statements
Department of Industry, Innovation and Science Administered Reconciliation Schedule for the year ended 30 June 2017
The above statement should be read in conjunction with the accompanying notes.
2017 2016 $'000 $'000
Opening assets less liabilities as at 1 July 4,216,802 4,259,247
Net (cost of)/contribution by services Income 1,040,856 1,072,960Expenses
Payments to entities other than corporate Commonwealth entities (743,783) (748,335) Payments to corporate Commonwealth entities (1,054,797) (991,012)
Other comprehensive income Revaluations transferred to/(from) reserves 114,515 (38,159) Transfers (to)/from the Australian Government Appropriation transfers from Official Public Account
Administered assets and liabilities appropriations Payments to entities other than corporate Commonwealth entities 24,053 18,447 Payments to corporate Commonwealth entities 38,841 35,916
Annual appropriations Payments to entities other than corporate Commonwealth entities 535,444 507,955 Payments to corporate Commonwealth entities 1,020,264 947,464
Special appropriations (limited) Payments to entities other than corporate Commonwealth entities 171,447 228,671 Payments to corporate Commonwealth entities - 14,671
Special appropriations (unlimited) Payments to corporate Commonwealth entities 34,533 28,918
Appropriation transfers to OPA Transfers to OPA (1,005,717) (1,088,498) Appropriation from prior years 987 3,395Restructuring (540,000) (34,838)
Closing assets less liabilities as at 30 June 3,853,445 4,216,802
64
CHAPTER FOUR · Departmental financial statements
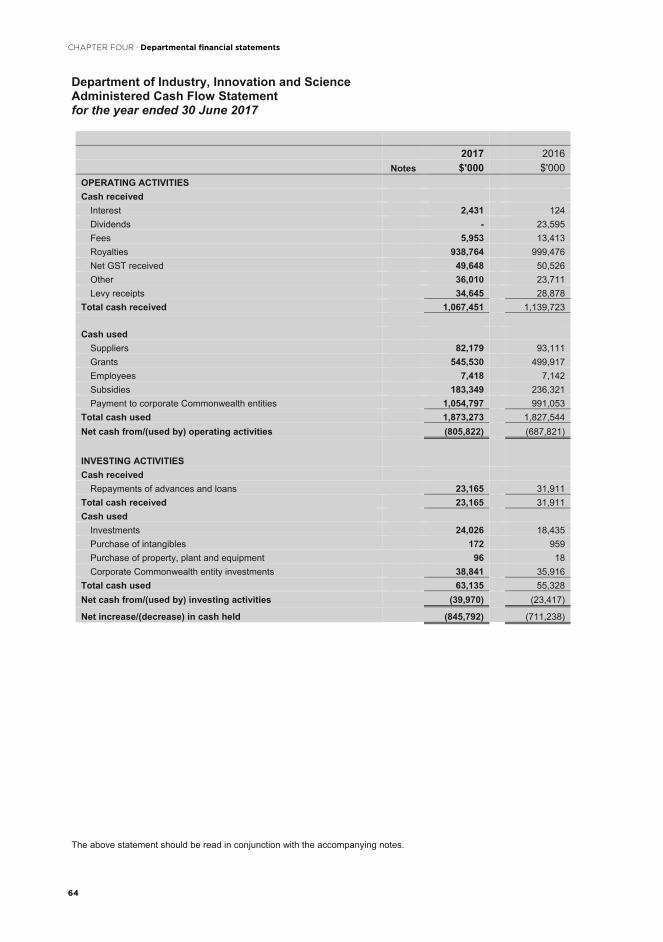
Department of Industry, Innovation and Science Administered Cash Flow Statement for the year ended 30 June 2017
The above statement should be read in conjunction with the accompanying notes.
2017 2016 Notes $'000 $'000
OPERATING ACTIVITIES Cash received
Interest 2,431 124Dividends - 23,595 Fees 5,953 13,413 Royalties 938,764 999,476 Net GST received 49,648 50,526 Other 36,010 23,711 Levy receipts 34,645 28,878
Total cash received 1,067,451 1,139,723
Cash used Suppliers 82,179 93,111 Grants 545,530 499,917 Employees 7,418 7,142Subsidies 183,349 236,321 Payment to corporate Commonwealth entities 1,054,797 991,053
Total cash used 1,873,273 1,827,544Net cash from/(used by) operating activities (805,822) (687,821)
INVESTING ACTIVITIES Cash received
Repayments of advances and loans 23,165 31,911 Total cash received 23,165 31,911 Cash used
Investments 24,026 18,435 Purchase of intangibles 172 959Purchase of property, plant and equipment 96 18Corporate Commonwealth entity investments 38,841 35,916
Total cash used 63,135 55,328 Net cash from/(used by) investing activities (39,970) (23,417)
Net increase/(decrease) in cash held (845,792) (711,238)
65
CHAPTER FOUR · Departmental financial statements
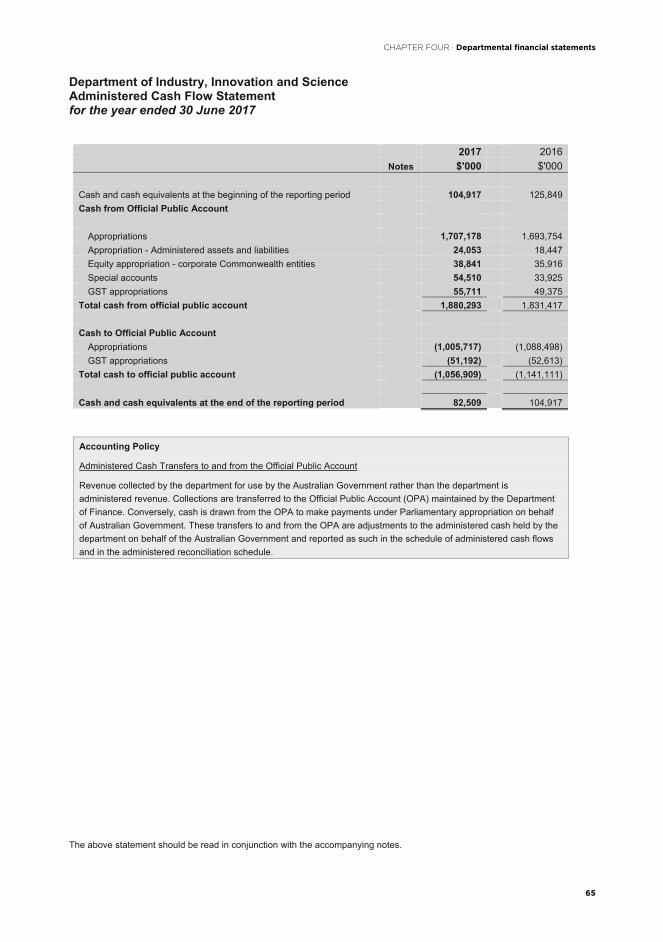
Department of Industry, Innovation and Science Administered Cash Flow Statement for the year ended 30 June 2017
The above statement should be read in conjunction with the accompanying notes.
2017 2016 Notes $'000 $'000
Cash and cash equivalents at the beginning of the reporting period 104,917 125,849 Cash from Official Public Account
Appropriations 1,707,178 1,693,754 Appropriation - Administered assets and liabilities 24,053 18,447 Equity appropriation - corporate Commonwealth entities 38,841 35,916 Special accounts 54,510 33,925 GST appropriations 55,711 49,375
Total cash from official public account 1,880,293 1,831,417
Cash to Official Public Account Appropriations (1,005,717) (1,088,498) GST appropriations (51,192) (52,613)
Total cash to official public account (1,056,909) (1,141,111)
Cash and cash equivalents at the end of the reporting period 82,509 104,917
Accounting Policy
Administered Cash Transfers to and from the Official Public Account
Revenue collected by the department for use by the Australian Government rather than the department is administered revenue. Collections are transferred to the Official Public Account (OPA) maintained by the Department of Finance. Conversely, cash is drawn from the OPA to make payments under Parliamentary appropriation on behalf of Australian Government. These transfers to and from the OPA are adjustments to the administered cash held by the department on behalf of the Australian Government and reported as such in the schedule of administered cash flows and in the administered reconciliation schedule.

66
CHAPTER FOUR · Departmental financial statements
Department of Industry, Innovation and Science Table of Contents - Notes
Table of Contents 1. Departmental Financial Performance
1.1. Expenses
1.2. Own-Source Revenue and Gains
2. Income and Expenses Administered on Behalf of Government
2.1. Administered - Expenses
2.2. Administered - Income
3. Departmental Financial Position
3.1. Financial Assets
3.2. Non-Financial Assets
3.3. Payables
3.4. Provisions
4. Assets and Liabilities Administered on Behalf of Government
4.1. Administered – Financial Assets
4.2. Administered – Non-Financial Assets
4.3. Administered – Payables
5. Funding
5.1. Appropriations
5.2. Special Accounts
5.3. Regulatory Charging Summary
6. People and Relationships
6.1. Employee Provisions
6.2. Key Management Personnel Remuneration
6.3. Related party transactions
7. Managing Uncertainties
7.1. Financial Instruments
7.2. Administered - Financial Instruments
7.3. Fair Value Measurement
7.4. Administered - Fair Value Measurement
8. Other Information
8.1. Restructuring

67
CHAPTER FOUR · Departmental financial statements
Department of Industry, Innovation and Science Notes to and forming part of the Financial Statements
Overview Objective of the Department of Industry, Innovation and Science The Department of Industry, Innovation and Science (the department) is an Australian Government controlled and a not-for-profit entity. The department contributes to the Australian Government’s vision for an agile economy, capitalising on Australia’scommercial, innovative and scientific strengths by facilitating the growth and productivity of globally competitive industries. It also supports business innovation and the commercialisation of new ideas and supports businesses in transition as critical requirements for productivity and economic growth.
The Energy function was transferred to the Department of Environment and Energy as a result of the Administrative Arrangements Order (AAO) of the 19 July 2016.
The activities that contribute towards the outcome are classified as either departmental or administered. Departmental activitiesinvolve the use of assets, liabilities, income and expenses controlled or incurred by the department in its own right. Administered activities involve the management or oversight by the department, on behalf of the Australian Government, of items controlled orincurred by the Australian Government. Administered activities are referred to in the shaded areas of these financial statements.
Basis of Preparation of the Financial Statements The financial statements are general purpose financial statements and are required by section 42 of the Public Governance, Performance and Accountability Act 2013 (PGPA Act).
The financial statements and notes have been prepared in accordance with:
Public Governance, Performance and Accountability (Financial Reporting) Rule 2015 (FRR) for reporting periodsending on or after 1 July 2015; and
Australian Accounting Standards (AAS) and Interpretations – Reduced Disclosure Requirements issued by theAustralian Accounting Standards Board (AASB) that apply for the reporting period.
The financial statements and notes have been prepared on an accrual basis and in accordance with the historical cost convention, except for certain assets and liabilities at fair value. Except where stated, no allowance is made for the effect ofchanging prices on the results or the financial position.
The financial statements and notes are presented in Australian dollars and values are rounded to the nearest thousand dollars unless otherwise specified.
New Accounting Standards All new/revised standards and/or interpretations that were issued prior to the sign-off date and are applicable to the current reporting period did not have a material effect to the department’s financial statements.
Reporting of Administered activities Administered revenues, expenses, assets, liabilities and cash flows are disclosed in the administered schedules and related notes. Unless otherwise stated, administered items are accounted for on the same basis and using the same policies as for departmental items, including the application of AAS.
Taxation The department is exempt from all forms of taxation except Fringe Benefits Tax (FBT) and Goods and Services Tax (GST). Revenues, expenses, assets and liabilities are recognised net of GST, except:
where the amount of GST incurred is not recoverable from the Australian Taxation Office; and for receivable and creditors.

68
CHAPTER FOUR · Departmental financial statements
Department of Industry, Innovation and Science Notes to and forming part of the Financial Statements
Contingent Liabilities The department was engaged in a number of legal matters on behalf of the Australian Government which involve, or may lead to, legal proceedings, which may result in the payment of damages and costs. It is not possible to estimate the amount of any eventual payment which may be required in relation to these matters.
Unquantifiable Administered Contingencies
The Australian and Western Australian governments have provided an indemnity to the Gorgon Joint Venture Partners (GJV) to indemnify the GJV against independent third party claims (relating to stored carbon dioxide) under common law following closure of the carbon dioxide sequestration project. The claims are subject to conditions equivalent to those set out in the Offshore Petroleum and Greenhouse Gas Storage Act 2006. The Western Australian Government has indemnified the GJV, and the Australian Government has indemnified the Western Australian Government for 80 per cent of any amount determined to be payable under that indemnity.
The Australian Government is responsible for 14 unlimited indemnities relating to the Maralinga Rehabilitation Project (1995-2000). In November 2009, the Australian Government agreed to the handback of former British Nuclear test site, Maralinga section 400, to the site’s Traditional Owners, Maralinga Tjarutja. Under the terms of the Maralinga Nuclear Test Site Handback Deed, the Australian Government has indemnified the Maralinga Tjarutja people and the South Australian Government in respect of claims arising from test site contamination.
On 21 April 2016, the minister for Industry, Innovation and Science signed a Deed of Indemnity between the Australian Government, ANSTO and ANSTO Nuclear Medicine Pty Ltd (ANM), under which the Australian Government has formally agreed to indemnify ANSTO and ANSTO Officers, and ANM and ANM Officers, from any loss or liability arising from claims caused by ionising radiation. This deed will remain in place until April 2026.
The Commonwealth Scientific and Industrial Research Organisation (CSIRO) has made a financial provision for the estimated costs in restoring and decontaminating land where a legal or constructive obligation has arisen. For cases where there is no legal or constructive obligation, the potential costs have not been assessed and are unquantifiable contingencies.
There are no departmental contingent liabilities as at 30 June 2017.
Events After the Reporting Period There were no events occurring after 30 June 2017 that would have a material impact on these financial statements.

69
CHAPTER FOUR · Departmental financial statements
Department of Industry, Innovation and Science Notes to and forming part of the Financial Statements
1. Departmental Financial PerformanceThis section analyses the financial performance of the Department.
1.1. Expenses
2017 2016 $'000 $'000
Note 1.1A: Employee Benefits Wages and salaries 212,910 216,208 Superannuation:
Defined contribution plans 19,405 20,145 Defined benefit plans 20,926 21,222
Leave and other entitlements 30,253 39,354 Separation and redundancies 8,140 7,411 Other employee expenses 1,822 2,441 Total employee benefits 293,456 306,781
Accounting Policy
Accounting policies for employee related expenses are contained in the People and Relationship section.
Note 1.1B: Suppliers Goods and services supplied or rendered
Communication, marketing and freight 3,125 3,508 Contractors and consultants 36,309 34,232 Inventory related costs 7,721 8,755 Property operating expense 18,893 14,468 Rendering of services and maintenance 32,822 31,549 Travel 12,435 12,604 Other goods and services 11,572 13,585
Total goods and services supplied or rendered 122,877 118,701
Goods supplied 15,494 14,193 Services rendered 107,383 104,508 Total goods and services supplied or rendered 122,877 118,701
Other suppliers Operating lease rentals 39,792 46,610 Workers compensation expenses 2,671 1,747
Total other suppliers 42,463 48,357 Total suppliers 165,340 167,058

70
CHAPTER FOUR · Departmental financial statements
Department of Industry, Innovation and Science Notes to and forming part of the Financial Statements
2017 2016 $'000 $'000
Commitments for minimum lease payments in relation to non-cancellable operating leases are payable as follows:
Within 1 year 50,018 58,293 Between 1 to 5 years 178,471 153,365 More than 5 years 17,650 180,072
Total operating lease commitments 246,139 391,730
Leasing commitments
The department’s lease payment commitments are primarily for accommodation for its operation around the country. The two major leases are office space and laboratories in Sydney, as well as office space in Industry House in Canberra.
Accounting Policy
Leases
All leases in the department are operating leases, as the risks and benefits are shared with the lessor.
Operating lease payments are expensed on a straight line basis which is representative of the pattern of benefits derived from the leased assets. Lease incentives are recognised as other payables and amortised over the life of the lease on a straight line basis.
Note 1.1C: Grants Australian Government entities 593 911 State and Territory Governments 9 498 Non-profit organisations 1,074 1,374 Other 1,823 5,039
Total grants 3,499 7,822
Note 1.1D: Write-Down and Impairment of Assets Impairment of financial instruments 43 -Impairment of leasehold improvements 16,498 -Impairment of laboratory equipment 266 11 Write-down of inventories 47 40 Total write-down and impairment of assets 16,854 51

71
CHAPTER FOUR · Departmental financial statements
Department of Industry, Innovation and Science Notes to and forming part of the Financial Statements
1.2. Own-Source Revenue and Gains 2017 2016
Own-Source Revenue $'000 $'000 Note 1.2A: Sale of Goods and Rendering of Services Sale of goods 3,823 3,780 Rendering of services 64,003 53,785 Total sale of goods and rendering of services 67,826 57,565
Accounting Policy
Revenue from the sale of goods is recognised when the risks and rewards of ownership have been transferred to the buyer; and the department retains no managerial involvement or effective control over the goods. The stage of completion of contracts at the reporting date is determined by reference to the proportion that costs incurred to date bear to the estimated total costs of the transaction.
Note 1.2B: Other Revenue State receipts 3,990 4,248 Equipment Energy Efficiency receipts - 379 Sponsorships 2,633 1,055 Other 4,431 2,677 Department of Foreign Affairs and Trade receipts 534 489 Resources received free of charge 603 617 Total other revenue 12,191 9,465
Commitments for sublease rental income receivables are as follows: Within 1 year 490 420Between 1 to 5 years 1,532 1,503
Total sublease rental income commitments 2,022 1,923
The Department’s sublease rental income commitments receivable relate to the sublease of the childcare centre and part of the Questacon building in Canberra.
72
CHAPTER FOUR · Departmental financial statements
Department of Industry, Innovation and Science Notes to and forming part of the Financial Statements
2017 2016 $'000 $'000
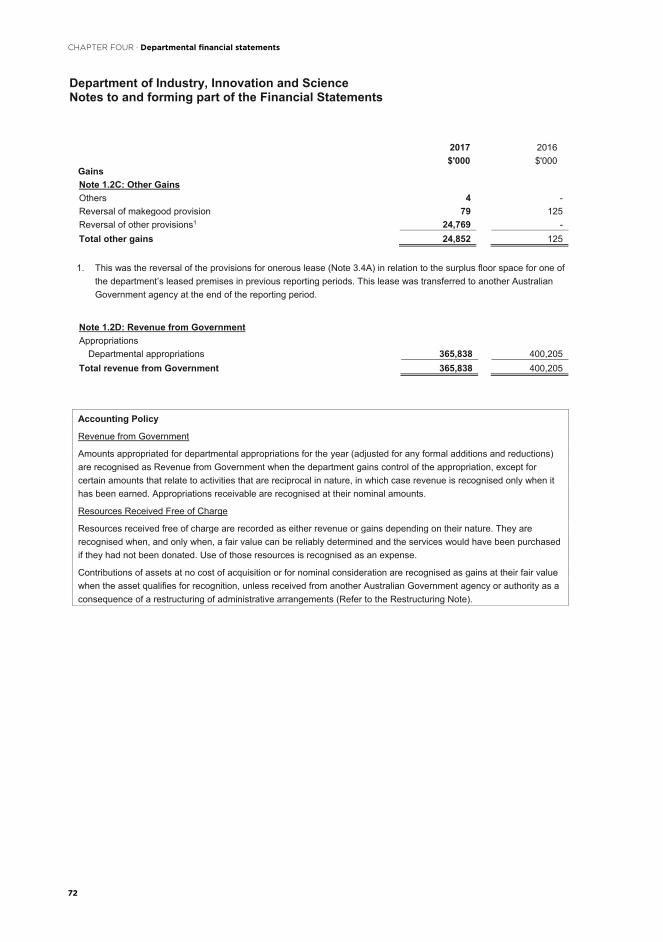
GainsNote 1.2C: Other Gains Others 4 -Reversal of makegood provision 79 125 Reversal of other provisions1 24,769 -Total other gains 24,852 125
1. This was the reversal of the provisions for onerous lease (Note 3.4A) in relation to the surplus floor space for one ofthe department’s leased premises in previous reporting periods. This lease was transferred to another AustralianGovernment agency at the end of the reporting period.
Note 1.2D: Revenue from Government Appropriations
Departmental appropriations 365,838 400,205 Total revenue from Government 365,838 400,205
Accounting Policy
Revenue from Government
Amounts appropriated for departmental appropriations for the year (adjusted for any formal additions and reductions) are recognised as Revenue from Government when the department gains control of the appropriation, except for certain amounts that relate to activities that are reciprocal in nature, in which case revenue is recognised only when it has been earned. Appropriations receivable are recognised at their nominal amounts.
Resources Received Free of Charge
Resources received free of charge are recorded as either revenue or gains depending on their nature. They are recognised when, and only when, a fair value can be reliably determined and the services would have been purchased if they had not been donated. Use of those resources is recognised as an expense.
Contributions of assets at no cost of acquisition or for nominal consideration are recognised as gains at their fair value when the asset qualifies for recognition, unless received from another Australian Government agency or authority as a consequence of a restructuring of administrative arrangements (Refer to the Restructuring Note).

73
CHAPTER FOUR · Departmental financial statements
Department of Industry, Innovation and Science Notes to and forming part of the Financial Statements
2. Income and Expenses Administered on Behalf of GovernmentThis section analyses the activities that the department does not control but administers on behalf of the Government. Unless otherwise noted, the accounting policies adopted are consistent with those applied for departmental reporting.
2.1. Administered - Expenses 2017 2016 $'000 $'000
Note 2.1A: Employee benefits Wages and salaries 4,765 4,264 Superannuation
Defined contribution plans 485 492 Defined benefit plans 465 316
Leave and other entitlements 1,311 1,280 Total employee benefits 7,026 6,352
Note 2.1B: Suppliers Services rendered
Communication, marketing and freight 6,832 23,471 Consultants and contractors 12,859 14,389 Travel 827 609 Fee for service 47,432 42,440 Other 6,640 6,977
Total services rendered 74,590 87,886
Other suppliers Operating lease rentals 1,822 1,791
Total other suppliers 1,822 1,791 Total suppliers 76,412 89,677
Commitments for minimum lease payments in relation to non-cancellable operating leases are payable as follows:
Within 1 year 1,237 1,292Between 1 to 5 years 3,872 4,180More than 5 years - 910
Total operating lease commitments 5,109 6,382
Leasing commitments
The department’s administered lease payment commitments relate to office space for the National Offshore Petroleum Titles Administrator’s operations in Perth and Melbourne.

74
CHAPTER FOUR · Departmental financial statements
Department of Industry, Innovation and Science Notes to and forming part of the Financial Statements
2017 2016 $'000 $'000
Note 2.1C: Subsidies Subsidies in connection with external parties
Assistance to industry 168,489 222,741 Resources related initiatives - (824)
Total subsidies 168,489 221,917
Note 2.1D: Grants Public sector
Australian Government entities (related parties) 4,540 4,611 State and Territory Governments 279 13,131 Local Governments - 2,046
Private sector Non-profit organisations 12,388 10,469 External entities 430,342 375,903 Other 25,679 12,910 Grants through State and Territory Governments 16,003 6,632 Multi-jurisdictional sector 1,358 1,633
Total grants 490,589 427,335
Note 2.1E: Payments to corporate Commonwealth entities Commonwealth Scientific and Industrial Research Organisation 787,267 750,280 Australian Nuclear Science and Technology Organisation 183,334 156,700 Australian Institute of Marine Science 41,552 40,483 Australian Renewable Energy Agency - 14,671 National Offshore Petroleum Safety and Environmental Management Authority 34,533 28,878 Northern Australia Infrastructure Facility 8,111 -Total payments to corporate Commonwealth entities 1,054,797 991,012
Accounting Policy
Grants and Subsidies
The department administers a number of grant and subsidy schemes on behalf of the Australian Government. Grant and subsidy liabilities are recognised to the extent that:
• the services required to be performed by the grantee have been performed; or
• the grant eligibility criteria have been satisfied, but payments due have not been made.
When the Australian Government enters into an agreement to make these grants and services but services have not been performed or eligibility conditions have not been met, this is considered a commitment.
Payments to corporate Commonwealth entities
Payments to corporate Commonwealth entities from amounts appropriated for that purpose are classified as either administered expenses or equity injections. The appropriation to the department is disclosed in the appropriations note.
75
CHAPTER FOUR · Departmental financial statements
Department of Industry, Innovation and Science Notes to and forming part of the Financial Statements
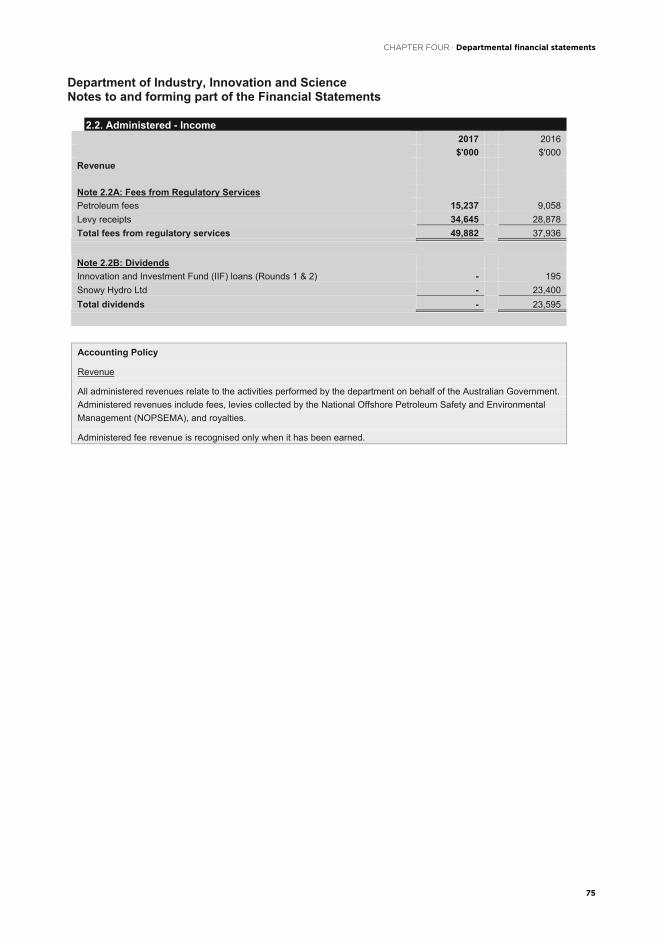
2.2. Administered - Income 2017 2016 $'000 $'000
Revenue
Note 2.2A: Fees from Regulatory Services Petroleum fees 15,237 9,058 Levy receipts 34,645 28,878 Total fees from regulatory services 49,882 37,936
Note 2.2B: Dividends Innovation and Investment Fund (IIF) loans (Rounds 1 & 2) - 195 Snowy Hydro Ltd - 23,400 Total dividends - 23,595
Accounting Policy
Revenue
All administered revenues relate to the activities performed by the department on behalf of the Australian Government. Administered revenues include fees, levies collected by the National Offshore Petroleum Safety and Environmental Management (NOPSEMA), and royalties.
Administered fee revenue is recognised only when it has been earned.
76
CHAPTER FOUR · Departmental financial statements
Department of Industry, Innovation and Science Notes to and forming part of the Financial Statements
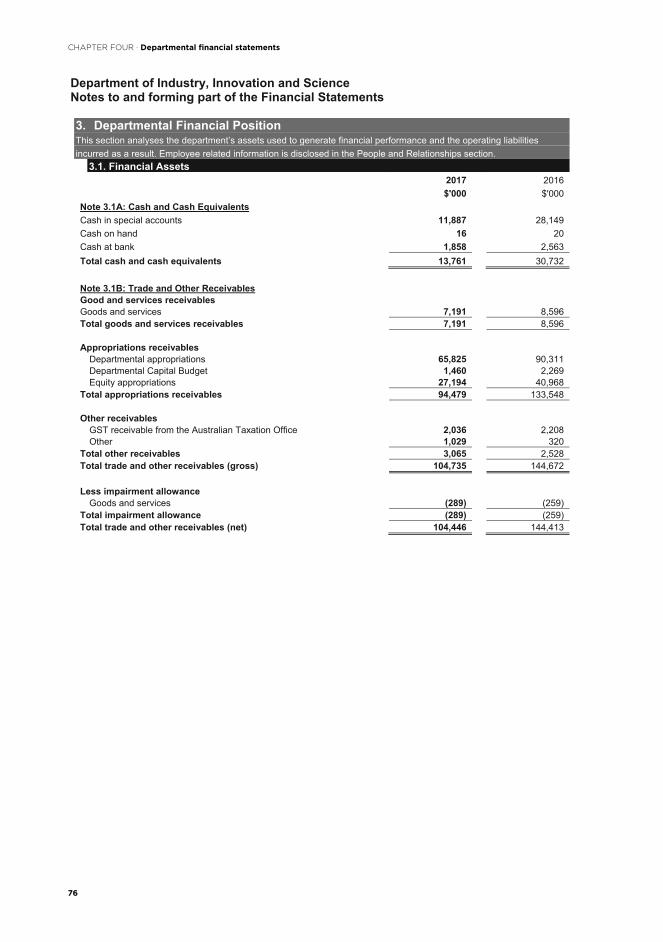
3. Departmental Financial PositionThis section analyses the department’s assets used to generate financial performance and the operating liabilities incurred as a result. Employee related information is disclosed in the People and Relationships section.
3.1. Financial Assets 2017 2016 $'000 $'000
Note 3.1A: Cash and Cash Equivalents Cash in special accounts 11,887 28,149 Cash on hand 16 20 Cash at bank 1,858 2,563 Total cash and cash equivalents 13,761 30,732
Note 3.1B: Trade and Other Receivables Good and services receivables Goods and services 7,191 8,596 Total goods and services receivables 7,191 8,596
Appropriations receivables Departmental appropriations 65,825 90,311 Departmental Capital Budget 1,460 2,269 Equity appropriations 27,194 40,968
Total appropriations receivables 94,479 133,548
Other receivables GST receivable from the Australian Taxation Office 2,036 2,208 Other 1,029 320
Total other receivables 3,065 2,528 Total trade and other receivables (gross) 104,735 144,672
Less impairment allowance Goods and services (289) (259)
Total impairment allowance (289) (259) Total trade and other receivables (net) 104,446 144,413

77
CHAPTER FOUR · Departmental financial statements
Department of Industry, Innovation and Science Notes to and forming part of the Financial Statements
2017 2016 $'000 $'000
Reconciliation of the Impairment Allowance
As at 1 July 259 279Amounts written off (13) (28) Amounts recovered and reversed - 8Increase/(Decrease) recognised in net cost of services 43 -
Total as at 30 June 289 259
Accounting Policy
Trade receivables, loans and other receivables that have fixed or determinable payments and that are not quoted in an active market are classified as ‘loans and receivables’. Loans and receivables are measured at amortised cost using the effective interest method less impairment, and assessed for impairment at the end of each reporting period.
Credit terms were 30 days.
Acquisition of Assets
Assets are recorded at cost on acquisition except as stated below. The cost of acquisition includes the fair value of assets transferred in exchange and liabilities undertaken. Financial assets are initially measured at their fair value plus transaction costs where appropriate.
Assets acquired at no cost, or for nominal consideration, are initially recognised as assets and income at their fair value at the date of acquisition, unless acquired as a consequence of restructuring of administrative arrangements. In the latter case, assets are initially recognised as contributions by owners at the amounts at which they were recognised in the transferor’s accounts immediately prior to the restructuring.

78
CHAPTER FOUR · Departmental financial statements
Dep
artm
ent o
f Ind
ustr
y, In
nova
tion
and
Scie
nce
Not
es to
and
form
ing
part
of t
he F
inan
cial
Sta
tem
ents
3.2.
Non
-Fin
anci
al A
sset
s
Not
e 3.
2A: R
econ
cilia
tion
of th
e O
peni
ng a
nd C
losi
ng B
alan
ces
of P
rope
rty,
Pla
nt a
nd E
quip
men
t and
Inta
ngib
les
2017
Bui
ldin
gs
Leas
ehol
d im
prov
emen
ts
Prop
erty
, pla
nt
and
equi
pmen
t La
bora
tory
eq
uipm
ent
Com
pute
rso
ftwar
e in
tern
ally
de
velo
ped
Com
pute
rso
ftwar
e pu
rcha
sed
Tota
l $’
000
$’00
0 $’
000
$’00
0 $’
000
$’00
0 $’
000
As
at 1
Jul
y 20
16
Gro
ss b
ook
valu
e 56
,703
75
,297
65
,799
29
,278
58
,956
14
,949
30
0,98
2 W
ork
in p
rogr
ess
1,12
410
,402
5,
960
1,28
522
,764
-
41,5
35A
ccum
ulat
ed d
epre
ciat
ion,
am
ortis
atio
n an
d im
pairm
ent
(2,4
25)
(8,9
33)
(18,
825)
(5
,550
) (4
0,60
2)
(13,
802)
(9
0,13
7)To
tal a
s at
1 J
uly
2016
55
,402
76
,766
52
,934
25
,013
41
,118
1,
147
252,
380
Add
ition
s:
Purc
hase
or i
nter
nally
dev
elop
ed
2,81
12,
857
16,3
44
5,27
413
,075
76
941
,130
R
eval
uatio
ns re
cogn
ised
thro
ugh
othe
r com
preh
ensi
ve in
com
e (1
,582
) (5
84)
--
--
(2,1
66)
Impa
irmen
ts re
cogn
ised
in n
et c
ost o
f ser
vice
s -
(16,
498)
-(2
66)
--
(16,
764)
D
epre
ciat
ion
/ am
ortis
atio
n (2
,512
) (8
,511
)(1
5,45
9)
(4,6
89)
(6,3
00)
(618
)(3
8,08
9)D
ispo
sals
: Fr
om d
ispo
sal o
f ent
ities
or o
pera
tions
(inc
ludi
ng re
stru
ctur
ing)
-
--
-(4
92)
-(4
92)
Oth
er-
(88)
(4)
(772
)-
-(8
64)
Tota
l as
at 3
0 Ju
ne 2
017
54,1
19
53,9
42
53,8
15
24,5
60
47,4
01
1,29
8 23
5,13
5
Tota
l as
at 3
0 Ju
ne 2
017
repr
esen
ted
by
Gro
ss b
ook
valu
e 52
,424
52
,934
78
,973
29
,777
78
,747
15
,718
30
8,57
3 W
ork
in p
rogr
ess
1,69
51,
008
8,85
14,
484
14,4
50
-30
,488
Acc
umul
ated
dep
reci
atio
n, a
mor
tisat
ion
and
impa
irmen
t -
-(3
4,00
9)
(9,7
01)
(45,
796)
(1
4,42
0)
(103
,926
)To
tal a
s at
30
June
201
7 54
,119
53
,942
53
,815
24
,560
47
,401
1,
298
235,
135
Rev
alua
tions
of n
on-fi
nanc
ial a
sset
s
All
reva
luat
ions
wer
e co
nduc
ted
in a
ccor
danc
e w
ith th
e re
valu
atio
n po
licy.
A re
valu
atio
n w
as c
ondu
cted
as
at 3
0 Ju
ne 2
017
for b
uild
ings
and
leas
ehol
d im
prov
emen
ts b
y an
inde
pend
ent
valu
er.
Con
trac
tual
com
mitm
ents
for t
he a
cqui
sitio
n of
pro
pert
y, p
lant
, equ
ipm
ent a
nd in
tang
ible
ass
ets
All c
apita
l com
mitm
ents
tota
lling
$11
.6 m
illio
n (2
015-
16: $
15.0
milli
on) a
re p
ayab
le w
ithin
12
mon
ths.
The
maj
or p
roje
cts
incl
ude
$4.3
milli
on fo
r the
Sin
gle
Bus
ines
s S
ervi
ce p
rogr
am, $
2.2
milli
on fo
r IC
T in
frast
ruct
ure
and
equi
pmen
t, $0
.4 m
illio
n fo
r doc
umen
t man
agem
ent a
nd $
0.3
milli
on fo
r the
flex
ible
wor
kpla
ce le
aseh
old
impr
ovem
ents
.

79
CHAPTER FOUR · Departmental financial statements
Department of Industry, Innovation and Science Notes to and forming part of the Financial Statements
Accounting PolicyAsset Recognition Threshold
Purchases of property, plant and equipment are recognised initially at cost in the statement of financial position, except for:
items of property with a project cost less than $10,000 (which are expensed in the year of acquisition); and items of plant and equipment costing less than $5,000 which are expensed in the year of acquisition (other than where they form part of a group of similar items which individually cost less than $5,000 but collectively cost $50,000 or more, which are recognised in the statement of financial position).
The initial cost of an asset includes an estimate of the cost of dismantling and removing the item and restoring the site on which it is located. This is particularly relevant to ‘make good’ provisions in property leases taken up by the department where there exists an obligation to restore the property to its original condition. These costs are included in the value of the department’s leasehold improvements with a corresponding provision for the ‘make good’ recognised.
Revaluations
Following initial recognition at cost, property, plant and equipment are carried at fair value less subsequent accumulated depreciation and accumulated impairment losses. Valuations are conducted with sufficient frequency to ensure that the carrying amounts of assets do not differ materially from the assets’ fair values as at the reporting date. The regularity of independent valuations depends upon the volatility of movements in market values for the relevant assets. The department has adopted a rolling revaluation, meaning that all assets will be subject to revaluation over a three year period. The Leasehold Improvements and Buildings asset classes were revalued effective 30 June 2017 by an independent valuer, using a fair value basis.
Revaluation adjustments are made on a class basis. Any revaluation increment is credited to equity under the heading of asset revaluation reserve except to the extent that it reverses a previous revaluation decrement of the same asset class that was previously recognised in the surplus/deficit. Revaluation decrements for a class of assets are recognised directly in the surplus/deficit except to the extent that they reverse a previous revaluation increment for that class.
Any accumulated depreciation as at the revaluation date is eliminated against the gross carrying amount of the asset and the asset is restated to the revalued amount.
Depreciation
Depreciable property, plant and equipment assets are written-off to their estimated residual values over their estimated useful lives to the department using, in all cases, the straight line method of depreciation.
Depreciation rates (useful lives), residual values and methods are reviewed at each reporting date and necessary adjustments are made in the current, or current and future reporting periods, as appropriate.
Depreciation rates applying to each class of depreciable asset are based on the following useful lives:
2017 2016 Buildings 8-40 years 8-40 yearsLeasehold improvements Lease term Lease term Laboratory equipment 3-10 years 3-10 yearsOther property, plant and equipment
3-10 years 3-10 years
Impairment
All assets were assessed for impairment at 30 June 2017 and the result reported in note 3.2A and 4.2A. Where indications of impairment exist, the asset’s recoverable amount is estimated and an impairment adjustment made if the asset’s recoverable amount is less than its carrying amount. The impairment adjustment is reflected in the gross carrying value of the asset.
The recoverable amount of an asset is the higher of its fair value less costs to sell and its value in use. Value in use is the present value of the future cash flows expected to be derived from the asset. Where the future economic benefit of an asset is not primarily dependent on the asset’s ability to generate future cash flows, and the asset would be replaced if the department were deprived of the asset, its value in use is taken to be its depreciated replacement cost.
Derecognition
An item of property, plant and equipment is derecognised upon disposal or when no further future economic benefits are expected from its use or disposal. No assets have been identified for sale or disposal within the next 12 months unless otherwise specified in the respective notes.
Intangibles
The department’s intangibles comprise both internally developed and purchased software for internal use. These assets are carried at cost less accumulated amortisation and accumulated impairment losses.
Purchases of software with a value of less than $50,000 and internally developed software with a value of less than $200,000 are expensed in the year of acquisition.
Bulk purchases of software that individually cost less than $50,000, but as a group cost $50,000 or more are recognised in the statement of financial position.
Software is amortised on a straight-line basis over its anticipated useful life. The useful lives of the department’s software are 3 to 15 years (2015-16: 3 to 15 years).
Inventories
Inventories held for sale are valued at the lower of cost and net realisable value.
Inventories held for distribution are valued at cost, adjusted for any loss of service potential.

80
CHAPTER FOUR · Departmental financial statements
Department of Industry, Innovation and Science Notes to and forming part of the Financial Statements
3.3. Payables 2017 2016 $'000 $'000
Note 3.3A: Suppliers Trade creditors and accruals 17,164 19,600 Other creditors 498 440 Total suppliers 17,662 20,040
Settlement is usually made within 30 days.
Note 3.3B: Other Payables Lease straight lining and incentives 30,745 39,105 Unearned revenue 6,920 13,236 Wages and salaries 2,711 2,677 Superannuation 317 170 Other 4,713 1,343 Total other payables 45,406 56,531
Accounting Policy
Financial liabilities are initially measured at fair value, net of transaction costs. These liabilities are subsequently measured at amortised cost using the effective interest method, with interest expense recognised in finance costs.
Liabilities are recognised to the extent that the goods or services have been received regardless of the fact that the department may not have been invoiced.
Superannuation
The liability for superannuation recognised as at 30 June 2017 represents outstanding contributions for the final fortnight of the year.

81
CHAPTER FOUR · Departmental financial statements
Department of Industry, Innovation and Science Notes to and forming part of the Financial Statements
3.4. Provisions 2017 2016 $'000 $'000
Note 3.4A: Other Provisions Provision for onerous lease1 - 18,974 Provision for restoration 1,747 1,851 Total other provisions 1,747 20,825
Provision for onerous
lease
Provision for
restoration Total $’000 $’000 $’000
As at 1 July 2016 18,974 1,851 20,825 Additional provisions made - 22 22Amounts reversed (18,974) (122) (19,096)Other movements - (4) (4)
Total as at 30 June 2017 - 1,747 1,747
Accounting Judgements and Estimates
The department has made provisions to reflect the present value of the following obligations:
Provision for onerous lease
An onerous contract is considered to exist where the unavoidable cost of meeting the obligations under the contract exceed the economic benefits expected to be received from the contract. The department recognised a provision in relation to surplus floor space for one of the department’s leased premises in previous reporting periods. This lease was transferred to another Australian Government agency at the end of the reporting period, resulting in the reversal of this provision (Note 3.4A)1.
Provision for restoration
The department currently has 11 agreements for the leasing of premises which have provisions requiring the department to restore the premises to their original condition at the conclusion of the lease.
82
CHAPTER FOUR · Departmental financial statements
Department of Industry, Innovation and Science Notes to and forming part of the Financial Statements
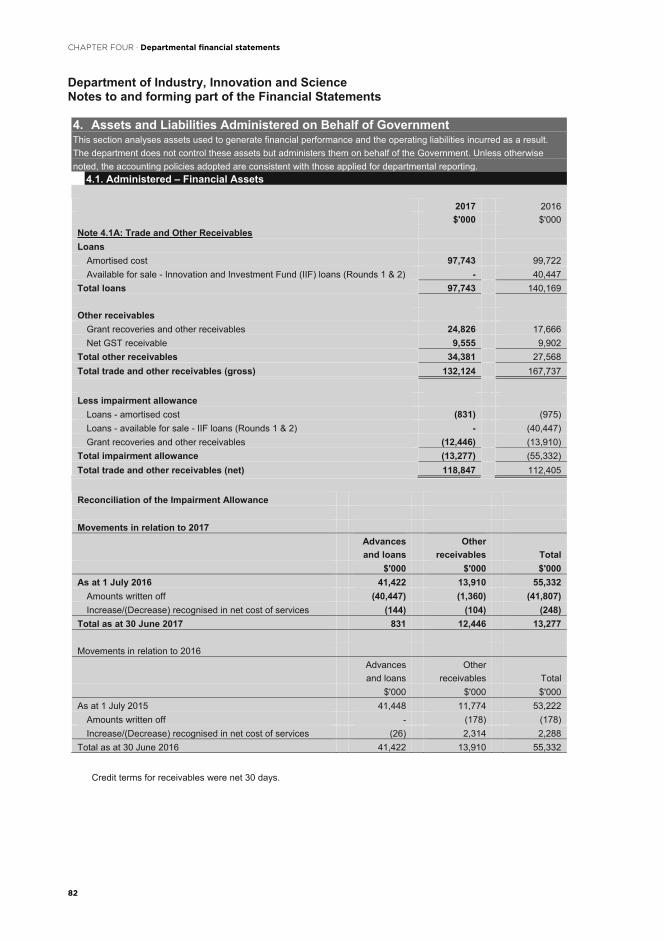
4. Assets and Liabilities Administered on Behalf of GovernmentThis section analyses assets used to generate financial performance and the operating liabilities incurred as a result. The department does not control these assets but administers them on behalf of the Government. Unless otherwise noted, the accounting policies adopted are consistent with those applied for departmental reporting.
4.1. Administered – Financial Assets
2017 2016 $'000 $'000
Note 4.1A: Trade and Other Receivables Loans
Amortised cost 97,743 99,722 Available for sale - Innovation and Investment Fund (IIF) loans (Rounds 1 & 2) - 40,447
Total loans 97,743 140,169
Other receivables Grant recoveries and other receivables 24,826 17,666 Net GST receivable 9,555 9,902
Total other receivables 34,381 27,568 Total trade and other receivables (gross) 132,124 167,737
Less impairment allowance Loans - amortised cost (831) (975) Loans - available for sale - IIF loans (Rounds 1 & 2) - (40,447) Grant recoveries and other receivables (12,446) (13,910)
Total impairment allowance (13,277) (55,332) Total trade and other receivables (net) 118,847 112,405
Reconciliation of the Impairment Allowance
Movements in relation to 2017 Advances and loans
Otherreceivables Total
$'000 $'000 $'000 As at 1 July 2016 41,422 13,910 55,332
Amounts written off (40,447) (1,360) (41,807) Increase/(Decrease) recognised in net cost of services (144) (104) (248)
Total as at 30 June 2017 831 12,446 13,277
Movements in relation to 2016 Advances and loans
Otherreceivables Total
$'000 $'000 $'000 As at 1 July 2015 41,448 11,774 53,222
Amounts written off - (178) (178) Increase/(Decrease) recognised in net cost of services (26) 2,314 2,288
Total as at 30 June 2016 41,422 13,910 55,332
Credit terms for receivables were net 30 days.
83
CHAPTER FOUR · Departmental financial statements
Department of Industry, Innovation and Science Notes to and forming part of the Financial Statements
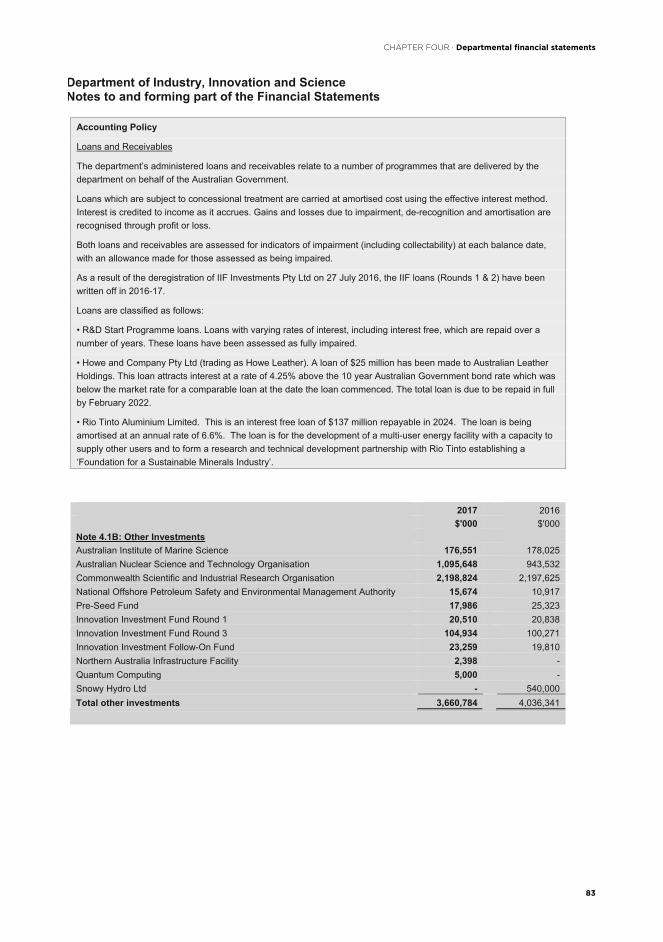
Accounting Policy
Loans and Receivables
The department’s administered loans and receivables relate to a number of programmes that are delivered by the department on behalf of the Australian Government.
Loans which are subject to concessional treatment are carried at amortised cost using the effective interest method. Interest is credited to income as it accrues. Gains and losses due to impairment, de-recognition and amortisation are recognised through profit or loss.
Both loans and receivables are assessed for indicators of impairment (including collectability) at each balance date, with an allowance made for those assessed as being impaired.
As a result of the deregistration of IIF Investments Pty Ltd on 27 July 2016, the IIF loans (Rounds 1 & 2) have been written off in 2016-17.
Loans are classified as follows:
• R&D Start Programme loans. Loans with varying rates of interest, including interest free, which are repaid over anumber of years. These loans have been assessed as fully impaired.
• Howe and Company Pty Ltd (trading as Howe Leather). A loan of $25 million has been made to Australian LeatherHoldings. This loan attracts interest at a rate of 4.25% above the 10 year Australian Government bond rate which wasbelow the market rate for a comparable loan at the date the loan commenced. The total loan is due to be repaid in fullby February 2022.
• Rio Tinto Aluminium Limited. This is an interest free loan of $137 million repayable in 2024. The loan is beingamortised at an annual rate of 6.6%. The loan is for the development of a multi-user energy facility with a capacity tosupply other users and to form a research and technical development partnership with Rio Tinto establishing a‘Foundation for a Sustainable Minerals Industry’.
2017 2016 $'000 $'000
Note 4.1B: Other Investments Australian Institute of Marine Science 176,551 178,025 Australian Nuclear Science and Technology Organisation 1,095,648 943,532 Commonwealth Scientific and Industrial Research Organisation 2,198,824 2,197,625National Offshore Petroleum Safety and Environmental Management Authority 15,674 10,917 Pre-Seed Fund 17,986 25,323 Innovation Investment Fund Round 1 20,510 20,838 Innovation Investment Fund Round 3 104,934 100,271 Innovation Investment Follow-On Fund 23,259 19,810 Northern Australia Infrastructure Facility 2,398 -Quantum Computing 5,000 -Snowy Hydro Ltd - 540,000 Total other investments 3,660,784 4,036,341

84
CHAPTER FOUR · Departmental financial statements
Department of Industry, Innovation and Science Notes to and forming part of the Financial Statements
Accounting Policy
Administered investments in subsidiaries, joint ventures and associates are not consolidated as their consolidation is relevant only at the Whole-of-Government level. Administered investments are classified as “available for sale” and are measured at their fair value as at 30 June 2017. Fair value has been taken to be the Australian Government’s proportional interest in the entity valued at either times/earnings or net assets position as at reporting date.
The principal activities of the department’s administered investments are as follows:
Australian Institute of Marine Science
The principal activities are to provide marine research services, particularly tropical science, with the view to support the sustainable use and protection of the marine environment. The Australian Government owns 100% of this investment.
Australian Nuclear Science and Technology Organisation
The principal activities are the timely delivery of valued nuclear related scientific and technical advice services and products. The Australian Government owns 100% of this investment.
Commonwealth Scientific and Industrial Research Organisation
The principal activities are to enhance innovation, productivity and competitiveness in Australian industry, with improved understanding and management of the environment and natural resources through research. The Australian Government owns 100% of this investment.
National Offshore Petroleum Safety and Environmental Management Authority
The principal activities are to provide independent expert regulation for health and safety, environmental management and structural and well integrity for offshore petroleum facilities and activities in Commonwealth waters in accordance with the Offshore Petroleum and Greenhouse Gas Storage Act 2006. The Australian Government owns 100% of this investment.
Pre-Seed Fund
The Australian Government invested in a number of venture capital funds under the Pre-Seed Fund programme. The Pre-Seed Fund programme encourages the private sector to take a more active role in funding and managing the commercialisation of research from universities and Australian Government research agencies, through private sector venture capital fund managers.
Innovation and Investment Fund (IIF)
The Australian Government co-invested in a number of venture capital funds under the IIF programme:
• Rounds 1 and 3 of the IIF are designed to promote the commercialisation of Australian research and development bytechnology-based companies at the seed, start-up or early growth stages, through licensed private sector venturecapital fund managers; and
• The Innovation Investment Follow-on Fund (IIFF) was a temporary programme in response to the impact of theglobal financial crisis on the availability of venture capital. The programme was funded through returns on investmentsmade under the IIF programme. IIFF supported investments made under IIF Rounds 1 and 2, the Pre-Seed Fund, theformer Renewable Energy Equity Fund and the former ICT Incubators programme.

85
CHAPTER FOUR · Departmental financial statements
Department of Industry, Innovation and Science Notes to and forming part of the Financial Statements
Northern Australia Infrastructure Facility
The principal activities are to provide $5 billion in concessional finance to encourage and complement private sector investment in infrastructure that benefits Northern Australia. The Australian Government owns 100% of this investment.
Quantum Computing
The Australian Government owns shares in Silicon Quantum Computing Pty Ltd. The principal activities of Silicon Quantum Computing Pty Ltd is to translate the Centre for Quantum Computations and Communications Technology research into a silicon quantum integrated circuit.
Snowy Hydro Ltd
The Australian Government owns 13% of Snowy Hydro Ltd which was corporatised in 2002. The principal activities of Snowy Hydro Ltd are the collection, diversion and storage of water and the generation and transmission of electricity. This investment was transferred to the Department of Environment and Energy as a result of the AAO of the 19 July 2016.

86
CHAPTER FOUR · Departmental financial statements
Dep
artm
ent o
f Ind
ustr
y, In
nova
tion
and
Scie
nce
Not
es to
and
form
ing
part
of t
he F
inan
cial
Sta
tem
ents
4.2.
Adm
inis
tere
d –
Non
-Fin
anci
al A
sset
s N
ote
4.2A
: Rec
onci
liatio
n of
the
Ope
ning
and
Clo
sing
Bal
ance
s of
Pro
pert
y, P
lant
and
Equ
ipm
ent a
nd In
tang
ible
s 20
17
Leas
ehol
d im
prov
emen
ts
Oth
er p
rope
rty,
pl
ant &
eq
uipm
ent
Com
pute
rso
ftwar
e in
tern
ally
de
velo
ped
Com
pute
rso
ftwar
e pu
rcha
sed
Tota
l $’
000
$’00
0 $’
000
$’00
0 $’
000
As
at 1
Jul
y 20
16
Gro
ss b
ook
valu
e 29
9 44
5 7,
157
2,08
3 9,
984
Wor
k in
Pro
gres
s -
1943
5 -
454
Acc
umul
ated
dep
reci
atio
n, a
mor
tisat
ion
and
impa
irmen
t (6
8)(1
40)
(2,9
21)
(2,0
83)
(5,2
12)
Tota
l as
at 1
Jul
y 20
16
231
324
4,67
1 -
5,22
6
Add
ition
s 68
2914
7-
244
Rev
alua
tions
and
impa
irmen
ts re
cogn
ised
in o
ther
com
preh
ensi
ve in
com
e (2
9)
--
(29)
D
epre
ciat
ion/
Am
ortis
atio
n (7
8)(1
56)
(993
) -
(1,2
27)
Tota
l as
at 3
0 Ju
ne 2
017
192
1
97
3,8
25
-4,
214
Tota
l as
at 3
0 Ju
ne 2
017
repr
esen
ted
by:
Gro
ss b
ook
valu
e 19
2 49
3 7,
593
2,08
3 10
,361
W
ork
in p
rogr
ess
--
146
-14
6A
ccum
ulat
ed d
epre
ciat
ion,
am
ortis
atio
n an
d im
pairm
ent
-(2
96)
(3,9
14)
(2,0
83)
(6,2
93)
Tota
l as
at 3
0 Ju
ne 2
017
192
1
97
3,8
25
-4,
214
Rev
alua
tions
of n
on-fi
nanc
ial a
sset
s
All
reva
luat
ions
wer
e co
nduc
ted
in a
ccor
danc
e w
ith th
e re
valu
atio
n po
licy.
A re
valu
atio
n w
as c
ondu
cted
as
at 3
0 Ju
ne 2
017
for l
ease
hold
impr
ovem
ents
by
an in
depe
nden
t val
uer.
Con
trac
tual
com
mitm
ents
for t
he a
cqui
sitio
n of
pro
pert
y, p
lant
, equ
ipm
ent a
nd in
tang
ible
ass
ets
Cap
ital c
omm
itmen
ts to
tallin
g $0
.4 m
illion
(201
5-16
:$1.
4 m
illion
) rel
ated
prim
arily
to th
e de
velo
pmen
t of t
he N
atio
nal O
ffsho
re P
etro
leum
Titl
es A
dmin
istra
tor (
NO
PTA
) - C
ontin
uatio
n of
N
atio
nal E
lect
roni
c A
ppro
vals
Tra
ckin
g S
yste
m (N
EA
TS) a
nd a
re p
ayab
le w
ithin
12
mon
ths.

87
CHAPTER FOUR · Departmental financial statements
Department of Industry, Innovation and Science Notes to and forming part of the Financial Statements
Accounting Policy
Administered Property, Plant and Equipment
The department manages on behalf of the Australian Government assets held by the National Offshore Petroleum Titles Administrator (NOPTA), a statutory position established under section 695A of the Offshore Petroleum and Greenhouse Gas Storage Act 2006.
Administered intangibles
The department manages intangible assets relating to programmes that are delivered by the department on behalf of the Australian Government as follows:
• Syntroleum Technology – a licence utilising Gas-to-Liquids technology. This asset was recognised at cost and wasamortised on a straight-line basis over the term of the licence (15 years). As at reporting date this asset is now fullyamortised.
• The National Electronic Approvals Tracking System (NEATS) software – a public portal which provides access topublicly available information concerning offshore petroleum titles and applications.

88
CHAPTER FOUR · Departmental financial statements
Department of Industry, Innovation and Science Notes to and forming part of the Financial Statements
4.3. Administered – Payables 2017 2016 $'000 $'000
Note 4.3A: Suppliers Trade creditors and accruals 12,523 11,735 Total suppliers 12,523 11,735
Settlement is usually made within 30 days.
Note 4.3B: Subsidies Subsidies in connection with
Assistance to industry 38,559 53,419 Total subsidies 38,559 53,419
All subsidies are payable to external parties.
Note 4.3C: Grants Non-profit organisations 41,427 40,111 Other 3,143 8,579
Total grants 44,570 48,690
Settlement is usually made according to the terms and conditions of each grant. This is usually within 30 days of performance or eligibility.

89
CHAPTER FOUR · Departmental financial statements
Department of Industry, Innovation and Science Notes to and forming part of the Financial Statements
5. FundingThis section identifies the department’s funding structure.
5.1. Appropriations Note 5.1A: Annual Appropriations ('Recoverable GST exclusive')
2017 2016 $'000 $'000
Departmental Ordinary annual services
Annual Appropriation3 392,210 399,627 PGPA Act - Section 74 receipts 76,536 67,855 PGPA Act - Section 75 transfers (26,350) 578
Total 442,396 468,060 Appropriation applied (current and previous years) 467,570 452,218 Variance (25,174) 15,842
Capital Budget1
Annual Appropriation 28,938 28,469 PGPA - Section 75 transfers of PGPA Act (50) -
Total 28,888 28,469 Appropriation applied (current and previous years) 29,697 28,866 Variance (809) (397)
Other services Equity Injection 4,880 35,369 Appropriation applied (current and previous years) 10,057 34,288 Variance (5,177) 1,081
Administered Ordinary annual services
Administered items3 572,126 848,124 PGPA Act - Section 75 transfers (2,548) (179,988) Payments to corporate Commonwealth entities 1,020,264 947,464
Total 1,589,842 1,615,600Appropriation applied (current and previous years) 1,555,708 1,455,419Variance2 34,134 160,181
Other Services Administered assets and liabilities 28,938 30,938 Payments to corporate Commonwealth entities 38,841 35,916
Total 67,779 66,854 Appropriation applied (current and previous years) 62,894 54,363 Variance2 4,885 12,491
Notes:
1. Departmental Capital Budgets are appropriated through Appropriation Acts (No.1,3,5). They form part of ordinaryannual services, and are not separately identified in the Appropriation Acts.
2. Administered variances are due to drawdowns against prior year appropriations and undrawn current yearappropriations.
3. Section 51 quarantines in 2016-17: Departmental: $0.02 million against 2016-17 annual appropriations; andAdministered: $13.90 million against 2016-17 annual appropriations and an additional $67.44 million against 2015-16 annual appropriations.
4. No other entities spend money from the CRF on behalf of the department.

90
CHAPTER FOUR · Departmental financial statements
Department of Industry, Innovation and Science Notes to and forming part of the Financial Statements
Note 5.1B: Unspent Annual Appropriations ('Recoverable GST exclusive') 2017 2016 $'000 $'000
Departmental Appropriation Act 2 2012-13 224 224Appropriation Act 1 2013-14 1,414 1,414Appropriation Act 4 2013-14 2,809 2,809Appropriation Act 1 2014-15 422 422Appropriation Act 2 2014-15 222 4,649Appropriation Act 1 2015-16 297 88,897 Appropriation Act 1 2015-16 DCB - 2,269Appropriation Act 2 2015-16 19,207 30,651Appropriation Act 4 2015-16 2,857 2,857Appropriation Act 1 2015-16 Cash - 2,583Appropriation Act 1 2016-17 64,135 - Appropriation Act 1 2016-17 Cash 1,874 - Appropriation Act 1 2016-17 DCB 1,460 - Supply Act 2 2016-17 1,778 - Appropriation Act 2 2016-17 454 - Appropriation Act 4 2016-17 313 -
Total departmental 97,466 136,775 Administered
Appropriation Act 1 2012-13 61,487 61,487 Appropriation Act 2 2012-13 13,191 13,191 Appropriation Act 3 2012-13 4 4Appropriation Act 4 2012-13 3,450 3,450 Appropriation Act 1 2013-14 29,365 29,365 Appropriation Act 2 2013-14 7,308 12,308 Appropriation Act 4 2013-14 53,241 53,267 Appropriation Act 1 2014-15 425,371 425,371 Appropriation Act 1 2015-16 148,846 184,951 Appropriation Act 2 2015-16 10,299 29,326 Appropriation Act 3 2015-16 10,246 13,155 Supply Act 2 2016-17 12,058 - Appropriation Act 1 2016-17 44,550 - Appropriation Act 2 2016-17 16,880 - Appropriation Act 3 2016-17 28,598 -
Total administered 864,894 825,875
The above balances include appropriations withheld under section 51 of the PGPA Act, which constitutes a permanent loss of control as well as temporarily quarantined amounts, as these have not been formally reduced by law prior to 30 June 2017.
From 2014-15, each Appropriation Act includes an automatic repeal clause, whereby the Act will be extinguished as at the date specified in that Act. The Appropriation Acts for the 2012-13 and 2013-14 do not include this specific clause and are expected to be reduced through an omnibus repeal bill. Although balances reported for these years remain legally available, they are unavailable for the department to use.
Departmental appropriations reduced under section 51: Appropriation Act 1 2016-17 by $0.02 million; Appropriation Act 2 2015-16 by $0.45 million; Appropriation Act 1 2014-15 by $0.42 million; Appropriation Act 2 2014-15 by $0.22 million.
Administered appropriations reduced under section 51: Appropriation Act 1 2016-17 by $13.90 million; Appropriation Act 1 2015-16 by $129.86 million; Appropriation Act 3 2015-16 by $9.32 million; Appropriation Act 1 2014-15 by $412.92 million; Appropriation Act 2 2013-14 by $4.95 million.

91
CHAPTER FOUR · Departmental financial statements
Department of Industry, Innovation and Science Notes to and forming part of the Financial Statements
Note 5.1C: Disclosure by Agent in Relation to Annual and Special Appropriations ('Recoverable GST exclusive')
Attorney-Generals
Department of Health
Department of Defence
ARENA
2017 2017 2017 2016 $'000 $'000 $'000 $'000
Total receipts 506 - - - Total payments 126,665 9,737 342 5,979
Note 5.1D: Special Appropriations Applied ('Recoverable GST exclusive')
Authority
Appropriation applied 2017 2016 $'000 $'000
Textile, Clothing and Footwear Strategic Investment Program Act 1999 - 21,325
Automotive Transformation Scheme Act 2009 1 170,355 207,346
Offshore Minerals Act 1994 (Act No. 28 of 1994) - -
Australian Renewable Energy Agency Act 2011 - 14,671
Offshore Petroleum and Greenhouse Gas Storage Act 2006 34,533 28,918
Public Governance, Performance and Accountability Act 2013 s.77 1,092 3,021
Total special appropriation applied 205,980 275,281
1. The total amount of assistance paid in respect of a year must not exceed $300 million.

92
CHAPTER FOUR · Departmental financial statements
Dep
artm
ent o
f Ind
ustr
y, In
nova
tion
and
Scie
nce
Not
es to
and
form
ing
part
of t
he F
inan
cial
Sta
tem
ents
5.2.
Spe
cial
Acc
ount
s N
ote
5.2A
: Spe
cial
Acc
ount
s ('R
ecov
erab
le G
ST e
xclu
sive
') C
lean
Ene
rgy
Initi
ativ
e Sp
ecia
l A
ccou
nt1
Serv
ices
for O
ther
Ent
ities
and
Tru
st
Mon
eys
Acc
ount
2N
atio
nal O
ffsho
re P
etro
leum
Titl
es
Adm
inis
trat
or S
peci
al A
ccou
nt3
2017
20
16
2017
20
16
2017
20
16
$'00
0 $'
000
$'00
0 $'
000
$'00
0 $'
000
Bal
ance
bro
ught
forw
ard
from
pre
viou
s pe
riod
70,9
14
94,5
82
30,0
36
21,9
06
3,96
8 9,
360
Tota
l Inc
reas
es
54,5
10
40,0
79
17,2
09
13,9
42
17,5
91
10,6
59
Ava
ilabl
e fo
r pay
men
ts
125,
424
134,
661
47,2
45
35,8
48
21,5
59
20,0
19
Tota
l adm
inis
tere
d de
crea
ses
71,0
48
63,7
47
25,7
39
5,81
2 14
,932
16
,051
To
tal b
alan
ce c
arrie
d to
the
next
per
iod
54,3
76
70,9
14
21,5
06
30,0
36
6,62
7 3,
968
Bal
ance
repr
esen
ted
by:
Cas
h he
ld in
the
Offi
cial
Pub
lic A
ccou
nt
54,3
76
70,9
14
21,5
06
30,0
36
6,62
73,
968
Tota
l bal
ance
car
ried
to th
e ne
xt p
erio
d 54
,376
70
,914
21
,506
30
,036
6,
627
3,96
8
Inno
vatio
n, S
cien
ce a
nd T
echn
olog
y –
Don
atio
ns, B
eque
sts
and
Spon
sors
hip
Spec
ial A
ccou
nt4
Aus
tral
ian
Bui
ldin
g C
odes
Boa
rd
Spec
ial A
ccou
nt5
Ran
ger R
ehab
ilita
tion
Spec
ial
Acc
ount
6
2017
20
16
2017
20
16
2017
20
16
$'00
0 $'
000
$'00
0 $'
000
$'00
0 $'
000
Bal
ance
bro
ught
forw
ard
from
pre
viou
s pe
riod
3,53
5 5,
299
9,89
3 10
,319
69
,791
68
,293
To
tal i
ncre
ases
1,
983
999
9,25
48,
409
144,
262
20
8,90
9
Ava
ilabl
e fo
r pay
men
ts
5,51
8 6,
298
19,1
47
18,7
28
214,
053
277,
202
Dec
reas
es
Tota
l dep
artm
enta
l dec
reas
es
3,23
42,
763
9,54
48,
835
- -
Tota
l adm
inis
tere
d sp
ecia
l pub
lic m
oney
dec
reas
es
- -
- -
142,
421
20
7,41
1 To
tal b
alan
ce c
arrie
d to
the
next
per
iod
2,28
4 3,
535
9,60
3 9,
893
71,6
32
69,7
91
Bal
ance
repr
esen
ted
by:
Cas
h he
ld in
ent
ity b
ank
acco
unts
2,
284
3,53
527
926
971
,632
69
,791
C
ash
held
in th
e O
ffici
al P
ublic
Acc
ount
-
- 9,
324
9,62
4 -
- To
tal b
alan
ce c
arrie
d to
the
next
per
iod
2,28
4 3,
535
9,60
3 9,
893
71,6
32
69,7
91
Not
e: C
ompa
rativ
es fo
r the
Ran
ger R
ehab
ilita
tion
Spe
cial
Acc
ount
has
bee
n re
stat
ed to
exc
lude
inte
rest
acc
rued
as
at 3
0 Ju
ne.
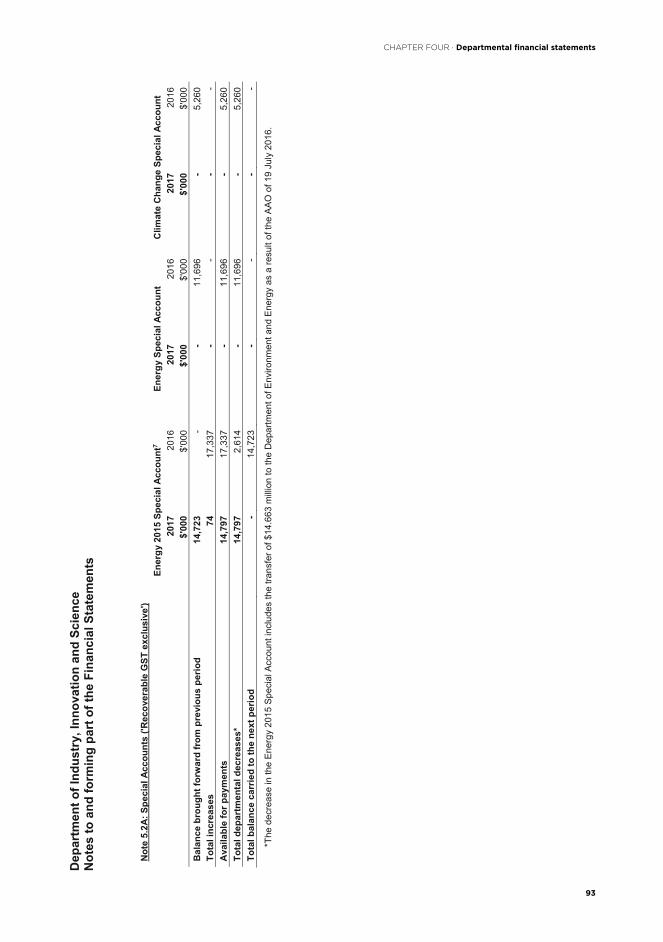
93
CHAPTER FOUR · Departmental financial statements
Dep
artm
ent o
f Ind
ustr
y, In
nova
tion
and
Scie
nce
Not
es to
and
form
ing
part
of t
he F
inan
cial
Sta
tem
ents
Not
e 5.
2A: S
peci
al A
ccou
nts
('Rec
over
able
GST
exc
lusi
ve')
Ener
gy 2
015
Spec
ial A
ccou
nt7
Ener
gy S
peci
al A
ccou
nt
Clim
ate
Cha
nge
Spec
ial A
ccou
nt
2017
20
16
2017
20
16
2017
20
16
$'00
0 $'
000
$'00
0 $'
000
$'00
0 $'
000
Bal
ance
bro
ught
forw
ard
from
pre
viou
s pe
riod
14,7
23
- -
11,6
96
-5,
260
Tota
l inc
reas
es
7417
,337
-
- -
- A
vaila
ble
for p
aym
ents
14
,797
17
,337
-
11,6
96-
5,26
0To
tal d
epar
tmen
tal d
ecre
ases
* 14
,797
2,
614
-11
,696
-5,
260
Tota
l bal
ance
car
ried
to th
e ne
xt p
erio
d -
14,7
23-
--
-
*The
dec
reas
e in
the
Ene
rgy
2015
Spe
cial
Acc
ount
incl
udes
the
trans
fer o
f $14
.663
milli
on to
the
Dep
artm
ent o
f Env
ironm
ent a
nd E
nerg
y as
a re
sult
of th
e A
AO
of 1
9 Ju
ly 2
016.

94
CHAPTER FOUR · Departmental financial statements
Department of Industry, Innovation and Science Notes to and forming part of the Financial Statements
Foot
note
No. Section of
PGPA Act appropriatedunder
Establishing Instrument and Purpose of Special Account
Sunset Date of SpecialAccount Determination
1 78
Determination 2009/21 – Clean Energy Initiative Special Account Establishment 2009, to meet the costs and expenses related to initiatives to support the growth of clean energy generation and new technologies to reduce carbon emissions.
1 October 2019
2 78 Determination 2011/09 – Services for Other Entities and Trust Moneys, toenable the department to continue to hold and expend amounts on behalf of persons or entities other than the Commonwealth.
1 October 2021
3 80 Offshore Petroleum and Greenhouse Gas Storage Act 2006, to meet costs, expenses and other obligations related to the performance of the Titles Administrator’s functions or the exercise of the Titles Administrator’s powers.
N/A
4 78
PGPA Act Determination (Innovation, Science and Technology – Donations, Bequests and Sponsorship Special Account 2016) – Establishment, forexpenditure to conduct activities to promote greater understanding and awareness of science, technology, engineering, mathematics and innovation within the community and to support science education and research which promotes related fields. This is the extension of Determination 2006/40 – Science and Technology Donations/Sponsorship Special Account Establishment 2006 which sunsetted on 1 October 2016. The full balance as at 30 June was invested in an interest bearing bank account.
1 October 2026
5 78
PGPA Act Determination – Establishment of Australian Building Codes Board Special Account 2017, for expenditure towards creating nationally consistent building codes, standards, regulatory requirements and regulatory systems in design, construction and use of buildings. This is the extension of Determination 2006/68 – Australian Building Codes Board Special Account Establishment 2006 which sunsetted on 1 April 2017.
1 April 2027
6 78
PGPA Act Determination – Establishment of Ranger Rehabilitation Special Account 2017, for expenditure relating to the rehabilitation of the ranger project area in accordance with the Ranger Uranium Project Government Agreement (as amended) between the Commonwealth and Energy Resources of Australia Limited, Australian Atomic Energy Commission, Peko-Wallsend Operations Limited and Electrolytic Zinc Company of Australasia Limited. This is the extension of Determination 2006/70 – Ranger Rehabilitation Special Account Establishment 2006 which sunsetted on 1 April 2017. The full balance as at 30 June was invested as a term deposit. Note that this special account is held in trust for the benefit of the Traditional Aboriginal Owners of the Ranger Project Area. This balance does not form part of the financial statements.
1 April 2027
7 78
Determination 2015/07 – Energy Special Account 2015 - Establishment) foractivities that contribute to policy development in the national energy sector. This special account was transferred to the Department of Environment and Energy during 2016-17 as a result of the Administrative Arrangements Order (AAO) of the 19 July 2016.
1 October 2025

95
CHAPTER FOUR · Departmental financial statements
Department of Industry, Innovation and Science Notes to and forming part of the Financial Statements
The department has the National Repository Capital Contribution Fund Special Account established under section 80 of the Public Governance, Performance and Accountability Act 2013. It is for the establishment and operation of a radioactive waste management facility. There had been no transactions debited or credited to it during the current or prior reporting period.
Note that the Fund is to be established after a facility licence that authorises a person to operate the facility is issued under the Australian Radiation Protection and Nuclear Safety Act 1998. This is anticipated to occur around 2020.

96
CHAPTER FOUR · Departmental financial statements
Department of Industry, Innovation and Science Notes to and forming part of the Financial Statements
5.3. Regulatory Charging Summary 2017 2016 $'000 $'000
Note 5.3A: Regulatory Charging Summary Amount applied Departmental1
Annual appropriations 1,308 1,365Administered
Annual appropriations 468 2,307 Total amounts applied 1,776 3,672
ExpensesDepartmental1 2,238 2,310Administered 14,115 16,953
Total expenses 16,353 19,263
Revenue Departmental1 930 945Administered 17,969 13,052
Total revenue 18,899 13,997
No amounts were written off in the current or prior period.
1. The 2015-16 comparatives have been restated and exclude the commercial activities which are classified as non-regulatory under the new Australian Government Charging Framework.
Regulatory charging activities: Departmental Licensing and Appointments (from 2016-17 includes Certification of Licenses activity); and Pattern Approval Laboratory. Documentation - www.measurement.gov.au/Documents/Charging-Arrangements.docx.
Administered National Offshore Petroleum Titles Administrator Fee. Documentation - www.nopta.gov.au/_documents/nopta-cris-2016-17-sept16.pdf
Greenhouse and Energy Minimum Standards National Legislative Framework. This Energy function was transferred to the Department of Environment and Energy as a result of the AAO of the 19 July 2016.

97
CHAPTER FOUR · Departmental financial statements
Department of Industry, Innovation and Science Notes to and forming part of the Financial Statements
6. People and RelationshipsThis section describes a range of employment and post-employment benefits provided to our people.
6.1. Employee Provisions
2017 2016 $'000 $'000
Note 6.1A: Employee Provisions Leave 83,507 94,039 Separations and redundancies 2,344 4,824 Total employee provisions 85,851 98,863
Note 6.1B: Administered - Employee Provisions Leave 1,875 1,519 Total employee provisions 1,875 1,519
Accounting Policy
Liabilities for ‘short-term employee benefits’ and termination benefits expected to be wholly settled within twelve months of the end of reporting period are measured at their nominal amounts. The nominal amount is calculated with regard to the rates expected to be paid on settlement of the liability.
Other long-term employee benefits are measured as net total of the present value of the defined benefit obligation at the end of the reporting period.
Leave
The liability for employee benefits includes provisions for annual leave and long service leave.
The leave liabilities are calculated on the basis of employees’ remuneration at the estimated salary rates that will be applied at the time the leave is taken, including the department’s employee superannuation contribution rates to the extent that leave is likely to be taken during service rather than paid out on termination.
The liability for long service leave has been determined by reference to the work of an actuary as at 30 June 2017 and management assessments relating to salary growth rates. The estimate of the present value of the liability takes into account attrition rates and pay increases through promotion and inflation.
Separation and Redundancy
The department recognises a provision for termination when it has developed a detailed formal plan for the terminations and has informed those employees affected that it will carry out the terminations.
Superannuation
The department’s staff are members of the Commonwealth Superannuation Scheme (CSS), the Public Sector Superannuation Scheme (PSS), the PSS accumulation plan (PSSap), the Australian Government Employees Superannuation Trust (AGEST) or non-government superannuation funds.
The CSS and PSS are defined benefit schemes for the Australian Government. The PSSap, AGEST and other non- government superannuation funds are defined contribution schemes.
The liability for the defined benefits is recognised in the financial statements of the Australian Government and is settled by the Australian Government in due course. This liability is reported in the Department of Finance’s administered schedules and notes.
The department makes employer contributions to the employees’ superannuation scheme at rates determined by an actuary to be sufficient to meet the current cost to the Australian Government. The department accounts for the contributions as if they were contributions to defined contribution plans.
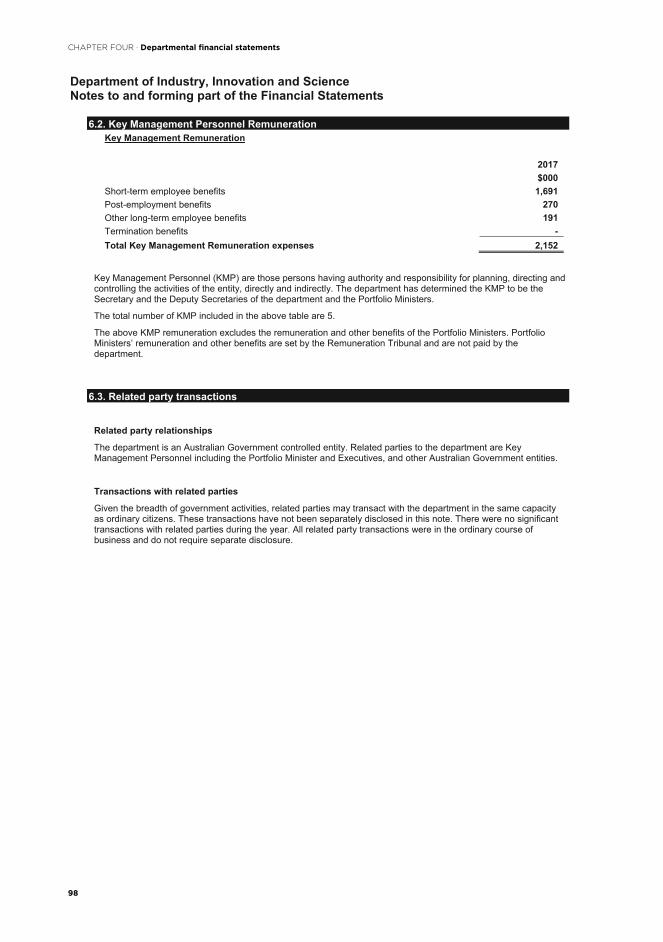
98
CHAPTER FOUR · Departmental financial statements
Department of Industry, Innovation and Science Notes to and forming part of the Financial Statements
6.2. Key Management Personnel Remuneration Key Management Remuneration
2017 $000
Short-term employee benefits 1,691Post-employment benefits 270Other long-term employee benefits 191Termination benefits - Total Key Management Remuneration expenses 2,152
Key Management Personnel (KMP) are those persons having authority and responsibility for planning, directing and controlling the activities of the entity, directly and indirectly. The department has determined the KMP to be the Secretary and the Deputy Secretaries of the department and the Portfolio Ministers.
The total number of KMP included in the above table are 5.
The above KMP remuneration excludes the remuneration and other benefits of the Portfolio Ministers. Portfolio Ministers’ remuneration and other benefits are set by the Remuneration Tribunal and are not paid by the department.
6.3. Related party transactions
Related party relationships
The department is an Australian Government controlled entity. Related parties to the department are Key Management Personnel including the Portfolio Minister and Executives, and other Australian Government entities.
Transactions with related parties
Given the breadth of government activities, related parties may transact with the department in the same capacity as ordinary citizens. These transactions have not been separately disclosed in this note. There were no significant transactions with related parties during the year. All related party transactions were in the ordinary course of business and do not require separate disclosure.

99
CHAPTER FOUR · Departmental financial statements
Department of Industry, Innovation and Science Notes to and forming part of the Financial Statements
7. Managing UncertaintiesThis section analyses how the department manages financial risks within its operating environment.
7.1. Financial Instruments
2017 2016 $'000 $'000
Note 7.1A: Categories of Financial Instruments Financial Assets
Cash and cash equivalents 13,761 6,386Trade and other receivables 7,931 8,657Accrued revenue 3,394 2,186
Total loans and receivables 25,086 17,229 Total financial assets 25,086 17,229
Financial Liabilities Suppliers 17,662 20,040 Grants payable 270 1,177Other payables 11,633 14,579
Total financial liabilities measured at amortised cost 29,565 35,796 Total financial liabilities 29,565 35,796
Note 7.1B: Net Gains or Losses
The net gains/losses on financial instruments is immaterial.
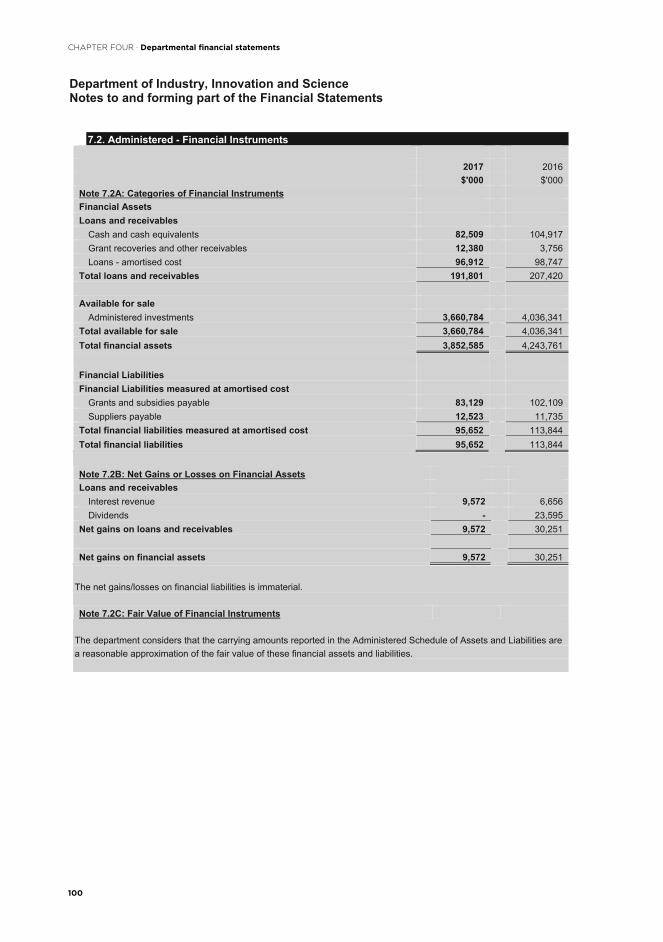
100
CHAPTER FOUR · Departmental financial statements
Department of Industry, Innovation and Science Notes to and forming part of the Financial Statements
7.2. Administered - Financial Instruments
2017 2016 $'000 $'000
Note 7.2A: Categories of Financial Instruments Financial Assets Loans and receivables
Cash and cash equivalents 82,509 104,917 Grant recoveries and other receivables 12,380 3,756Loans - amortised cost 96,912 98,747
Total loans and receivables 191,801 207,420
Available for sale Administered investments 3,660,784 4,036,341
Total available for sale 3,660,784 4,036,341Total financial assets 3,852,585 4,243,761
Financial Liabilities Financial Liabilities measured at amortised cost
Grants and subsidies payable 83,129 102,109 Suppliers payable 12,523 11,735
Total financial liabilities measured at amortised cost 95,652 113,844 Total financial liabilities 95,652 113,844
Note 7.2B: Net Gains or Losses on Financial Assets Loans and receivables
Interest revenue 9,572 6,656Dividends - 23,595
Net gains on loans and receivables 9,572 30,251
Net gains on financial assets 9,572 30,251
The net gains/losses on financial liabilities is immaterial.
Note 7.2C: Fair Value of Financial Instruments
The department considers that the carrying amounts reported in the Administered Schedule of Assets and Liabilities are a reasonable approximation of the fair value of these financial assets and liabilities.

101
CHAPTER FOUR · Departmental financial statements
Department of Industry, Innovation and Science Notes to and forming part of the Financial Statements
Note 7.2D: Credit Risk
The department is exposed to credit risk through its financial assets of loans and other receivables. The maximum exposure to credit risk arises from potential default of a debtor. The carrying amount of loans and other receivables, net of impairment losses, represents the department's maximum exposure to credit risk.
Credit quality of financial assets not past due or individually determined as impaired (gross) Not past due nor
impaired
Not past due nor
impaired
Past due or
impaired
Pastdue or
impaired Total Total2017 2016 2017 2016 2017 2016 $'000 $'000 $'000 $'000 $'000 $'000
Grant recoveries and other receivables 9,640 2,382 15,186 15,284 24,826 17,666 Loans - amortised cost 96,912 98,747 831 975 97,743 99,722 Loans - available for sale - IIF - - - 40,447 - 40,447
Total 106,552 101,129 16,017 56,706 122,569 157,835
Ageing of financial assets that were past due but not impaired in 2017 0 to 30 31 to 60 60+
days days days Total $'000 $'000 $'000 $'000
Grant recoveries and other receivables 683 - 2,057 2,740Total 683 - 2,057 2,740
Ageing of financial assets that were past due but not impaired in 2016 0 to 30 31 to 60 60+
days days days Total $'000 $'000 $'000 $'000
Grant recoveries and other receivables 10 1,136 228 1,374Total 10 1,136 228 1,374
Note 7.2E: Liquidity Risk
The majority of the department's administered financial liabilities are grants and subsidies payable. The exposure to liquidity risk is based on the notion that the department will encounter difficulty in meeting its obligations associated with administered financial liabilities. This is highly unlikely due to appropriation funding mechanisms available to the department and internal policies and procedures to ensure appropriate resources exist to meet any financial obligations.
Note 7.2F: Market Risk
The department's exposure to interest rate risk is primarily from its loans (at amortised cost). Interest rate risk refers to the risk that the fair value of future cash flows of a financial instrument will fluctuate because of changes in market interest rates. However, the effect on profit and loss is assessed as immaterial given the low value of these financial instruments as at 30 June 2017.
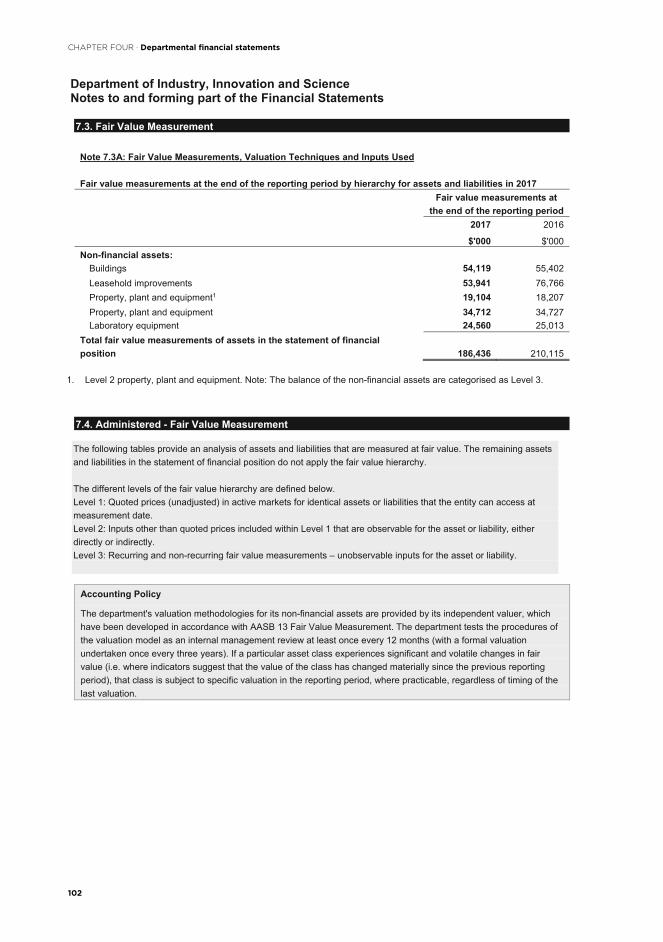
102
CHAPTER FOUR · Departmental financial statements
Department of Industry, Innovation and Science Notes to and forming part of the Financial Statements
7.3. Fair Value Measurement
Note 7.3A: Fair Value Measurements, Valuation Techniques and Inputs Used
Fair value measurements at the end of the reporting period by hierarchy for assets and liabilities in 2017 Fair value measurements at
the end of the reporting period 2017 2016
$'000 $'000 Non-financial assets:
Buildings 54,119 55,402 Leasehold improvements 53,941 76,766 Property, plant and equipment1 19,104 18,207 Property, plant and equipment 34,712 34,727 Laboratory equipment 24,560 25,013
Total fair value measurements of assets in the statement of financial position 186,436 210,115
1. Level 2 property, plant and equipment. Note: The balance of the non-financial assets are categorised as Level 3.
7.4. Administered - Fair Value Measurement
The following tables provide an analysis of assets and liabilities that are measured at fair value. The remaining assets and liabilities in the statement of financial position do not apply the fair value hierarchy.
The different levels of the fair value hierarchy are defined below. Level 1: Quoted prices (unadjusted) in active markets for identical assets or liabilities that the entity can access at measurement date. Level 2: Inputs other than quoted prices included within Level 1 that are observable for the asset or liability, either directly or indirectly. Level 3: Recurring and non-recurring fair value measurements – unobservable inputs for the asset or liability.
Accounting Policy
The department's valuation methodologies for its non-financial assets are provided by its independent valuer, which have been developed in accordance with AASB 13 Fair Value Measurement. The department tests the procedures of the valuation model as an internal management review at least once every 12 months (with a formal valuation undertaken once every three years). If a particular asset class experiences significant and volatile changes in fair value (i.e. where indicators suggest that the value of the class has changed materially since the previous reporting period), that class is subject to specific valuation in the reporting period, where practicable, regardless of timing of the last valuation.

103
CHAPTER FOUR · Departmental financial statements
Department of Industry, Innovation and Science Notes to and forming part of the Financial Statements
Note 7.4A: Administered Fair Value Measurements, Valuation Technique and Inputs Used
Fair value measurements at the end of the reporting period by hierarchy for assets and liabilities
Fair value measurements at the end of the reporting period
For Levels 2 and 3 fair value measurements
Category (Level 1, 2,
or 3)
Valuation technique(s)
2017 2016 $'000 $'000 $'000 $'000
Financial assets: Other investments - Snowy Hydro Ltd1 - 540,000 Level 2 IncomeOther investments - Other 3,660,784 3,496,341 Level 3 CostTotal financial assets 3,660,784 4,036,341
Non-financial assets: Property, plant and equipment2 197 324 Level 2 Market Approach Leasehold Improvements 192 231 Level 3 Depreciated
replacement cost Total non-financial assets 389 555
Total fair value measurements of assets in the administered schedule of assets and liabilities 3,661,173 4,036,896
For the following level 2 measurements, the inputs used are as follows: 1. Operating results to estimate future earnings; and2. Prices derived from observed transactions of similar equipment
Note 7.4B: Administered Reconciliation for Recurring Level 3 Fair Value Measurements
Recurring Level 3 fair value measurements - reconciliation
2017 2016 $'000 $'000
Opening balance 3,496,572 3,612,020Total gains/(losses) recognised in other comprehensive income 114,515 (103,158) (Disposals)/ Additions (including Restructuring) - (34,838)Issues 62,937 54,392 Settlements (12,970) (31,776) Depreciation (78) (68)Closing balance 3,660,976 3,496,572Changes in unrealised gains/(losses) recognised in net cost of services for assets held at the end of the reporting period - -

104
CHAPTER FOUR · Departmental financial statements
Department of Industry, Innovation and Science Notes to and forming part of the Financial Statements
8. Other InformationThis section provides other disclosures relevant to the department’s financial environment for the year.
8.1. Restructuring
As a result of the AAO of 19 July 2016 the Energy function was relinquished to the Department of Environment and Energy.
As a result of the AAO of 21 September 2015 the Australian Renewable Energy Agency (ARENA) function was relinquished to the Department of Environment and the following functions were assumed during 2015-16:
1. The Digital Economy function from the Department of Communications and the Arts, involving only the transferof departmental assets and liabilities.
2. The Office of Northern Australia function from the Department of Infrastructure and Regional Development,involving only the transfer of departmental assets and liabilities.
Note 8.1A: Departmental Restructuring
ASSUMED RELINQUISHED2017 2016 2016 2017 2016
Digital Economy1
Office of Northern
Australia2
Energy ARENA
Department of Communications
and the Arts
Department of Infrastructureand Regional Development
Departmentof
Environment and Energy
Departmentof
Environment
$'000 $'000 $'000 $'000 $'000 FUNCTIONSASSUMED/RELINQUISHED Assets relinquished
Appropriation receivables - 540 296 8,150 1,453Special accounts - - - 14,663 - Trade receivables - - - 74 - Intangibles - - - 492 -
Total assets assumed/relinquished - 540 296 23,379 1,453 Liabilities assumed/relinquished
Employee provisions - 554 296 8,150 1,453Unearned revenue - - - 1,057 - Payables - - - 267 -
Total liabilities assumed/relinquished - 554 296 9,474 1,453 Net assets/(liabilities) assumed/relinquished - (14) - 13,905 -Income assumed Recognised by the receiving entity - 5,202 2,934Recognised by the losing entity - 813 590Total income assumed - 6,015 3,524 Expenses assumed Recognised by the receiving entity - 5,202 2,934Recognised by the losing entity - 813 590Total expenses assumed - 6,015 3,524
In respect of functions assumed, the net book values of assets and liabilities were transferred to the entity for no consideration.

105
CHAPTER FOUR · Departmental financial statements
Department of Industry, Innovation and Science Notes to and forming part of the Financial Statements
Note 8.1B: Administered Restructuring
ASSUMED RELINQUISHED2017 2016 2017 2016
Digital Economy1 Energy ARENA
Department of Communications
and the Arts
Department of Environment
and Energy Department of
Environment
$'000 $'000 $'000 $'000 FUNCTIONS RELINQUISHED Assets relinquished
Investments - - 540,000 34,838 Total assets relinquished - - 540,000 34,838 Net assets relinquished - - 540,000 34,838 Expenses assumed
Recognised by the receiving entity - 2,147Recognised by the losing entity - 1,562
Total expenses assumed - 3,709

106
CHAPTER FOUR · Departmental financial statements