chapter-iii - shodhgangashodhganga.inflibnet.ac.in/bitstream/10603/23398/11/11_chapter...
TRANSCRIPT

CHAPTER-III
NATURE-BASED TOURISM IN OOTY:
A MICROSCOPIC PERSPECTIVE
70
CHAPTER-III
NATURE-BASED TOURISM IN OOTY: A MICROSCOPIC
PERSPECTIVE
3.1. Introduction
Tamil Nadu is a land of magnificent ancient temples exhibiting the glorious
history and tradition of Dravidian art and culture. The State is not only famous for the
Hindu temples but also is gifted with churches and mosques signifying inherent
secularism of the land. Varied colorful fairs and festivals across the length and breadth
of the State demonstrate the cultural richness and diversity. Along with other tourism
attractions, various forms of nature tourism have made added appeal to the total tourism
landscape of the State. Major constituents of nature tourism include wildlife and bird
sanctuaries, national parks, forests, mountains, hill stations, natural scenery, spring
water and waterfalls. Possessing the enchanting tourism attractions and world-class
infrastructure at the selected destinations, the culture-rich state have made significant
progress in the tourism front, whether it is cultural tourism or nature tourism, the
government has left no stone unturned in strengthening the infrastructure and
superstructure for optimizing the prospect of leisure, business and VFR tourism. Tamil
Nadu has been one of the largest gateways to South-Indian states and most of the
organized tours get originated from Tamil Nadu, more importantly from Chennai. Over
and above, the Chettinad cuisine along with the South Indian breakfast and shopping
enriches the experience of the visitors and makes them remember and recollect their
experience for forever. Above all, people are friendly, peaceful, helpful, cultured,
enterprising and god-fearing. The chapter presents the microscopic overview of nature-
based tourism and other supporting facts and figures pertaining to the carrying capacity

71
and community participation in Ooty or Udhagamandalam. The places of tourist
interest of Tamil Nadu are given in Annexure VI for further reference.
Tamil Nadu has a multitude of tourist attractions: beaches, hill stations,
waterfalls, wildlife, religious centers, spiritual retreats, art, culture, architecture, crafts,
heritage, monuments, etc. enchanting and mesmerizing tourists. The Zero-Tolerant
Tourism Policy has been implemented to help protect and present the rich socio-
cultural values and customs to the visitors with an objective of offering novelty. The
paradigm of quality tourism is being maintained with the strict adherence to the
guidelines of tourism policy. Moreover, Tamil Nadu is now ranked as a second major
attracting destination across Indian States in attracting both domestic and foreign
tourists for various attractions. Last four years, tourist arrivals have registered more
than 20 per cent annual growth (Tamilnadu State Government Tourism Policy Note,
2009-10, Government of Tamil Nadu). The Niligiri District Map is given in Annexure
V.
3.2. Geographical Location of Tamil Nadu
The southernmost State of India is surrounded by one of the oldest mountain
ranges in one side and by the Bay of Bengal in other side. Total area of the state is
about 13,00,583 sq.km. The State is located in the hemisphere between 8º N and 13º N
latitude and between 78º E and 80º E longitude. The climate is temperate as well as
moderate throughout the year. However, April, May and June are the hottest months,
whereas December, January and February are the months giving mild cold in the
coastal districts and frightening cold in the hilly and mountainous regions like Ooty,
Kodiakanal, Yercaud, Hogenkkal, etc. Temperature goes up as maximum as 43º C and
as minimum as 18º C during the summer and winter months respectively. The State

72
receives rainfall from the return of northeastern monsoon during November-December.
The most precipitation is reported in the Niligiris and other hill areas. The annual
rainfall ranges between 25 and 75 inches. As per the 2011 population census, the State
has 6, 24, 05679 population with a growth of three per cent.
3.3. Enchanting Tamil Nadu
The captivating tourism places may be broadly divided into five broad
categories of attractions.
Scenic beauty such as hill stations, water bodies, wildlife sanctuaries and
beaches
Religious and Heritage locations( including temples, historical monuments
and heritage villages)
Fairs and Festivals
Adventure sports
MICE ( Meeting, Incentives, Convention and Exhibitions)
Enchanting Tamil Nadu has been the tagline for several years and it has created
a brand for herself at the source markets. The State has taken advantage of the
diversified attractions along with well-developed facilities and amenities. Out of all the
attractions, the natural scenic beauty along with activities has become a principal
attraction in Tamil Nadu. TABLE 3. 1 presents the nature-based tourism attractions and
their locations along with their main activities.

73
TABLE 3. 1
Major Nature-Based Tourism Attractions
Nature-Based
Tourism Hotspots Nature-Based Tourism Activities
Identified Spots
Ooty
Trekking, Hill Train & Mountaineering Mettupalayam to Ooty
Cycling & Biking Ooty and Mudumalai
Camping &Wildlife Mudumalai, Naduvattam
& Upper Bhavani and
Kundha
Horse Riding Ooty and Coonoor
Nature Walk, Boating & Swimming Pykara Waterfalls, and
Kalhatti Waterfalls
Kodaikanal Trekking, Mountaineering & Camping Kodai Road to
Kodaikanal
Yercaud Paragliding, Parasailing & Trekking Yercaud
Elagiri Boating, Trekking & Swimming Elagiri
Coonoor Natural Walk, Trekking & Mountain
Rail
Coonoor, Sim’s Park and
Cantonment
Mudumalai Wildlife & Watching Flora & Fauna Mudumalai & Wildlife
Sanctuary Source: Official Records, Department of Tourism, Government of Tamil Nadu, 2011
3.4. Tourist Arrivals to Tamil Nadu
TABLE 3.2 exhibits the tourist arrivals to Tamil Nadu from 2000 to 2010 (both
domestic and foreign tourist). Domestic Tourist Arrivals (DTAs) in Tamil Nadu
increased from 22.98 million in 2000 to 30.07 million in 2004, which shows 30. 83 per
cent growth during the same period. In 2005, the DTAs were 32.39 million and it
increased 103.01 million in 2010. The second phase witnessed 70.61 million DTAs,
that is around 2.17 times more in the State. The overall increase of DTAs to Tamil
Nadu between 2000 to 2010 was 80.21 million that is 3.48 times more in a gap of 11
years. The growth of DTAs is reported to be very significant and remarkable as
compared to other states in India. Several factors are explicitly responsible for the
growth of DTAs in the State. These factors comprise the air and train connectivity,
opening of more hotels, effect of advertisement and publicity, long peak season period

74
and more gateway cities to South India. Apart from these common factors attributed to
the phenomenal growth of DTAs, other genuine factors are also associated with the
unique attractions to help rise in tourist arrivals. Tamil Nadu attracts a large number of
religious tourists for Velankani and Nagore as two holy places for Christian and
Muslim population. Since Chennai is a metro city with enormous business activity,
business tourism has emerged as a vibrant form of attraction and it adds to the growth
of total DTAs. The nature-tourism places of interest also constitute the major share of
DTAs in the State.
Total number of Foreign Tourist Arrivals (FTAs) in Tamil Nadu increased from
0.77 million in 2000 to 1.05 million in 2004 that shows a growth of 35.98 per cent. At
the same time, it increased from 1.18 million in 2005 to 2.8 million in 2010. The FTAs
from 2005 to 2010 has registered a growth of 1.37 times more. The final report on 20-
year perspective of tourism plan for the state of Tamil Nadu in 2003 has projected that
the state is expected to receive around 151.26 million in the domestic tourists and 2.14
million foreign tourists by 2020. Thus, Tamil Nadu will be becoming an important
tourism hub in India in the next 10 years. The State has two international airports at
Chennai and Trichy along with other international airports like Hyderabad, Bangalore,
Trivandrum and Cochin in the neighbouring states for the foreign tourists to prefer to
land to Tamil Nadu. Further, the air connectivity with these airports can make tourists
access to any South Indian States by taking the train or luxury bus services to reach at
important places of tourist interest in Tamil Nadu. Another important factor responsible
for the growth of FTAs is the world-class hotels and international hotel chains in major
cities and tourism destinations.

75
Despite the economic slowdown coupled with huge job loss, the annual growth
of DTAs is single digit from 2000 to 2003, whereas it is double digit growth ranging
from 11.16 per cent in 2004 to 33.14 per cent in 2010, excepting the year 2007, that is
7.51 per cent. The annual growth of FTAs has witnessed a single digit in 2002 and
there was a decline of -01.65 per cent growth of FTAs in 2001. The downfall could be
attributed to the several socio-economic risk factors, importantly, the political turmoil
in Indo-Pak border, the World Trade Center (WTC) Attack followed by the USA and
the UK’s military attack on Afghanistan and Iraq. It is quite astonished to see that the
annual growth of FTAs registered double digit growth from 2000 to 2010.
Contrastingly, the total year-wise growth of tourist arrivals in the State has reported
double digit, excepting 2002, 2003 and 2005. Furthermore, the growth of total tourist
arrivals has registered 29.71 per cent in 2010. The trend of the tourist arrivals has
clearly stated that there has been growth in the first decade of the new millennium or
the second phase of the liberalized economy of India. Especially, the growth from
2007 to 2010 has been remarkable, and the extraordinary growth indicates the diverse
tourism activities following the movement of tourists across the places of interest.
Certainly, tourism industry is all set in Tamil Nadu to be a giant contributor of State
Gross Domestic Product (SGDP).

76
TABLE 3.2
Total Tourist Arrivals to Tamil Nadu (in Millions)
Year DTAs %
Growth FTAs
%
Growth Total
%
Growth
2000 22.98 0.78 30.84
2001 23.81 03.61 0.77 -01.65 31.54 02.26
2002 24.66 03.56 0.8 04.13 32.71 03.70
2003 27.05 09.69 0.9 12.04 36.07 10.27
2004 30.07 11.16 1.05 17.29 40.65 12.69
2005 32.33 07.51 1.18 11.43 44.12 08.53
2006 39.21 21.28 1.36 13.23 52.56 19.12
2007 50.64 29.15 1.74 31.31 68.17 29.69
2008 62.61 23.63 2.04 16.37 83.01 21.76
2009 78.03 24.62 2.37 16.12 101.72 22.53
2010 103.90 33.14 2.8 4.99 131.95 29.71 Source: Official Record, Department of Tourism, Government of Tamil Nadu (2010-2011) and The
Hindu Online Edition, February 16, 2011.
TABLE 3.3 exhibits that the FTAs to Tamil Nadu form 2000-2010 from the ten
lead countries in the world. Among the ten counties, Malaysia got the first position
that is followed by the UK, Australia, Sri Lank, the USA, Italy, France, Japan and
Germany in 2010. When the order of the rank of these 10 lead countries is compared in
2010, it shows the rank of the first four countries like Malaysia, UK, Australia and Sri
Lank are unchanged. However, the fifth-rank country USA in 2000 has been replaced
by Italy. The remaining leading source countries for FTAs to Tamil Nadu are ranked in
the same order in 2010 as they were in the same order in 2000. It is pertinent to find the
sustained rate of increase in the arrivals of Malaysian and Sri Lank nationals over a
period of 11 years. These two countries are the major overseas source market for the
State. It is found from the data that there might be major constituent of Visiting Friends
and Relatives (VFR) since sizable Tamil speaking populations live in these two
countries.

77
TABLE 3.3
Foreign Tourist Arrivals from Top Ten Source Countries to Tamil Nadu ( in Millions)
Counties 2000 2001 2002 2003 2004 2005 2006 2007 2008 2009 2010
Malaysia 0.178 0195 0.180 0.216 0.254 0.291 0.321 0.398 0.630 0.650 0.661
UK 0.178 0.148 0.156 0.179 0.213 0.234 0.273 0.360 0.384 0.404 0.412
Australia 0.108 0.107 0.107 0.112 0.137 0.150 0.167 0.222 0.229 0.230 0.251
Sri Lanka 0.082 0.082 0.090 0.093 0.097 0.100 0.108 0.160 0.159 0.169 0.178
USA 0.069 0.066 0.055 0.063 0.075 0.087 0.094 0.127 0.125 0.134 0.149
Italy 0.038 0.043 0.050 0.058 0.068 0.078 0.095 0.127 0.138 0.147 0.159
France 0.041 0.048 0.051 0.058 0.068 0.078 0.087 0.113 0.116 0.128 0.138
Japan 0.022 0.020 0.021 0.024 0.028 0.031 0.036 0.046 0.053 0.553 0.056
Singapore 0.017 0.018 0.021 0.022 0.026 0.029 0.034 0.051 0.053 0.548 0.055
Germany 0.012 0.014 0.017 0.019 0.022 0.024 0.030 0.037 0.039 0.408 0.041
Source: Official Record, Department of Tourism, Government of Tamil Nadu, 2010.
TABLE 3.4 illustrates that the top ten state-wise domestic tourist arrivals to
Tamil Nadu from 2000 to 2010. As the DTAs have witnessed a significant growth
since 2006, the top ten countries are reported to be major contributors to the domestic
tourism in Tamil Nadu. While comparing the rank order of the first top ten domestic
source states, Andhra Pradesh, Kerala and Karnataka were found to be the first, second
and third source states respectively and the remaining other seven states were
Maharashtra, West Bengal, Madhya Pradesh, Bihar, Uttar Pradesh, Rajasthan, and
Gujarat in the rank order from the fourth to the tenth in terms of domestic tourists in
Tamil Nadu. When the order of the rank of these ten states is established in 2010,
Gujarat with 8.923 million of domestic tourist arrivals has pushed down to Andhra
Pradesh to the second rank with 5.239 million of domestic tourists. Karnataka has
maintained as the third largest domestic source state for Tamil Nadu. The remaining
other states like Kerala, Maharashtra, Rajasthan, West Bengal, Uttar Pradesh, Bihar and
Madhya Pradesh have been placed in order of rank from the fourth to seventh as the
domestic tourist source states for Tamil Nadu in 2010. The trend of domestic tourist
statistics has clearly reflected the change of choice of the domestic tourists to Tamil

78
Nadu between 2000 and 2010. It is clearly indicated that Tamil Nadu attracts more
domestic tourists from Andhra Pradesh, Kerala and Karnataka due its proximity of
culture, food habit, Dravidian language and climate condition.
TABLE 3.4
Top Ten State-Wise Domestic Tourist Arrivals to Tamil Nadu ( in Millions)
Tourism attractions are broadly classified into ten categories, such as
monument, geological garden, fort and palaces, boat house, memorials, dams,
pilgrimage centers, museums, hill stations and paintings. These are the principal
attractions dotted in the tourist map of Tamil Nadu signifying the unique features of
attraction. For example, the State is endowed with exquisite temples with intricate
carving depicting the stories from the epics and legends. There are magnificent temples
like Meenakshi Sunderiswar Temple in Madurai, the Thellai Nataraj Temple in
Chidambaram and the thousand-year oldest and tallest temple Briheadeswar Temple at
Tanjore. It is seen from TABLE 3.5 that the historical and cultural monuments across
the State have attracted the highest numbers of visitors from 2001 to 2010. The forts
and palaces, which were found to be the second best places of tourist interest in respect
of visitor arrivals in 2001, have been replaced by monuments in 2010. Furthermore, the
first-rank attraction (Monuments) has been pushed down to the second position in 2010.
The visitor arrivals in the hill stations of Tamil Nadu in 2001 were reported as 0.629
States 2000 2001 2002 2003 2004 2005 2006 2007 2008 2009 2010
Maharashtra 0.896 9.762 1.036 1.109 1.173 1.326 1.609 2.026 2.505 2.790 3.013
A P 1.793 1.643 1.726 2.002 0.226 2.393 2.980 3.900 4.133 5.012 5.239
Kerala 1.172 1.333 1.406 1.353 1.534 1.617 2.039 2.684 2.755 3.043 3.132
Karnataka 0.905 1.214 1.110 1.245 0.141 1.488 1.882 2.431 3.694 4.035 4.323
WB 0.621 0.786 0.814 0.866 0.782 0.808 0.941 1.266 1.691 1.889 2.039
UP 0.414 0.476 0.493 0.541 0.632 0.647 0.824 1.013 1.378 1.509 1.691
MP 0.483 0.429 0.469 0.487 0.511 0.582 0.745 0.912 1.190 1.240 1.391
Bihar 0.437 0.357 0.419 0.487 0.481 0.627 0.627 0.760 1.002 1.141 1.491
Rajasthan 0.368 0.381 0.390 0.433 0.511 0.517 0.588 0.760 1.002 1.999 2.310
Gujarat 0.262 0.247 0.298 0.391 NA 0.510 0.510 0.557 0.751 8.712 8.923
Source: Official Records Department of Tourism, Government of Tamil Nadu, 2010.

79
million in 2001 and it has increased to 3.359 million in 2010. The rise of tourist arrivals
is about 6 times more in a gap of ten years. Thus, the growth of tourist arrivals has
witnessed manifold increase for all categories of attractions, including hill stations.
TABLE 3. 5
Tourist Arrivals of Top Ten Tourist Attractions in Tamil Nadu (in Millions)
Category 2001 2002 2003 2004 2005 2006 2007 2008 2009 2010
Monuments 1.931 7.688 6.618 8.348 8.324 15.262 8.350 8.782 8.935 9.023
Geo.Garden 2.943 2.120 2.631 2.434 3.130 2.188 3.769 4.266 4.591 5.098
Forts &
Places 3.514 3.036 2.866 0.261 1.955 5.470 3.073 3.175 4.036 4.330
Boat House 2.006 2.104 1.782 1.746 3.013 2.372 2.498 2.815 3.020 3.246
Memorials 1.005 1.379 1.600 0.951 0.339 1.243 1.820 9.142 9.835 9.910
Dams 3.455 2.366 1.019 1.098 1.247 1.733 1.908 4.308 4.598 4.690
Pil. Centers 10.11
3 8.737 13.346 14.374 14.698 23.858 28.971 47.164 5.099 5.349
Museum 1.662 1.631 1.345 1.088 1.111 1.279 1.505 2.672 2.898 3.098
Hill stations 0.629 0.545 0.343 0.417 0.470 1.216 0.969 2.606 3.031 3.359
Paintings 0.215 0.089 0.013 0.032 0.034 0.033 0.063 0.138 0.160 1.876
Source: Official Record, Department of Tourism, Government of Tamil Nadu, 2010.
TABLE 3.6 shows the tourist arrivals to these six indentified ecotourism sites
namely Ooty, Kodaikanal, Yercaud, Elagiri, Coonoor and Mudumalai from 2000 to
2010 in Tamil Nadu. Out of all these sites, Ooty alone received 1.647 Million domestic
tourists and 0.561 million foreign tourists in 2000, thus occupied the first ecotourism
site in attracting the highest number of tourists for varied motivational reasons. It is
reported in 2010 that Ooty has maintained the position as the first hill station or nature-
based tourism site with 5.548 million and 0.244 domestic and foreign tourist arrivals
respectively in all the years, excepting a marginal increase in domestic tourism arrivals
in Kodaikanal in 2005. Kodiakanal has been the second best preferred hill stations for
nature-based tourism and ecotourism as it has been consistently receiving the tourists
since 2001. The remaining other four ecotourism sites have also witnessed a rise in the
growth of tourist arrivals. The statistics of tourist arrivals has clearly revealed the heavy
inflow of visitors to these hill stations of Tamil Nadu and there has been a consistent

80
growth of domestic and foreign tourist arrivals in Ooty. However, the growth of tourist
arrivals to Tamil Nadu have fluctuated between 2000 and 2010 and no sign of decline
in tourist arrivals has been reported in case of all these six hill stations, including
Ooty. It may be inferred that ecotourism and nature-based tourism as its principal form
in Ooty has been the focal attraction for the visitors. Thus, the increase in tourist
arrivals to Ooty is certainly not a healthy trend when Ooty’s carrying capacity and
socio-cultural impact are taken into consideration and discussions.
TABLE 3.6
Tourist Arrivals in Ecotourism Sites in Tamil Nadu (In Millions)
Year Arrivals Ooty Kodaikanal Yercaud Elagiri Coonoor Mudumalai
2000
Domestic 1.658 1.522 0.157 0.029 0.107 0.023
Foreign 0.056 0.046 0.001 0.001 0.002 0.004
Total 1.741 1.568 0.158 0.030 0.109 0.027
2001
Domestic 1.696 1.547 0.207 0.031 0.117 0.024
Foreign 0.057 0.046 0.001 0.002 0.002 0.003
Total 1.753 1.593 0.208 0.033 0.119 0.028
2002
Domestic 1.807 0.166 0.289 0.033 0.141 0.025
Foreign 0.067 0.051 0.001 0.005 0.003 0.004
Total 1.874 1.714 0.291 0.038 0.143 0.029
2003
Domestic 1.993 1.843 0.305 0.032 0.148 0.026
Foreign 0.074 0.057 0.002 0.005 0.003 0.004
Total 2.069 1.900 0.307 0.038 0.151 0.030
2004
Domestic 2.220 2.200 0.310 0.036 0.163 0.029
Foreign 0.086 0.066 0.002 0.006 0.003 0.005
Total 2.307 2.266 0.312 0.042 0.166 0.033
2005
Domestic 2.468 2.497 0.338 0.039 0.198 0.030
Foreign 0.099 0.074 0.002 0.007 0.003 0.005
Total 2.566 2.571 0.340 0.046 0.182 0.035
2006
Domestic 3.077 2.981 0.387 0.051 0.270 0.040
Foreign 0.108 0.079 0.002 0.009 0.004 0.006
Total 3.185 3.060 0.389 0.060 0.274 0.045
2007
Domestic 3.848 3.839 0.493 0.062 0.433 0.074
Foreign 0.128 0.097 0.003 0.006 0.007 0.007
Total 3.975 3.936 0.495 0.069 0.440 0.082
2008
Domestic 4.700 4.476 0.571 0.101 0.731 0.090
Foreign 0.143 0.099 0.003 0.007 0.012 0.009
Total 4.843 4.575 0.674 0.108 0.743 0.099
2009 Domestic 5.281 4.827 1.963 0.685 0.857 0.123
Foreign 0.223 0.143 0.004 0.017 0.010 0.015
Total 5.503 4.970 1.967 0.702 0.866 0.138
2010 Domestic 5.548 5.047 2.031 0.704 0.872 0.133
Foreign 0.244 0.153 0.004 0.019 0.010 0.015
Total 5.792 5.200 0.207 0.722 0.882 0.149
Source: Official Record, Department of Tourism, Government of Tamil Nadu, 2010.

81
3.5. The Nilgiris – The Blue Mountain of South
The word Niligiris (split Niligiris or Neilgherries) is derived from two Sanskrit
words; ‘Nilam’ meaning blue and ‘Giri ‘meaning a hill. Thus, the literal meaning is
“The Blue Hill”. The origin of the name was known to all since the Hills rising
majestically were enveloped in a peculiar blue haze (Venugopal, 2006, p-75). The
Niligri, the Himalaya of South India, lies in the northwestern direction in Tamil Nadu.
Nevertheless, it is also one of the major hill stations of India. The Niligiris is one of
biodiversity hotspots in the Western Ghats and it lies at the junction of the Eastern and
the Western Ghats. It is a rich mountain ecosystem with having immeasurable impact
on the entire biodiversity of the Niligiri region. The hill district is located between 100
380
and 110
490
N latitude and 750 44
0 to 77
0 87
0 E longitude with elevation ranging
from 400 to 2636 above MSL. It is surrounded on the West by Kerala, on the North by
Karnataka and on the South and East by Coimbatore district of Tamil Nadu (Madhu
and Shahoo, 2005). The district is endowed with varied pleasant climate conditions
suitable for raising many traditional crops. The rich species, countryside and landscape
along with widespread vegetation like evergreen forest called Shola is generally seen
while travelling in the foothills between Mattupalayam and Udhagamandalam and
between Udhagamandalam and Gudalur.
3.5.1. The Niligiri District Profile
The Nilgiri district is spread over a total area of 2549.00. sq.km. The
geographical location of the district lies between 100
38’ and 11
0 49
0’N latitude and 75
0
44’
and 770
87’ E longitude. Total population, as per the 2011 census, is about 76,
21,41. As the climate is one of the major pulling factors of the Niligiri, April, May and
June are the hottest months with a variance of 18º C minimum and 43º C maximum

82
temperature. December and February are the cool months varying temperature as high
as 35º C and as low as 17º C. The annual rainfall ranges between 25 and 75 inches.
3.5.2. About the Site
The very first name of the Ooty or Ootacamund was first found mentioned in
the Madras Gazette in 1821 and the name was subsequently spelt as
“Wotokymund” by an anonymous European correspondent. It is also fondly called
the Queen of Hill Stations (Price, 2002). Udhagamandalam, which is the Head Quarters
of the district, is the largest and one of the most important hill stations in South India.
The hill station is located at an elevation of 2286 meters and is situated in the centre of
the district. It is an extensive valley enclosed on all sides, but the west by a
lofty range of hills (Price, 2002,p 6.). Udhagamandalam or Udhai or Ooty is a Taluk
with 30.60 sq.km area under the administrative territory of Niligri district. The Taluk
is located between 110
and 24 b’N latitude and between 76
0 and 42’ E longitude. The
total population of the hill town is 20, 5433 lakh. April, May and June are the hottest
months. December and February are cool months. The temperature drops down as low
as 5ºC and as high as 21ºC in the winter months and temperature reached a maximum
of 25ºC and a minimum of 10ºC in the summer. The annual rainfall ranges between 25
and 75 inches. The tourist attractions of Niligiri District are given in Annexure IX.
3.5.3. Physical Features
On the basis of geology, topography, climate and nature of vegetation, the
district may be divided into five sub-regions such as Gudalur Plateau, Mudumalai
Region Hill, Sigur Forest Region, Ooty Plateau Region and Kundha Forest Region
(Report of Forest Expert Committee, 2009).
Gudalur Plateau: This region covers the part of Gudalur and Ooty taluks. It
constitutes an extension of the plateau of Kerala. The maximum height is 962 m as it is

83
noted at Naduvattam town and the minimum height is 222m as it is found at
Nelliyalam town. However, the average height of this region is around 1200 to
1300 m.
Mudumalai Region Hill: This small region lies in the northern tip of this
district, lowering a portion of Gudalur taluk. This region consists of the typical
Mudumalai forest with a wildlife sanctuary mainly created for elephants. Both the
maximum altitude (1136 m) and the minimum altitude (900 m ) are located in the
region Mudumalai forest village. Many tributaries of Moyar River are originated from
this forest.
Sigur Forest Region: This region lies into the northern portion of the district,
comprising part of Ooty and Kothagiri taluks. This region is the meeting point of the
Western and the Eastern Ghats. The maximum height (1764 m) is located at Ebbaned
village of Kothagiri taluk and the minimum height (665 m) is reported in the forest
area. This region from the West towards the East forms to be the catchment areas of the
Moyar River.
Ooty Plateau Region: This region comprises the whole of Coonoor taluk and
part of the taluk of Ooty and Kothagiri. It lies at the confluence point of Western and
Eastern Ghats. Doddabetta (2644 m), the highest peak of the state, is located in the
Ooty plateau region. Average altitude of this plateau is 2100 to 2200 m. The steep hills
and narrow valleys with rivers and rivulets along with a few waterfalls form to be some
of the beautiful scenic sites for the onlookers and visitors. The minimum height in this
region is (1618 m) at Kilkundah village and it is surrounded by steep sloping hill
ranges. This region is drained by the Mayor River and Kallar River. These two rivers
are the tributaries of the Bhavani River. This region is well known for its beautiful

84
scenery and pleasant climate perfectly fitting for the ecotourism and nature-based
tourism.
Kundha Forest Region: This region is a small area in Ooty taluk. This region
is bounded by valley and surrounded by steep sided hill regions. The entire region is a
basin with a number of reservoirs like Pykara reservoir, Mukurathi Lake, Parsons
Valley, Emerald reservoir, Upper Bhavani etc. The Maximum height is 2625m as it is
seen in Kolari peak of the Mulligur village of Ooty taluk.
3.5.4 Climatic Conditions
Though Ooty is situated in the tropical zone, it also comes under subtropical to
temperate climate by virtue of its altitude. The climate of the region is tropical up to
900 m and subtropical from 900 m to 1800 m along with mountain temperature above
1800 m. The mean minimum temperature was 10.0 Celsius and the mean maximum
was 29.8 Celsius during 2007-08. Even though the low temperature, the hill station
does not witness snowfall. Ooty receives the southwest monsoon that onsets from
September to December. The coldest month is December and the hottest month is April
with a dry wind from the northeast. Frostily nights are common between January and
February. Wind velocity of this region shows maximum and minimum of 13.4 km an
hour and 4.4 km an hour respectively. Average monthly humidity also ranges from 70
per cent to 94 per cent in July.
Average rainfall in the district is 1180 mm and the total rainfall was 1872.4.mm
during 2008-2009. The first three months of every year are almost rainless. February is
found to be the driest month. Rainfall is spread over all four seasons viz. December-
March, April-May, June-August and September-November with most of the rainfall

85
concentrated during June through November. However, maximum amount of rainfall is
recorded during July 299.5mm. Intense rainfall often occurs in the order. Erosion
intensity is high in May, October and July. The incidence of drought is also common
form soil and water conservation point of view. High incidence of drought during April
and December and heavily during May, July and October has already posed threats to
the ecosystem of Niligiris (Department of Economics and Statistics, 2010).
3.5.5. Geology
The geology of the Deccan plateau is very stable when compared to Northern
plains and the Himalayas. The Geology of the area consists of Choc Kites of Niligiris
genies varying from acid to ultra basic ones. The intermediate is most common
geological formations. The minerals in the rock are blue quartz, plagioclases, feldspars
and hornblendes and the secondary minerals include garnets (Palanisamy, 2005). The
Charnockite group of rocks with the enclaves of Satyamangalam Schist Complex is
heavily deposited in the region. This group represented by Chamcokite and Pyroxene
granulite and covers a major part of the district in the southern part. This is popularly
known as “Nilgiri Massif”. The Bhavani Group (Peninsular Gneissic complex)
comprises Fissile Hornblende Biotite Gneiss. The Satyamangalam Schist Complex is
represented by Quartzsericite / Mica Schist, Ultramafics and banded magnetite
quartzite.
The Nilgiri Massif is capped by a luminous laterite at a number of places
indicating the deep zone of weathering (Ganapathy et al, 2010). Most of the parts of
this region’s rocks are deeply weathered and the soil thickness is found to be upto 40m
with lithomarge and it is a common feature in the district. The low gradient of slope in
Ootacamand promotes stagnation of surface water as bogs and swamps (GSI, 2000).

86
3.5.6. Biodiversity
This region harbors a wonderful collection of flora and fauna. Considering the
richness of biological diversity on the district, the area was chosen in 1986 as the site
for conservation of biological diversity of peninsular India and designated to Niligiris
the Biosphere Reserve (NBR) under the United Nations Educational, Scientific,
Cultural Organizations (UNESCO) Man and the Biosphere programme of the
Development of Environment and Forest, Government of India ( Ranith, 1996). The
natural vegetation of the valley is typically a dense rather low forest with much
undergrowth and many epiphytes, mosses and fauna. Both tropical and temperate floras
occur and vegetation is tropical in character at lower elevations and temperature at
high elevations. Botanically, zoologically, ethnologically and ecologically, the Nilgiris
forms a typical forest and is called as ‘’’Shoals’ (Kondas, 2005). The followings are
the different types of vegetation given below;
The Shola and grassland vegetation of the Nilgiris plateau
The open sandal bearing scrub of the Sigur plateau
The most deciduas and dry deciduous teak forest of the Nilgiris- Wayanad
The forest of south eastern outer areas
Forest: The Nilgiri tract was the first choice of the constitution of the biosphere reserve
in India in 1956. The total area of the biosphere is around 5670 sq.km, out of which
2,020 sq.km is the core zone and 2290 sq.km is restoration zone which includes
substantial undisturbed areas of natural vegetation types such as dry scrub, dry and
moist deciduous, semi-evergreen, wet-evergreen forest, ever-green forests and swamps.
Various forms of forest range from 22 per cent in Coonoor taluk to 66 per cent in Ooty
with a range of 56.6 per cent for Nilgiri district.

87
Man-Made forest comprises Eucalyptus Globules (96.6 sq.km) Acacia Merrily
(140.8 sq.km) and Pinups Platula (11.9 sq.km). Natural forest called “Shola” occupies a
meager area of 15 sq. km. This region has been attracting ecologists for a long time to
study the distinct plant communities such as extensive grassland and evergreen “shola”.
Trees in the Shola belong to the families of Bricaceae, Laureceae, Myrtaceae, Rosaceae
and Styraceae represented by genera like Litsea, Phoeve, Rhododendron, Siderroxylon
and Syzium. The Shoal has top story, under storey, undergrowth, dency leaf litter and
homus along with good growth of epiphyes, linchens, mosses and lianes. A good
number of perennial streams are originated from this shola. A botanical study of the
shola has revealed that no single species predominates. The Shola adds to beauty of
countryside and it is immensely used in protecting the perennial sources of water
supply in the stream under the maintenance of ecological balance (District Forest
Office, Official Website, 2010).
Flora : Out of the 141 endemic genera in India, 50 of the important one are
spread over the Western Ghats and 11 of them are seen in this area. At the species
level, out of the estimated 2100 sq.km. of flowering plants endemic to peninsular India,
a total of 818 sq. km. is to be found in the Nilgiris and adjoining areas. The genus
Baeolepies with a single species nervosa is restricted to the Nilgiris. Out of the species
of endangered flowing plants of Tamil Nadu, 25 of them are exclusively seen in the
Nilgiris and many orchids are also seen. A large number of medicinal plants are also
integral part of the biodiversity of the Niligiris. About 200 plant species have been
reported and species are commonly exploited due to overexploitation of certain species
have become rare (State Environment Report of Tamil Nadu,p-8).

88
Fauna: The fauna of the Nilgiri Biosphere Reserve includes over 100 species of
mammals, 350 species of birds, 80 species of reptiles and amphibians, 300 species of
butterflies and innumerable invertebrates. 39 species of fish, 31 amphibians and 60
species of reptiles. These species are as endemic to the Western Ghats as to the Nilgiri
Biosphere Reserve. Fresh water fishes such as Danio Neilgheriensis, Hypselobar
Busdubuis and Puntius Bovanicus are restricted to the Nilgiri Biosphere Reserve. The
Nilgiri Tahr, Nilgiri Langur, Slender Loris, Blackbuck, Tiger, Gaur, Indian Elephant
and Marten are some of the animals found in the forest (State Environment Report of
Tamil Nadu,p-6).
People: The people of this hilly region, prior to the occupation of the British in
1819, consisted of the Todas, Irulas, Paniyas, Kurumbas, Koatas and Kattunaikkas as
the indigenous communities of the hilly area. The ancient pattern of human settlement
and among these communities was unique. Though each of these groups had its own
language, tradition and custom, all four tribal groups depend on agriculture and
traditional occupations. TABLE 3.7 shows the tribal population in the Ooty taluk as per
the 2001 census data. In the whole Nilgiri district particularly Ooty taluk, Todas, Irulas,
Kurumbas and Kotas are settled, but no Paniyas and Kattunaikkas settlements are seen
in the Ooty taluk.
TABLE 3.7
Tribal Population in Ooty Taluk
Sl.No Name of the Tribes Population in Total
1 Todas 850
2 Irulas 1809
3 Paniyas Nil
4 Kurumbas 295
5 Kotas 1158
6 Kattunaikkas Nil
Total 4012 Source: Nilgiri District Official Website http://nilgiris.nic.in/. Accessed on 20.12.2010.

89
The Todas: Todas population is roughly around 850 and most of them live in
and around Ooty taluk and very insignificant numbers are settled in other taluks like
Kothagiri, Coonoor and Kundha. Their livelihoods were once centered on their herds of
buffalos and their milk. Huts are great anthropological significance. Their traditional
huts are shaped like barrels made of specific thatch grass, bamboo, reeds, specific tree
poles and plenty of rattan cane. Todas have highly structured clans among themselves.
Their language is Dravidian, but it is extremely rare of non-Todas to acquire familiarity
with it. They have their own pantheons of deities and the sacred geography of their
afterworld as it believed among the Koatas in this region (Mathur, 2005, p. 5.).
The Kotas: The Kota tribes is one of the Dravidian tribal communities
inhabiting the Nilgiri region. The tribe group constitutes a small and low ranking tribal
community having symbiotic relationships with the Todas, Badaga and Kurumba of
Nilgiris. They speak a mixed dialect of Canarese, Tamil and Malayalam. According to
2011 census, the population of the Kotas is about 1,158. The settlement of the Kota is
linearly divided into localities called Keris. Their houses are built with stone and tiles
and it is known as Kiakaals (Mathur, 2005, p. 2.).
The Kurumbas : The Kurumba tribes are claimed to be one of the autochthons
of the Ooty region. This tribes are also known as the Alu Kurumba tribes that is a
distinct community found on the southern and southeastern parts of the high plateau
around the Doddabetta peak. The Alu Kurumba tribes had practiced sorcery
exterminated entire hamlets of the Kurumbas in relation for the sorcery that are alleged
to have been committed by them. The Kurumbas are used to live in rock shelters or
houses or huts in small settlements in the forest areas. Today, majority of them lives in

90
the substandard huts. They are generally found in hamlets of four or five huts scattered
timbers, wild grass, bricks and mortar (Venugopal. D, 1993,p. 13.).
The Paniyas : The Paniyas are another significant group of tribes sharing a
habitat in Gudalur taluk and extending to neighboring areas in Kerala as well as
Kodagu (Karnataka). Many of them hereditarily served their Chetti landlords and their
ilk. It is a very timid community and they are basically animists in their beliefs and
practices. Their language is said to be derived from Tamil/Malayalam-Kodagu branch
of South Dravidian (Mathur, 2005, p.10).
The Irulas: The Irulas are found mainly in the Southern and Eastern slopes of
the Ooty region. They have certain features that distinguish them from the tribal of the
same name inhabiting Coimbatore and Kerala hills. The Irulas in the eastern slopes are
legendarily associated with the Rangasamy cult, a popular religious ceremony centered
on the Rangasamy peak in Kil (Lower)-Kotagiri. Kasavas, the allied tribe, live in the
northern slopes of the hills. They are used to be the dynamic purveyors of forest
produce. They are the traditionally hired herdsmen from Badaga pastoral camps in
Mayor Basin. Both the groups practiced some kind of multi-layer cropping system and
additionally reared some goat and cattle. Presently, most of them are also employed in
plantations and other wage earning enterprises (Parthasarathy.J, 2005).
3.5.7. Structure of Local Administration
For the purpose of administration, the Niligiri district has been divided into four
blocks such as Udhagamandalam, Coonoor, Kothagiri and Gudalor, with the district
headquarters at Udhagamandalam, Ooty or Udagai. The district is divided into two
revenue division and six taluks (till recently, the district had only four taluks viz., Ooty,

91
Coonoor, Kothagiri and Gudalor. The taluks of Kundah and Pandalur have been created
with the recent bifurcation from Ooty and Gudalor taluks for local administration. The
district has two Municipalities, one Cantonment, four Panchayats Unions, 21 Towns
and 27 Village Panchayaths (http://nilgiris.nic.in/). The Nilgiri District Map is given in
Annexure V.
3.5.8. Land Using Pattern
In Ooty and the adjoining areas, many different types of cropping patterns
have been developed after the Hill Area Programme implemented by HADP (Hill Area
Development Program). The importance of this programme is to increase the persistent
crops. Eco-development is the primary agenda of the HADP to reduce the soil erosion
and increase the vegetation cover. The other objective is to increase the economic
activities through agriculture, horticulture, floriculture and sericulture in the hill region.
Land in the Nilgiri was covered with shola (Southern with Mountain
temperature evergreen forests) with rolling grasslands. Todas, the original tribes, who
were pastoral in the habit, burnt the forests. Later, Badagas migrated and started
cultivation. However, the British settlers introduced potato, tea, eucalyptus, acacia and
temperature fruit trees. Abundance of grasslands and forests now provide scope for
extensive cultivation of tea, coffee, cinamon, blue gum, Blackwattle, peaches, pears,
plums, oranges, potato, temperature vegetables etc. Out of these changes of crop
pattern, potato and vegetable crops are grown without adoption of sustainable
conservation measures. As a result, the cultivation of potatoes, tea and vegetable not
only produce heavy soil loose, but also soil the mountain landscape and beauty of the
region. Further, Tea, paddy, tapioca banana, ginger, turmeric etc have been introduced
at Gudalur and Pandalur, thereby causing heavy erosion.

92
3.5.9. Agriculture
Agriculture is one of the main activities in the Ooty region. Of the total of the
district, only one fourth land is cultivable. Non-food crops are cultivated in nearly 65
percentage of the area and food crops like tea and coffee as the major non-food crops
are grown in the remaining cultivable area. Tea cultivation covers 50 percentage of
total area which is mainly located in Ooty, Coonoor and Kothagiri. Coffee as one of
the chief crops of the region is grown in nearly 2000 hectares and it is mainly in
Gudalor. Sinchona and lemon grass are other major non-food crops grown in Ooty.
Among the food crops, potato is grown in a large scale, whereas paddy and cereals are
grown in Gudalor areas. Potato, carrot, beans, beetroot, radish and cauliflower are the
major vegetables grown in this region. As per the recent survey, vegetables are grown
in over 7500 hectares of the total cultivation area and a bulk of the vegetable grown in
the Nilgiris is transformed to other centre for sale. Total area under the fruit cultivation
is 612 hectares. Orange, Jackfruits, Blum, Pears, Bananas, Apples and Mangoes are the
fruits grown in the Niligiris. Plumbs of Ooty and Mandarin oranges of the Kookal
valley are the premium varieties. The Horticulture Department is actively engaged in
providing necessary help to the farmers to grow fruits cultivation. Ginger, lemon, grass,
garlic, rubber, cinchona and pepper are also grown in a limited scale in Gudalur block.
Eucalyptus and Geranium are grown sustainably in Ooty block. As a result, Eucalyptus
and Geranium oil units are producing oils for the medicinal use. The extracted
Eucalyptus and Geranium oil are sold throughout the country, Nilgiri District Collector
for Development/ Project Officer, DRDA, 2006,p.13).

93
3.5.10. Expansion of Industrial Development
The Nilgiri district is known for its tea processing plants. There are 185 tea
factories spreading across Ooty and its surroundings. The coffee produced in the district
is processed at Mettupayalam or Coimbatore. As the vast area is under Eucalyptus
plantation, Eucalyptus oil is pursued at the several cottage industries. The HPF
(Hindustan Photo Film) manufacturing company limited is an important unit of the
public sector, located in Ooty. Cordite factory, Food Specialties India limited, Protein
Product of Indian Limited, Needle Industry Private limited and Bonds India Private
Limited are operating their manufacturing units in Ooty Nilgiri District Collector for
Development / Project Officer, DRDA, 2006).
3.6. Development of Tourism in Ooty
Tourism has become the mainstay of the economy of hill town since it was
brought to the limelight by the British. Development is imperative through tourism as it
has already been found from the several studied funded by the Government. Apart from
the traditional means of providing occupation and livelihood to the local people,
tourism has been figured out as a major catalyst for laying a strong foundation for
socio-economic development since it is evident from the growth of domestic and
foreign tourist arrivals. It is the total tourist arrivals that act as the indictor of inflow of
revenue through tourist expenditures, thereby triggering a ripple multiplier effect in the
local economy. The Tourist Map of Ooty is given in Annexure VII.
3.6.1. Tourist Arrivals at Ooty
TABLE 3.8 illustrates the total tourist arrivals and the breakup of domestic and
foreign tourists into Ooty for a period of 11 years. Ooty with such beauty and other

94
important infrastructure is no doubt a-year-round destination attracting hundred
thousands of visitors from all over the world. There has been a steady increase in tourist
arrivals year-on-year basis. The table reports that the year 2007 witnessed the highest
growth of 25.06 per cent as compared to the lowest growth in 2001. However, the
double-digit growth of total tourist arrivals as well as the DTAs is reported from 2003
to 2009. On the other hand, the growth of FTAs was double digit from 2002 to 2004
and from 2007 to 2009. Surprisingly, there was a tumble in FTAs in 2005 and it is the
lowest growth in the same year. After registering a remarkable 55.03 per cent growth in
FTAs in 2009, it has a nosedive in 2010. Similarly, there has been a decline in growth
of DTAs and total tourist arrivals since 2008. Nonetheless, it is figured out from the
analysis that there has been an increase in tourist arrivals, but there has been a
significant fall in the tourist arrivals.
Thus, the trend of tourist statistics has explicitly indicated the sharp decline in
tourist arrivals in Ooty. It would be positive to manage the carrying capacity that has
largely become a chronic issue, but it would be negative in revenue generation,
followed by economic development in Ooty. Furthermore, Ooty is exception to the
international trend of tourism and tourist movement across the world. The fluctuations
of tourist arrivals are directly linked to the inflow of tourist arrivals to India. Finally, it
is inferred that the rising tourist arrivals have triggered many challenges to the District
Administration and Tourism Department to respond to the consequences in the future
regardless of downfall in the growth of tourist arrivals. The Niligiri District Map is
given in Annexure VIII.

95
TABLE 3.8
Tourist Arrivals to Ooty (in Millions)
Year DTAs %
Growth FTAs
%
Growth
Total Tourist
Arrivals
%
Growth
2000 16.57 0.056 17.13
2001 16.95 2.29 0.057 2.11 17.53 02.29
2002 18.06 6.56 0.067 16.80 18.74 06.87
2003 19.93 10.30 0.074 10.11 20.67 10.29
2004 22.20 11.40 0.086 16.68 23.07 11.59
2005 24.67 11.14 0.990 01.44 25.66 11.26
2006 30.76 24.65 0.011 09.70 31.84 24.08
2007 38.47 25.06 0.0.13 18.15 39.75 24.82
2008 46.99 22.14 0.014 12.19 48.42 21.82
2009 52.80 12.36 0.022 55.31 55.03 13.63
2010 55.48 05.61 0.024 09.73 57.92 05.02
Source: Official Records, Department of Tourism, Government of Tamil Nadu, 2010.
3.6.2. Primary Tourism Infrastructure
The Nilgiri Hotel and Restaurant Association (NHRA), Ooty collected and
compiled the number of different types of hotels in 2010. TABLE 3.9 presents the types
of hotels, number of rooms and beds in Ooty. It is reported that there are five five-star
hotels with 100 rooms as against three two-star hotels with 120 rooms. At the same
time, there is no three-star and four- star hotels in Ooty. As many as 500 budget hotels
and 225 cottages, guest houses and lodges are the registered accommodation operators
providing 200 and 1125 rooms respectively. The analysis has revealed that there is a
mismatch between the demand and supply for the hotel rooms in Ooty. When the total
tourist arrivals are taken into consideration, the existing number of hotels and rooms
must be insufficient. Visitors are bound to pay the rate for a room whatever is charged
by the accommodation operators.
It is a fact that all these accommodation units have abysmally low occupancy
rate in the off-season. It is strongly recommended to the Government of Tamil Nadu to
attract more hotel companies to add more rooms in the inventory in Ooty in the future.
Otherwise, the inflow of tourists should be regulated to make a possible balance

96
between the available rooms and demand for rooms. Keeping in view the prospects of
Ooty as a world-class nature-based tourism, the government should draft an exclusive
policy for all the hill stations with special emphasis on Ooty to ensure inclusive
development, thus managing the issue of carrying capacity.
TABLE 3.9
No. of Registered Hotels in Ooty
Sl.No Types of Hotels No. of Hotels No.of Rooms
1. Five Star 05 100
2. Two Star Hotel 03 120
3. Budget Hotel 50 200
4. Cottages, Guest Houses and
Lodges 225 1125
Total 283 1935 Source: Official Record of Nilgiri Hotel and Restaurant Association, (NAGAR Group of Hotels), 2010,
Ooty.
Given the size of tourist arrivals and length of stay, the Municipal Corporation
has registered as many as 131 food stalls, restaurants, bakeries, sweet stalls and coffee
shops in 2010. TABLE 3.10 shows the number of registered eatery places in Ooty in
2010. Out of the registered shops, there are 67 numbers of food stalls and restaurants as
against 42 bakeries & sweet stalls and 12 coffee shops. The data have been collected
and compiled by the Nilgiri Food Stalls and Restaurants Association (NFSRA) to take
care of the common interest of the registered eatery places and help the Municipality
ensure the quality of food. It is very sensitive in nature that visitors consider the
hygienic at the eatery places as the most important element to become healthy during
the tour. The data clearly state that the number of registered shops is inadequate to cater
to the growing number of tourists.

97
TABLE 3.10
Registered Food Stalls, Restaurants, Bakeries and Coffee Shops in Ooty
Sl.No Types of Establishments Total No.
Establishments
1. Food Stalls & Restaurants 67
2. Bakeries &Sweet Stalls 42
3. Coffee Shops 12
Total 131 Source: Official Record of Nilgiri Food Stalls and Restaurants Association (Ooty Coffee House), 2010,
Ooty. .
3.6.3. Transport and Other Infrastructure
This region has a good network of roads running in all directions connecting to
various key locations across the State. The Ghats roads have been laid to facilitate the
safe operation of transports. The Coonoor Ghat road connecting Mettupalayam and
Coonoor forms the main lifeline from the foothill to Udhagamandalam. The Siriyur
Ghat road starts from the northern crest of the plateau and passes through Masinagudi
and Theppakadu and joins the Gudular-Mysore road access to the border of Kerala
through Cherambadi. TABLE 3.11 presents the classification of roads along with the
length of roads in Ooty in 2005. It explains that the construction of new roads has not
been taken up by the government since 2005.
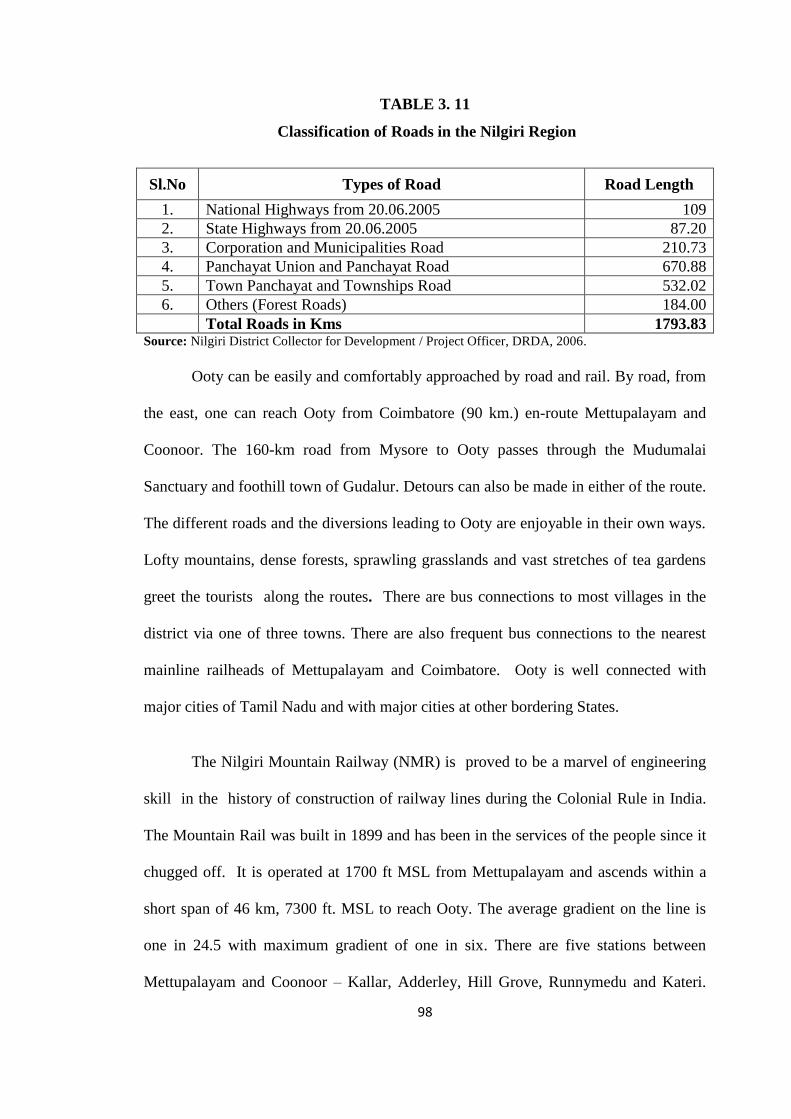
Thus, the Central and State allocations have been spent for the expansion of
width of roads and maintenance of all categories of roads. Further, A total length of all
categories of roads is about 1793.83 km. in 2005. Out of which, 109 km. is the
National Highway; 87.20 km. is the State Highway, 210.73 km. are the Corporation and
Municipalities Roads, 670.88 km. is the Panchayat Union and Panchayat Roads, 532
km. is the Town Panchayat and Townships Road and 184 km.comes Under Forest
Road in the Ooty region.
98
TABLE 3. 11
Classification of Roads in the Nilgiri Region
Sl.No Types of Road Road Length
1. National Highways from 20.06.2005 109
2. State Highways from 20.06.2005 87.20
3. Corporation and Municipalities Road 210.73
4. Panchayat Union and Panchayat Road 670.88
5. Town Panchayat and Townships Road 532.02
6. Others (Forest Roads) 184.00
Total Roads in Kms 1793.83 Source: Nilgiri District Collector for Development / Project Officer, DRDA, 2006.
Ooty can be easily and comfortably approached by road and rail. By road, from
the east, one can reach Ooty from Coimbatore (90 km.) en-route Mettupalayam and
Coonoor. The 160-km road from Mysore to Ooty passes through the Mudumalai
Sanctuary and foothill town of Gudalur. Detours can also be made in either of the route.
The different roads and the diversions leading to Ooty are enjoyable in their own ways.
Lofty mountains, dense forests, sprawling grasslands and vast stretches of tea gardens
greet the tourists along the routes. There are bus connections to most villages in the
district via one of three towns. There are also frequent bus connections to the nearest
mainline railheads of Mettupalayam and Coimbatore. Ooty is well connected with
major cities of Tamil Nadu and with major cities at other bordering States.
The Nilgiri Mountain Railway (NMR) is proved to be a marvel of engineering
skill in the history of construction of railway lines during the Colonial Rule in India.
The Mountain Rail was built in 1899 and has been in the services of the people since it
chugged off. It is operated at 1700 ft MSL from Mettupalayam and ascends within a
short span of 46 km, 7300 ft. MSL to reach Ooty. The average gradient on the line is
one in 24.5 with maximum gradient of one in six. There are five stations between
Mettupalayam and Coonoor – Kallar, Adderley, Hill Grove, Runnymedu and Kateri.

99
There were also five stations between Coonoor and Fernhill. Of these, Adderly,
Runnymade, Kateri and Fernhill are some of the abandoned stations.
It is one of the oldest mountain railways in India. The NMR is a UNESCO
World Heritage Site declared in July 2005. This connects Ootacamand with the town of
Mettupalayam at the foothills of the Nilgiri Mountains.
Coimbatore Airport is about 90 km. from the Southeast of Ooty. It has domestic
flights to several major Indian cities and is a model international airport with direct
services to Singapore, Sharjah and Colombo. The next nearest international airport to
Ooty is Karipur International Airport in Calicut, which is at a road distance of 146 km.
from the West of Ooty. Steps are being undertaken to start a helicopter shuttle service
from Coimbatore. The journey will take approximately 20 minutes and will cost Rs.
4500 per passenger for a one-way flight.
3.7. Measurement of Carrying Capacity
Based on the different observations of sustainable nature-based tourism
development, objectives of the calculation of carrying capacity differ from place to
place (Tran et al 2007). Hence, this measurement of carrying capacity is an essential
technique to regulate the tourist entry into the places of interest. The estimation has
been carried out with the help of tourist arrival statistics.
The nature-based tourism destinations in Ooty that include Botanical Garden,
Rose Garden and Boat House. These three sites selected for the measurement of
carrying capacity are based on the results of Friedman Rank Test of tourist
attractiveness in Ooty presented in Chapter IV. According to Maldonado et al., 1992,
three types of carrying capacity have been calculated for these three sites separately.

100
These three different types are called as the Physical Carrying Capacity (PCC), Real
Carrying Capacity (RCCa) and Effective Carrying Capacity (ECCb)
Physical Carrying Capacity: Physical carrying capacity is calculated
according to the space necessary for one person to move freely in a specified time and
is assumed to be one square meter per person. The average trail (path) is one meter
and each tourist can use at least one liner meter of the trail at any given movement. For
this study, Botanical Garden’s trail (path) has been taken for the calculation (Ceballos-
Lascurrain, 1996).
Tourists follow the trail (path) in a group consisting 25 members, including
a guide.
A distance of at least one meter is maintained between the groups
The trail (path) has a length of 400 meters
An average time of one hour is required for a tourist to see the Botanical
Garden
The Botanical Garden remains opened to the tourists for seven hours per day
and 365 days per year.
Thus, the calculation of the PCC is as follws;
PCC= Length X Tourists Meter X Daily Duration ( hrs/day)
= 400 X 1 X 1 X 7
= 2800 Per Day
= 2800 X 365 Tourists Per Day
= 10, 22,000 Tourists Per Year
Real Carrying Capacity (RCCa): The RCCa refers to the maximum number
of tourists that the local conditions and management capacity allow without influencing
the tourists’ demand. In the event of the occurrence of heavy rain at any time during
the winter, summer and monsoon season, the botanical garden may be closed and

101
tourist may be prohibited to enter into the Garden. Natural disturbance (FND) and
Weather Condition (FW) were collected from the tourists respectively. Hence, climatic
condition, natural disturbance, whether and vulnerability factors are taken as the
limiting factors.
FP : Precipitation
FND: Natural Disturbances
FW: Weather Condition
Limiting Factor (1) Precipitation
Limiting Factor (2) Natural Disturbances
Limiting Factor (3) Weather Condition
The formula of RRCa is as follows;
The calculation of RCCa is as follows;
RCCa = 2800 X 0.999 X 0.992 X 0.999
= 2800 X 0.97
= 2716 Per Day
= 2716 X 365
= 9, 91,340. Per year
Effective Carrying Capacity: (ECCb) The ECCa refers to the difference
between the actual management and the ideal management capacity of the Botanical

102
Garden given by the numbers of personnel (100 office and administrative staff, park
guards and guides are employed in the garden). The ideal management capacity is
given by the number that would be required to fulfill all factions allocated to the staff of
the Botanical Garden is 390.
The formula of ECCb is as follows;
The calculation of the ECCb is as follows;
= 2716 X 0.5642
= 1532 Per Day
= 1532 X 365
= 5, 59,314 Per Year
Thus the PCC is 10, 22,000, the RCCa is 9, 91,340 and the ECCb is 5, 59,314.
Therefore, the results of the three types of calculation clearly indicated that the
Botanical Garden has faced the problem of physical, real and effective carrying
capacity limit.
The PCC of Rose Garden
Total Length of Trail (Path) - 1000 meters
Width of Trail (Path) - 1 meter

103
Each Tourist Needs at least - 1 Sq.km.
Max. Visitation Hr. - 1 Hr.
Opening Hrs. of Garden - 7 Hrs.
The Formula of PCC is as follows;
PCC= Length X Tourists Meter X Daily Duration ( hrs/day)
By assuming the maximum, the calculation of PCC in Rose Garden is as follows;
= 600 X 1 X 1 X 7
= 4200 per day
= 4200 X 365 tourists per day
= 15, 33,000 per year
The formula RCCa is as follows;
FP : Precipitation
FND: Natural Disturbances
FW: Weather Condition
Limiting Factor (1) Precipitation
Limiting Factor (2) Natural disturbances
Limiting Factor (3) Weather condition
The formula of RCCa is as follows;
The calculation of RCCa is 4200 X 0.998 X 0.992 X 0.999
= 4200 X 0.995

104
= 4153 Per Day
= 4153X 365
=15, 15,845.Per Year
The formula of ECCb is as follows;
The calculation of ECCb is as follows;
= 1873 per day
= 1873 X 365
= 6, 83,646 per year
Thus, the PCCis 15, 33,000, the RCCa is 15, 15,845 and the ECCb is 6,
83,646 in the Rose Garden. Hence, the results revealed that all the PCC, RCCa and
ECCb have cross the carrying capacity limit.
The followings are the PCC of Boat House.
- Total length of the boat house - 850 meters
- Length of boat - 7 meter
- Distance of between ticket counter and boat parking - 5 meters
- A minimum distance between two - 5 meters
- Average distance between two tourist - 1 meter

105
- Maximum number of tourist on a boat - 13 +1 (operator)
- Maximum boating hours - 1hour
- Opening hours - 8 hours
The formula of PCC is as follows;
PCC= length X tourists meter X daily duration (hrs/day)
By assuming the maximum,
= 850 X 1 X 1 X 7
= 5950 per day
= 5950 X 365 tourists per day
= 21, 71,750 per year.
The variables of RCCa are as follows
- FP : Precipitation
- FND: Natural Disturbances
- FW: Weather Condition
Limiting factor (1) Precipitation
Limiting factor (2) Natural Disturbances
Limiting factor (3) Weather Condition
The Formula of RCCa is as follows;
By assuming this,
RCC = 5950 X 0.998 X 0.992 X 0.999
= 5950 X 0.9890

106
= 5884 Per Day
= 5884 X 365
= 21, 47,917per year
The formula of ECCa is as follows;
= 2653 per day
= 2653X 365
= 9, 68,594 per year
Thus, the PCC is 21, 71,750 that is followed by RCCa with 21, 47,917 and
ECCb with 9, 68,594. Hence, the PCC, RCCa and ECCb have already crossed the
threshold limit at the Boat House in Ooty. It is concluded that all three types of carrying
capacity have already become excess at the Botanical Garden, Rose Garden and Boat
House. The results have divulged the excess of carrying capacity that will result in the
visitor dissatisfaction, trampling, noise pollution, etc. With this backdrop, the
Department of Horticulture, Government of Tamil Nadu ought to be pro-active in
restricting the number of the visitors into the Botanical Garden and Rose Garden and
the TTDC must also take steps in reducing the number of visitors into the Boat House.
The findings have further suggested that both the Department of Horticulture and the

107
TTDC should expand the areas to accommodate the increasing number of the visitors or
regulate the entry timings.
3.8. Major Tourist Attractions in Ooty
Ooty is the largest taluk in the Nilgiri district with 16 different tourist places of
interest as catalogued by the Department of Tourism, Government of Tamil Nadu. Out
of these spots, three tourist spots namely Botanical Garden, Rose Garden and
Herbarium come under the jurisdiction of the Department Horticulture, Government of
Tamil Nadu. Two boat houses, one Children’s Park and one Peak (Doddabetta Peak)
are owned and maintained by the TTDC. One Race Course is owned by an individual.
The remaining spots namely Pykara Dam and Waterfalls, Avalanche Shola Forest,
Glonmorgan, Parsons Valley, Kalhatty Water Falls, Valley View and Kamaraj Sager
Dam and Cairn Hill are maintained under the direct administrative control of the
Department of Forest. However, some of the tourist spots in Ooty are managed by the
Nilgiris District Administration.
Botanical Garden: The main attraction for the visitors in Ooty is Botanical
Garden. This Garden was established in 1847 by the Marquis of Tweedale and is spread
over 22 hectares ascending the slopes on the hill at an elevation of 2,400 meters above
the Main Sea Level (MSL). The sprawling green garden is well maintained with the
lawns, trees along with a 20 million-year-old fossil tree, an Italian-style garden, a
variety of flowers, and plants, fern house with a vast range of ferns and orchids and a
pool. The Department of Horticulture organizes the Annual Summer Festival at the
Botanical Garden in May, during which different indigenous flowers are exhibited to
attract more number of visitors to the garden. The habitation of Toda tribe with their
traditional culture is seen in the eastern side of the garden.

108
Boat House: The Ooty boat house, being maintained by the TTDC, is a must-
see tourist spot for the visitors with recreation and relaxation as the primary purpose.
The lake is located in the west of Udhagamandalam and the water level is maintained
with check-dam across the rivulet in the valley. The length of the lake view is about
2.75 km. and the breadth varies from 100 to 140 meters with an area of over 65 acres.
The establishment of this scenic lake is as old as the identification of Ooty as a summer
retreat center for the British Administration. Further, the lake was transformed into a
recreation center with the direct support of the then District Collector of Ooty, Mr. John
Sullivan during 1823 – 1825. The TTDC has made adequate arrangements of the row,
peddle and motor boats for the visitors. Horse ride and the Mini Train are some of the
added attractions near the Ooty lake view.
Doddabetta Peak: The Doddabetta Peak is a mandatory sightseeing spot
situated a distance of 20 km. from the Ooty town. The peak is the highest point with
2,623 meters from MSL in the Nilgiri region. Unforgettable experience for the nature
lovers, the panoramic view of the topography and vegetation from the viewing tower is
certainly something to be remembered for good. Most striking feature of the visit to the
peak is the walk along side of the tall pine trees. The Coimbatore city and the flat
highlands of Mysore can also be sighted with the help of a telescope.
Race Course: Race course about 2.4 km. long is a very popular sport activity
during the summer months of April, May and June.
Rose Garden: The oldest garden of the hill town has already celebrated its
centenary year and it is now named as the Centenary Rose Park. Being located in the
heart of Ooty town, the garden is spread over 10 acres of extensive land with rose

109
tunnels, pergolas and bowers along with rose creepers and it is maintained by
Horticulture Department, Tamil Nadu. As many as 3000 varieties of roses are
nourished in the garden and some of the roses are hybrid tea roses, miniature rose,
floribunda and ramblers with black and green in colours. From the Nila Maadam, the
complete spectacle of the world-famous garden can be beheld and enjoyed. The World
Federation of Rose Societies (WFRS) in 2006 awarded the Garden of Excellence to the
Rose Garden in Ooty.
Pykara or the Water Falls and Dam: The Pykara is the largest holy river as
believed by Toda tribe in the Nilgiri District. The river flows on the Ooty-Mysore road
at a distance of 20 kms from Ooty. The river Pykara is originated from the Mukurathi
peak and flows through hilly tract of the North and West of the Nilgiri forest before
reaching at the edge of plateau. The perennial river flows down gorgeously in the
forms of cascades, thus created two falls measuring 55 meters and 61 meters known as
Pykara falls. The Pykara Lake provides a lot of recreational activities like boating and
rowing. Wenlock Downs is a vast expanse of grassy meadow on the way to Pykara
River and offers a favorite picnic site for the school children and weekenders. The
meadow also is an ideal location for the film shooting.
Mini Garden-Children’s Park: The Mini Garden for children’s amusement is
situated on the way to the boathouse. The TTDC maintains a toy train and a snack bar
for the visitors.
Avalanche Lake, Dam and Valley: The Avalanche Valley is named after a
devastating landslide that occurred in 1823. The Avalanche Dam and Lake are
located on the way to Upper-Bhavani from Ooty via Emerald Camp at a distance of 25

110
km. The views from the top of the hill at Avalanche give an incredible sight of the
valley and reservoir. The valley is a home to a wide variety of birds attracting the bird
lovers and the dam is also a home to out fish encouraging the angling activity.
Nonetheless, the shoals are a heaven for rare temperate Orchids. A dam across the
avalanche is popularly called Canada Dam since the construction of dam was funded
by the Canada Government.
Kamaraj Sagar Dam: The Dam is a popular beaten spot for picnic lovers.
Picnic activity is allowed on the slopes the Wenlock Downs. Fishing in the Dam adds
much interest with the visitors.
Glenmorgan: The Glenmorgan Tea Estate is situated at a distance of 25 km.
from the northwest of Ooty. It is one of the oldest estates in the region even much
before the execution Pykara Hydro Electricity project at a height of 938.78 meters. A
haulage way or the mechanical rope way connecting to the powerhouse at Singara
provides a thrilling experience. The view from the rest house at Glenmorgan is
panoramic.
Kalhatty Falls: Ooty is known for its cascading waterfalls and many waterfalls
feed the waters to the rivers and natural lakes. Thus, Kalhatti Falls is about 120 feet
with hiking, bird watching and trekking activities. It is located at a distance of 13 km.
Ketti Valley View: This valley is one of the largest valleys in the world and is
extended from the plains of Coimbatore to the Mysore Plateau. This viewing tower is
located at a distance of 7 km. from Ooty on the Ooty-Coonoor Road.

111
3.9. Issues and Challenges
The significance of Ooty is better known from its rich ecological diversity and
physiographic differentiation. In a short distance of 50 kms., the average annual rainfall
ranges between 1000 mm and 3000 mm and the altitude between 300 mm and 2600
mm. This variation explains a large variety of vegetation types from evergreen forests
to jungles. The extremely fragile ecosystem of Ooty sustains different categories of
biological resources and supports human existence in the hill and in the surrounding
plains. The resources generated in terms of water, energy and other forests products
have a significant impact on the region’s economy.
The degradation of the environment and ecology along with the natural beauty
of Ooty is well documented. The Geological Survey of India (GSI) presents that
preventing environment from degradation in this region has gone beyond the limit and
capacity. The harm has already been done to a maximum extent. It is the time to
prevent further damage and take steps to reduce the magnitude of damage. It is
fundamental that the cost of repair or cure is always more than the cost of prevention
(GSI, 1982). Truly correct, tourism development is one of the fundamental reasons for
the negative impacts on the ecology and environment of Ooty. These environmental
and ecological problems must be attributed to the changes of land use and its
consequence, siltation, soil erosion, land sliding, developmental issue, mass tourism,
cultural distraction, vehicle entries, extension of monoculture, industrialization and
urbanization.

112
The shoals are referred as “living fossil” because they do not give any return
to the forest physiognomy. The initial micro climatic forests that are prevailing in the
degraded areas never allow the tropical stocks of sholas to regenerate.
Change of Land Use and Its Consequences: Ooty has experienced massive
development in the last two decades and tourism enterprises are the principal users of
the land. As a result, the natural forests and grasslands are converted to the well-
developed urban center with rampant construction of concrete buildings for the purpose
of the comfort of the visitors. More importantly, numerous changes in the land cover
have occurred with the extensive cultivation of tea, coffee, cinchona, bulegum, wattle,
peaches, pears, plumes, oranges and potato, temperature vegetables etc. Conversion of
forest land into agriculture land under the then popular slogan “grow more food
camping” during the World War II could allow more encroachment on forest lands and
grasslands to meet the food, fuel and fodder requirement of the human and animal
population. Further, the exploitive adaptation methods of cultivation have also caused
much destruction to the soil, topography and climatic condition.
It is noticed that the destruction of indigenous ‘shola’ forest and grasslands with
the sporadic tea plantation and construction of connecting roads on the steep slops has
resulted in the drying up of some of the tanks and streams. It is regularly reported that
the landslide, flash floods and droughts frequently occur in the Nilgiri region and
paralyze the normal life.
Studies so far conducted at the Central Soil and Water Conservation Research
and Training Institute (CSWCRTI) at Udhagamandalam indicated the high amount of
soil loss in potato cultivation on the hill slopes. The tea plantation without soil and

113
water conservation measures has also contributed to heavy soil loss. The sedimentation
studies conducted by the Institute of Hydraulics and Hydrology, Government of Tamil
Nadu indicated that 31.56 per cent to 38.90 per cent of loss between 1966 and 1982
has already occurred in stage capacity due to siltation in Pegumbahalla and Pillor
reservoirs respectively. The emerald Avalanche reservoir has lost only 7.05 per cent of
its capacity between 1961 and 1981. The low rate of situation in the Emerald-
Avalanche and Pykara reservoir is reported due to 90 per cent coverage of forest in
catchment areas. Tea estates and vegetable cultivations have equally contributed to the
soil erosion. All the three reservoirs are located in the Kundha system of reservoirs in
the Bhavani river basin and they are washing away the shore so much so that the depth
of the reservoirs is decreasing with erosion of hillock and forest lands.
This hilly region alone produces 840 MW of power generating revenue to the
tune of rupees Rs. 500 crore annually. Over the years, these natural ecosystem and
watersheds have faced with sporadic changes in the wake of the road and building
construction. Building of a series of hydro-electrical projects, tunneling the water to
different areas for irrigation, building reservoirs, planting the upper areas with
commercial pulpwood species and replacing natural grassland with tea and marshes
with vegetables have all changed the Ooty’s natural topography and surrounding water
regime. Thus, the land-use pattern indicates drastic changes from 1970-71 to 2000-
2001. The net-sown-area in the district was increased from 21 per cent to 31 per cent
and the land under miscellaneous tree cover rose to 69 per cent. These changes have
occurred at the cost of barren and cultivatable wastelands and pastures. In the view of
the fact, there is a need for attention to sustain the over growing population and food
security for this region.
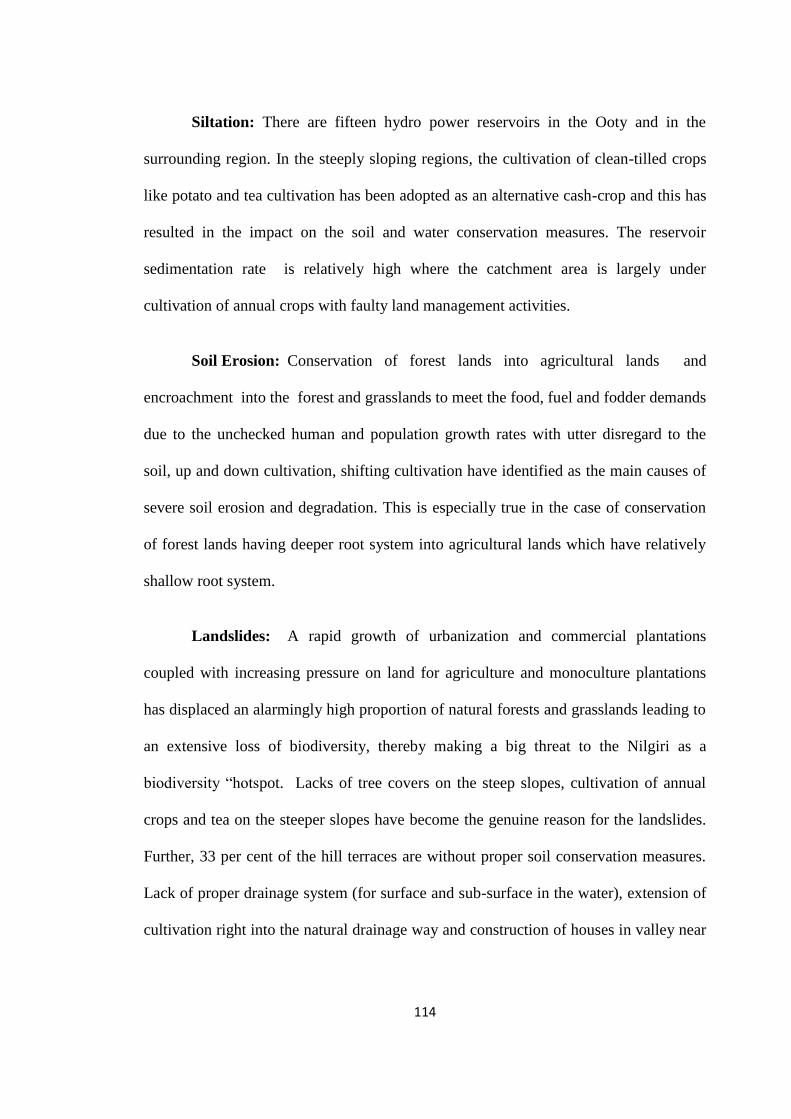
114
Siltation: There are fifteen hydro power reservoirs in the Ooty and in the
surrounding region. In the steeply sloping regions, the cultivation of clean-tilled crops
like potato and tea cultivation has been adopted as an alternative cash-crop and this has
resulted in the impact on the soil and water conservation measures. The reservoir
sedimentation rate is relatively high where the catchment area is largely under
cultivation of annual crops with faulty land management activities.
Soil Erosion: Conservation of forest lands into agricultural lands and
encroachment into the forest and grasslands to meet the food, fuel and fodder demands
due to the unchecked human and population growth rates with utter disregard to the
soil, up and down cultivation, shifting cultivation have identified as the main causes of
severe soil erosion and degradation. This is especially true in the case of conservation
of forest lands having deeper root system into agricultural lands which have relatively
shallow root system.
Landslides: A rapid growth of urbanization and commercial plantations
coupled with increasing pressure on land for agriculture and monoculture plantations
has displaced an alarmingly high proportion of natural forests and grasslands leading to
an extensive loss of biodiversity, thereby making a big threat to the Nilgiri as a
biodiversity “hotspot. Lacks of tree covers on the steep slopes, cultivation of annual
crops and tea on the steeper slopes have become the genuine reason for the landslides.
Further, 33 per cent of the hill terraces are without proper soil conservation measures.
Lack of proper drainage system (for surface and sub-surface in the water), extension of
cultivation right into the natural drainage way and construction of houses in valley near

115
drainage way and long wet spells are the main causes of landslide/ slips in the district.
TABLE 3.12 presents major landslides in the Ooty region.
The study conducted on the land use, soil and water conservation and landslide
by CSWCRTI in 1967 proposed for mechanical soil conservation measures, vegetative
measures, water harvesting, and utilization of steep slopes, agri-horticulture, agro-
forestry and hydro-ecological aspects. The GSI, studying the Ooty region since 1927
has suggested for the Natural Hazard Evaluation Method (NHEM) to control the loss
caused due to heavy development.
TABLE 3. 12
Major Landslides in the Ooty Region
Occurrences Month &Year of Major
Landslides in Nilgiris Affected Area
October, 1865 Worst Storm on record occurred
around Ooty and Coonoor
Ooty Lake and Coonoor Railway
Station
November, 1891 Storm caused many landslips on the
Coonoor Ghat Kotagiri Mettupalayam Road
December, 1902 Twenty one inches of rain (three
times the average amount) Coonoor Lake, Kotagiri
October, 1905 6.8 inches of rain fall at Coonoor in
three hours and the Coonoor river Coonoor Railway Station,
November, 1978
323 mm of rain fall in the district,
of which 243 mm at Ooty
Kookalthorai, Madithorai, Adashola and
Kallatty Areas of Ooty Taluk and
Manthada of Coonoor Taluk.
November, 1979
Heavy rainfall started from Nov.12
to 13 and the highest rain fall 169
mm
Kodanad, Doddacombai and Coonoor
October 1990
A cloud burst in the wake of the
Northeast Monsoon and washed
away 18 huts on the foothills
Marappalam and Coonoor.
December, 1998 Continuous rain fall and earth slip Coonoor and Mettupalayam
December, 2001
Continuous rainfall, two massive
landslides occurred. Complete
damage of nearly 55 hill grove
railway station
Pudukadu on the Coonoor and
Mettupalayam
November, 2006 Many landslides Mettupalayam and Coonoor
November, 2009
Tamil Nadu via Mettupalayam
road damaged due to heavy rain
and landslides
Ooty, Coonoor and Kotagiri
Source: Ganapathy (2010).Need and Urgency of Landslide Risk Planning for Nilgiri District, Tamil
Nadu State, India, International Journal of Geomatics and Geosciences Vol.( 1), pp,29-40.

116
Unplanned Development: The population of Ooty and its surroundings areas
had increased from a mere from 3,000 in 1821 to 7, 35,071 in 2011. The high growth
of population at Ooty is reported due to the heavy immigration of people from the
backward district of the bordering states. The displacement of people from the power
projects in the early 1950s, the rehabilitation policy of 1960s and the growth in
plantation sector subsequently also increased the population growth.
The cumulative average growth of population in this region in 1901 increased
from 05.08 per cent to 07.69 per cent in 2001. The overall growth is around 3.0 per cent
as against 2.62 per cent growth in Tamil Nadu. The density of population of this
region was 277 per sq.km. as compared to the 429 per sq.km. for Tamil Nadu. The high
density of population in Ooty is an indicator of the pressures on the environmental
carrying capacity (Palanisamy, 2002).
As indicated earlier, the population growth in this region is mainly in Ooty was
reported due to the migrated population. The dependent female migrants along with the
labour also seem to be very high as reflected in the non-worker migrant population to
Ooty originated from drought prone, economically underdeveloped southern districts of
Tamil Nadu or underdeveloped districts of Kerala. A significant proportion of migrants
are reported from the economically weaker section of the society. The proportion of
Scheduled Caste (SC)in this region 30.2 per cent that is higher than the state average
19.2 per cent.
Mass Tourism: As per the data compiled by the TTDC, Nilgiri is generally
visited by approximately around 2.5 million tourists, whereas tourist arrivals to Ooty
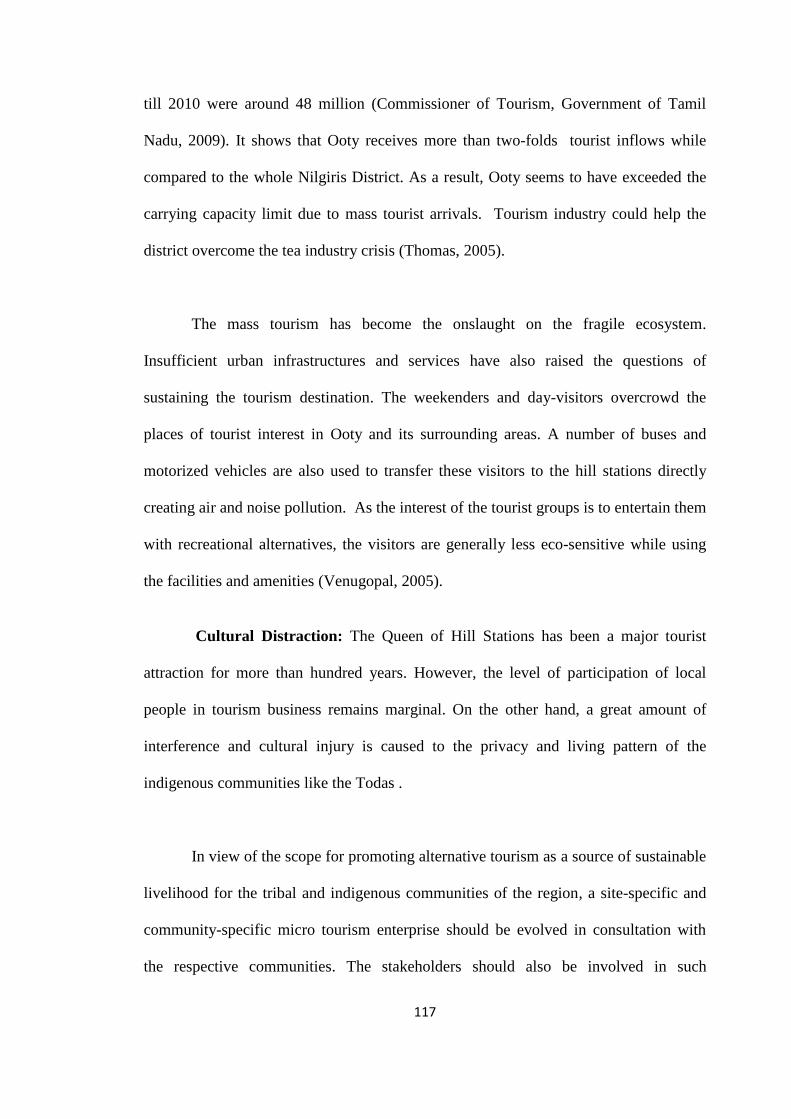
117
till 2010 were around 48 million (Commissioner of Tourism, Government of Tamil
Nadu, 2009). It shows that Ooty receives more than two-folds tourist inflows while
compared to the whole Nilgiris District. As a result, Ooty seems to have exceeded the
carrying capacity limit due to mass tourist arrivals. Tourism industry could help the
district overcome the tea industry crisis (Thomas, 2005).
The mass tourism has become the onslaught on the fragile ecosystem.
Insufficient urban infrastructures and services have also raised the questions of
sustaining the tourism destination. The weekenders and day-visitors overcrowd the
places of tourist interest in Ooty and its surrounding areas. A number of buses and
motorized vehicles are also used to transfer these visitors to the hill stations directly
creating air and noise pollution. As the interest of the tourist groups is to entertain them
with recreational alternatives, the visitors are generally less eco-sensitive while using
the facilities and amenities (Venugopal, 2005).
Cultural Distraction: The Queen of Hill Stations has been a major tourist
attraction for more than hundred years. However, the level of participation of local
people in tourism business remains marginal. On the other hand, a great amount of
interference and cultural injury is caused to the privacy and living pattern of the
indigenous communities like the Todas .
In view of the scope for promoting alternative tourism as a source of sustainable
livelihood for the tribal and indigenous communities of the region, a site-specific and
community-specific micro tourism enterprise should be evolved in consultation with
the respective communities. The stakeholders should also be involved in such

118
enterprises for their income and employment. In this context, the model or experiment
in alternative tourism adopted for the Periyar Tiger Reserve and Chinnar Wildlife
Sanctuary of Kerala can be emulated for Ooty (Palanisamy, 2002).
Extension of Monoculture: The results of hydrological studies conducted on
the identical catchments and on conservation of national grasslands 1968 at the
Glonmorgan by the CSWCR illustrated that significant reduction in stream flow was
reported during this period due to conversion of similar trends in the case of other fast-
growing species like Acacia, Mearsil (Black Wattle) in the Parsion’s Valley catchment.
Planning large scale conversion of grasslands into plantation of forest growing species
particularly Eucalyptus in the catchment of the Niligiri reservoirs has been undertaken
in massive scale. Though the canopy of tea bushes when it is fully developed causes
massive erosion and there is a heavy soil loss till the canopy is developed. Most of the
tea plantations owned by small farmers do not have tea canopy even after ten years due
to bad management and inadequate inputs. As a result, farmers dismantle the potato
cultivation to grow haphazardly tea plantations (Venugopal, 2005,p-79).
Urbanization: Urban development in Niligiri is in utter chaos. The Coonoor
town seems to have grown at its own accord without any control over the year. Gudalur
and Kothagiri are fast growing and they are over bounded by the influx of repatriates
and encroachers. Civic amenities have become woefully inadequate to cater to the
migrated population Draining used water has been a perennial problem. Sewerage
system is inadequate to the local population and tourists.
The problem of sewerage and drainage gets compounded when the heavy flow
of tourists is reported during the summer months. During summer season, the situation
becomes worse as lakhs of tourist arrive in Ooty Most of the hotel buildings are multi-

119
storied to increase the capacities of rooms and beds.. In short, the urban setting is
described as ugly and unsafe. The urban decay in the Niligiris is largely the result of
over population, excessive commercialization and sheer absence of town planning. The
surge in recent years in investment by outsiders is another contributing factor for
increasing urbanization.
3.10. Observation of Vehicle Entries to Ooty
The primary objective of the research is to identify and measure the negative
impacts of mass tourism activities at Ooty. Road transportation is a vital segment to
transfer the tourists to Ooty and the heavy tourist inflow through the road transportation
by car, coaches, and public transports during the summer and winter season is reported.
The environmental degradation due to the heavy usage of road transport system has
gone unnoticed. To overcome this chronic problem, the researcher made an observation
for a period of one week in the summer months (May- July-2010) as well as in the
winter months (October- December-2010), especially during peak traffic hours i.e.
from 0900 to 0915 Hrs, 1300 to 1315 Hrs, and 1800 to 1815 Hrs.
The data collected firsthand are presented in TABLE 3.13. It is reported that
there is no significance difference in vehicle movements during the observed time
intervals between summer and winter season. In general, more vehicle movements were
found during weekends than on weekdays. Ooty was once a seasonal destination and
the hill station has now become a year-around- destination. Therefore, the carbon
emissions have become a major threat to the scenic beauty of Ooty.

120
TABLE 3.13
Vehicle Entries to Ooty
During Summer Season During Winter Season
Govt. Vehicles Private Vehicles Govt. Vehicles Private Vehicles
In Out In Out In Out In Out
23 20 120 121 25 23 133 121
28 25 112 132 28 24 130 132
32 30 130 132 24 22 111 124
27 31 121 126 25 21 101 123
28 32 131 141 27 21 125 131
29 29 114 121 29 27 112 135
32 27 132 123 32 27 100 126
27 31 141 152 21 25 125 132
32 19 132 141 19 21 112 134
42 36 112 132 25 31 132 121
31 23 136 129 27 29 121 131
24 33 121 131 26 28 115 121
25 23 132 112 33 21 114 132
27 31 163 111 34 32 149 101
37 32 251 99 28 23 144 118
35 20 211 121 30 22 113 106
32 30 186 112 21 29 121 109
23 29 145 101 31 22 132 100
33 30 110 76 27 22 115 126
24 32 130 145 28 20 120 135
20 30 120 150 22 28 86 145
588 573 2830 2487 537 495 2378 2482 Source: Researchers’ Own Observation of Vehicles Entries to Ooty at Charring Cross, 2010.
3.11. Conclusion
Ooty is no doubt a fascinating destination. People friendly approaches and
beauty of Ooty keep tourist hooked towards this Queen of Hill Stations in South India.
This has created much loyalty and attachment of the visitors towards Ooty resulting in
the increase in tourist arrivals and the positive and negative impacts on the ecology and
environment. People and authorities were very much impressed by the economic
benefits percolated from the tourism activities by keeping aside the importance for
sustainable development with native people participation. This has created irreparable
121
damages that have to be addressed immediately. Owing to this, the next chapter has
presented the role of tourists, community members and tourism service providers with
reference to the issues and challenges of maintaining the sustainable nature-based
tourism. This chapter has reflected upon the present state of affairs in tourism
development in Ooty.