chapter iii consumer behaviour towards …shodhganga.inflibnet.ac.in/bitstream/10603/90774/9/09...67...
TRANSCRIPT

67
CHAPTER III
CONSUMER BEHAVIOUR TOWARDS FMCGs INDUSTRY IN
INDIA - AN OVERVIEW
The review of literature of the study used in this research is presented in
the second chapter. This chapter presents the consumer behaviour - an overview.
3.1 INTRODUCTION
The fast moving consumer goods sector is the fourth largest sector in
the Indian economy. FMCGs sector provides major contribution to our national
income. This sector contributes 2.4 per cent of the GDP (2013) to the
nation. Fast moving consumer goods industry has witnessed rapid growth
in the last few years. This sector is boosted by favourable macroeconomic
conditions, increased rural incomes, a rising consumption culture in India
and a proliferation of consumer awareness campaigns. The important
developments and the growth of the sector have been presented in this chapter.
3.2 FMCGs CATEGORY AND PRODUCTS
The fast moving consumer goods are classified in to four categories.
These are house hold care products, personal care products, food and beverages
and health care products.
The important household care products include fabric wash (laundry soaps
and synthetic detergents), household cleaners (dish/utensil cleaners, floor

68
cleaners, toilet cleaners, air fresheners, insecticides and mosquito repellents,
metal polish, furniture polish and paints.
The personal care products include oral care, hair care, skin care, personal
wash (soaps), cosmetics and toiletries, deodorants, perfumes, feminine hygiene
and paper products etc., are the important products.
The food and beverages includes health beverages, soft drinks,
staples/cereals, bakery products (biscuits, bread, cakes), snack food; chocolates,
ice cream, tea, coffee, soft drinks, processed fruits, vegetables, dairy products,
bottled water, branded flour, branded Rice, branded sugar, juices etc., are
important products. The health care products include over the counter products.
3.3 TRENDS IN FMCGs IN INDIA
3.3.1 Consumer Related Trends
There are numerous and diverse consumers in India who are diversified in
their consumption pattern and the trends. It will be the consumers trading up the
price ladder in search of additional functionality or brand promise. The
evolution of consumption behaviour will be seen to lead to significant changes
within and across product categories and many companies will find increasing
value at the Bottom of the Pyramid by serving products with high quality to
specifically meet the requirements of this large market. It may be said that there
will be significant scaling up at each step of the consumer income pyramid to be
able to justify independent commercialization of the business potential.
69
3.3.2 Market Related Trends
These trends related to evolving geographical markets towards the fast
moving consumer goods players. The key trends within this segment will be the
viability of sub-markets in India, growing organized retail and the increasing
globalization of FMCGs players. These players need to be conscious of such
trends and adapt their products as well as go-to-market strategies as per their
target markets
3.3.3 Environment Related Trends
The environment trend is influenced by sociopolitical, legal, and
technological reprioritizing that is inevitable in a dynamic environment. The
changes in government policies, growing importance in the sustainability,
evolving media platforms and technology will force the FMCGs players to adopt
business strategies which keep the interests of communities and the environment
in mind for inclusive development.
3.4 GROWTH OF THE FMCGs INDUSTRY
The favourable demographics and rise in income level boost the fast
moving consumer goods market in India. This Industry has witnessed healthy
foreign direct investment inflow, as the sector accounted for 3.0 per cent of the
!"#$%&'() $!$*+),-.) /#0+!1)0%!2)34%/+)5666) $!)7 $!89%)56:;<)=*#&)4+*&9%()*%9)
expanding into new geographies and categories. The FMCGs sector has grown at
an annual average of about 11 per cent over the last decade. The market size of
the Fast moving consumer goods is presented in the Table 3.1. This sector
70
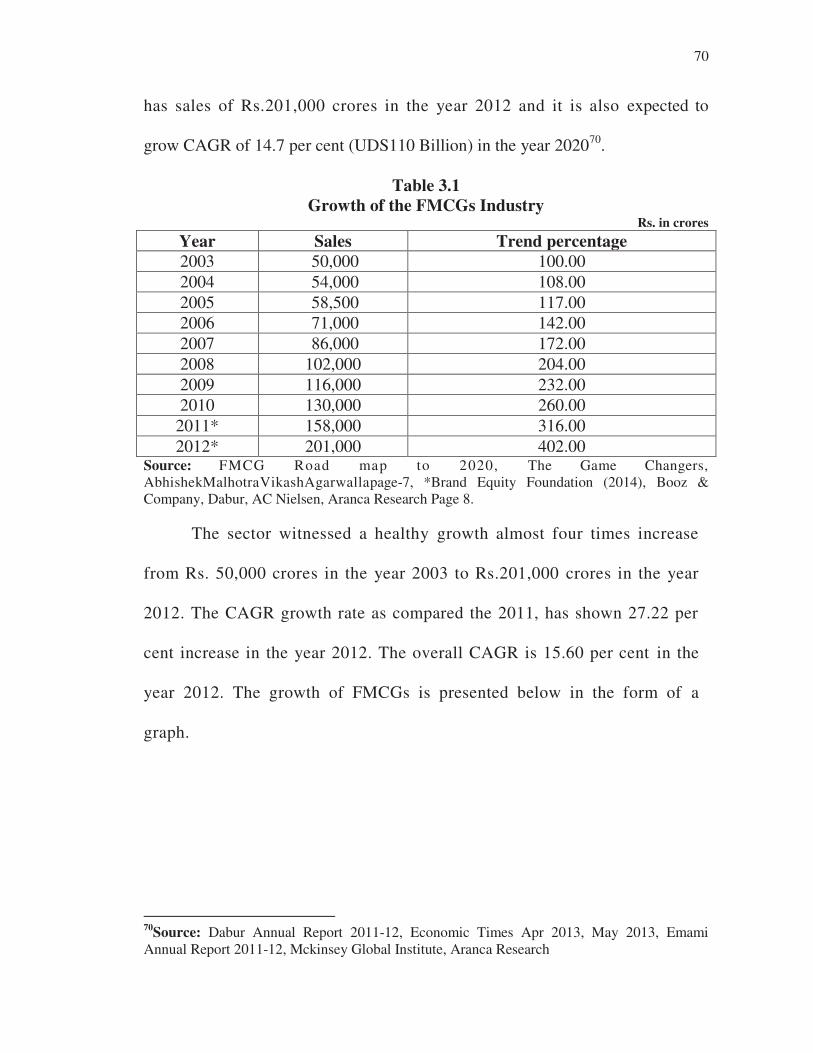
has sales of Rs.201,000 crores in the year 2012 and it is also expected to
grow CAGR of 14.7 per cent (UDS110 Billion) in the year 202070
.
Table 3.1
Growth of the FMCGs Industry Rs. in crores
Year Sales Trend percentage
2003 50,000 100.00
2004 54,000 108.00
2005 58,500 117.00
2006 71,000 142.00
2007 86,000 172.00
2008 102,000 204.00
2009 116,000 232.00
2010 130,000 260.00
2011* 158,000 316.00
2012* 201,000 402.00 Source: FMCG Road map to 2020, The Game Changers,
AbhishekMalhotraVikashAgarwallapage-7, *Brand Equity Foundation (2014), Booz &
Company, Dabur, AC Nielsen, Aranca Research Page 8.
The sector witnessed a healthy growth almost four times increase
from Rs. 50,000 crores in the year 2003 to Rs.201,000 crores in the year
2012. The CAGR growth rate as compared the 2011, has shown 27.22 per
cent increase in the year 2012. The overall CAGR is 15.60 per cent in the
year 2012. The growth of FMCGs is presented below in the form of a
graph.
70
Source: Dabur Annual Report 2011-12, Economic Times Apr 2013, May 2013, Emami
Annual Report 2011-12, Mckinsey Global Institute, Aranca Research

71
Exhibit 3.1
Growth of the FMCGs industry
Source: Brand equity foundation (2014)
3.5 MARKET SHARE OF VARIOUS FMCGs
The market share of fast moving consumer goods and their various
categories has been presented below in the form of a graph. Food products is the
leading segment, accounting for 43 per cent of the overall market, followed by
personal care products (22 per cent) and fabric care products (12 per cent)71
.
71
Source:Dabur, Aranca Research
2003 2004 2005 2006 2007 2008 2009 2010 2011 2012
Sales 50,000 54,000 58,500 71,000 86,000 102,000 116,000 130,000 158,000 201,000
0
25,000
50,000
75,000
100,000
125,000
150,000
175,000
200,000
225,000

72
Exhibit 3.2
Market Share of Various FMCGs 2009
Source: Brand equity foundation (2014)
3.6 MARKET SHARE OF URBAN AND RURAL (FMCGs)
The urban segment is the largest contributor to the sector, accounting for
over two-thirds of total revenue i.e. 66.6 per cent in the year 2012. Semi-urban
and rural segments are growing at a rapid pace by accounting 33.4 per cent of
revenue in the year 201272
.
72
Source:Dabur, AC Nielsen, Aranca Research
43
22
12
8
4
4 2
5
Market Share (2009)
Food products
Personal care
Fabric care
Hair care
Households
OTC products
Baby care
Others

73
Exhibit 3.3
Urban and Rural FMCGs in India 2012
Source: Brand equity foundation (2014)
3.7 COMPARATIVE SALES GROWTH OF LEADING FMCGS COMPANIES
The important manufacturers of fast moving consumer products are ITC,
HUL, Marico, Dabur and Godrej Consumer Products Limited (GCPL).Their
growth had been analysed in the year 2012-13. The ITC food products sales
constitute USD 774.3 and USD 847 million in the financial year 2012 and 2013
respectively. HUL (Food and beverages) net sales decreased from USD 826.6
million in the financial year 2012 to USD824.9 million in the financial year
2013. Marico net sales increased from USD 827.7 million to USD 844.1 million
during the financial year 2012 and 2013. Dabur and CGPL reported healthy net
66.6
33.4
0 0
Urban
rural

74
sales in the financial year 2013. Dabur net sales increased from USD1,102
million in the financial year 2012 to USD1,131.7 million in the financial year
56:;<)>?@A'()#9$)(*+9()/# %9*(9B)0%!2)CD- 1,011.9 million in the financial year
2012 to USD1,176.7 million in the financial year 2013.
Exhibit 3.4
Leading FMCGs Companies
Source: Brand equity foundation (2014) Financial Year 2012
Financial Year 2013
3.8 LEADING FAST MOVING CONSUMER GOODS INDUSTRIES IN
INDIA
1. Hindustan Unilever Ltd.
2. ITC (Indian Tobacco Company)
3. Nestlé India
4. GCMMF (AMUL)
774.30 829.60 827.70
1102.00 1011.90
847.00 824.90
844.10
1131.70 1176.70
0.00
200.00
400.00
600.00
800.00
1000.00
1200.00
1400.00
ITC (Foods) HUL (F&B) Marico Dabur GCPL
Financial Year 2012 Financial Year 2013

75
5. Dabur India
6. Asian Paints (India)
7. Britannia Industries
8. Procter and Gamble Hygiene and Health Care
9. Marico Industries
10. Colgate-Palmolive India Limited
3.8. 1. Hindustan Unilever Ltd.
Hindustan Unilever Limited is the largest Fast Moving Consumer Goods
Company in India with categorized business like soaps, detergents, shampoos,
skin care, toothpastes, deodorants, cosmetics, tea, coffee, packaged foods, ice
cream, and water purifiers. The company brands are Lux, Lifebuoy, Surf Excel,
E/#F) GH99+F) ,*/%) *#B) ) A!I9+&F) @!#B'(F) J*(9+/#9F) A*K29F) -!I9F) ?+/#/ ) @+"(F)
Sunsilk, Pepsodent, Closeup, Axe, Brooke Bond, Bru, Knorr, Kissan, Kwality
G*++'() *#B) @"%9/$<) LH9) !24*#&) 4%!B" $) !0) 4"%%9/$) (*+9() H*() 2!%9) $H*#) MN<M)
million people gained access to safe drinking water globally by end of the year
2013. About 58 million people reached through Lifebuoy hand washing
programmes by end of 2013. In 2013, over 80% of tomatoes used in Kissan
Ketchup in India were from sustainable sources. The sales growth of HUL
products is presented as below Table 3.2.

76
Table 3.2
Sales growth Hindustan Unilever Limited
Rs. in crores
Year Sales Trend %
2004 10,888.38 100.00
2005 11,975.53 109.98
2006 13,035.06 119.72
2007 14,715.10 135.14
2008-09* 21,649.51* 198.83
2009-10 18,220.27 167.34
2010-11 20,285.44 186.30
2011-12 22,800.32 209.40
2012-13 26,679.76 245.03
2013-14 28,947.06 265.85
Source: HUL, Annual Reports *15 Months
The Table 3.2 shows the sales growth of the HUL products from Rs.
10,888.38 crores to Rs. 28,947.06 crores for the period from 2003 to 2012-13
with a growth percentage of 204.44 per cent.
Table 3.3
Segment wise sales percent of HUL Products
Rs. in crores
Year Soaps and Detergents
Personal Products
Beverages and Packaged Foods
Others
2003 44 24 26 6
2004 45 26 24 5
2005 45 28 22 5
2006 47 29 20 4
2007 47 29 21 3
2008-09* 49 29 19 3
2009-10 48 30 20 2
2010-11 46 32 20 2
2011-12 48 31 19 2
2012-13 49 31 18 2 2013-14 49 29 18 2
Source: HUL, Annual Reports, *15 Months
77
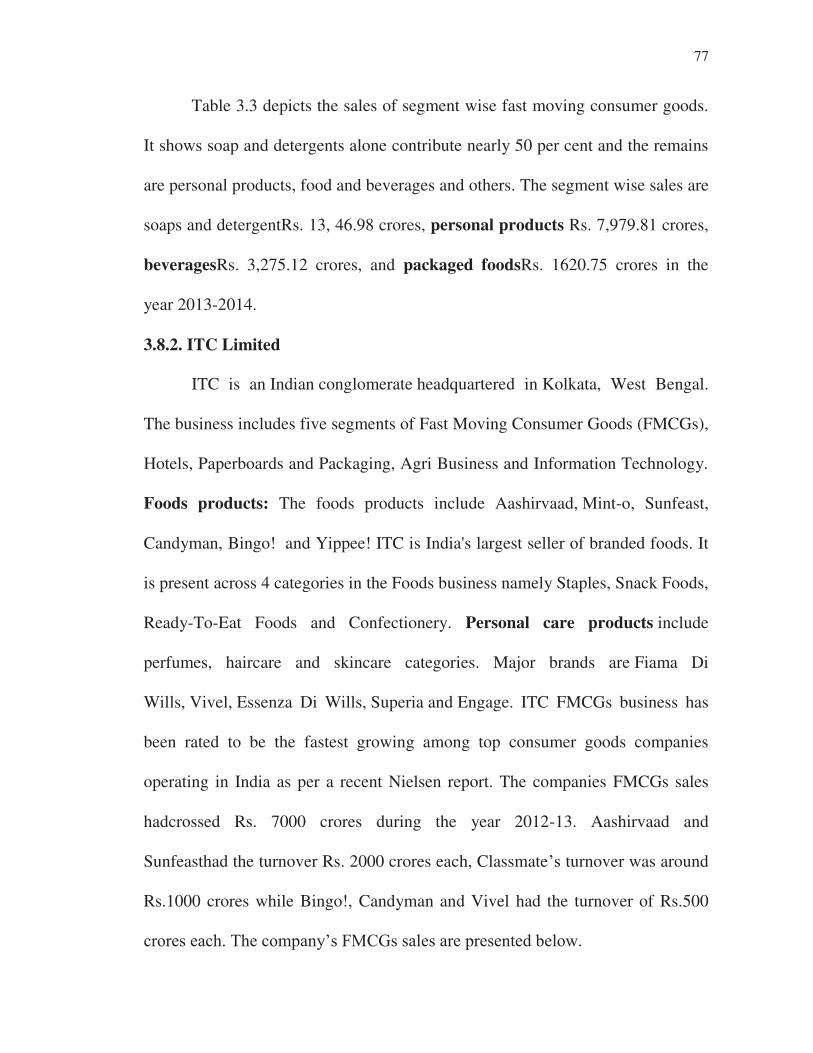
Table 3.3 depicts the sales of segment wise fast moving consumer goods.
It shows soap and detergents alone contribute nearly 50 per cent and the remains
are personal products, food and beverages and others. The segment wise sales are
soaps and detergentRs. 13, 46.98 crores, personal products Rs. 7,979.81 crores,
beveragesRs. 3,275.12 crores, and packaged foodsRs. 1620.75 crores in the
year 2013-2014.
3.8.2. ITC Limited
ITC is an Indian conglomerate headquartered in Kolkata, West Bengal.
The business includes five segments of Fast Moving Consumer Goods (FMCGs),
Hotels, Paperboards and Packaging, Agri Business and Information Technology.
Foods products: The foods products include Aashirvaad, Mint-o, Sunfeast,
Candyman, Bingo! and Yippee! ITC is India's largest seller of branded foods. It
is present across 4 categories in the Foods business namely Staples, Snack Foods,
Ready-To-Eat Foods and Confectionery. Personal care products include
perfumes, haircare and skincare categories. Major brands are Fiama Di
Wills, Vivel, Essenza Di Wills, Superia and Engage. ITC FMCGs business has
been rated to be the fastest growing among top consumer goods companies
operating in India as per a recent Nielsen report. The companies FMCGs sales
hadcrossed Rs. 7000 crores during the year 2012-13. Aashirvaad and
Sunfeasthad the turnover Rs. 2000 crores each, Classmate'( turnover was around
Rs.1000 crores while Bingo!, Candyman and Vivel had the turnover of Rs.500
%!%9()9* H<)LH9) !24*#&'(),=?>()(*+9()*%9)4%9(9#$9B)89+!1<)

78
Table 3.4
Sales growth ITC Limited (FMCGs)
Rs. in crores
Year Sales Trend %
2004-05 563 100.00
2005-06 1013 179.93
2006-07 1704 302.66
2007-08 2511 446.00
2008-09 3014 535.35
2009-10 3642 646.89
2010-11 4482 796.09
2011-12 5545 984.90
2012-13 7012 1245.47
2013-14 8122 1442.63
Source: ITC, Annual Reports.
The Table 3.4 shows the sale growth of ITC limited fast moving consumer
goods. The sales growth shows tremendous increase over the above study period
from 2003-04 to 2012-13. The sale of FMCGs has increased from Rs.563 crores
to Rs.8122crores in the above study period with a growth percentage of 1442.63
as compared to the base year 2004-05.
Table 3.5
Total Sales Growth ITC Limited Rs. in Crores
Year Sales Trend %
2004-05 13585.39 100.00
2005-06 16510.51 121.53
2006-07 19636.53 144.54
2007-08 21966.84 161.69
2008-09 23678.46 174.29
2009-10 26862.98 113.45
2010-11 31423.23 231.30
2011-12 36046.23 265.33
2012-13 43044.21 316.84
2013-14 48175.80 354.61
Source: ITC, Annual Reports.
79
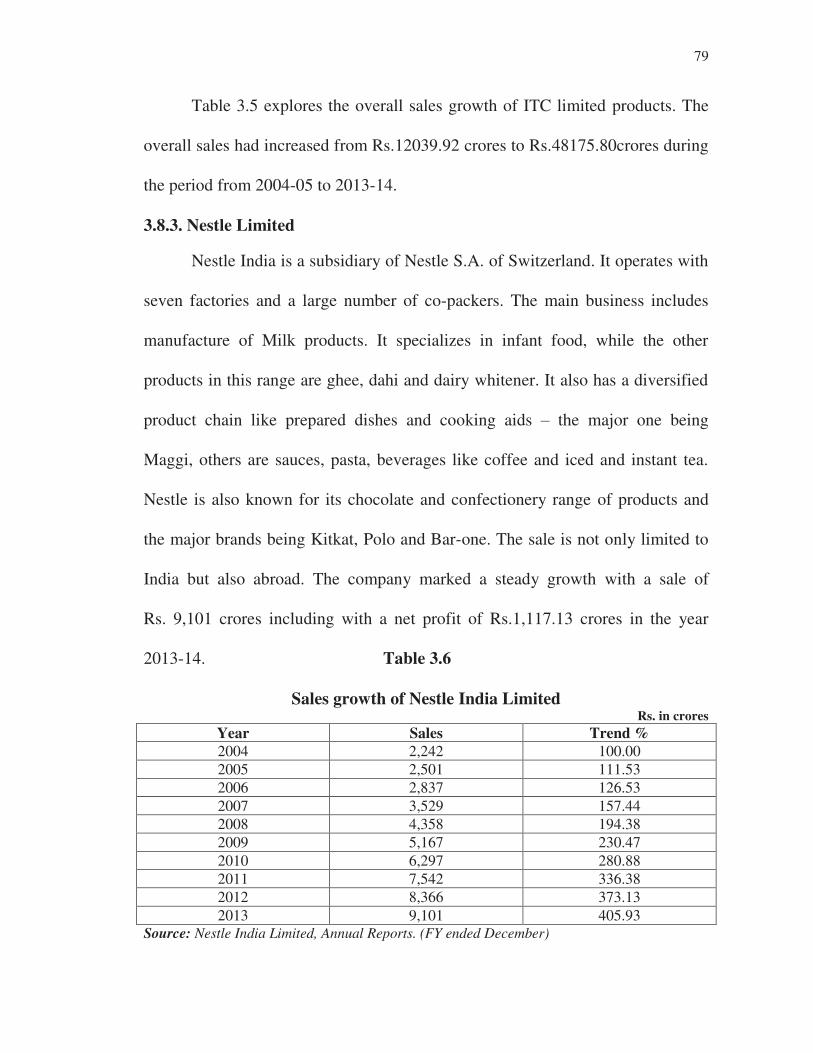
Table 3.5 explores the overall sales growth of ITC limited products. The
overall sales had increased from Rs.12039.92 crores to Rs.48175.80crores during
the period from 2004-05 to 2013-14.
3.8.3. Nestle Limited
Nestle India is a subsidiary of Nestle S.A. of Switzerland. It operates with
seven factories and a large number of co-packers. The main business includes
manufacture of Milk products. It specializes in infant food, while the other
products in this range are ghee, dahi and dairy whitener. It also has a diversified
product chain like prepared dishes and cooking aids O the major one being
Maggi, others are sauces, pasta, beverages like coffee and iced and instant tea.
Nestle is also known for its chocolate and confectionery range of products and
the major brands being Kitkat, Polo and Bar-one. The sale is not only limited to
India but also abroad. The company marked a steady growth with a sale of
Rs. 9,101 crores including with a net profit of Rs.1,117.13 crores in the year
2013-14. Table 3.6
Sales growth of Nestle India Limited Rs. in crores
Year Sales Trend %
2004 2,242 100.00
2005 2,501 111.53
2006 2,837 126.53
2007 3,529 157.44
2008 4,358 194.38
2009 5,167 230.47
2010 6,297 280.88
2011 7,542 336.38
2012 8,366 373.13
2013 9,101 405.93
Source: Nestle India Limited, Annual Reports. (FY ended December)
80
The Table 3.6 shows the tremendous increase in the sales of Nestle India
limited. It shows 4 fold increase of sales from Rs. 2,242 crores in the year 2003-
04 to 9,101 crores in 2013-14.
3.8.4. AMUL (GCMMF)
Gujarat Cooperative Milk Marketing Federation Limited (GCMMF).
GCMMF is India's largest food product marketing organisation with annual
turnover of Rs. 18143 crores in the year 2013-14. Its daily milk procurement is
approx 13.18 million litre per day from 17,025 village milk cooperative
societies, 17 member unions covering 31 districts, and 3.23 million milk
producer members. It is the Apex organisation of the Dairy Cooperatives of
Gujarat, popularly known as 'AMUL', which aims to provide remunerative
returns to the farmers and also serve the interest of consumers by providing
quality products which are good value for money. The seeds of this unusual saga
were sown more than 65 years back in Anand, a small town in the state of
Gujarat in western India. The exploitative trade practices followed by the local
trade cartel triggered off the cooperative movement. Angered by unfair and
manipulative practices followed by the trade, the farmers of the district
approached the great Indian patriot Sardar Vallabhbhai Patel for a solution. He
advised them to get rid of middlemen and form their own co-operative, which
would have procurement, processing and marketing with overall control by
themselves. In 1946, the farmers of this area went on a milk strike refusing to be
cowed down by the cartel. Under the inspiration of Sardar Patel, and the
81
guidance of leaders like Morarji Desai and Tribhuvandas Patel, they formed their
own cooperative in 1946. This co-operative, the Kaira District Co-operative Milk
Producers Union Ltd. began with just two village dairy co-operative societies and
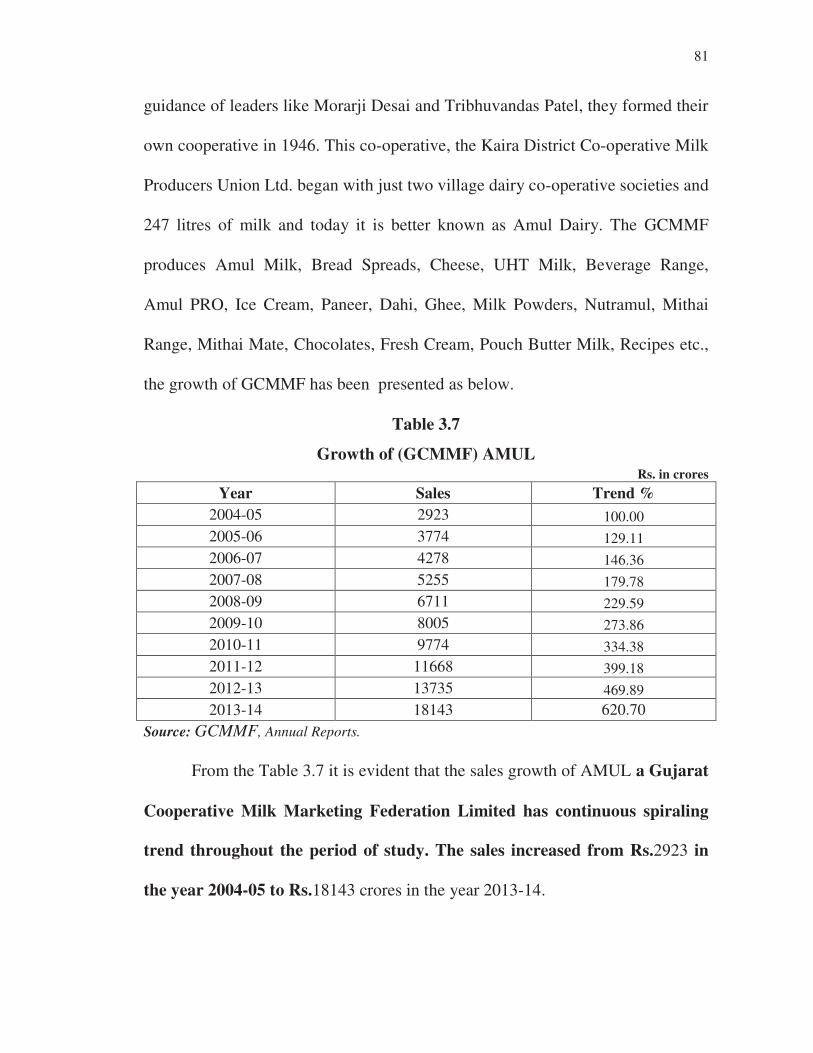
247 litres of milk and today it is better known as Amul Dairy. The GCMMF
produces Amul Milk, Bread Spreads, Cheese, UHT Milk, Beverage Range,
Amul PRO, Ice Cream, Paneer, Dahi, Ghee, Milk Powders, Nutramul, Mithai
Range, Mithai Mate, Chocolates, Fresh Cream, Pouch Butter Milk, Recipes etc.,
the growth of GCMMF has been presented as below.
Table 3.7
Growth of (GCMMF) AMUL Rs. in crores
Year Sales Trend %
2004-05 2923 100.00
2005-06 3774 129.11
2006-07 4278 146.36
2007-08 5255 179.78
2008-09 6711 229.59
2009-10 8005 273.86
2010-11 9774 334.38
2011-12 11668 399.18
2012-13 13735 469.89
2013-14 18143 620.70
Source: GCMMF, Annual Reports.
From the Table 3.7 it is evident that the sales growth of AMUL a Gujarat
Cooperative Milk Marketing Federation Limited has continuous spiraling
trend throughout the period of study. The sales increased from Rs.2923 in
the year 2004-05 to Rs.18143 crores in the year 2013-14.

82
3.8.5. Dabur India
Dabur- India Limited is a leading FMCGs company in India with interests
in Hair Care, Oral Care, Health Care, Skin Care, Home Care and Foods. Dabur
ranked as most trusted healthcare, ayurveda brand in India in the brand trust
%94!%$)56:5<).$)*+(!)%*#K9B)M;%B)/#)$H9)+/($)!0)1!%+B'()$!4):66)89*"$&) !24*#/9()
and it has been ranked amongst the Top 5 Indian companies.
Products of Dabur: Dabur India is highly connected to its consumers and
develops products that meet their needs and requirements. The products are
herbal based and very friendly to the health without any adverse effects. The
company is manufacturing a variety of products and marketing with trust and on
the basis of loyalty of customers in India and abroad. The list of the products is
appended below;
Hair care products: Daburamla hair oil, Dabur hair oil sikakai,
Daburvatika hair oil, Daburamla hair oil lite, Dabur special hair oil, Dabur
jasmine hair oil, Dabur jasmine hair oil, Parachute coconut oil, Cocoraj coconut
oil , Daburanmol coconut oil
Soaps: Daburneem soap, Dabur sandalwood soap, Dabur aloe vera soap
Ayurvedic medicines: Daburhajmola tablets, Daburshilajit health tonic,
Daburhingwastakchuran, Dabur nature care triphla. Daburhajmola candy, Dabur
herbal toothpaste, Basil, Sat isabgol, Dabur nature care triphla,
Daburhingwastakchuran, Daburlavanbhaskarchuran, Dabur honey,
Dabursitopaladichuran, Daburpudinhara pearls
83
Dabur healthcare products: Daburchyawanprakash - sugar free,
Daburchyawanshakti - energy food, Daburchyawanprash, ,Daburchyawan junior,
Chocolate flavoured health drink for kids.
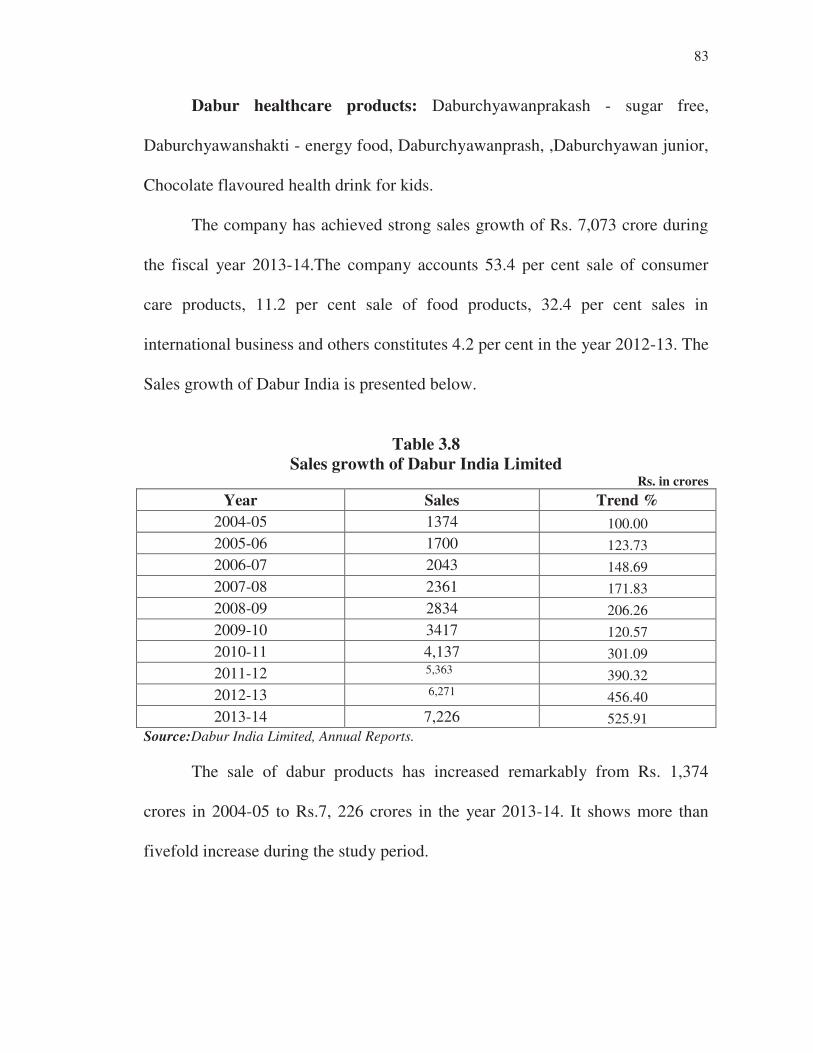
The company has achieved strong sales growth of Rs. 7,073 crore during
the fiscal year 2013-14.The company accounts 53.4 per cent sale of consumer
care products, 11.2 per cent sale of food products, 32.4 per cent sales in
international business and others constitutes 4.2 per cent in the year 2012-13. The
Sales growth of Dabur India is presented below.
Table 3.8
Sales growth of Dabur India Limited Rs. in crores
Year Sales Trend %
2004-05 1374 100.00
2005-06 1700 123.73
2006-07 2043 148.69
2007-08 2361 171.83
2008-09 2834 206.26
2009-10 3417 120.57
2010-11 4,137 301.09
2011-12 5,363 390.32
2012-13 6,271 456.40
2013-14 7,226 525.91
Source:Dabur India Limited, Annual Reports.
The sale of dabur products has increased remarkably from Rs. 1,374
crores in 2004-05 to Rs.7, 226 crores in the year 2013-14. It shows more than
fivefold increase during the study period.
84
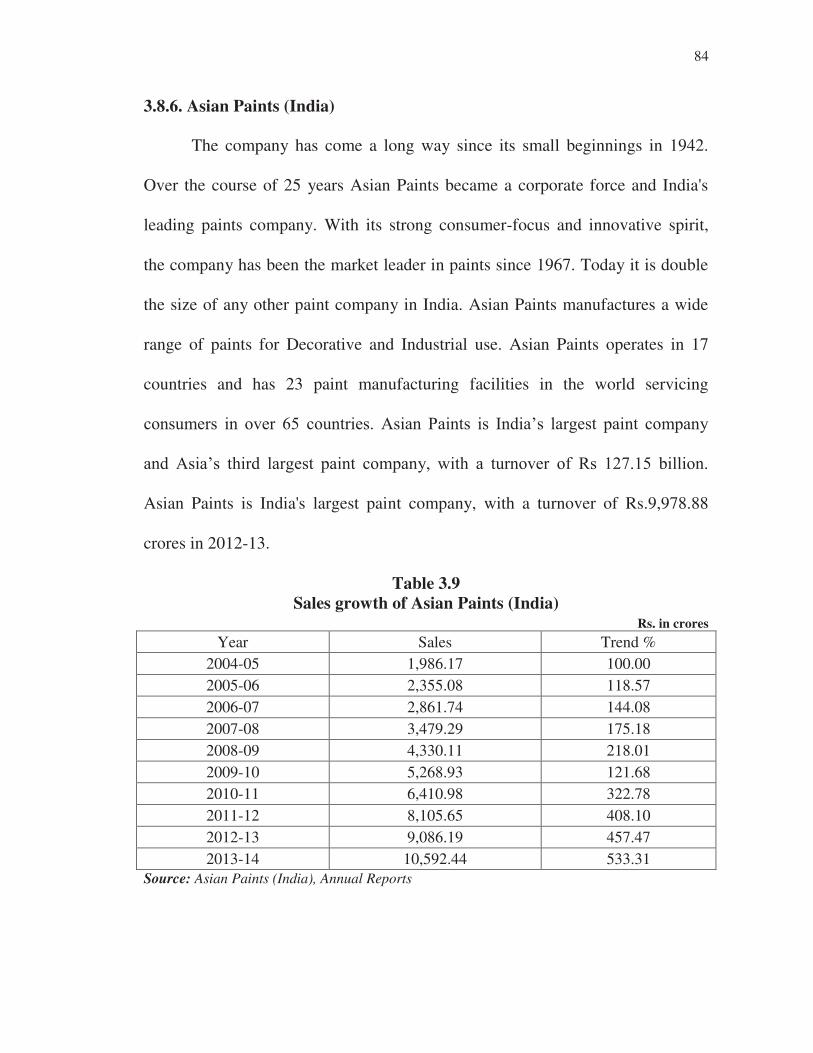
3.8.6. Asian Paints (India)
The company has come a long way since its small beginnings in 1942.
Over the course of 25 years Asian Paints became a corporate force and India's
leading paints company. With its strong consumer-focus and innovative spirit,
the company has been the market leader in paints since 1967. Today it is double
the size of any other paint company in India. Asian Paints manufactures a wide
range of paints for Decorative and Industrial use. Asian Paints operates in 17
countries and has 23 paint manufacturing facilities in the world servicing
!#("29%() /#) !I9%) PM) !"#$%/9(<) 3(/*#) @*/#$() /() .#B/*'() +*%Q9($) 4*/#$) !24*#&)
*#B) 3(/*'() $H/%B) +*%Q9($) 4*/#$) !24*#&F) 1/$H) *) $"%#!I9%) !0) E() :5N<:M) 8/++/!#<)
Asian Paints is India's largest paint company, with a turnover of Rs.9,978.88
crores in 2012-13.
Table 3.9
Sales growth of Asian Paints (India) Rs. in crores
Year Sales Trend %
2004-05 1,986.17 100.00
2005-06 2,355.08 118.57
2006-07 2,861.74 144.08
2007-08 3,479.29 175.18
2008-09 4,330.11 218.01
2009-10 5,268.93 121.68
2010-11 6,410.98 322.78
2011-12 8,105.65 408.10
2012-13 9,086.19 457.47
2013-14 10,592.44 533.31
Source: Asian Paints (India), Annual Reports

85
Table 3.9 explores the sales growth of the Asian paints India which has
continuously increased from Rs. 1,986.17 crores in the year 2004-05 to Rs.
10,592.44 crores in the year 2013-14 with a growth of 533.31 per cent.
3.8.7. Britannia Industries Limited
Britannia Industries Ltd is one of the top biscuit brands in India. The
company was established way back in 1892 at Bangalore and till today has
managed to maintain a distinctive position in the Indian biscuit industry
especially with its most popular brand called Tiger. Britannia is presently one of
the biggest brands in India and also the leading food related brand. It is well
known for its ground breaking approach towards product manufacturing and
marketing. Forbes Global has rated it as one of the Top 200 Small Companies of
the World and it is also the second most trusted brand in India.
Table 3.10
Sales growth of Britannia Industries Limited
Rs. in crores
Year Sales Trend %
2004-05 1,615.4 100.00
2005-06 1,817.9 112.54
2006-07 2,317.1 143.44
2007-08 2,617.65 162.04
2008-09 3,142.89 194.56
2009-10 3,426.64 212.12
2010-11 4,245.98 262.84
2011-12 5,519.96 341.71
2012-13 6,221.82 385.16
2013-14 6,945.52 429.96
Source: Britannia Industries Limited, Annual Reports.

86
Britannia industries limited have witnessed sales growth of more than
fourfold during the period of 2004-05 to 2013-14. The sale had increased from
Rs.1, 615.4 crores to Rs. 6,945.52 crores during the above period of study.
3.8.8. Procter & Gamble (P&G)
William Procter, a candle maker, and James Gamble, a soap maker,
formed the company known as Procter & Gamble in 1837. P&G India is one of
the largest and the fastest growing consumer goods companies established in
1964. P&G India now serves over 650 million consumers across India. Its
presence spans across the Beauty and Grooming segment, the Household Care
segment as well as the Health and Well Being segment, with trusted brands that
are household names across India. These include Vicks, Ariel, Tide, Whisper,
Olay, Gillette, Ambipur, Pampers, Pantene, Oral-B, Head and Shoulders, Wella
and Duracell. P&G operates under three entities in India - two listed entities
R@%! $9%) S) >*28+9) T&Q/9#9) *#B) T9*+$H) ?*%9) A/2/$9BU) *#B) V>/++9$$9) .#B/*)
A/2/$9B'F) *() 19++) *() !#9 100% subsidiary of the parent company in the U.S.
*++9B)V@%! $9%)S)>*28+9)T!29)@%!B" $('<

87
Table 3.11
Sales growth of Procter & Gamble India Limited
Rs. in crores
Year Sales Trend %
2004-05 738.10 100.00
2005-06 596.75 80.85
2006-07 552.95 74.92
2007-08 652.64 88.42
2008-09 773.02 104.73
2009-10 913.51 123.77
2010-11 1,037.0 140.50
2011-12 1,303.84 176.65
2012-13 1,698.58 230.13
2013-14 2063.60 279.58
Source: Procter & Gamble, Annual Reports.
The company has delivered year to year a strong performance with
fantastic sales growth during the above study period. The company has achieved
the sales of Rs. 2063 crores during the year 2013-14 with the growth rate of
279.58 per cent as compared to the base year.
3.8.9. Marico Limited
Marico Limited is one of India's leading consumer products companies
operating in the beauty and wellness space. Marico has nurtured over 25 brands
in the categories of hair care, skin care, health foods and male grooming. Its
India business markets household brands such as Parachute, Parachute
Advanced, Saffola, Hair and Care, Nihar, Livon, Set Wet, Zatak, Mediker,
Revive and Manjal that have added value to the lives of 1 in every 3 Indians. The
International business offers unique brands such as Parachute, Hair Code,

88
Fiancee, Caivil, Hercules, Black Chic, Code 10, Ingwe, X-Men, L'Ovite and
ThuanPhat that are localized to fulfill the lifestyle needs of our international
consumers. During financial year 2013-14 Marico posted a very good amount of
revenue from its operations to the tune of Rs. 4,687 crores, a growth of 10% over
the previous year. The Domestic FMCG Business achieved a turnover of INR
3,519 crores during FY-14, a growth of 8% over FY-13. During the 12 month
period ended March 2014 Parachute along with Nihar improved its market share
2*%Q/#*++&)!I9%)$H9)(*29)49%/!B)+*($)&9*%)$!)MPW<)=*%/ !'()I*+"9)*BB9B)H*/%)!/+)
brands (Parachute Advanced, Nihar Naturals and Hair and Care) grew by 11% in
volumes during the year. Marico participates in the INR 2800 Crore (USD 466
million) branded coconut oil market through Parachute and Nihar. The table
showing the sales growth of Marico industries is presented as below.
Table 3.12
Growth of Marico Limited Rs. in crores
Year Sales Trend %
2004-05 1,007 100.00
2005-06 1,144 113.60
2006-07 1,557 154.62
2007-08 1,905 189.18
2008-09 2,388 237.14
2009-10 2,661 264.25
2010-11 3,135 311.32
2011-12 3,980 395.23
2012-13 4,596 456.41
2013-14 4,687 465.44
Source: Marico Limited, Annual Reports.
89
The sales Marico limited has increased from Rs.1,007 crores to 4,687
crores during the period from 2004-05 to 2013-14. It is more than four and half
times increase during the period of study.
3.8.10. Colgate-Palmolive
Colgate-Palmolive (India) Limited has been ruling the oral health care
industry in India. Colgate produces a wide range of oral health care products
which include toothpastes and toothbrushes and toothpowder. Colgate Palmolive
is a company of repute for providing scientifically proven oral care products that
come along with a host of benefits. According to a survey conducted by Brand
Equity Colgate has been ranked India's Most Trusted Brand for four consecutive
years.
LH9) !24*#&'() 8"(/#9(() !#$/#"9() $!) Qrow strongly in double digits. Sales for
the year 2013-14 increased by 15 per cent at 3,629.13 crores against 3,324.20
crore during the previous year. The toothpaste business registered a very strong
volume of growth of 9 per cent during the year. The company strengthened its
leadership position in the toothpaste category by attaining 57.1 per cent from
55.4 per cent. Similarly, the market share in toothbrush category had grown to
42.3 per cent from 41.3 per cent (2013-14).

90
Table 3.13
Sales Growth of Colgate-Palmolive (India) Limited Rs. in crores
Year Sales Trend %
2004-05 1,072.53 100.00
2005-06 1,217.50 113.52
2006-07 1,385.38 129.17
2007-08 1,553.21 144.82
2008-09 1,758.16 163.93
2009-10 2,024.65 188.77
2010-11 2,317.40 216.07
2011-12 2,736.17 255.11
2012-13 3,324.20 309.94
2013-14 3,629.13 338.37
Source: Colgate-Palmolive (India) limited, Annual Reports.
The sales growth of the Colgate-Palmolive (India) limited has increased
from Rs.1,072.53 crores to Rs.3,629.13 crores during the period of 2004-05 to
2013-14 with the growth rate of 338.37 per cent as compared to the base year.
3.9 SUMMARY
The Indian fast moving consumer goods industry witnessed a steady
growth trajectory and the Overall FMCGs market is expected to increase at a
CAGR of 14.7 per cent to touch USD110.4 billion during 202073
.
73
Source: World Bank, Emami Reports, Dabur Reports, AC Nielsen, McKinsey Global Institute (MGI)
titled The Bird of Gold, Booz & Company, Aranca Research