chapter - iii indian construction...
TRANSCRIPT
72
CHAPTER - III
INDIAN CONSTRUCTION INDUSTRY
Construction activity contributes to the economic development of a
country. The construction industry is the second largest economic activity
in India and plays an important role in the nation‟s economy. The
construction sector in India has an average annual investment of over
Rs.3billion. At present, the sector accounts for nearly 12 per cent of the
Indian GDP, making it the second biggest contributor after agriculture.
The sector is also the second biggest employer. Currently, it employs,
directly or indirectly, nearly 32 million workers or 14 per cent of the total
employable population of India. Further, construction industry is a
vanguard activity of several other key sectors of the economy whose
performance is dependent on the satisfactory performance of the
construction industry. For instance, the sector creates a multiplier effect
of between 1.8 and 2 percent on core industries such as steel, cement,
aluminum and petroleum.
The construction industry has been a significant contributor to
India‟s GDP growth of 8-10 per cent. Its present growth at 15-20 per
cent which seems to get stronger by the day, stems from rising demand
for quality infrastructure and real estate in residential and industrial
sector.
By 2020, it is expected that 47 percent of Indian‟s will be between
15 and 59 and India will have the world‟s largest population of workers
and consumers. Increased working – age population, coupled with higher

73
purchasing power and increased consumerism, will spur real estate
investments across all commercial, residential and retail sub-sectors.
According to a recent population analysis conducted by A. T.
Kearney, the middle and upper income population of India is expected to
rise at a CAGR of 14 percent from 51 million in 2000 to 373 million in
2015. Assuming that 25 per cent of this increasingly prosperous
population will require independent housing, there will be a demand for
about 20 million sq. ft. per annum of residential development, along with
the corresponding demand for retail, commercial and industrial
development (Nair, 2007)1.
Table 3.1
Construction activity in selected countries: year 1980
SL
No.
Countries Value added to
GDP ( per cent)
(percentage)
Share of gross
fixed capital
formation
(percentage)
Developed
countries
1. France 5 56
2. Italy 6 57
3. Japan 8 67
4. U.K 6 48
5. USA 4 55
Developing
countries
6. Kenya 5 48
7. South Korea 6 63
8. Mexico 5 57
9. Pakistan 5 60
10. India (approximate) 5 44
Source: Engineering News Record (ENR), Report (1993).
In Kerala, there is a huge unmet demand in the residential
construction sector. The coming into the scene of large number of
developers from outside has enlivened the sector in Kerala and this will

74
certainly augment the supply side of the business cycle. Because of high
returns, a large volume of funds flows into the sector. This naturally will
push the developmental activities of several other sectors and of several
related segments and the supply of both commercial and residential
properties.
The construction sector is a part of the service industry. The
services can broadly be classified into four segments: infrastructural,
industrial, residential and commercial. Nearly 54 percent of construction
activity is generated in various infrastructure sectors. This is followed by
other industrial activity (36 per cent), residential activity (5 per cent) and
commercial activity (5 per cent).
Major construction work includes setting up of road and highway
projects, powerplants, railway lines, mineral plants and dams,industry
irrigation and urban infrastructure projects.
Table No.3.2
India’s infrastructure development expenditure for the period
1990-91 to 1999-2005
Year Infrastructure expenditure (in billion Rs.)
1991-92 510954
1995-96 1073271
1999-2000 1761838
2000-01 1902999
2001-02 2081474
2002-03 2254888
2003-04 2519785
2004-05 2830465
Source: Infrastructure development report 2005
These works are undertaken through many entities including
construction contractors, equipment suppliers, material suppliers and
75
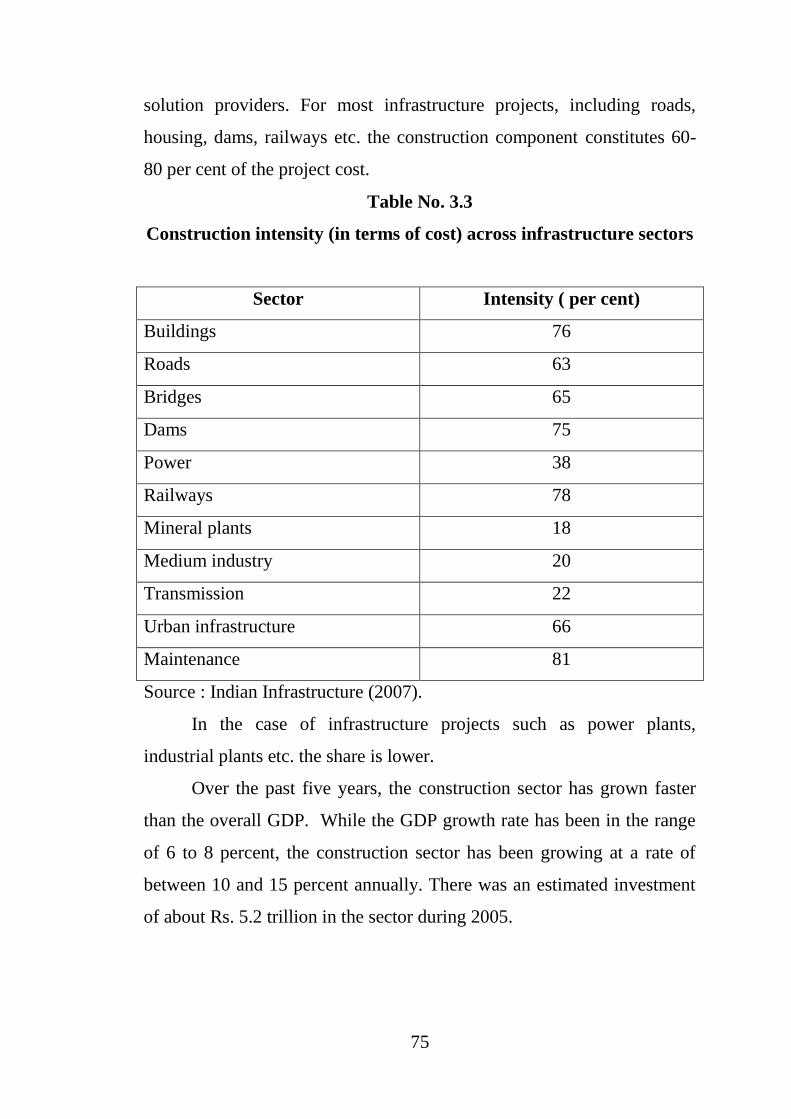
solution providers. For most infrastructure projects, including roads,
housing, dams, railways etc. the construction component constitutes 60-
80 per cent of the project cost.
Table No. 3.3
Construction intensity (in terms of cost) across infrastructure sectors
Sector Intensity ( per cent)
Buildings 76
Roads 63
Bridges 65
Dams 75
Power 38
Railways 78
Mineral plants 18
Medium industry 20
Transmission 22
Urban infrastructure 66
Maintenance 81
Source : Indian Infrastructure (2007).
In the case of infrastructure projects such as power plants,
industrial plants etc. the share is lower.
Over the past five years, the construction sector has grown faster
than the overall GDP. While the GDP growth rate has been in the range
of 6 to 8 percent, the construction sector has been growing at a rate of
between 10 and 15 percent annually. There was an estimated investment
of about Rs. 5.2 trillion in the sector during 2005.
1
76
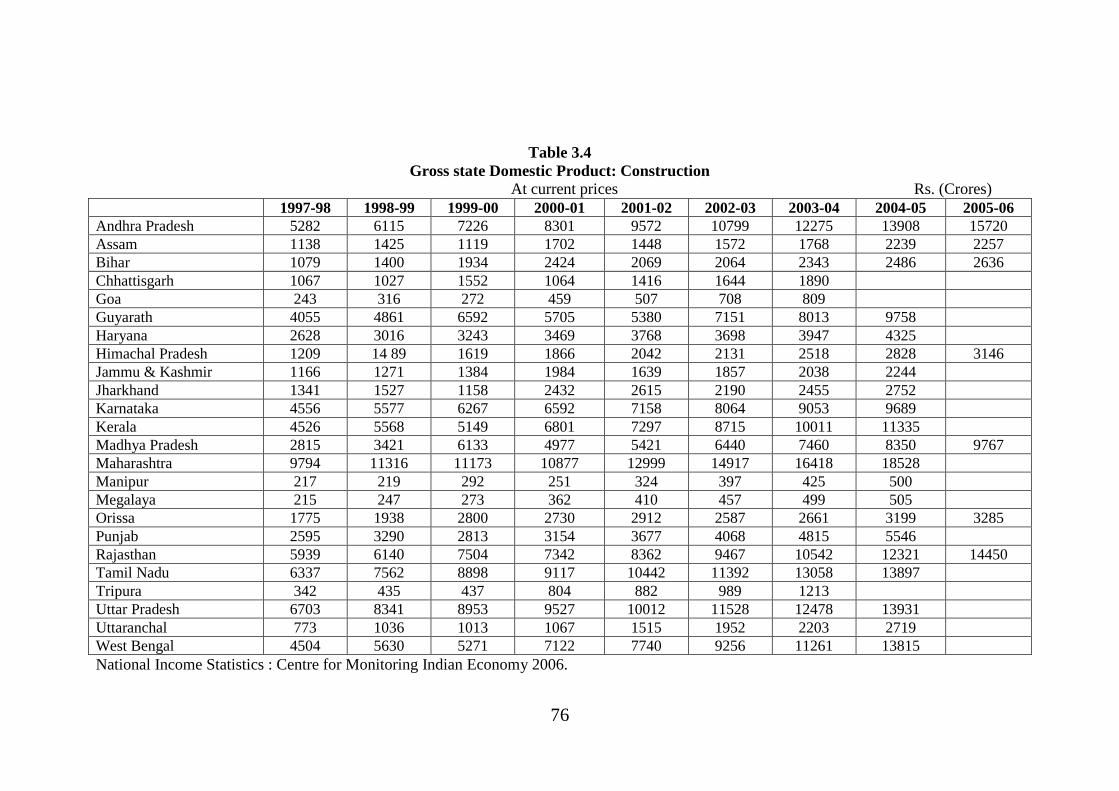
Table 3.4
Gross state Domestic Product: Construction
At current prices Rs. (Crores)
1997-98 1998-99 1999-00 2000-01 2001-02 2002-03 2003-04 2004-05 2005-06
Andhra Pradesh 5282 6115 7226 8301 9572 10799 12275 13908 15720
Assam 1138 1425 1119 1702 1448 1572 1768 2239 2257
Bihar 1079 1400 1934 2424 2069 2064 2343 2486 2636
Chhattisgarh 1067 1027 1552 1064 1416 1644 1890
Goa 243 316 272 459 507 708 809
Guyarath 4055 4861 6592 5705 5380 7151 8013 9758
Haryana 2628 3016 3243 3469 3768 3698 3947 4325
Himachal Pradesh 1209 14 89 1619 1866 2042 2131 2518 2828 3146
Jammu & Kashmir 1166 1271 1384 1984 1639 1857 2038 2244
Jharkhand 1341 1527 1158 2432 2615 2190 2455 2752
Karnataka 4556 5577 6267 6592 7158 8064 9053 9689
Kerala 4526 5568 5149 6801 7297 8715 10011 11335
Madhya Pradesh 2815 3421 6133 4977 5421 6440 7460 8350 9767
Maharashtra 9794 11316 11173 10877 12999 14917 16418 18528
Manipur 217 219 292 251 324 397 425 500
Megalaya 215 247 273 362 410 457 499 505
Orissa 1775 1938 2800 2730 2912 2587 2661 3199 3285
Punjab 2595 3290 2813 3154 3677 4068 4815 5546
Rajasthan 5939 6140 7504 7342 8362 9467 10542 12321 14450
Tamil Nadu 6337 7562 8898 9117 10442 11392 13058 13897
Tripura 342 435 437 804 882 989 1213
Uttar Pradesh 6703 8341 8953 9527 10012 11528 12478 13931
Uttaranchal 773 1036 1013 1067 1515 1952 2203 2719
West Bengal 4504 5630 5271 7122 7740 9256 11261 13815
National Income Statistics : Centre for Monitoring Indian Economy 2006.
77
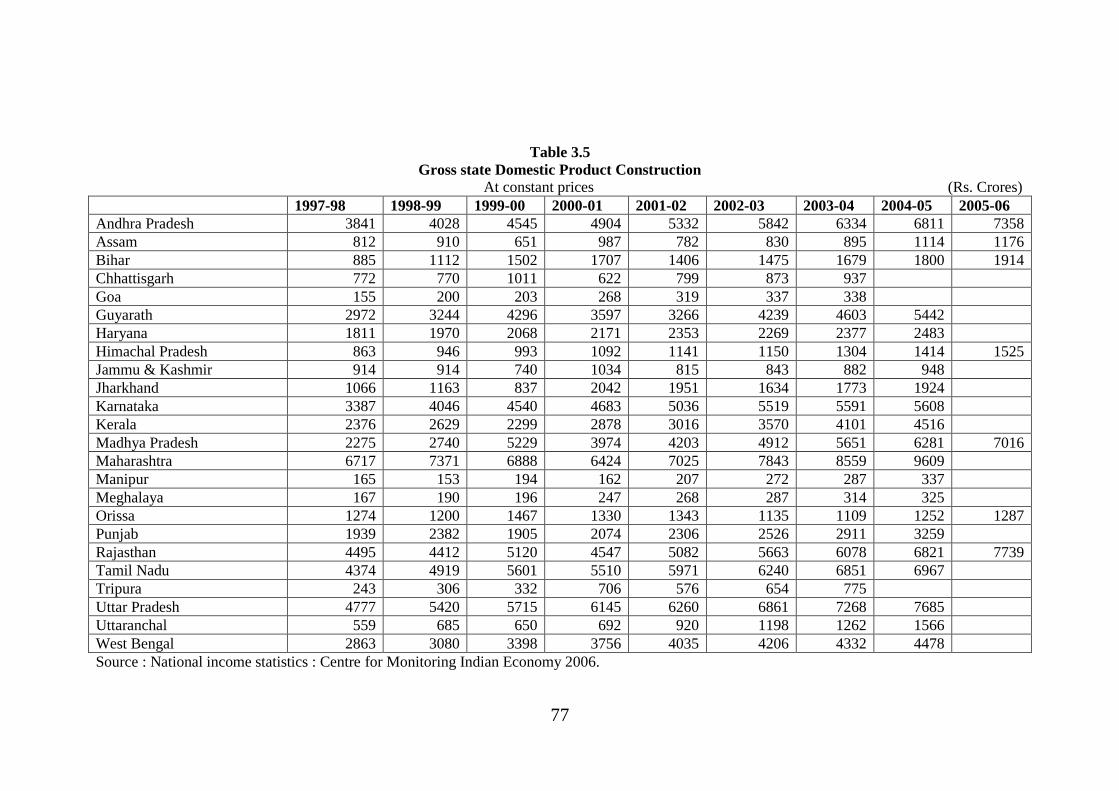
Table 3.5
Gross state Domestic Product Construction
At constant prices (Rs. Crores)
1997-98 1998-99 1999-00 2000-01 2001-02 2002-03 2003-04 2004-05 2005-06
Andhra Pradesh 3841 4028 4545 4904 5332 5842 6334 6811 7358
Assam 812 910 651 987 782 830 895 1114 1176
Bihar 885 1112 1502 1707 1406 1475 1679 1800 1914
Chhattisgarh 772 770 1011 622 799 873 937
Goa 155 200 203 268 319 337 338
Guyarath 2972 3244 4296 3597 3266 4239 4603 5442
Haryana 1811 1970 2068 2171 2353 2269 2377 2483
Himachal Pradesh 863 946 993 1092 1141 1150 1304 1414 1525
Jammu & Kashmir 914 914 740 1034 815 843 882 948
Jharkhand 1066 1163 837 2042 1951 1634 1773 1924
Karnataka 3387 4046 4540 4683 5036 5519 5591 5608
Kerala 2376 2629 2299 2878 3016 3570 4101 4516
Madhya Pradesh 2275 2740 5229 3974 4203 4912 5651 6281 7016
Maharashtra 6717 7371 6888 6424 7025 7843 8559 9609
Manipur 165 153 194 162 207 272 287 337
Meghalaya 167 190 196 247 268 287 314 325
Orissa 1274 1200 1467 1330 1343 1135 1109 1252 1287
Punjab 1939 2382 1905 2074 2306 2526 2911 3259
Rajasthan 4495 4412 5120 4547 5082 5663 6078 6821 7739
Tamil Nadu 4374 4919 5601 5510 5971 6240 6851 6967
Tripura 243 306 332 706 576 654 775
Uttar Pradesh 4777 5420 5715 6145 6260 6861 7268 7685
Uttaranchal 559 685 650 692 920 1198 1262 1566
West Bengal 2863 3080 3398 3756 4035 4206 4332 4478
Source : National income statistics : Centre for Monitoring Indian Economy 2006.
78
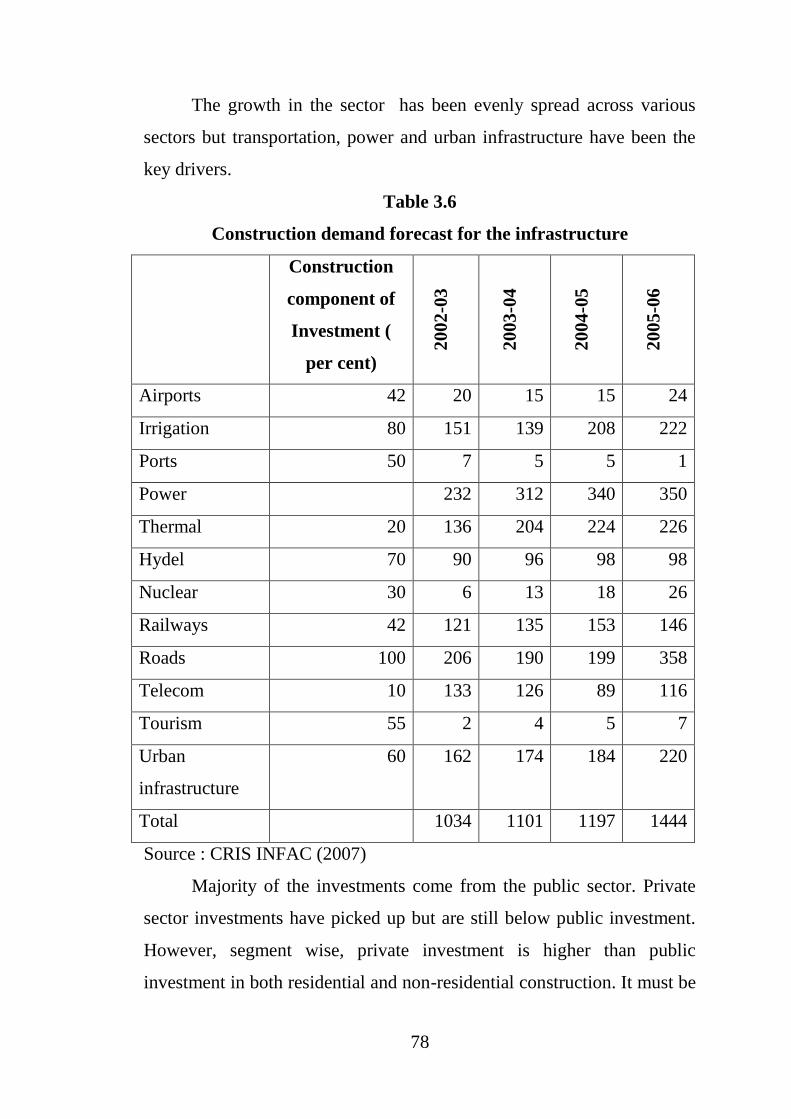
The growth in the sector has been evenly spread across various
sectors but transportation, power and urban infrastructure have been the
key drivers.
Table 3.6
Construction demand forecast for the infrastructure
Construction
component of
Investment (
per cent)
2002
-03
2003
-04
2004
-05
2005
-06
Airports 42 20 15 15 24
Irrigation 80 151 139 208 222
Ports 50 7 5 5 1
Power 232 312 340 350
Thermal 20 136 204 224 226
Hydel 70 90 96 98 98
Nuclear 30 6 13 18 26
Railways 42 121 135 153 146
Roads 100 206 190 199 358
Telecom 10 133 126 89 116
Tourism 55 2 4 5 7
Urban
infrastructure
60 162 174 184 220
Total 1034 1101 1197 1444
Source : CRIS INFAC (2007)
Majority of the investments come from the public sector. Private
sector investments have picked up but are still below public investment.
However, segment wise, private investment is higher than public
investment in both residential and non-residential construction. It must be
79
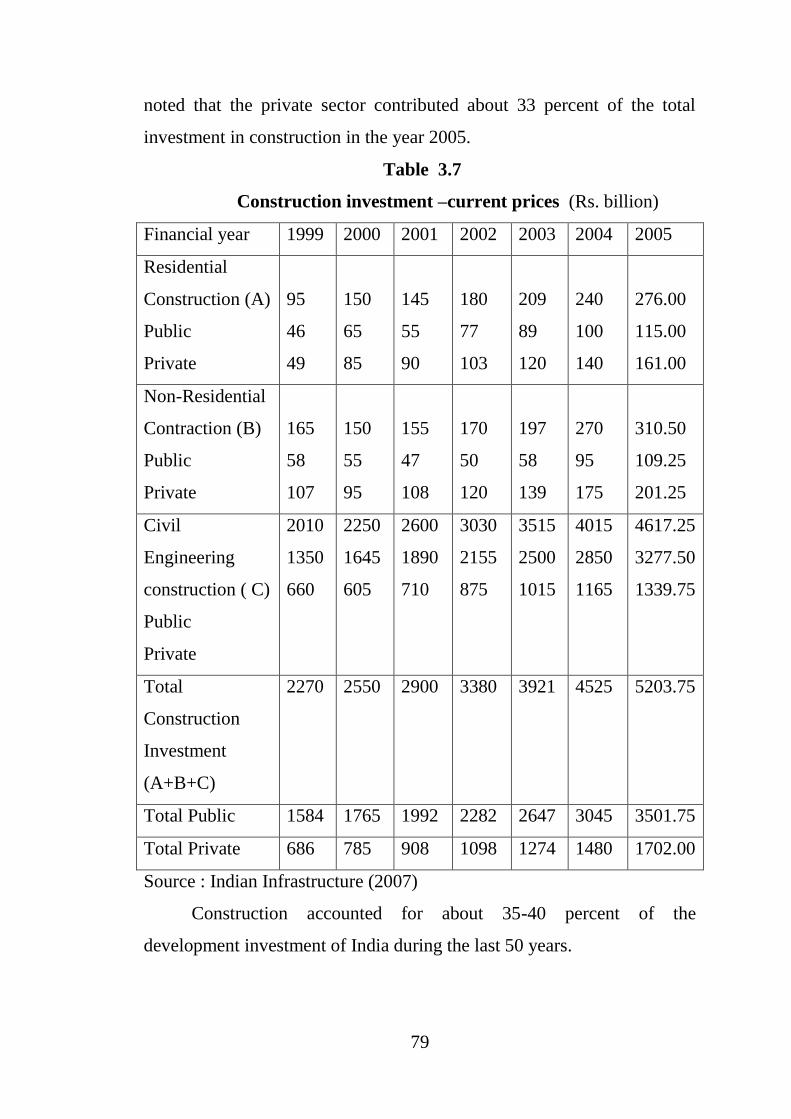
noted that the private sector contributed about 33 percent of the total
investment in construction in the year 2005.
Table 3.7
Construction investment –current prices (Rs. billion)
Financial year 1999 2000 2001 2002 2003 2004 2005
Residential
Construction (A)
Public
Private
95
46
49
150
65
85
145
55
90
180
77
103
209
89
120
240
100
140
276.00
115.00
161.00
Non-Residential
Contraction (B)
Public
Private
165
58
107
150
55
95
155
47
108
170
50
120
197
58
139
270
95
175
310.50
109.25
201.25
Civil
Engineering
construction ( C)
Public
Private
2010
1350
660
2250
1645
605
2600
1890
710
3030
2155
875
3515
2500
1015
4015
2850
1165
4617.25
3277.50
1339.75
Total
Construction
Investment
(A+B+C)
2270 2550 2900 3380 3921 4525 5203.75
Total Public 1584 1765 1992 2282 2647 3045 3501.75
Total Private 686 785 908 1098 1274 1480 1702.00
Source : Indian Infrastructure (2007)
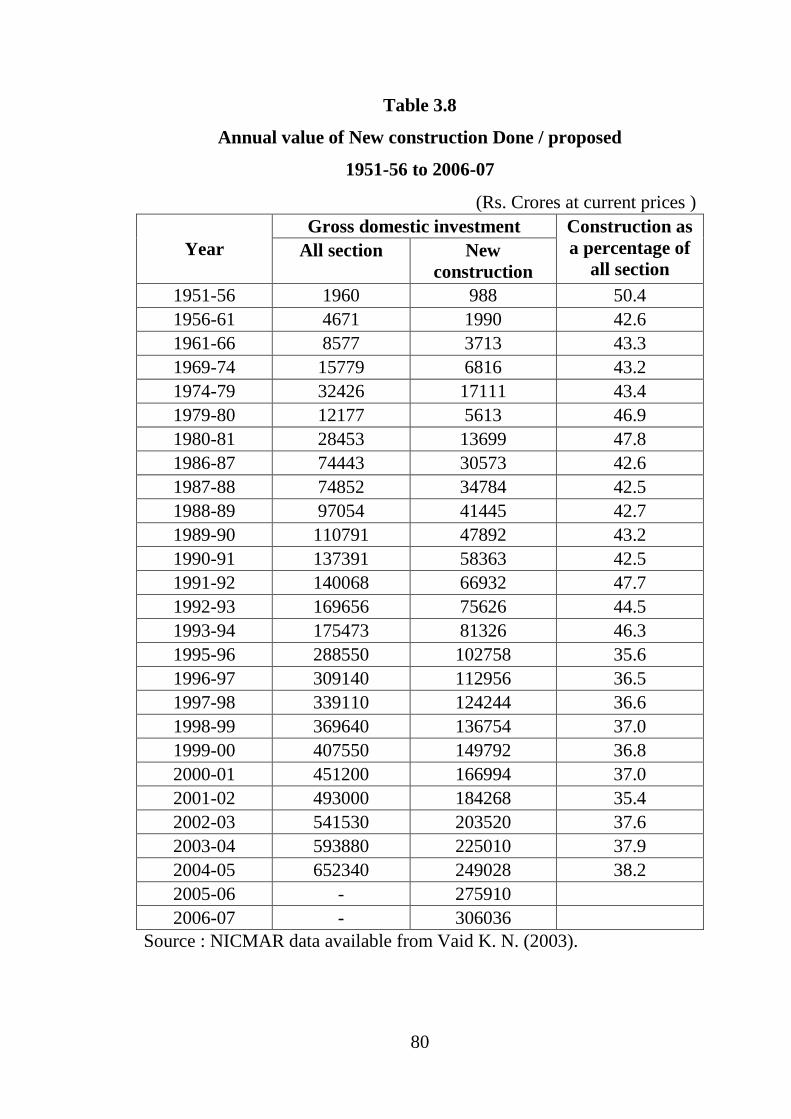
Construction accounted for about 35-40 percent of the
development investment of India during the last 50 years.
80
Table 3.8
Annual value of New construction Done / proposed
1951-56 to 2006-07
(Rs. Crores at current prices )
Year
Gross domestic investment Construction as
a percentage of
all section All section New
construction
1951-56 1960 988 50.4
1956-61 4671 1990 42.6
1961-66 8577 3713 43.3
1969-74 15779 6816 43.2
1974-79 32426 17111 43.4
1979-80 12177 5613 46.9
1980-81 28453 13699 47.8
1986-87 74443 30573 42.6
1987-88 74852 34784 42.5
1988-89 97054 41445 42.7
1989-90 110791 47892 43.2
1990-91 137391 58363 42.5
1991-92 140068 66932 47.7
1992-93 169656 75626 44.5
1993-94 175473 81326 46.3
1995-96 288550 102758 35.6
1996-97 309140 112956 36.5
1997-98 339110 124244 36.6
1998-99 369640 136754 37.0
1999-00 407550 149792 36.8
2000-01 451200 166994 37.0
2001-02 493000 184268 35.4
2002-03 541530 203520 37.6
2003-04 593880 225010 37.9
2004-05 652340 249028 38.2
2005-06 - 275910
2006-07 - 306036
Source : NICMAR data available from Vaid K. N. (2003).
81
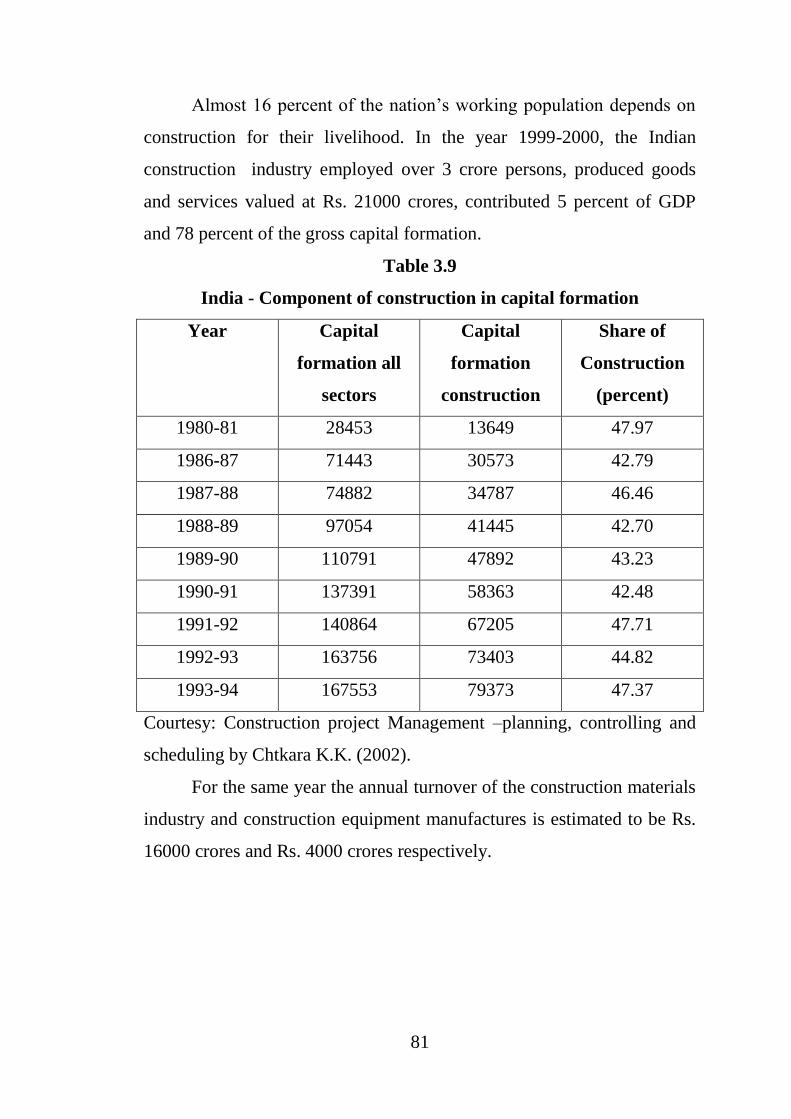
Almost 16 percent of the nation‟s working population depends on
construction for their livelihood. In the year 1999-2000, the Indian
construction industry employed over 3 crore persons, produced goods
and services valued at Rs. 21000 crores, contributed 5 percent of GDP
and 78 percent of the gross capital formation.
Table 3.9
India - Component of construction in capital formation
Year Capital
formation all
sectors
Capital
formation
construction
Share of
Construction
(percent)
1980-81 28453 13649 47.97
1986-87 71443 30573 42.79
1987-88 74882 34787 46.46
1988-89 97054 41445 42.70
1989-90 110791 47892 43.23
1990-91 137391 58363 42.48
1991-92 140864 67205 47.71
1992-93 163756 73403 44.82
1993-94 167553 79373 47.37
Courtesy: Construction project Management –planning, controlling and
scheduling by Chtkara K.K. (2002).
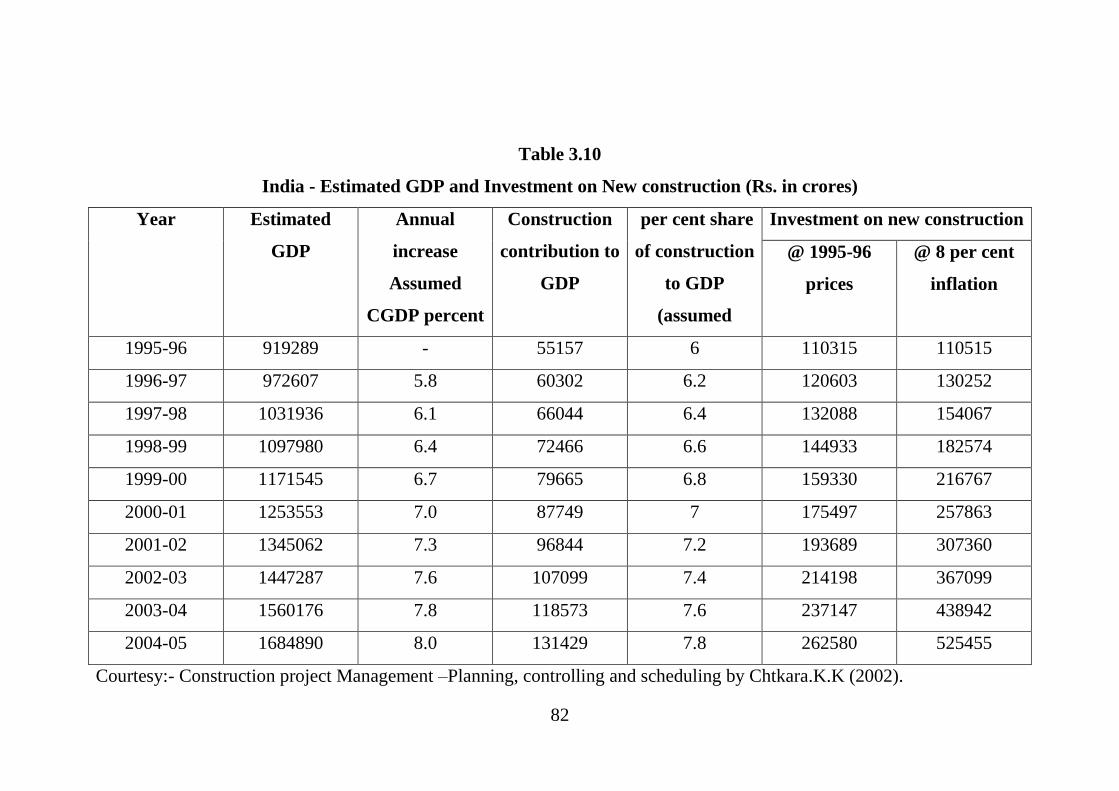
For the same year the annual turnover of the construction materials
industry and construction equipment manufactures is estimated to be Rs.
16000 crores and Rs. 4000 crores respectively.
82
Table 3.10
India - Estimated GDP and Investment on New construction (Rs. in crores)
Year Estimated
GDP
Annual
increase
Assumed
CGDP percent
Construction
contribution to
GDP
per cent share
of construction
to GDP
(assumed
Investment on new construction
@ 1995-96
prices
@ 8 per cent
inflation
1995-96 919289 - 55157 6 110315 110515
1996-97 972607 5.8 60302 6.2 120603 130252
1997-98 1031936 6.1 66044 6.4 132088 154067
1998-99 1097980 6.4 72466 6.6 144933 182574
1999-00 1171545 6.7 79665 6.8 159330 216767
2000-01 1253553 7.0 87749 7 175497 257863
2001-02 1345062 7.3 96844 7.2 193689 307360
2002-03 1447287 7.6 107099 7.4 214198 367099
2003-04 1560176 7.8 118573 7.6 237147 438942
2004-05 1684890 8.0 131429 7.8 262580 525455
Courtesy:- Construction project Management –Planning, controlling and scheduling by Chtkara.K.K (2002).
83
The construction industry is an essential contributor to the process
of development. Roads, dams, irrigation works, schools, houses, hospitals
and other construction works are the physical foundations on which
development efforts and improved living standards are established. The
above mentioned products of the construction industry are investments or
capital goods, their value is high in relation to the income of the
purchaser. For the individual consumer, for example, the purchase of
house will usually entail the expenditure of several times of his annual
income. Similarly, the erection of a factory by a manufacturing firm will
be a large expenditure in relation to the running costs of production as
well as the annual income derived from it. Consequently, the products of
the construction industry, with the exception of repair and maintenance,
are paid for from savings i.e. the purchasing power which has accrued but
not used in the past. These savings may either belong to the ultimate
owner of the construction industry or borrowed from elsewhere. Thus,
construction industry thrives on the savings and investment of the
economy and has linkages with the rest of the economy in terms of
generation of output and employment.
The size of the construction industry is important to any nation as
changes in its output affect the size of the national product both directly
and indirectly. If the output of the industry is down, total investment in
the economy goes down. A change in the level of construction industry
output also affects the general employment levels and incomes of the
people. Governments influence construction industry both from demand
and supply sides. The Government is one of the biggest clients of
construction industry and as such it is the initiator of most of the
infrastructure development projects, civil and social services. A
Government uses investment in construction to regulate the economy as
well as to introduce the desired changes in it. The construction activity is
84
perhaps the first activity to be cut during a recession. A buoyancy in
construction can make the economy healthy. Thus, Government as client,
as a regulator of the industry and as initiator of economic changes
through construction, plays a significant role in this industry.
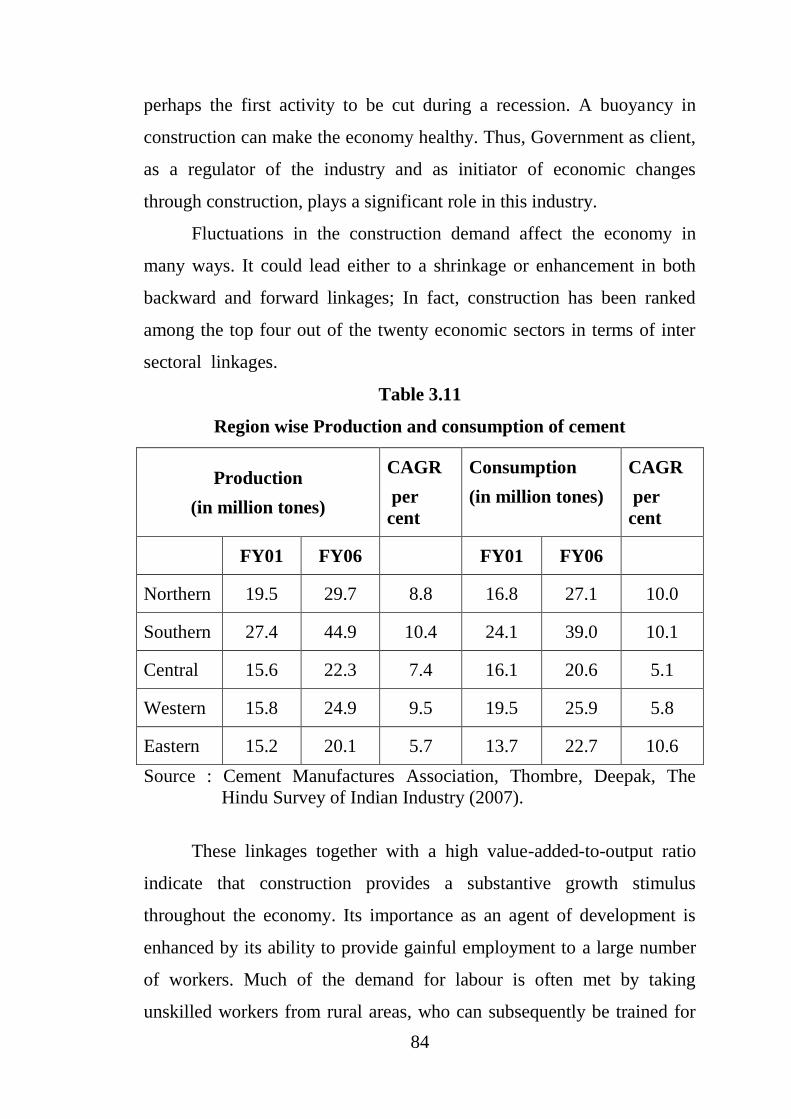
Fluctuations in the construction demand affect the economy in
many ways. It could lead either to a shrinkage or enhancement in both
backward and forward linkages; In fact, construction has been ranked
among the top four out of the twenty economic sectors in terms of inter
sectoral linkages.
Table 3.11
Region wise Production and consumption of cement
Production
(in million tones)
CAGR
per
cent
Consumption
(in million tones)
CAGR
per
cent
FY01 FY06 FY01 FY06
Northern 19.5 29.7 8.8 16.8 27.1 10.0
Southern 27.4 44.9 10.4 24.1 39.0 10.1
Central 15.6 22.3 7.4 16.1 20.6 5.1
Western 15.8 24.9 9.5 19.5 25.9 5.8
Eastern 15.2 20.1 5.7 13.7 22.7 10.6
Source : Cement Manufactures Association, Thombre, Deepak, The
Hindu Survey of Indian Industry (2007).
These linkages together with a high value-added-to-output ratio
indicate that construction provides a substantive growth stimulus
throughout the economy. Its importance as an agent of development is
enhanced by its ability to provide gainful employment to a large number
of workers. Much of the demand for labour is often met by taking
unskilled workers from rural areas, who can subsequently be trained for
85
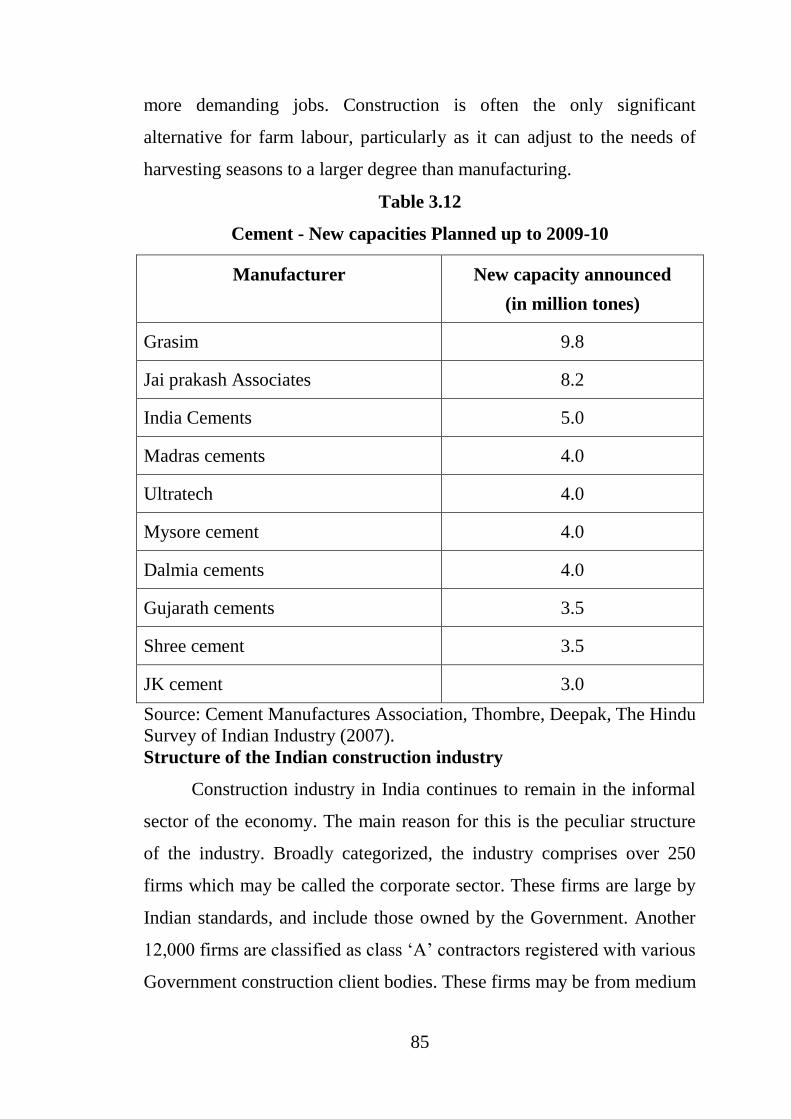
more demanding jobs. Construction is often the only significant
alternative for farm labour, particularly as it can adjust to the needs of
harvesting seasons to a larger degree than manufacturing.
Table 3.12
Cement - New capacities Planned up to 2009-10
Manufacturer New capacity announced
(in million tones)
Grasim 9.8
Jai prakash Associates 8.2
India Cements 5.0
Madras cements 4.0
Ultratech 4.0
Mysore cement 4.0
Dalmia cements 4.0
Gujarath cements 3.5
Shree cement 3.5
JK cement 3.0
Source: Cement Manufactures Association, Thombre, Deepak, The Hindu
Survey of Indian Industry (2007).
Structure of the Indian construction industry
Construction industry in India continues to remain in the informal
sector of the economy. The main reason for this is the peculiar structure
of the industry. Broadly categorized, the industry comprises over 250
firms which may be called the corporate sector. These firms are large by
Indian standards, and include those owned by the Government. Another
12,000 firms are classified as class „A‟ contractors registered with various
Government construction client bodies. These firms may be from medium

86
to large size in terms of volume of business turnover. Then, there are six
hundred thousand small firms of contractors/sub-contractors who
compete for small jobs or work as sub-contractors of prime or other
contractors. Whereas there are numerous speciality contractors in this
category, most others work at low-end technology jobs of small value.
(Vaid, 2003)2.
Table 3.13
Steel Consumption in different regions of the world 2005-07
Million metric tones (mmt)
of finished steel
Change per year
per cent
2005 2006 2007 2005-06 2006-07
EU(15) 139.4 150.0 147.7 7.6 -1.5
EU(25) 158.8 171.5 169.6 8.0 -1.1
Other Europe 29.3 32.1 34.0 9.5 6.0
CIS 43.5 46.5 50.9 7.0 9.4
NAFTA 139.7 151.8 150.8 8.7 -0.7
South America 32.3 36.0 38.6 11.6 7.1
Africa 22.4 24.6 25.7 10.0 4.4
Middle East 34.0 37.3 40.6 9.6 8.9
Japan 78.0 78.6 80.8 0.8 2.8
India 38.1 41.9 45.7 10.0 9.1
Rest of Asia
(Excl, China)
117.8 118.5 121.8 -0.6 2.8
Australia New
Zealand
7.9 7.8 7.9 1.6 1.3
World
(excl. China)
701.8 746.7 766.4 6.4 2.6
China 327.0 374.0 413.0 14.4 10.4
World 1028.8 1120.7 1179.4 8.9 5.2
Source : International Iron & Steel Institute, Pye Darren, Hindu Survey of
Indian Industry (2007).
87
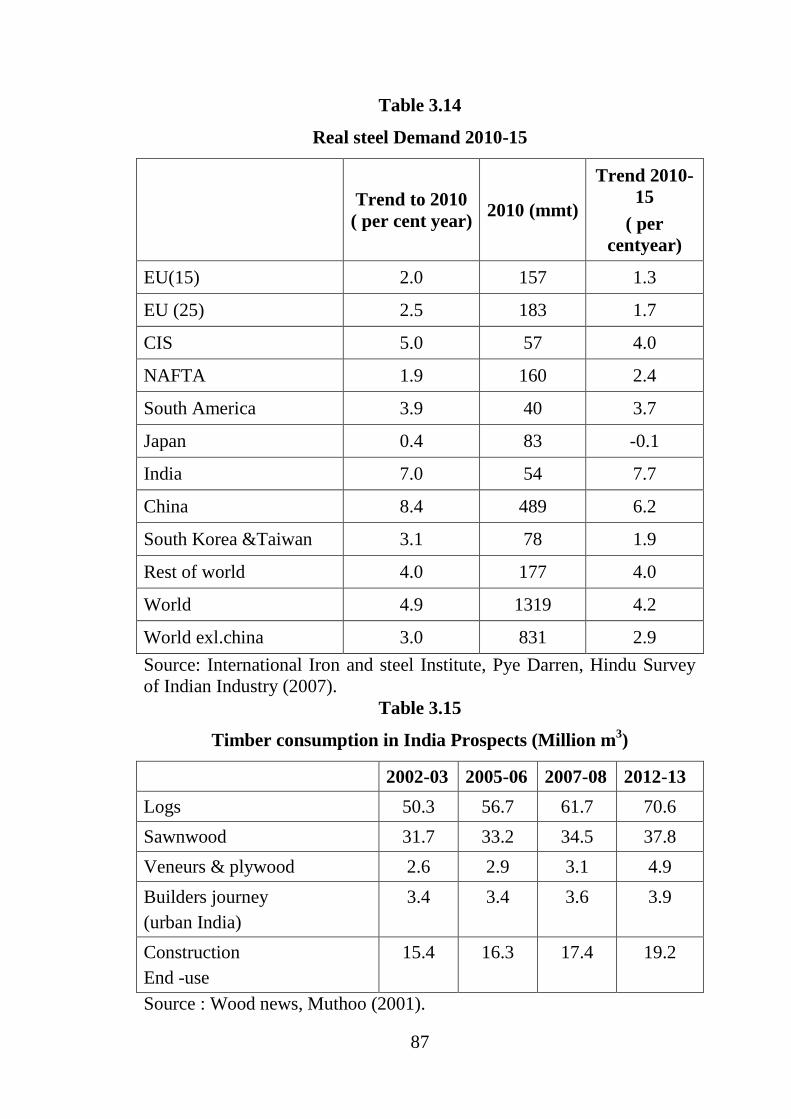
Table 3.14
Real steel Demand 2010-15
Trend to 2010
( per cent year) 2010 (mmt)
Trend 2010-
15
( per
centyear)
EU(15) 2.0 157 1.3
EU (25) 2.5 183 1.7
CIS 5.0 57 4.0
NAFTA 1.9 160 2.4
South America 3.9 40 3.7
Japan 0.4 83 -0.1
India 7.0 54 7.7
China 8.4 489 6.2
South Korea &Taiwan 3.1 78 1.9
Rest of world 4.0 177 4.0
World 4.9 1319 4.2
World exl.china 3.0 831 2.9
Source: International Iron and steel Institute, Pye Darren, Hindu Survey
of Indian Industry (2007).
Table 3.15
Timber consumption in India Prospects (Million m3)
2002-03 2005-06 2007-08 2012-13
Logs 50.3 56.7 61.7 70.6
Sawnwood 31.7 33.2 34.5 37.8
Veneurs & plywood 2.6 2.9 3.1 4.9
Builders journey
(urban India)
3.4 3.4 3.6 3.9
Construction
End -use
15.4 16.3 17.4 19.2
Source : Wood news, Muthoo (2001).

88
The near amorphous structure of the industry has both the positive
and negative implications. It stands in the way of skill development of the
construction labour force and technical upgradation of the construction
process. These problems could not have existed had the industry been
organized differently.
In practice, any construction activity in general or a building
construction activity in particular takes place in the following manner.
The construction industry (barring real estate developers) does not really
sell a tangible product, it sells a service. The services that it may provide
are determined by its clients and are performed at a time and place
specified by them. Contractors have little control on the demand for
construction services nor can they stimulate it. They do not even set rates
for their service as the same is done by clients. Further, contractors may
devise more efficient methods of building, but advances in materials and
machinery are out of their control. The financing of the construction
services is also outside the control of contractors. It is done by the client
who commissioned the service, and till recently the mode and periodicity
of payments were decided unilaterally by the client. Negotiated contract
terms are agreed upon in very limited number of projects. Thus a vast
majority of firms continue to operate in a product market where they have
no control over demand, technology, materials, workplace, finance and
labour supply. Consequently, their concern is to finish the job in hand and
not to bother about other things around them in the industry.
Consultants, workers and inputs industries are the other
participants in the construction industry. Architectural and engineering
consultant firms play an important role in construction process. Even
though there are thousands of consultants in our country, consulting firms
as formal organizations of appreciable size number to 2000. Construction
89
materials manufactures are also 4000 in the organized sector. The number
of construction equipment manufactures is 800. (Vaid, 2003)3.
Small size of firms is a handicap for skill formation and technology
upgradation in the construction industry. They lack a long term
perspective. As such they do not generally invest in plant and machinery
or Research and Development. They do not spend money on training their
workers because contractors fear that the workers would leave them on
the completion of the job. Small firms exhibit a very low level of
management ability. It may be admitted that the structure of the industry
is the direct result of the conditions prevailing in the market. It can also
be argued that the existence of a large number of small firms provides a
useful structural framework for its continuation.
History of Growth of construction
The Early Period
Shilpshastra or architecture was a highly developed profession in
ancient India. Rig-Veda contains many references about this subject.
Manusmriti contains the dos and donts in construction. Kautilya‟s
Arthashastra gives guidelines to kings and administrators regarding their
duties to people for the provision of civic infrastructure. Though the
formal relationship of client-consultant-contractor-input supplier in the
modern sense might not have existed, the parties to the construction
process were the same. The design and construction always remained a
specialists function to be hired for a fee. The Indus Valley Civilization
that flourished roughly between 3250 to 2750 B.C had very advanced
architectural city planning and construction capabilities.
The Muslim Period
The rich traditions of architecture, irrigation and roadways were
continued by the Muslim rulers of Delhi. King Feroze Tugluk is called
90
the „Father of irrigation‟. The Mughal emperors were great builders and
the accounts of their activities have been well chronicled.
The British period
Construction was a hectic activity during the British period. But
their priorities were different from the previous rulers. They required
dwellings and offices suitable to their life style, roads and transportations
for easy and fast movement of British officers and Indian raw materials to
ports for shipment. Administrative convenience, commercial interest and
mobilization of investments from local areas were the primary
considerations of the British East India company. Since construction was
primarily a department activity under British, private consultants and
contractors never grew (Vaid, 2003)4.
Independence and After
Construction continued to be a departmental activity for some more
years after independence. The role of the private sector was limited to
contracting only. Public sector consulting firms were established in the
late sixties.
Although construction contracting in the modern sense commenced
in India in 1860s, the British Government favoured only the British
contractors. Indian contractors were given some sub-contracting and low-
end jobs. The situation changed after independence.
The Builders Association of India (BAI) was formally incorporated
in 1944. From 1950 onwards, the Association has been lobbying with the
central and state governments for getting sanctions for many construction
related activities and aspects.
Realizing the importance of construction to national development,
the Planning Commission had set up a Construction Economics Division
within its organization at the start of the second Five year Plan. But it
continued till the mid-seventies.
91
Another significant development in the construction took place in
1976 when the BAI established the Overseas Construction Council of
India (OCCI) to facilitate construction project exports and render help to
project exporting firms. The OCCI was the designated export promotion
council for the construction sector and had a consultative status with
EXIM Bank, ECGC and the Ministry of Commerce. The formation,
structure and status of the OCCI was a step forward in ordering the
desired administrative and regulatory mechanism for the construction
sector.
The Government of India set up a Task Force on Project Exports
under the chairmanship of Dr. Abid Hussain in 1982, to recommend ways
and means of increasing India‟s share in the overseas construction
market. The Task force stressed the need for training in promoting
projects and consultancy export. It also suggested the establishment of an
institute at the national level. In pursuance of the recommendations, the
National Institute of Construction Management and Research (NICMAR)
was started. The initiative was taken by 26 leading construction
companies with the active encouragement of the Government of India.
Construction is a component of most development works.
As such, budgets and allocations of various ministries and
Government bodies have components on construction. These agencies
perceive construction in terms of their mainline activities: housing,
buildings, water, power, roads, rural development, hospitals, schools etc.
Till the inception of NICMAR there was no national level
construction platform. This platform began to be provided by the
NICMAR, and all those concerned with construction irrespective of their
sectoral organizations, came together on this platform. This construction
platform of the NICMAR was converted into Construction Industry
92
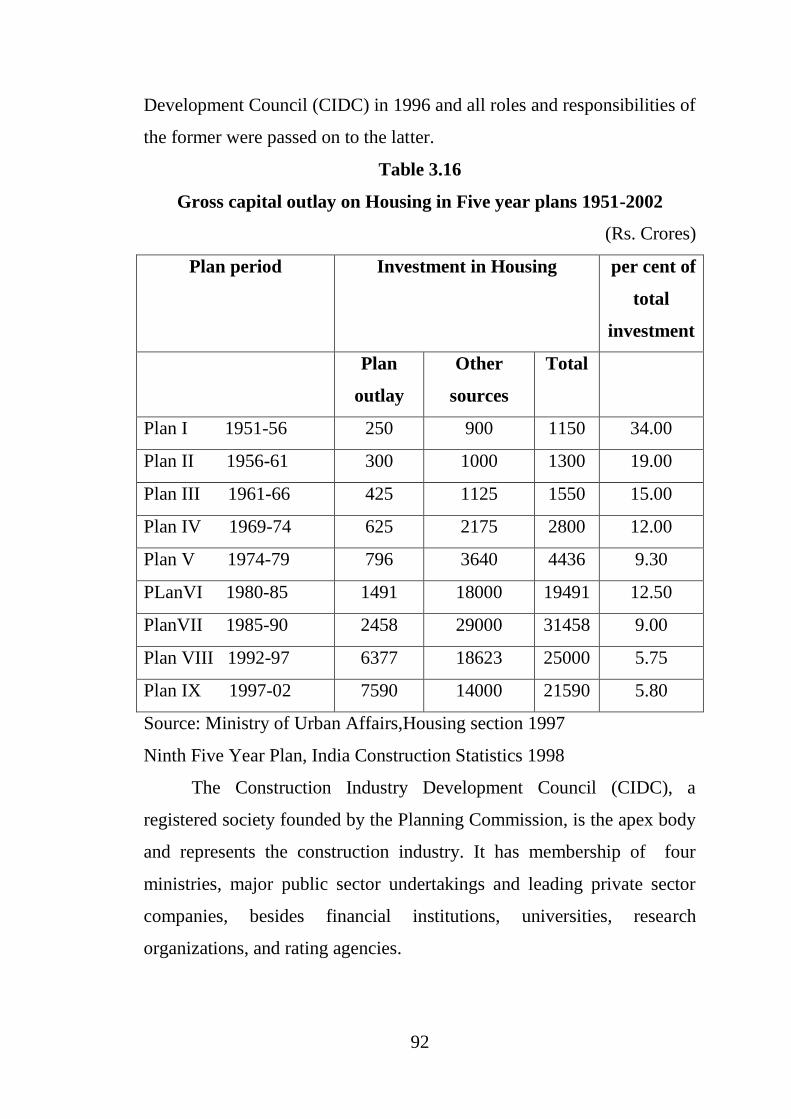
Development Council (CIDC) in 1996 and all roles and responsibilities of
the former were passed on to the latter.
Table 3.16
Gross capital outlay on Housing in Five year plans 1951-2002
(Rs. Crores)
Plan period Investment in Housing per cent of
total
investment
Plan
outlay
Other
sources
Total
Plan I 1951-56 250 900 1150 34.00
Plan II 1956-61 300 1000 1300 19.00
Plan III 1961-66 425 1125 1550 15.00
Plan IV 1969-74 625 2175 2800 12.00
Plan V 1974-79 796 3640 4436 9.30
PLanVI 1980-85 1491 18000 19491 12.50
PlanVII 1985-90 2458 29000 31458 9.00
Plan VIII 1992-97 6377 18623 25000 5.75
Plan IX 1997-02 7590 14000 21590 5.80
Source: Ministry of Urban Affairs,Housing section 1997
Ninth Five Year Plan, India Construction Statistics 1998
The Construction Industry Development Council (CIDC), a
registered society founded by the Planning Commission, is the apex body
and represents the construction industry. It has membership of four
ministries, major public sector undertakings and leading private sector
companies, besides financial institutions, universities, research
organizations, and rating agencies.
93
Various central, state and municipal / local laws are applicable to
the construction industry. The laws relating to different aspects of the
sector fall under different categories. The various industry components
are regulated by different ministries, Government departments and
organizations like the Ministry of Environment and Forests, the Labour
Department, Pollution Control Board etc.
Many issues affect the smooth functioning of the sector. These
include contracting issues, financing issues, quality and technical issues
and manpower issues. Probably the biggest bottleneck facing the sector
today is the lack of skilled manpower. This is partly due to the lack of
demand for construction specific skills and partly due to lack of
institutions to help build the required skills.
The Construction Industry Development Council (CIDC) has
taken several steps to address the above problems. Some of the major
initiatives include devising a rating system to grade construction
companies, establishment of common lending norms to facilitate
financing, designing of quality assurance systems and several
programmes for upgrading worker skills.
The construction sector has started inducting the latest
development in IT and technology. Project design, development,
implementation and monitoring have been computerized. Major
initiatives include the establishment of a software development centre in
Hyderabad for the comprehensive incorporation of IT into every aspect of
construction and development of a wide network area-based system for
monitoring and control of projects across dispersed centres using IT.
The efforts of the Construction Industry Development Council
(CIDC) are laudable but they have not made a very marked difference;
their collective reach is still quite limited.
94
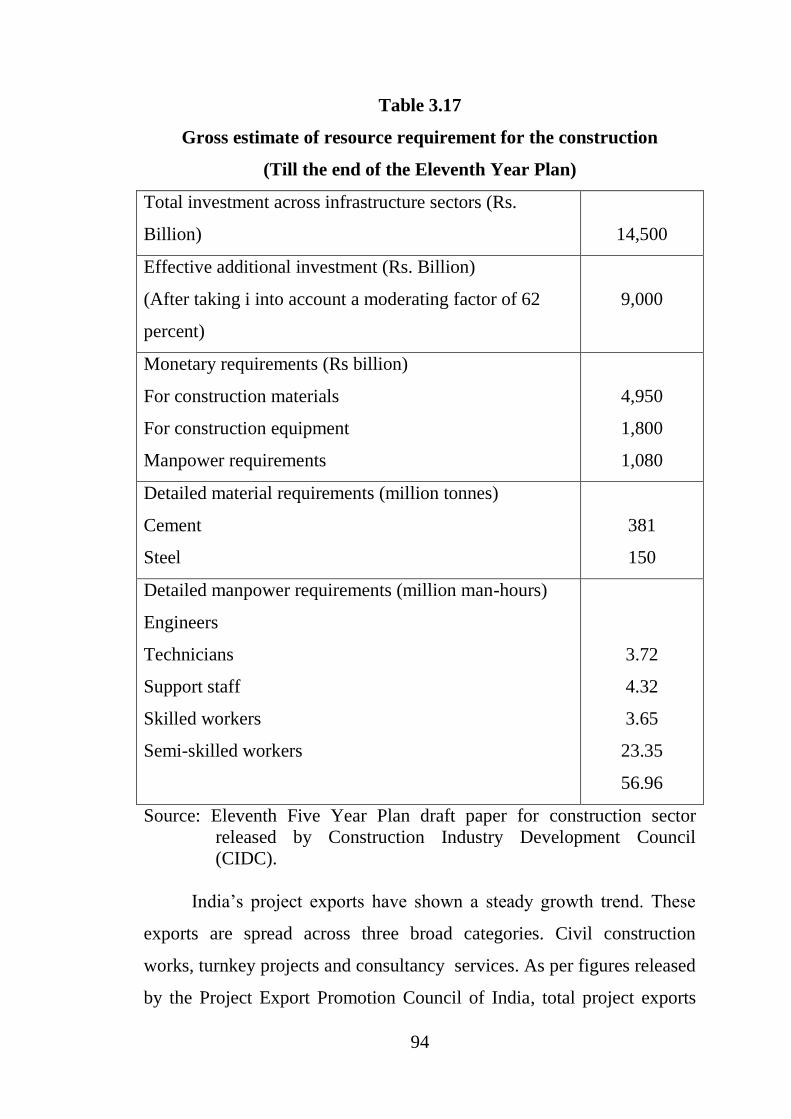
Table 3.17
Gross estimate of resource requirement for the construction
(Till the end of the Eleventh Year Plan)
Total investment across infrastructure sectors (Rs.
Billion)
14,500
Effective additional investment (Rs. Billion)
(After taking i into account a moderating factor of 62
percent)
9,000
Monetary requirements (Rs billion)
For construction materials
For construction equipment
Manpower requirements
4,950
1,800
1,080
Detailed material requirements (million tonnes)
Cement
Steel
381
150
Detailed manpower requirements (million man-hours)
Engineers
Technicians
Support staff
Skilled workers
Semi-skilled workers
3.72
4.32
3.65
23.35
56.96
Source: Eleventh Five Year Plan draft paper for construction sector
released by Construction Industry Development Council
(CIDC).
India‟s project exports have shown a steady growth trend. These
exports are spread across three broad categories. Civil construction
works, turnkey projects and consultancy services. As per figures released
by the Project Export Promotion Council of India, total project exports
95
(including the three categories given above) for 2005-06 were estimated
at Rs. 59.42 billion, a growth of nearly 29 percent over 2004-05. While
the Middle East has been the biggest market for project exports, major
projects have also been initiated in South East Asia, SAARC countries,
CIS countries, Africa and Latin America.
Currently, India is a small player in the global trade of construction
services. Many Indian companies do not have the technical and financial
strength to manage large turnkey projects. In most of the consultancy and
high-tech projects, it is the U.S.A which is dominating the world market
while Japan leads in the Asian market and South Korea in the Middle
East. It is to be noted that the use of modern and high-tech equipment in
the overseas construction has not percolated down to domestic
construction operations. As a result, construction activity within the
country remains low-tech and leisure-paced. Another impediment is the
lack of capital.
The Indian firms now have considerable exposure and expertise
and are well- equipped to face challenges in the international construction
market.
India has a large potential of expanding trade in construction and
allied services. The Government of India, the construction industry and
various organizational /associations in this sector need to take immediate
steps to make the Indian construction industry competitive at home and
abroad and to face the challenges and opportunities arising from trade
liberalization under GATS.
Construction Technology
Construction absorbs massive investments. Since construction is a
large activity anything done to improve its productivity must benefit, in
turn, the economy as a whole. Even a small improvement in productivity
level can lead to a large savings in time, cost and energy. For example, it

96
is estimated that completion of construction and commissioning of a
2000MW power station one month ahead of schedule would yield about
105 crores extra units of power which, if sold at Rs. 2 per unit, would
yield additional income of Rs. 210 crores and an ultimate increase in
GNP of Rs. 30000 crores (Vaid, 2003)5. Same is the case with building
construction where the benefits of productivity improvements and cost
savings are staggering.
Table No. 3.18
Construction Productivity
(Sq. meter per man-day)
1999 2000 2001 2002 20003 2004 2005
Physical
Measurement
Public
residential
0.50
0.50
0.50
0.50
0.50
0.50
0.51
Private
residential
0.50 0.50 0.50 0.50 0.50 0.50 0.51
Commercial 0.60 0.60 0.60 0.60 0.60 0.60 0.61
Industrial 0.70 0.70 0.70 0.70 0.70 0.70 0.71
Value added per
employee (no. of
units)
67,741
73,225
75,355
77,743
80,207
82,144
85,547
Source : Indian Infrastructure (2007)
But technology is managed by men and it is their capabilities and
motivations that make things happen.
Construction is an age old activity that has always used traditional
methods, techniques and materials. In India, for example, building
technology, which flourished in the Mughal period, had undergone a
revolutionary change with the establishment of Sultanate at Delhi in A.D.
1206.
97
In the pre-sultanate period, architecture progressed form rock-cut
technology to the Trabeate technique in which the pillars are placed
closely with stone blocks to support the heavy beam.
The Sultanate period brought the Arcuate system in which the vault
and the dome were used with lime and gypsum as mortars and this
enabled the use of fired bricks and rubble in complex constructions.
Although lime has been in use around 200 B.C in India and gypsum in
the Indus valley civilization, the two came to be used properly only after
the 13th
century.
However today‟s construction activity is not altogether traditional.
High rise buildings, complex designs, heavy reliance on concrete and new
materials, vertical transportations, pressure to finish projects quickly etc.
demand innovative work methods, new construction techniques,
mechanization of transportation and material handling systems and better
quality workmanship. At the same time, there are constraints on the
modernization of the construction activity. Some constraints are inherent
in the technology itself while some others exist due to social linkages of
technology. First, the current state of the construction industry does not
lend itself to mass production techniques. Limitations arise due to the
variations in the site conditions and owners‟ need to make their buildings
unique. Each facility has to be designed and produced to meet the
requirements of a given site as well as of the owner. Further, the site
operations must conform to local regulatory requirements of design and
building plans which may vary from one place to another.
Second, the efficiency of the construction work is affected by the
weather condition. Most of the work is done on sites exposed to
elements-inclement weather, rains etc. The intermittent and seasonal
nature of the construction activity leads to uneconomic and under
utilization of construction resources, and therefore, increased construction
98
costs. This is also one of the reasons for the low level of capital
investment by contractors.
Third, due to easy entry into the industry, small firms with scanty
resources and limited technical and financial capabilities proliferate.
Subcontracting and low labour wages justify the use of out-of-date
methods of construction. Low wages produce poverty on the one hand
and low productivity on the other. (Vaid, 2003)6.
Four, conditions of economic destitution and social backwardness
of construction workers are perpetuated along with lack of skills, poor
workmanship and low productivity.
Five, technological upgradation of the construction process,
improvement in the social quality of the workforce and economic size of
the firm must move hand in hand if efficiency and productivity are to be
improved. A contractor will have to hire high skill labour to mechanize
building operations. And as mechanization calls for the use of equipment,
the contractor needs to have financial resources to buy such equipment
and the technical capabilities in the firm to handle it.
Six, technology in the construction sector is related to a whole
spectrum of fields –materials machinery and equipments, process,
production systems, quality systems etc. The term technology denotes
much more than just the physical process of converting inputs into
outputs. It also signifies the procedural and organizational arrangements
for carrying out the transformation with economic benefits. New
materials play a major part in product and process innovations. But the
expenditure on technology is few and far between. In India, the public
capital outlay on Research and Development is 0.89 percent of the G N P
whereas the share comes to 3 per cent of the GNP in industrialized
countries. “Technology is not born. It is developed and made by human
99
beings through conscious planning and investment of money in machines
and man” (Bhaumik, 2001)7.
Finally, improved technology does not always mean a reduction in
the labour force. Labour based technologies can be best used in building
construction for excavation, earth moving, on-site handling and moving
of construction materials. They save capital and generate employment.
They also enhance technological flexibility since labour can be
redeployed more easily than capital equipment.
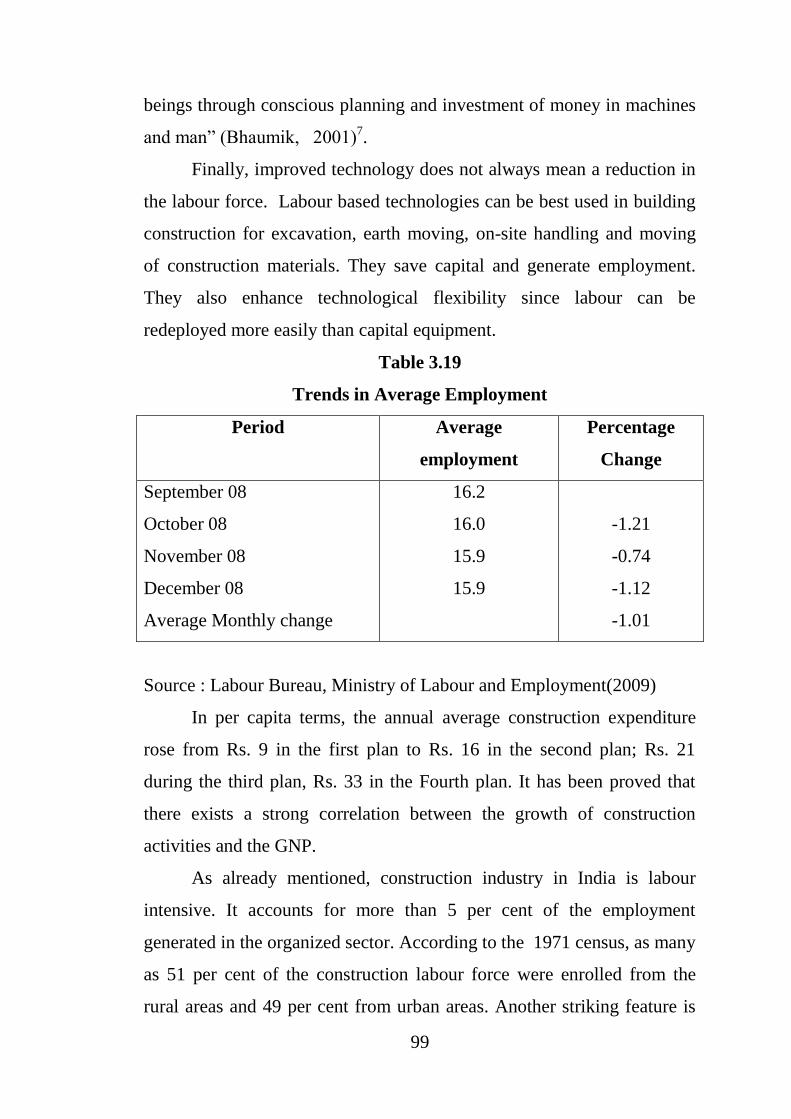
Table 3.19
Trends in Average Employment
Period Average
employment
Percentage
Change
September 08
October 08
November 08
December 08
Average Monthly change
16.2
16.0
15.9
15.9
-1.21
-0.74
-1.12
-1.01
Source : Labour Bureau, Ministry of Labour and Employment(2009)
In per capita terms, the annual average construction expenditure
rose from Rs. 9 in the first plan to Rs. 16 in the second plan; Rs. 21
during the third plan, Rs. 33 in the Fourth plan. It has been proved that
there exists a strong correlation between the growth of construction
activities and the GNP.
As already mentioned, construction industry in India is labour
intensive. It accounts for more than 5 per cent of the employment
generated in the organized sector. According to the 1971 census, as many
as 51 per cent of the construction labour force were enrolled from the
rural areas and 49 per cent from urban areas. Another striking feature is
100
that there has been a progressive increase in the member of women
absorbed in the construction activity. The National Building Organization
has estimated that every one million rupee worth of construction in India
generates an average employment of the order of 31800 man days of
unskilled and semi skilled, 30000 man days of skilled and about 13000
man days of managerial and technical personnel.
Workers in the construction industry are hired as and when
required and are retrenched on completion of the work. Due to temporary
nature of their jobs, workers remain idle till they find work at new
construction sites. In big constrictions firms, personnel at the supervisory
and managerial levels are employed on a permanent basis, but they have
to move from one project site to another. Construction labour, however, is
hired on a temporary basis and leads a migratory life, working on
different sites.
The economic condition of the construction labour is worst in our
country on account of their poor bargaining power due to lack of unions,
illiteracy and the temporary nature of their employment. Basic amenities
like shelter, drinking water, sanitary conveniences etc. are not adequately
provided to them at small construction sites. Nobody cares for the
education of their children.
Construction labour is the most disorganized sector in our country
and they do not enjoy the facilities which their counterparts in other
industries and organized sectors enjoy. Construction workers have no job
security and are the least trained. In many developed countries, there are
training institutes to train workers for particular trades such as mechanics,
wiremen, blacksmith operators, electricians etc. Although industrial
training institutes have been established in our country, their contribution
towards training of construction labour is not enough. Article 24 of the
constitution lays down that no child below the age of 14 years shall be
101
employed to work in any factory or sites, but still we have a large number
of child workers employed in our construction sites.
Construction workers are paid very low wages. There are two
methods of making wage payment to labour, namely the time rate system
and the piece rate system. Time rate is based on the actual time worked
and the piece rate system is based on the quantum of work carried out by
each labourer.
A number of trade unions are connected with the construction
industry (Gahlot and Dhir, 1991)8.
Indian construction-The changing face
Due to increase in outsourcing of labour through sub contractors,
the role of large construction companies has gradually changed from
physical construction to consultancy, management and co-ordination, and
a step forward to finding clients and marketing of products, which are in
turn produced by sub contractors. The top firms have moved to
international markets through mergers and acquisitions.
References
1 Op. Cit.
2 Op. Cit.
3 Op. Cit.
4 Op. Cit.
5 Op. Cit.
6 Op. Cit.
7 Bhaumik, Srimanta K. (2001) “Reforms in the real sector of the
industry”. The Hindu, December 9, 2003.
8 Op. Cit.