chapter iii. methodology research design · methodology this chapter presents the methods for this...
TRANSCRIPT

29
CHAPTER III.
METHODOLOGY
This chapter presents the methods for this study. The research design and variables of
this study are presented first. Next, the research procedure is explained. Then, the research
instruments that were used are described. Lastly, data analysis technologies are discussed.
Research Design
This study was experimental. After the participants were screened and matched, they
were randomly assigned to two independent groups, thereby equating the groups on the
individual differences of ability on dependent variables. Each experimental group was given one
of two different treatments (two types of computer simulation), and the same experimental test.
After that, participants were interviewed.
Variables
Independent Variables
Two types of computer simulation of the VALAB interior design:
1) passive walk-through animation of the VALAB on the PC monitor,
2) immersive walk-through of the VALAB in the CAVETM.
Dependent Variables
Accuracy of participants’ perceptions of the basic visual information of the VALAB interior
design through each of the two simulations are as follows:
1) the accuracy of participants' perceptions of visual forms,
2) the accuracy of participants' perceptions of spatial relationships,
3) the accuracy of participants' perceptions of colors, and
4) the accuracy of participants' perceptions of textures.
30
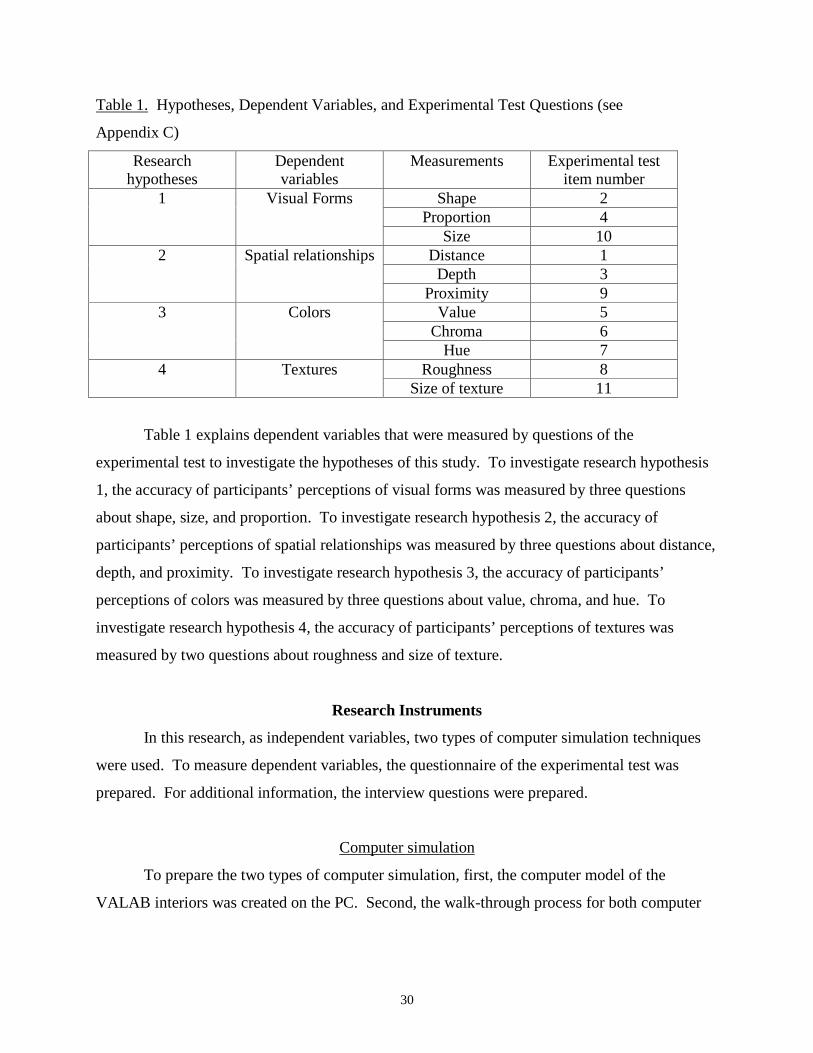
Table 1. Hypotheses, Dependent Variables, and Experimental Test Questions (see
Appendix C)
Researchhypotheses
Dependentvariables
Measurements Experimental testitem number
Shape 2Proportion 4
1 Visual Forms
Size 10Distance 1Depth 3
2 Spatial relationships
Proximity 9Value 5
Chroma 63 Colors
Hue 7Roughness 84 Textures
Size of texture 11
Table 1 explains dependent variables that were measured by questions of the
experimental test to investigate the hypotheses of this study. To investigate research hypothesis
1, the accuracy of participants’ perceptions of visual forms was measured by three questions
about shape, size, and proportion. To investigate research hypothesis 2, the accuracy of
participants’ perceptions of spatial relationships was measured by three questions about distance,
depth, and proximity. To investigate research hypothesis 3, the accuracy of participants’
perceptions of colors was measured by three questions about value, chroma, and hue. To
investigate research hypothesis 4, the accuracy of participants’ perceptions of textures was
measured by two questions about roughness and size of texture.
Research Instruments
In this research, as independent variables, two types of computer simulation techniques
were used. To measure dependent variables, the questionnaire of the experimental test was
prepared. For additional information, the interview questions were prepared.
Computer simulation
To prepare the two types of computer simulation, first, the computer model of the
VALAB interiors was created on the PC. Second, the walk-through process for both computer

31
simulations was planned. Third, the computer model was simulated with the walk-through
process by the two types of computer simulation techniques: the passive walk-through animation
on the PC monitor and the immersive walk-through in the CAVETM.
The Computer Model of the VALAB Interior Design
The ACITC building, which is under construction on the campus of Virginia Polytechnic
Institute and State University, had been planned by architects in Esocoff & Associates in
Washington, D.C. The VALAB will be in the ACITC building and house virtual reality
facilities. Based on the architecture plans of the ACITC building, the interior architectural plan
of the VALAB was previously designed by the researcher and revised by the architects and
members of the Virginia Tech Visualization Animation group (Figure 9).
For the purpose of using the VALAB for the experimental test in this study, the
researcher designed more details of the VALAB interiors. The interior design was modeled by
3D Studio Release 4 from AutoDesk on the PC (Compaq Pentium 166mHz 131072KB 128 MB
RAM). The interiors were created by dimensions of the VALAB interior design and finished by
materials from 3D Studio material library, except for the texture tiles and the color squares.
For the experimental test of textures and colors, real samples were selected. The texture
samples and color samples were scanned by a Hewlett Packard ScanJet 4c. The images of
samples were resized by pixels 256 x 256 in Adobe Photoshop 3.0 and saved in the JPG format.
The JPG image files were used as texture map files in 3D Studio in order to be assigned to
texture tiles and color squares in the model. The resizing and reassignment of the scanned
materials are for the CAVETM application.
The following discussion is about the selection of the real samples. For the test of
roughness of texture, samples had to have a similar texture, and their textures had to have four
gradual degrees of roughness. The researcher selected four vinyl wallcovering samples from J.
M. Lynne Inc. and the degrees of roughness of the samples were accepted by the committee
members. The samples were sprayed thinly by white enamel paint to control color. The scanned
images of
texture samples were not different visually from the real samples (Figure 10).
For the test of size of texture, samples had to have a similar texture and their textures had
to have gradual sizes. The researcher selected four vinyl wallcovering samples from Spring

32
Street Design, Inc. and the degrees of sizes of the samples were accepted by the committee
members. Again, the samples were sprayed with white enamel paint which did not affect the
textures (Figure 10).
A set of color samples that had gradual values, a set of color samples that had gradual
chromas, a set of color samples that had gradual hues for the experimental test of color. Munsell
charts were used because it provides exact intervals of colors. The color samples that had good
intervals and scanning results were selected as follows. For the value test, values 5, 6, 7, and 8
were selected. For the chroma test, the four reds that have chromas 2, 4, 6, and 8, in the value
level four were selected. For the hue test, each color sample of blue, green, purple, and yellow
that have the chroma level two and the value level were selected (Figure 10).

33
Figure 9. Interior Design of the VALAB.

34
Figure 10. Texture and Color Samples Chosen for the Experimental Test.

35
The Walk-Through Process
For simulations of the VALAB computer model by the two types of computer simulation,
a same pattern of the walk-through process was prepared to control movement. The walk-
through had two sections: the walk-through to show the interior spaces of the VALAB
sequentially and the walk-through for the experimental test.
1) The sequential walk-through of the VALAB
The walk-through proceeded from the front of the entrance, to the reception room, to the
presentation room, back to the reception room, to the conference room, back to the reception
room, to the observation room, and back to the reception room (Figure 11).
Figure 11. The Sequential Walk-Through of the VALAB.

36
2) The walk-through for the experimental test
The eleven parts of the walk-through for the experimental test proceeded according to
eleven location points which are the participants’ standing points in the CAVETM and the
cameras’ location points in the PC animation for the eleven experimental questions (Figure 12).
The location points were numbered on the floors of the interior spaces of the computer model.
Figure 12. The Walk-Through for the Experimental Test.

37
The walk-through for the experimental test proceeded as follows (see Figure 12 and Appendix
C):
(1) for question 1, going through the entrance from point1 to point 2;
(2) for question 2, looking around the reception room at point 2;
(3) for question 3, going from point 2 to point 3 looking at the area with red chairs;
(4) for question 4, from the reception room, going to point 4 in the conference room and
looking around the room;
(5) for question 5, going to point 5 and looking at the first poster;
(6) for question 6, going to point 6 and looking at the second poster;
(7) for question 7, going to point 7 and looking at the third poster;
(8) for question 8, going to the point 8 looking at the rough texture tiles;
(9) for question 9, from the reception room, going to point 9 in the presentation room and
looking around the chairs;
(10) for question 10, going to point 10 and looking around the desks; and
(11) for question 11, going to point 11 and looking at the pattern texture tiles.
Two Types of Computer Simulation Techniques
1) The Passive Walk-Through Animation on the PC
The computer model was animated by 3D Studio Release 4 on the PC (Compaq Pentium
166mHz 131072KB 128 MB RAM and 17inch monitor) according to the walk-through process:
the sequential walk-through (Figure 11) and the walk-through for the experimental test (Figure
12). For the walk-through for the experimental test, cameras were placed on the numbered
location points. Camera height was 5.5feet, which is about an average adult’s eye level. Camera
lens of 28 millimeter, which are normally used for walk-through animations, were chosen. The
whole walk-through animation was saved in a file, and each of the eleven parts of the animation
was saved in each file. When the researcher selected a file, the animation started on the PC
monitor.
2) The Immersive Walk-Through in the CAVETM.
The computer model was imported into the CAVETM (resolution: 1024 pixel x 768 pixel).
For the CAVETM application, the texture files used in the model were converted to RGB files

38
that can be read by the Silicon Graphics (SGI) computer. After that, the model was converted to
‘pfb’ (performer binary) format on the SGI.
The computer model was navigated and saved by using Saranav navigation program
according to the walk-through process: the sequential walk-through (Figure 11), and the walk-
through for the experimental test (Figure 12). When the researcher pushed the left button on the
wand, the navigation started in the CAVETM. For the experimental test, the point-to-point
navigation was created and saved according to the walk-through for the experimental test (Figure
12). When the researcher pushed the right button, the navigation went to the next point and
stopped.
Experimental Test
The experimental test to measure the dependent variables contained eleven questions.
Participants were asked the questions about four dependent variables (see Appendix C).
1) Visual forms
For testing how accurately participants perceive visual forms of the interior design in the
simulation, three questions with four multiple choices were asked about shape, size, and
proportion (Table 2).
Table 2. Objects for Testing the Perceptions of Visual Forms in the Experimental Test.
Dependent variable Measurement Location ObjectsShape Reception room Floor
Proportion Conference room FloorVisual forms
Size Presentation room Desktops
• Shape: Question 2 asked about the shape of the reception room floor. The simulation made
participants look around the room at point 2, and they were asked to choose one of four
shapes on the sheet.

39
Figure 13. The Image at Point 2 (Figure 12).
• Proportion: Question 4 asked about the proportion of the conference room floor. The
simulation allowed participants to look around the room at point 4, and they were asked to
choose one of the four ratios on the sheet.
Figure 14. The Image at Point 4 (Figure 12).

40
• Size: Question 10 asked about the sizes of the desktops in the presentation room. The
simulation took the participants to look around the desktops at point 10, and they were asked
to choose the largest one of the four desktops.
Figure 15. The Image at the Point 10 (Figure 12).
2) Spatial Relationships
For testing how participants perceive spatial relationships of the interior design in the
simulation, three questions with four multiple choices were asked about distance, depth, and
proximity (Table 3).
Table 3. Objects for Testing the Perceptions of Spatial Relationships in the Experimental Test.
Dependent variable Measurement Location ObjectsDistance Reception room EntranceDepth Reception room Area with red chairs
Spatial relationships
Proximity Presentation room Chairs

41
• Distance: Question 1 asked about the width of the entrance doorframe. They were asked to
choose the width of the entrance doorframe of the reception room. The simulation allowed
participants to go through the entrance from point 1 to point 2.
Figure 16. The Image at Point 1 (Figure 12).
• Depth: Question 3 asked about the length of the area with red chairs. The simulation
allowed them to look at the area with red chairs in the right side of the reception room at
point 3, and they were asked to choose the length of the area.
Figure 17. The Image at Point 3 (Figure 12).

42
• Proximity: Question 9 asked about chairs in the presentation room. The simulation allowed
them to look around at the four chairs at point 9, and they were asked to choose the closest
one to them.
Figure 18. The Image at the Point 9 (Figure 12).
3) Colors
For testing how the participants perceive colors in the simulation, three questions were
asked about value, chroma, and hue (Table 4).
Table 4. Objects for Testing the Perceptions of Colors in the Experimental Test.
Dependent variable Measurement Location ObjectsValue Conference room Color squares on poster 1
Chroma Conference room Color squares on poster 2Colors
Hue Conference room Color squares on poster 3
• Value: Question 5 asked about the squares on poster 1 in the conference room. There was a
set of sixteen squares on the poster and a test square above the set of squares. The four grays,
which were selected from Munsell chart (values 5, 6, 7, and 8) and scanned, were randomly
assigned to the sixteen squares. The test square had the value 6. Five of the sixteen squares
on the poster were the same as the test square. The simulation took the participants to

43
look at the squares on the poster and above the poster at point 5, and they were asked to mark all
the squares that were the same as the square above the poster.
Figure 19. The Image at Point 5 (Figure 12).
• Chroma: Question 6 asked about the squares on poster 2. There was a set of sixteen squares
on the poster and a test square above the set of squares. The four reds, which were selected
from Munsell chart (chroma 2, 4, 6, and 8 in the value level 4), were assigned randomly to
the sixteen squares. The test square had a chroma of 6. Five of the sixteen squares on the
poster were the same as the test square. The simulation took the participants to look at the
squares on the poster and above the poster at the point 6, and they were asked to mark all the
squares that were the same as the square above the poster.

44
Figure 20. The Image at Point 6 (Figure 12).
• Hue: Question 7 asked about the squares on poster 3. There was a set of sixteen squares on
the poster and a test square above the set of squares. The four colors were yellow, blue,
green, and purple, all of which had the same chroma (chroma 2) and value (value 5). Those
colors on the Munsell chart were scanned and assigned randomly to the sixteen squares. The
test square above the poster was green. Five of the sixteen squares on the poster were the
same as the test square. The simulation took the participants to look at the squares on the
poster and above the poster at the point 7, and they were asked to mark all the squares that
were the same as the square above the poster.
Figure 21. The Image at Point 7 (Figure 12).

45
4) Textures
For testing how the participants perceive textures in the simulation, two questions were
asked about roughness and size of texture (Table 5).
Table 5. Objects for Testing the Perception of Textures in the Experimental Test.
Dependent variable Measurement Location ObjectsRoughness Conference room Texture tiles on the wallTextures
Size of texture Presentation room Texture tiles on the wall
• Roughness of texture: Question 8 asked about the texture tiles on the conference room wall.
There were fifteen texture tiles on the wall. Four texture samples with gradual degrees of
roughness were scanned and assigned randomly to the tiles. Five of the fifteen tiles had the
roughest texture. The simulation took the participants to look at the tiles at point 8, and they
were asked to mark all the tiles that had the roughest texture.
Figure 22. The Image at Point 8 (Figure 12).
• Size of texture: Question 11 asked about the texture tiles on the presentation room wall.
There were fifteen texture tiles on the wall. Four gradual sizes of texture samples were
scanned and assigned randomly to the tiles. Five of the fifteen tiles had the smallest size of
texture. The simulation took them to look at the tiles at point 11, and they were asked to
mark all the tiles that had the smallest sizes of texture.

46
Figure 23. The Image at Point 11 (see Figure 12).
Interview
After the participants watched the simulation and finished the experimental test, four
questions about the simulation were asked by the researcher.
1) Description of the simulation
Question 12 asked them to describe, in as much detail as possible, what they saw in the
simulation starting at the beginning. This question was to study participants’ orientation to
interior spaces and the details they obtained in the simulation on the PC monitor and in the
CAVETM.
2) General perception of the simulation
Question 13 asked how they felt while they watched the simulation. This question was to
study what kinds of perceptions they had during the simulation on the PC monitor and in the
CAVETM.
3) Realism of the simulation
Question 14 asked how close the simulation was to reality. This question was to study
how much reality they felt in the simulation on the PC monitor and in the CAVETM, for instance,

47
whether they felt that the simulation was realistic, what aspects made the simulation realistic, and
what limitations hindered the reality of the simulation.
4) Improvement of the simulation
Question 15 asked what could be improved in each simulation. Participants’ answers
were related to the limitation of technology and the procedure used in this study, for instance,
what they suggested for the improvement of the simulation.
Data Collection Procedure
Subjects
The sample of this study was a convenience sample of 60 voluntary subjects from people
who are staff, faculty, or graduate students at Virginia Polytechnic Institute and State University.
The subjects were lay people who did not have professional knowledge or experiences in the
environmental design field.
People working in housing, interior design, and architecture were excluded. The reason
for this exclusion was that they were considered to be professionals in environmental design.
They may have given correct answers to the experimental test by their knowledge or experiences
from practical training rather than their first impression of the simulation.
The letters (see Appendix A) asking for volunteer participation in this research were sent
to approximately1220 people from about 6000 people in Virginia Tech by email from February
16 to February 26, 1998. Using the campus directory, the email was sent to the people until 63
people had volunteered. Sixty of 63 sixty passed the screening test and participated in the
experimental test and the interview.
Screening Test
The purposes of the first test were to get demographic information (age, gender, and
occupation) and to test for screening. The place and time of the test were given to the volunteers
when they replied to email to agree to participate. The appointments for the test were made with
63 participants by email or telephone. The test started on March 1, 1998. Depending on the
participants’ schedules, one to four participants were tested at a time.

48
For the screening test, participants were asked a series of basic questions to test their
ability of perceiving dependent variables (visual forms, spatial relationships, colors, and textures)
in real world. The test took place in a small computer lab in Wallace Hall. For the test, balls,
boxes, texture samples, and color samples were used. A list of the variables of the screening test
is presented in Table 6. The screening test questionnaire is presented in Appendix B.
For questions about visual forms and spatial relationships, the researcher marked the
locations of the boxes and balls on a table. Participants were asked to stand about 5 feet from the
table. The researcher placed the boxes or balls on the marks when she asked a participant to
answer a question. For the questions about colors and textures, the samples were given in their
hands.
Table 6. Screening Test Variables (see Appendix B)
Variables Measurement Screening test item numberShape 10
Proportion 11Visual form
Size 12Distance 13Depth 14
Spatial relationships
Proximity 15Value 4
Chroma 5Colors
Hue 6Roughness 7Textures
Size of texture 8
1) Visual forms
Three basic questions about shape, size, and proportion were asked. In the question
about shape, participants were asked to choose one of three drawings that represented the shape
of a trapezoid box top on the table [ : (3 inch x 3 inch x 6 inch) x 2 inch]. In the question
about size, they were asked to choose the biggest of three cube boxes on the table, which had
different size box tops [box 2: (3 inch x 3 inch) x 2 inch, box 1: (3.3 inch x 3.3 inch) x 2 inch,
and box 3: (3.6 inch x 3.6 inch) x 2 inch]. In the question about proportion, they were asked to
choose the ratio of the width to the length of a rectangular box top: (3 inch x 6 inch) x 2 inch.

49
2) Spatial relationships
Three basic questions about distance, depth, and proximity were asked. In the question
about distance, they were asked to choose the distance between two balls (radius ½ inch) on the
table (2 feet). In the question about depth, they were asked to choose the depth between two
balls on the table (2 feet). In the question about proximity, they were asked to choose which of
three balls on the table was the closest to them (right ball).
3) Colors
Three basic questions about value, chroma, and hue were asked. For these questions,
color samples were selected from the Munsell chart (Luke, 1996). In the question about value,
they were asked to choose one of three grays (values 4,5,and 6) on a sheet matching a gray
(value 4) on another sheet. In the question about chroma, they were asked to choose one of three
reds (chroma 2, 4, and 6 in value level four) on a sheet matching a red ( chroma 4) on another
sheet. In the question about hue, they were asked to choose one of three colors (yellow, green,
and blue in value level five and chroma level two) matching a color (blue) on a sheet. One
question (question 9) tested for color blindness.
4) Textures
Two basic questions about roughness of texture and size of texture were asked. In the
question about roughness of texture, they were asked to choose the roughest (sample 1) of three
samples that had gradual levels of rough textures. In the question about size of texture, they
were asked to choose the one with the smallest texture (pattern 2) of three samples that had
gradual levels of sizes of texture.
In the screening test, people who did not give correct answers to all questions on one
variable were excluded. For example, one who gave wrong answers to all of the three questions
on visual forms, to all of the three questions on spatial relationships, to all of the two questions
on textures, or to all of the three questions on colors were excluded. Sixty of sixty-three
volunteers passed the screening test. After screening, the sixty subjects were matched according
to the scores of the screening test. Their answers on the screening test were scored. They got
-10 points per wrong answer. Their scores were used for matching subjects.
50
Matching and Random Assignment to Two Groups
Sixty participants were matched by the scores of the screening test and assigned
randomly into two groups of 30. Each group had approximately the same mean of the total
scores and the scores for each question.
First of all, participants were classified according to their scores and the questions to
which the participants gave a wrong answer. For example, participants who got a total -10 score
and gave a wrong answer on the same question were classified. Their names were placed in a
container and one at a time, were drawn blindly. The first name drawn was assigned to the group
that was shown the passive walk-through animation on the PC (PC group). The name drawn
second was assigned to the group that was shown the immersive walk-through in the CAVETM
(CAVETM group). The sequence was repeated until all names in the container were assigned to
one of the two groups.
After that, participants who got a total -20 score and gave wrong answers on the same
questions were classified. Their names were placed in a container and, one at a time, were drawn
blindly. During this sequence, the means of the total score and the means of each question in the
two groups became the same. Several participants’ names were left because their test results
were complicated or an odd number of participants were collected. They were assigned to two
groups, making the means of the two groups as similar as possible. Table 7 presents the
matching results.

51
Table 7. Matching Results: Mean of the Scores of the Screening Test After Matching and
Assignment to Two Groups.
MeansQuestion # VariablesPC group CAVE group All
#4 Value 0 0 0#5 Chroma 0 0 0#6 Hue 0 0 0#7 Roughness 0 0 0#8 Size of texture 0 0 0#9 Color blindness -1.3333 -1.3333 -1.3333#10 Shape 0 0 0#11 Proportion -0.5 -0.6667 -0.3333#12 Size -0.1667 0 -0.3333#13 Distance -0.3333 -0.3333 -0.3333#14 Depth -1.6667 -1.6667 -1.6667#15 Proximity 0 0 0
Visual forms -0.6667 -0.6667 -0.6667Spatialrelationships
-2 -2 -2
Colors 0 0 0
Dependentvariables in thestudy
Textures 0 0 0Total -4 -4 -4
Data Collection from the Two Groups
The method and procedure of the data collection from the two groups were the same,
except that each group was shown one of two types of computer simulation technique: the
passive walk-through animation of the VALAB interiors on the PC monitor or the immersive
walk-through of the VALAB interiors in the CAVETM. The following section is about the
general method and procedure of the data collection from the two groups.
Ten sessions of data collection from each of the two groups were planned with three in a
session. However, some sessions had one or two participants because some participants were
absent or changed their appointment times. In a session, the experimental test took about 30
minutes, and the interview took about 20 minutes.
When the participants came, they were asked to read the following instructions:
• Watch the simulation carefully.
• Concentrate on your feelings and perceptions.
• Do not compare other’s answers and your answers.

52
• If you do not understand the questions, please ask the researcher.
• But do not ask for any clues for answers to the questions.
After they read the instructions, the researcher showed the sequential walk-through of the
interiors of VALAB (Figure 11), and asked them to watch carefully. During the walk-through,
the researcher told them only the room names sequentially as follows:
“ This is the reception room.”
“This is the presentation room.”
“This is the conference room.”
“This is the observation room.”
For the experimental test, each participant was given a pen and the experimental test
sheets with a clipboard. The researcher showed the walk-through for the experimental test
(Figure 12). When the participants were shown each part of the walk-through for each
experimental test question, they were asked to read the question and mark their answers on the
sheet. The experimental test contained eleven questions (Appendix C).
After the experimental test, they were interviewed by the researcher in an adjacent office.
Before the interview, the researcher gave a number to each participant. The researcher called the
numbers instead of calling their names when she asked an interview question to a participant.
The interview contained four questions (Appendix D), and the participants’ answers to the
questions were recorded.
1) The Group Shown the Simulation on the PC Monitor
Based on the general method and procedure, the data from the PC group were collected in
a computer lab in Wallace Hall at Virginia Polytechnic Institute and State University from March
24, 1998 to April 9, 1998. The thirty participants were tested in a total of eleven sessions. Eight
sessions had three participants, and three sessions had two participants.
The researcher asked participants to read the instructions. The participants were asked to
sit on chairs about 3 feet from the PC monitor on the workstation. First, the researcher showed
the sequential walk-through on the PC monitor: the walk-through animation that was made along
a path (Figure 11). After that, for experimental test, the participants were shown parts of the
walk-through animation related to the dependent variables (Figure 12) and asked to mark their
answers on the sheets. A part of the walk-through animation was shown for each question.

53
After they finished the experimental test, they moved to adjacent office where they were
interviewed by the researcher.
2) The Group Shown the Simulation in the CAVETM
Data from the CAVETM group were collected in the CAVETM lab in Virginia Tech
Corporate Research Center from April 13, 1998 to April 30, 1998. The thirty participants were
tested in a total of thirteen sessions. Six sessions had three participants, five sessions had two
participants, and two sessions had one participant.
The researcher gave the instructions to the participants. First, the researcher showed the
sequential walk-through navigation that was saved along the path according to the whole walk-
through process (Figure 11). The participants wore the stereo glasses and stood facing the front
screen of the CAVETM (about 5 feet from the screen). The researcher held the tracking glasses at
the approximate average height of the participants in the center.
For the experimental test, the researcher showed parts of the walk-through: the point-to-
point navigation that was made according to the process of the parts of the walk-through (Figure
12) and asked to mark their answers on the sheets. The point-to-point navigation proceeded from
one numbered point to the next numbered point when the researcher pushed a button on the
wand.
When they answered the questions on visual forms and spatial relationships, they wore
the tracking glasses one-by-one because the regular glasses could cause distortion. When they
answered the questions on textures and colors, they wore regular shutter glasses, and the
researcher held the tracking glasses at the approximate average height of the participants in the
center. After the simulation, they were interviewed by the researcher in the adjacent room. The
method of the interview was the same as that of the PC group.
Data Analyses
1) Data from the Experimental Test and Hypotheses
Table 8 presents the method of data analyses. Each of the three questions on visual forms
and each of three questions on spatial relationships were analyzed by Chi-square, and each
question of three questions on colors and each question of three questions on textures were

54
analyzed by T-test. The results of the questions on each of the four dependent variables were
summarized to investigate each of the four research hypotheses.
Table 8. Data Analyses.
Researchhypotheses
Dependentvariables
Measurements Experimentaltest item number
Data analyses
Shape 2 Chi-squareProportion 4 Chi-square
1 Visual Forms
Size 10 Chi-squareDistance 1 Chi-squareDepth 3 Chi-square
2 Spatialrelationships
Proximity 9 Chi-squareValue 5 T-test
Chroma 6 T-test3 Colors
Hue 7 T-testRoughness 8 T-test4 Textures
Size of texture 11 T-test
Participants’ answers to each of three questions on visual forms (shape, proportion, and
size) and three questions on spatial relationships (distance, depth, and proximity) were classified
whether they are correct or incorrect for Chi-square. Participants’ answers to each of three
questions on colors (value, chroma, and hue) and two questions on textures (roughness of texture
and size of texture) were scored for T-test.
Participants’ answers to each of the three questions on colors (value, chroma, and hue)
were scored. On each poster with sixteen squares, five squares were the same as the square
above the poster, and thus represented the correct answer. When squares marked by a participant
were scored in a question, two points were added per right square, and two points were deducted
per wrong square [(2 x the number of right squares) - (2 x the number of wrong squares)]. For
instance, if a participant marked all five of the right squares, he/she received 10 points in a
question (2 x 5 = 10). If a participants marked four squares, but only three were right and one
was wrong, he/she received four points [(2 x 3) -(2 x 1) = 4].
Participants’ answers to each of the two questions on textures (roughness of texture and
size of texture) were scored. On the wall that had fifteen tiles, five of the tiles had the roughest
texture and represented the correct answer. On another wall, five of fifteen tiles that had the

55
smallest size of texture represented the correct answer. The scoring was the same as that for
questions on colors.
2) Data from the Interview
The qualitative data from the interview were studied to see whether there were some
similarities or differences in what participants in the two groups said. From this analysis,
patterns of similar responses emerged.
The researcher listened to the recorded answers of participants and made transcripts by
hands. Six participants’ responses in the two sessions from each of the two groups were typed
out using Microsoft Word. The transcriptions were analyzed carefully to make the coding
categories. The coding categories were made on the basis of the words and sentences that
participants use. The words and sentences that are repeated by participants were listed. The
words and sentences that have a similar meaning were categorized. After the categories were
made, the rest of the participants’ answers were coded according to the categories. The
statements of participants were summarized, and representative statements were quoted.
The data from question 12 was analyzed, focusing on whether the participants were
oriented to the spaces and whether their descriptions were. If a participant described the correct
sequence of the spaces as they saw the walk-through, or the correct directions of the spaces,
he/she was considered to be oriented. The items mentioned by participants were listed and
categorized whether their descriptions were detailed.
The data from question 13 were analyzed focusing on what kinds of perceptions they had.
Their perceptions were categorized into fascination with the technology, a three-dimensional
perception, a sense of presence, and physical sensation. A comparison between the two groups
was made based on these categories.
The data from the question 14 were analyzed focusing on how participants think about
the reality of the simulation. Participants’ answers were categorized whether they said that the
simulation was close to reality or not. A comparison between the two groups was made based on
these categories. According to participants’ statement, the aspects that made the simulation close
to reality and the aspects that made the simulations not close to reality were summarized.

56
The data from question 15 were analyzed focusing on what kinds of limitations were
mentioned and what the participants suggested to overcome the limitations. The limitations
mentioned by participants in the two groups were listed and tabled.