chapter iii research methodology 3.1 research questions
TRANSCRIPT
Siti Rosmalina Nurhayati, 2013 Students responses to the use of extensive reading activities in learning new vocabulary Universitas Pendidikan Indonesia | repository.upi.edu
Chapter III
RESEARCH METHODOLOGY
This chapter will present the research methodology which will deal with
research questions, research design, research subject, data colletion, data analysis
and establishment of trustworthiness.
3.1 Research Questions
Research questions on this study are formulated as follows:
1. What are students’ responses to the use of extensive reading activities
in learning new vocabulary?
2. What difficulties are faced by the students in implementing extensive
reading activities in learning new vocabulary?
3.2 Research Design
This study is designed to describe and interpret a phenomenon of students’
responses to the use of extensive reading activities in learning new vocabulary.
This research is a qualitative study. As satated by Pearson (2007), in a qualitative
research, a single phenomenon of interest is researched then being stated in a
purpose statement. It means the qualitative study description is emphasized in this
study. Therefore, this study will use a descriptive method in describing the finding
of the data.
Siti Rosmalina Nurhayati, 2013 Students responses to the use of extensive reading activities in learning new vocabulary Universitas Pendidikan Indonesia | repository.upi.edu
According to Nazir (2003), descriptive method is a method which analyzes
the status of a group, an object, a set of confition, or an event happening in the
present. It means descriptive method is aimed to describe the current situtaion.
3.3 Research Subject
3.3.1 Population and Sample
The selection of the school was based on the following consideration. The
school considered that students’ vocabulary mastery should be improved, so the
school gave a chance to the researcher to conduct a research.
The population of this study was the twelve grade students of a senior high
school in Banten. The sample of this research was XII Social 3 class. The total
number of the class was 30 students. In choosing the sample, this particular class
was chosen based on the recommendation from the school
3.4 Data Collection
In collecting the data, triangulation technique was used. Based on
Alwasilah (2009), in qualitative research, triangulation technique is a technique to
collect data from some sources. Triangulation technique was used to make sure all
the data gained relatively consistent.
There were three ways in collecting the data in this study, they were
questionnaire, interviews and observation.
Siti Rosmalina Nurhayati, 2013 Students responses to the use of extensive reading activities in learning new vocabulary Universitas Pendidikan Indonesia | repository.upi.edu
Figure 3.1
Triangulation Method
3.4.1 Questionnaire
Questionnaire is the most popular data collection technique in descriptive
research (Alwasilah, 2009). Questionnaire was used to reveal students’ responses
to the use of extensive reading activity. For this study there were two forms of
questionnaire. The first form (form I) was closed-questionnaire and the second
(form II) was open-questionnaire.
Form I was closed-questionnaire. In this questionnaire, respondents were
provided with ready-made response options to choose from, normally by ticking
or encircling one of them by putting an “X” or “V” in the appropriate slot or box
(Dornyei & Taguchi, 2009). So, in this closed-questionnaire, respondents were not
required to produce any free writing; instead, they only choose one of the given
alternatives. The benefit of this technique is that the coding and tabulation is
Data collection strategy
(Triangulation)
Questionnaire Observation Interviews
Siti Rosmalina Nurhayati, 2013 Students responses to the use of extensive reading activities in learning new vocabulary Universitas Pendidikan Indonesia | repository.upi.edu
straightforward and leaves no room for other subjectivity (Dornyei & Taguchi,
2009).
The technique in giving score towards students’ answer in this closed-
questionnaire was using Likert Scales. This scaling technique was invented by
Rensis Likert. Likert scales consist of a series of statements all of which are
related to a particular target. Respondents are asked to indicate the extent to which
they agree or disagree with these items by marking (Dornyei & Taguchi, 2009).
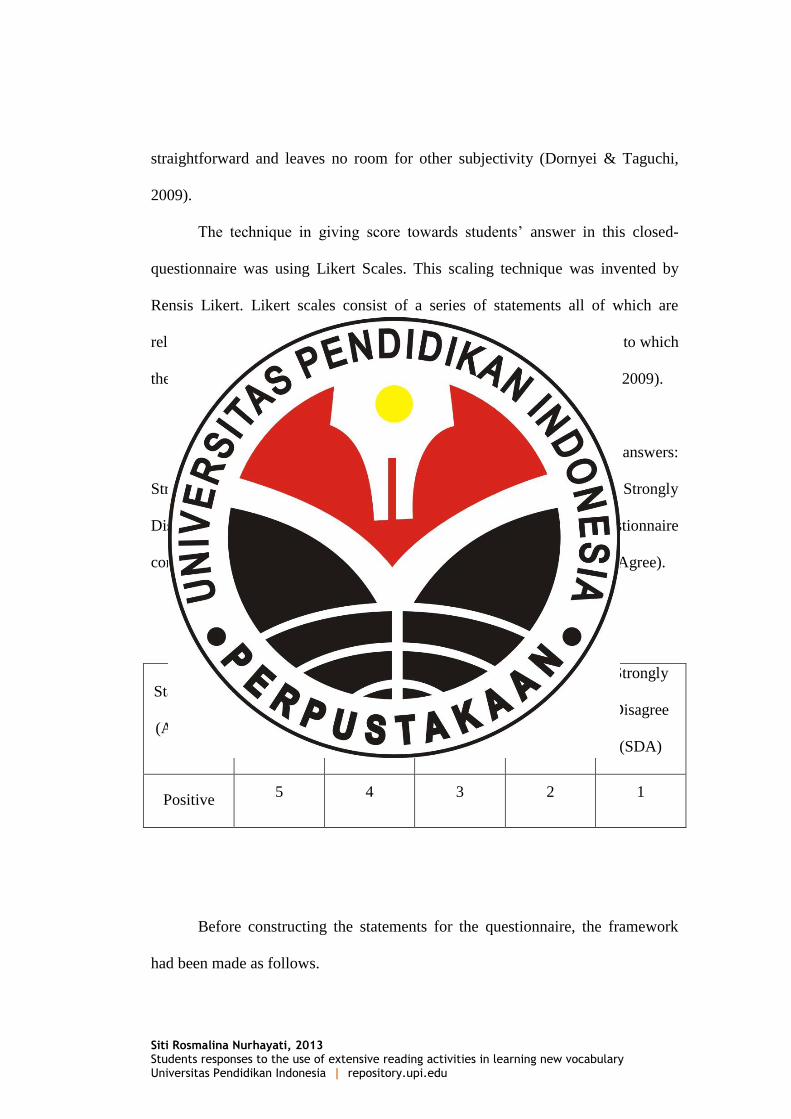
In this study, the Form I was consists of nine questions with five answers:
Strongly Agree (SA), Agree (A), Uncertain (UC), Disagree (DA), and Strongly
Disagree (SDA). Based on the likert scales, each statement in the questionnaire
consists of value from 1-5 which 5 is the most positive answer (Strongly Agree).
Table 3.1
The Table of Scoring System of the Questionnaire
Statements
(Answers)
Strongly
Agree
(SA)
Agree
(A)
Uncertain
(UC)
Disagree
(DA)
Strongly
Disagree
(SDA)
Positive 5 4 3 2 1
Before constructing the statements for the questionnaire, the framework
had been made as follows.
Siti Rosmalina Nurhayati, 2013 Students responses to the use of extensive reading activities in learning new vocabulary Universitas Pendidikan Indonesia | repository.upi.edu
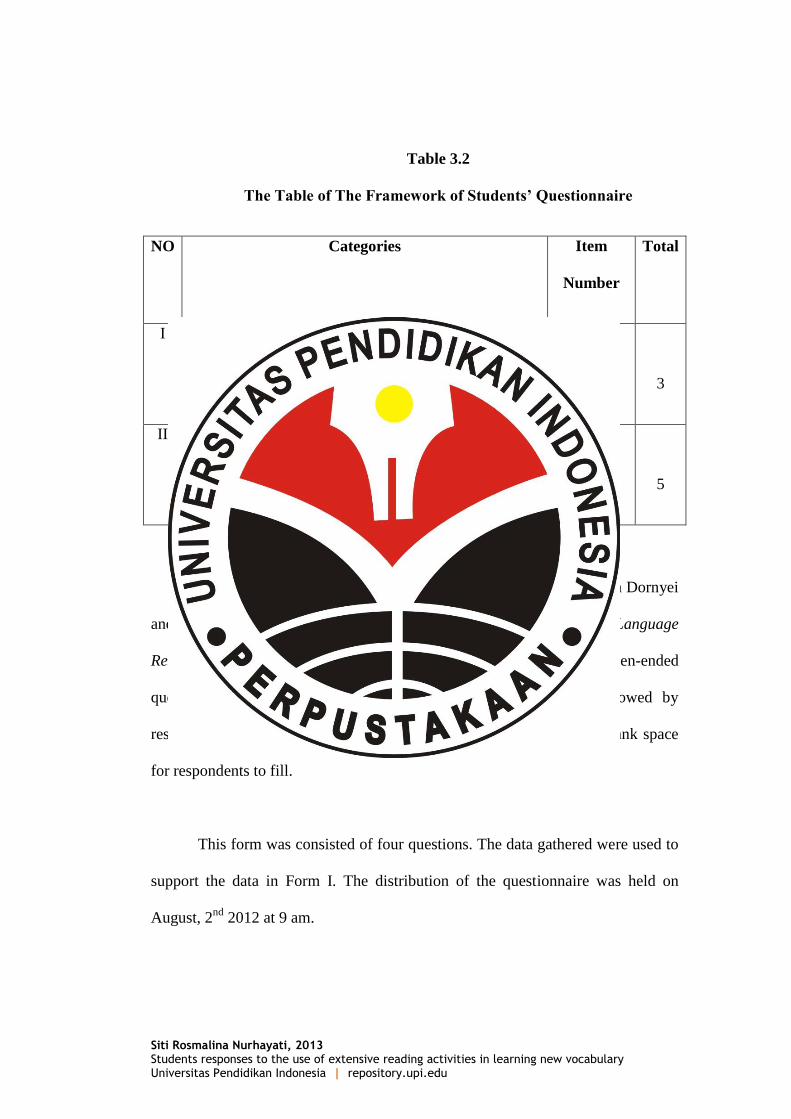
Table 3.2
The Table of The Framework of Students’ Questionnaire
NO Categories Item
Number
Total
I Students’ personal feeling and attitude toward the
implementation of extensive reading activities
1,3,4,5
3
II Students’ response to the benefit and goals towards the
implementation of extensive reading activities
2, 6-9
5
Form II of the questionnaire was an open-questionnaire. Based on Dornyei
and Taguchi (2009) in their book etitled “Questionnaires in Second Language
Research Construction Administration and Processing”, open-ended
questionnaire includes items where the actual question is not followed by
response options for respondents to choose from but rather by some blank space
for respondents to fill.
This form was consisted of four questions. The data gathered were used to
support the data in Form I. The distribution of the questionnaire was held on
August, 2nd
2012 at 9 am.
Siti Rosmalina Nurhayati, 2013 Students responses to the use of extensive reading activities in learning new vocabulary Universitas Pendidikan Indonesia | repository.upi.edu
3.4.2 Interviews
The interviews were conducted to support the data collected from
questionnaire. In addition, the interview were expected to check the accuracy of
the questionnaire and to find some additional information.
The interviews were conducted in August 3rd 2012. They were conducted
by the researcher to the sample class and to the English teacher who implement
the extensive reading activities. There were 15 students who were involved in
interviews session. The process of interviews were audio-taped and transcribed.
The interviews were in Indonesia language for better understanding.
Before conducting the interviews, the framework had been made as
follows.
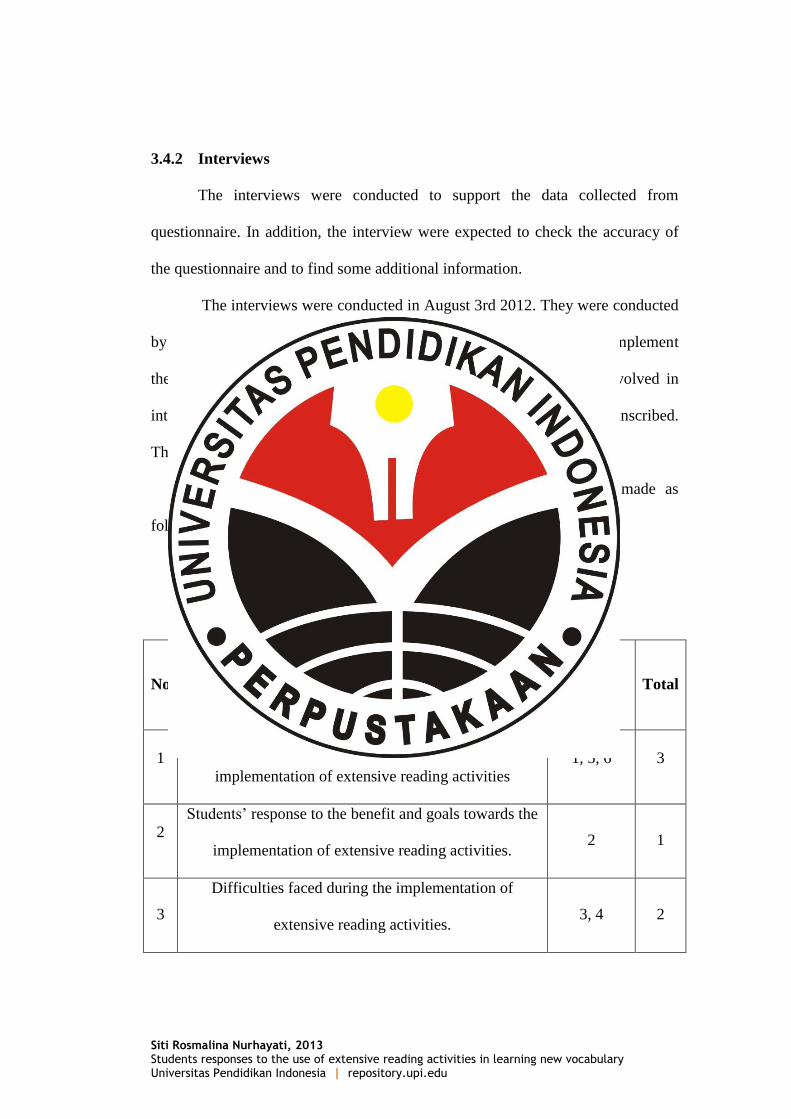
Table 3.3
The Table of The Framework of Students’ Interviews
No Categories
Item
Number
Total
1
Students’ personal feeling and attitude toward the
implementation of extensive reading activities
1, 5, 6 3
2
Students’ response to the benefit and goals towards the
implementation of extensive reading activities. 2 1
3
Difficulties faced during the implementation of
extensive reading activities. 3, 4 2
Siti Rosmalina Nurhayati, 2013 Students responses to the use of extensive reading activities in learning new vocabulary Universitas Pendidikan Indonesia | repository.upi.edu
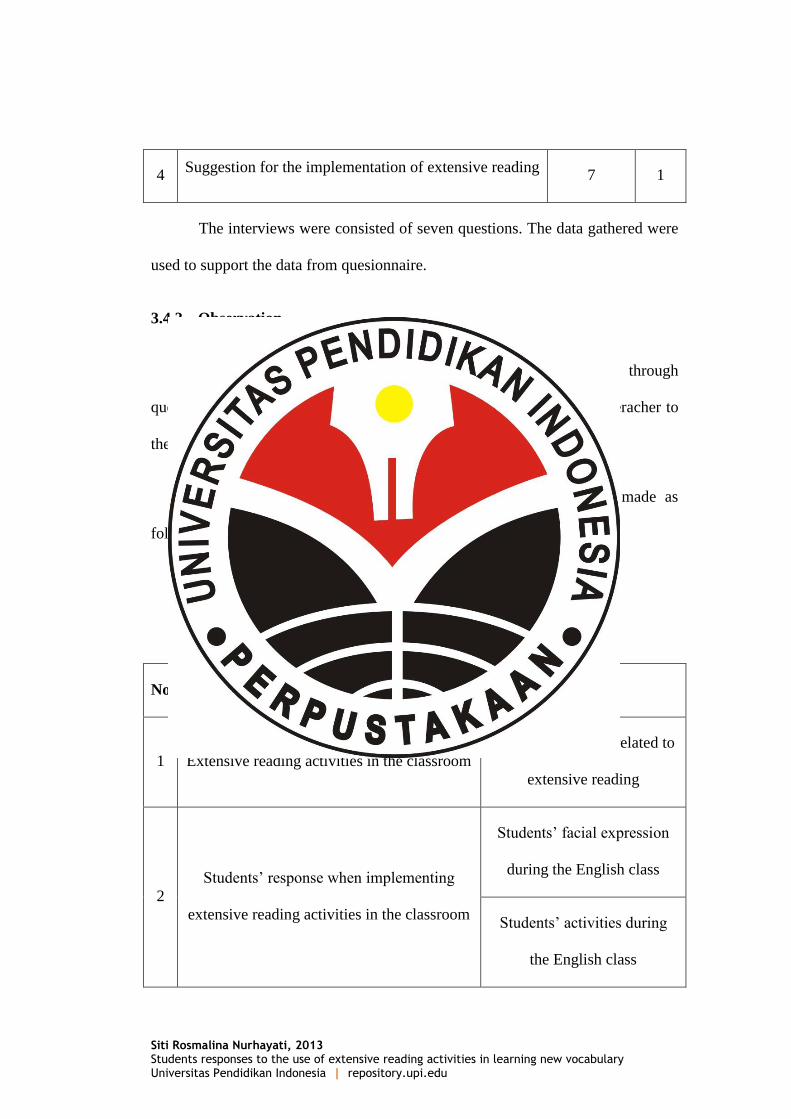
4 Suggestion for the implementation of extensive reading
7 1
The interviews were consisted of seven questions. The data gathered were
used to support the data from quesionnaire.
3.4.3 Observation
The observation was conducted to support the data gathered through
questionnaire and interview. The observation was conducted by the reseracher to
the sample class during teaching and learning activity.
Before conducting the observation, the framework had been made as
follows.
Table 3.4
The Table of The Framework of The Observation
No Categories Indicators
1 Extensive reading activities in the classroom
Learning activities related to
extensive reading
2
Students’ response when implementing
extensive reading activities in the classroom
Students’ facial expression
during the English class
Students’ activities during
the English class
Siti Rosmalina Nurhayati, 2013 Students responses to the use of extensive reading activities in learning new vocabulary Universitas Pendidikan Indonesia | repository.upi.edu
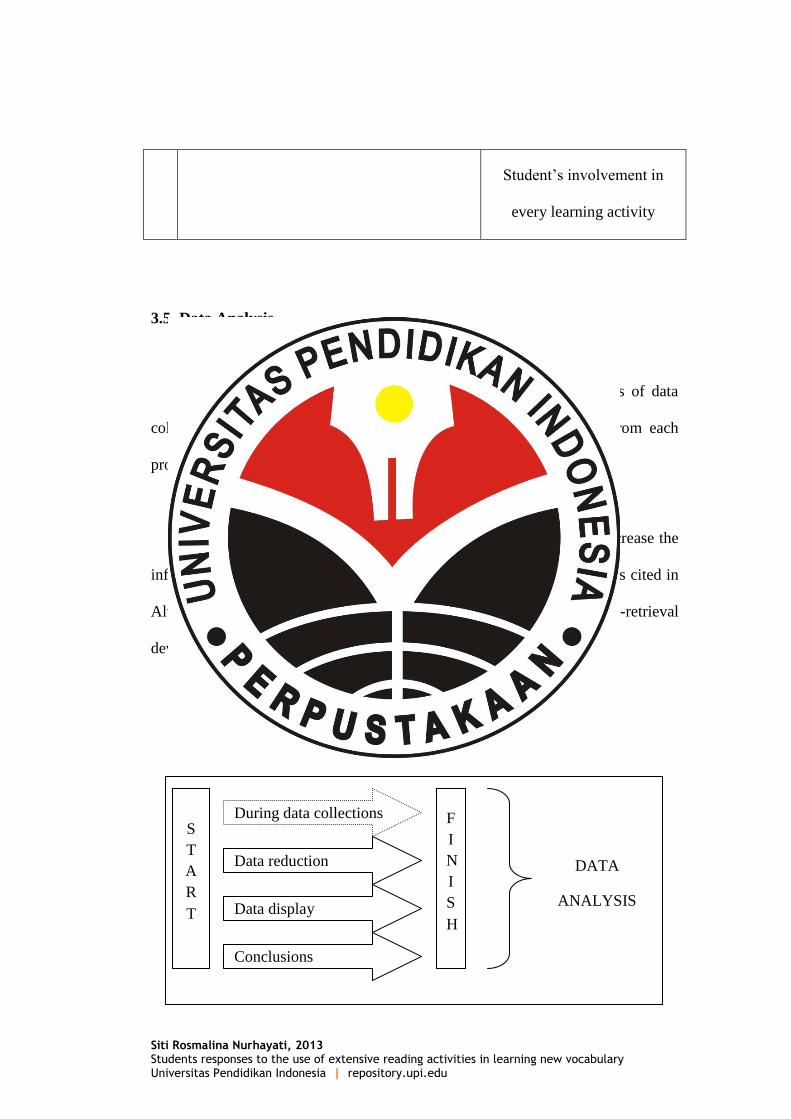
Student’s involvement in
every learning activity
3.5 Data Analysis
The data analysis was done after conducting the whole process of data
collection (questionnaire, observation, and interview). The data got from each
process were coded into categories.
Based on Creswell (2002), the coding procedure was done to decrease the
information to categories. In line with Creswell, Miles and Huberman, as cited in
Alwasilah (2002), stated that code is efficient data-labelling and data-retrieval
devices. They empower and speed up analysis.
Figure 3.2
Interactive Model by Miles and Huberman (1984)
S
T
A
R
T
During data collections
Data reduction
Data display
Conclusions
F
I
N
I
S
H
DATA
ANALYSIS
Siti Rosmalina Nurhayati, 2013 Students responses to the use of extensive reading activities in learning new vocabulary Universitas Pendidikan Indonesia | repository.upi.edu
Based on the model, it can be seen that this study used descriptive
qualitative method to analyze the data, after the data collected from questionnaire,
observation, and interview were summarized. Then the items needed for the
research were chosen while the unimportant ones were deleted. The deletion
process is called data reduction. Then, the next step was displaying the data by
using charts, tables and narrative text. In the process of displaying the data,
researcher used qualitative and quasi-statistics method. From quasi-statistics,
researcher could see the frequency of the appearance of each students’ responses,
the qualitative method was used to explain the result from quasi-statistics method.
3.5.1 Quantitative Data
In quantitative data, the questionnaire that has been made has to go
through the validity and reliability test. Both of them were important in research
since if they were not recognized, it would be fatal in giving conclusion or giving
reasons of the relationship between the variable (Nazir,2003). Based on Lynn and
Gronlund (1995), validity refers to the adequacy and appropriateness of the
interpretations made from assessment; thus validity concerns with the specific use
of assessment results and the soundness of the interpretation of those result.
Reliability refers to the consistency of assessment result. Reliability is needed to
get the valid result.
Validity and reliability testing were conducted to the population not the
sample. Then, the result of the questionnaire was calculated to find out whether
Siti Rosmalina Nurhayati, 2013 Students responses to the use of extensive reading activities in learning new vocabulary Universitas Pendidikan Indonesia | repository.upi.edu
the statements in the questionnaire were valid and reliable before conducted the
questionnaire to the sample. To calculate the validity and reliability of a
questionnaire with likert scale, the result of the questionnaire was calculated by
Alpha-formula (Ghozali, 2001). To calculate the result, SPSS 20 for Windows 7
program was used. There were ten questions on the questionnaire. The score of
validity for each item is rcount which can be seen from the corrected item-total
correlation table from SPSS data output. Each item is valid if rcount > rtable . The
questionnaire was conducted toward 30 respondents with the level of significant
5% and the rtable is 0,3. The result of the computation of validity for each item can
be seen on the table below.
Table 3.5
The Computation Result of Validity for Questionnaire
No rcount rtable Interpretation
1 0,384 0,3 Valid
2 0,516 0,3 Valid
3 0,455 0,3 Valid
4 0,577 0,3 Valid
5 0,555 0,3 Valid
6 0,511 0,3 Valid
7 0,628 0,3 Valid
8 0,640 0,3 Valid
9 0,482 0,3 Valid
Siti Rosmalina Nurhayati, 2013 Students responses to the use of extensive reading activities in learning new vocabulary Universitas Pendidikan Indonesia | repository.upi.edu
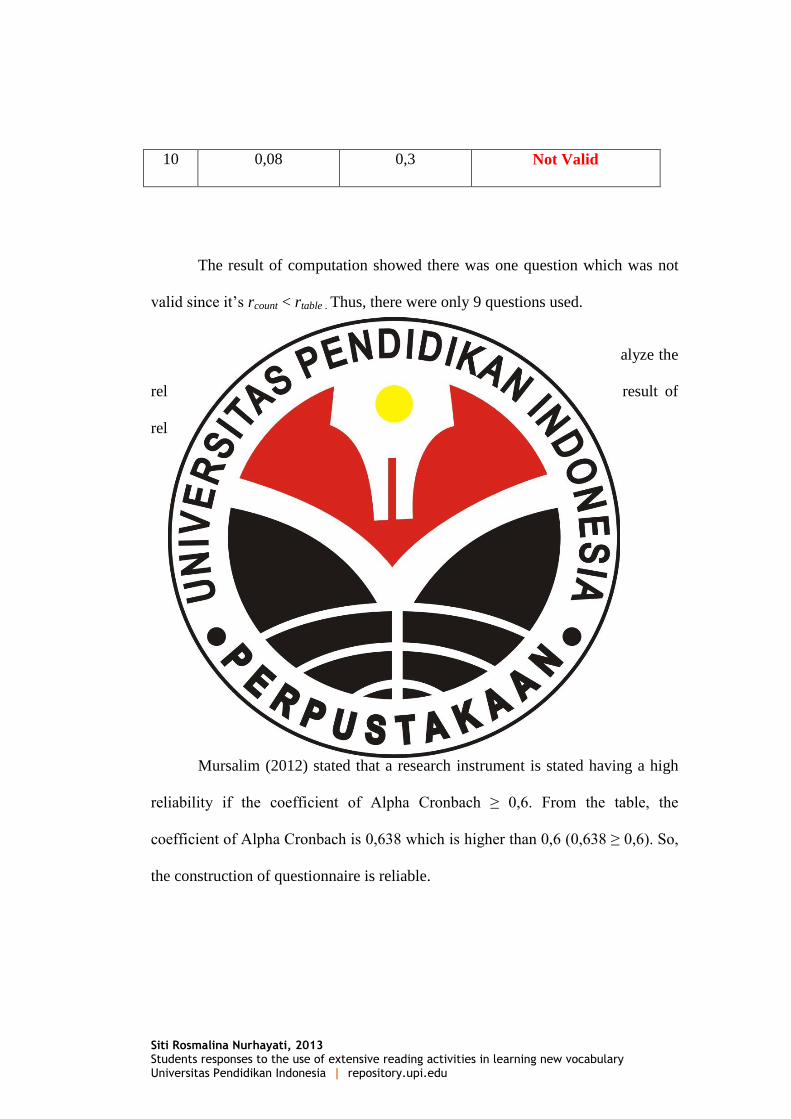
10 0,08 0,3 Not Valid
The result of computation showed there was one question which was not
valid since it’s rcount < rtable . Thus, there were only 9 questions used.
Moreover, the calculation of Alpha Cronbach can also used to analyze the
reliability of the instrument. The table below shows the computation result of
reliability for the questionnaire.
Table 3.6
Reliability Statistics
Cronbach's
Alpha
N of
Items
0,638 10
Mursalim (2012) stated that a research instrument is stated having a high
reliability if the coefficient of Alpha Cronbach ≥ 0,6. From the table, the
coefficient of Alpha Cronbach is 0,638 which is higher than 0,6 (0,638 ≥ 0,6). So,
the construction of questionnaire is reliable.
Siti Rosmalina Nurhayati, 2013 Students responses to the use of extensive reading activities in learning new vocabulary Universitas Pendidikan Indonesia | repository.upi.edu
After the validity and reliability testing were finished, the data gathered
from the questionnaire were tabulated and presented through some stages as
follow:
1. Examining the data obtained from the questionnaire.
2. Calculating the frequency (fo) of the respondents who answer each of
items or statements. Then, it is calculating the percentage (%) of each total
frequency of the respondents’ answers to the item by using the formula
below:
Percentage (%) = 𝑇𝑜𝑡𝑎𝑙 𝑟𝑒𝑠𝑝𝑜𝑛𝑑𝑒𝑛𝑡 𝑎𝑛𝑠𝑤𝑒𝑟𝑖𝑛𝑔 𝑎𝑛 𝑖𝑡𝑒𝑚 (𝑓𝑜 )
𝑇𝑜𝑡𝑎𝑙 𝑅𝑒𝑠𝑝𝑜𝑛𝑑𝑒𝑛𝑡𝑠 (𝑛) x 100 %
(sudajana, 1984:49)
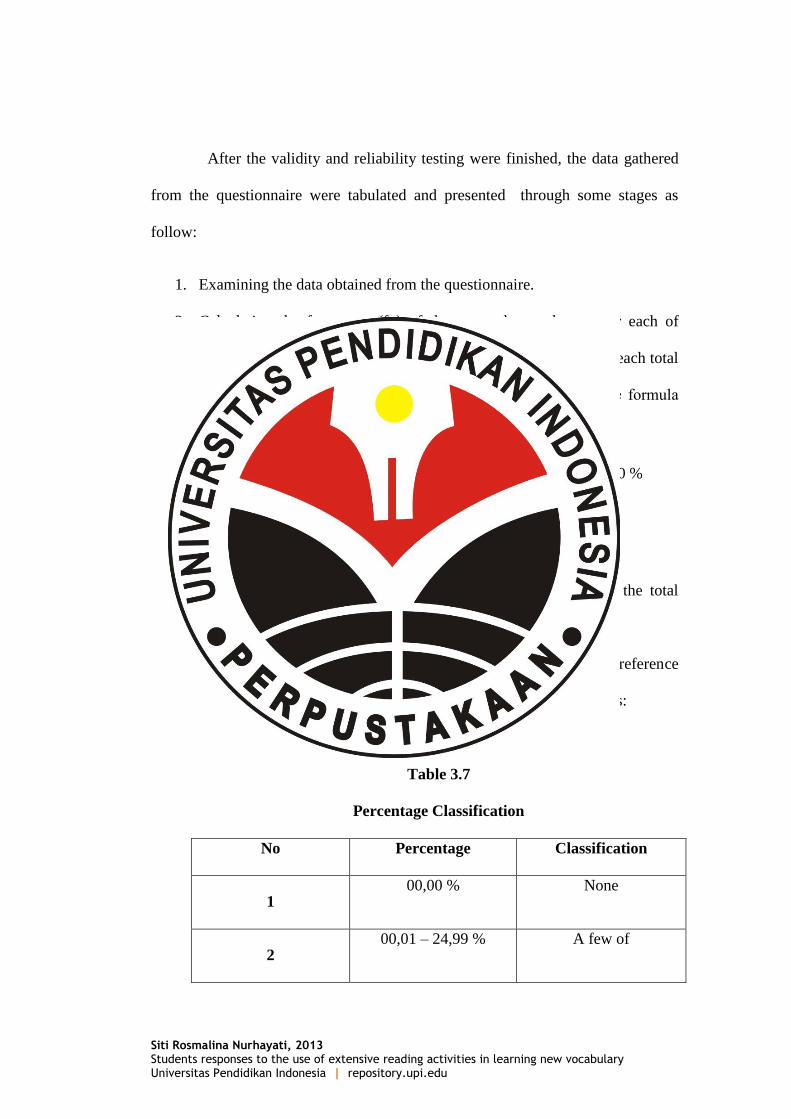
3. Interpreting the result of percentage (%) calculation based on the total
frequency (fo) of each item.
4. Classifying the data to be interpreted, therefore it is using reference
according to suryadi (1987) as cited in Hamidah (2005) as follows:
Table 3.7
Percentage Classification
No Percentage Classification
1 00,00 % None
2 00,01 – 24,99 % A few of
Siti Rosmalina Nurhayati, 2013 Students responses to the use of extensive reading activities in learning new vocabulary Universitas Pendidikan Indonesia | repository.upi.edu
3 25,00 – 49,99 % Nearly half of
4 50 % Half of
5 50,01 – 74,99 % Best part of
6 75 – 99,99 % Nearly all of
7 100 % All of
3.5.2 Qualiative Data
The result of interview, observation, and open-questionnaire are included
into qualitative data. Those three data collecting method were done to get more
information related to the research questions.
3.6 Establishment of Trustworthiness
To avoid violating the result of the study, it is necessary to set up the
variety and how to pursue it. This point discusses the validity of data and it refers
to trustworthiness and integrity of description, conclusion, elucidation
interpretation and entire types of report (Alwasilah, 2002). Here are criteria to
fulfill the investigation from the naturalistic paradigm based on Alwasilah
(2002:169), they are credibility, transferability, dependability and confirmability.
Siti Rosmalina Nurhayati, 2013 Students responses to the use of extensive reading activities in learning new vocabulary Universitas Pendidikan Indonesia | repository.upi.edu
To reach the credibility aspect, this study applied multimethod technique
to gain data. It is called triangulation technique. They are through questionnaire,
interview, observation and document analysis. If they are combined, they could
increase the credibility of the research. To reach the transferability aspect, it was
done through thick description that enables the researcher interested in making a
transfer to reach a conclusion.