chapter iv data presentation and discussiondigilib.uinsby.ac.id/11306/7/bab4.pdfthose who were...
TRANSCRIPT
48
CHAPTER IV
DATA PRESENTATION AND DISCUSSION
This study investigated the effectiveness of comic strips as a media in
teaching writing in helping students in generating idea to start writing. This chapter
presents the answer to the statement of the problem in this study. The result of the
finding and the data analyzed was from the research conducted at MTs. At-Taqwa.
The data obtained in this study was the quantitative data from the comparison of the
test values in the experimental and the control group. Then, the data was calculated to
find the means scores of both groups. Then the t-test formula was used to analyze the
significance of the result of this study. It is to find out whether there is a significant
difference between the students who were taught using comic strips as a media and
those who were taught using LKS as a media. This chapter is divided into two
subheadings, they are finding and discussion.
A. Data Presentation
The score of the test was assessed based on the ESL Composition that
was showed in five components: content, organization, vocabulary, language use
and mechanic. The result of this test is presented in the following table.
Edited with the trial version of Foxit Advanced PDF Editor
To remove this notice, visit:www.foxitsoftware.com/shopping

49
Table 4.1 The Result of Control Group
Component The Result of Control Group
C O V L M
Total 601 544 509 510 140
Mean 19 17 16 16 4
Table 4.2 The Result of Experimental Group
Component The Result of Experimental Group
C O V L M
Total 732 586 527 599 143
Mean 23 18 16 19 4
Based on the table above, it can be seen that the total scores of the final
test in experimental group is higher than control group.
The result above shows that the students’ ability in writing was different.
The mean of the content component of control group is 19. It means that the
students had limited knowledge in the content of the paragraph; the content had
to be developed more, and it also showed inadequate development of the topic.
But the mean of the content component of experimental group is 23. It means
Edited with the trial version of Foxit Advanced PDF Editor
To remove this notice, visit:www.foxitsoftware.com/shopping
50
that most of content in the students’ writing support the topic but it was lack
details.
At the organization component of control group the means is 17. It means
that logical sequence of generic structure (orientation, events, and conclusion),
loosely organized but main ideas were stand out, and also the supported ideas are
limited. While at the organization component of experimental group, the mean is
18. It means that the students’ writing was well organize and had complete
generic structure of recount (orientation, events, and conclusion), the ideas were
clearly stated, and also there were logical sequencing of events.
For vocabulary component of the experimental group and control group,
the mean was the same. The mean was 16. It means that the use of language
feature of recount text was appropriate, and there were occasional errors of word
choice but the meaning was obscured.
Meanwhile the mean of the language use component of control group was
16. It means that the students’ writing rarely mentioned the order of event, and
there were major problem in the use of simple past tense, action verb, articles,
proper noun and pronouns but meaning were obscured. In contrary the mean of
the language use component of experimental group was 19. It means that the
students’ language use were limited showing the order events, the use of simple
past tense, action verb, articles, proper noun and pronouns but meaning seldom
obscured.
Edited with the trial version of Foxit Advanced PDF Editor
To remove this notice, visit:www.foxitsoftware.com/shopping
51
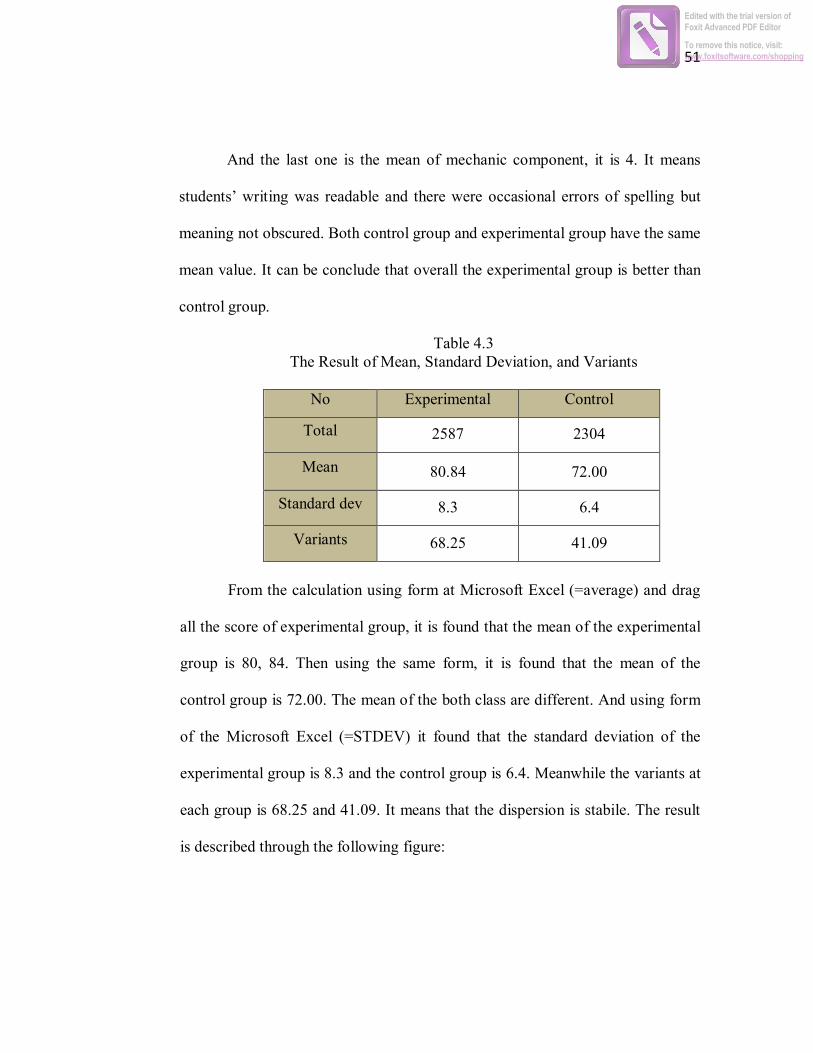
And the last one is the mean of mechanic component, it is 4. It means
students’ writing was readable and there were occasional errors of spelling but
meaning not obscured. Both control group and experimental group have the same
mean value. It can be conclude that overall the experimental group is better than
control group.
Table 4.3 The Result of Mean, Standard Deviation, and Variants
No Experimental Control
Total 2587 2304
Mean 80.84 72.00
Standard dev 8.3 6.4
Variants 68.25 41.09
From the calculation using form at Microsoft Excel (=average) and drag
all the score of experimental group, it is found that the mean of the experimental
group is 80, 84. Then using the same form, it is found that the mean of the
control group is 72.00. The mean of the both class are different. And using form
of the Microsoft Excel (=STDEV) it found that the standard deviation of the
experimental group is 8.3 and the control group is 6.4. Meanwhile the variants at
each group is 68.25 and 41.09. It means that the dispersion is stabile. The result
is described through the following figure:
Edited with the trial version of Foxit Advanced PDF Editor
To remove this notice, visit:www.foxitsoftware.com/shopping

52
Figure 4.1
Chart of the Total Score and Mean in the both of Group
Then, to know whether it is significant that those groups were different or
it was just by chance, it was tested using t-test. The terms of use the t-test are
normal distribution and homogeneous variants. Therefore, the normality and
homogeneity data were analyzed.
1. Normality test
Table 4.4 Normality test
Interval �0 �
ℎ �
0− �
ℎ
(�0
−
�ℎ)2
(�0
− �ℎ
)2
�ℎ
58-64 4 2 2 5 2.98726
65-71 12 9 3 11 1.28891
72-78 14 22 -8 62 2.81624
79-85 22 22 0 0 0.00113
86-92 8 9 -1 0 0.05018
93-99 4 2 2 5 2.98726
0
500
1000
1500
2000
2500
3000
TOTAL SCORE MEAN
EXPERIMENTAL
CONTROL
Edited with the trial version of Foxit Advanced PDF Editor
To remove this notice, visit:www.foxitsoftware.com/shopping
53
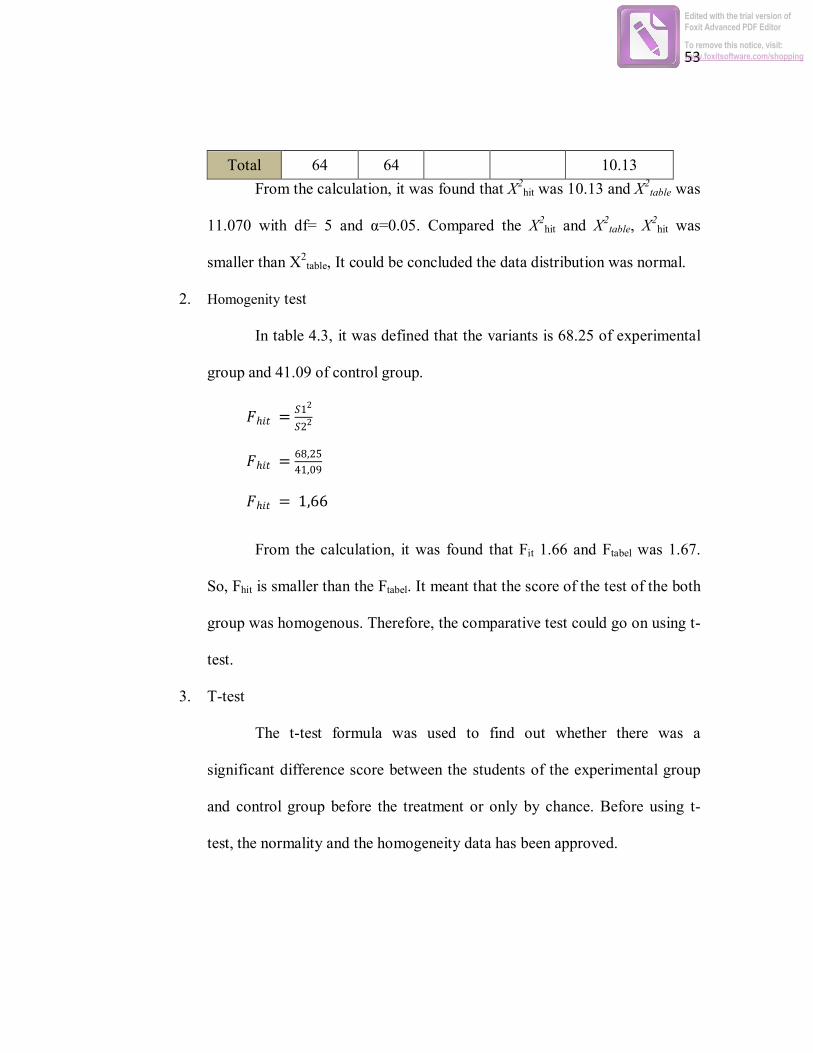
Total 64 64 10.13
From the calculation, it was found that X2hit was 10.13 and X2
table was
11.070 with df= 5 and α=0.05. Compared the X2hit and X2
table, X2hit was
smaller than X2table, It could be concluded the data distribution was normal.
2. Homogenity test
In table 4.3, it was defined that the variants is 68.25 of experimental
group and 41.09 of control group.
�ℎ�� =�12
�22
�ℎ�� =68,25
41,09
�ℎ�� = 1,66
From the calculation, it was found that Fit 1.66 and Ftabel was 1.67.
So, Fhit is smaller than the Ftabel. It meant that the score of the test of the both
group was homogenous. Therefore, the comparative test could go on using t-
test.
3. T-test
The t-test formula was used to find out whether there was a
significant difference score between the students of the experimental group
and control group before the treatment or only by chance. Before using t-
test, the normality and the homogeneity data has been approved.
Edited with the trial version of Foxit Advanced PDF Editor
To remove this notice, visit:www.foxitsoftware.com/shopping
54
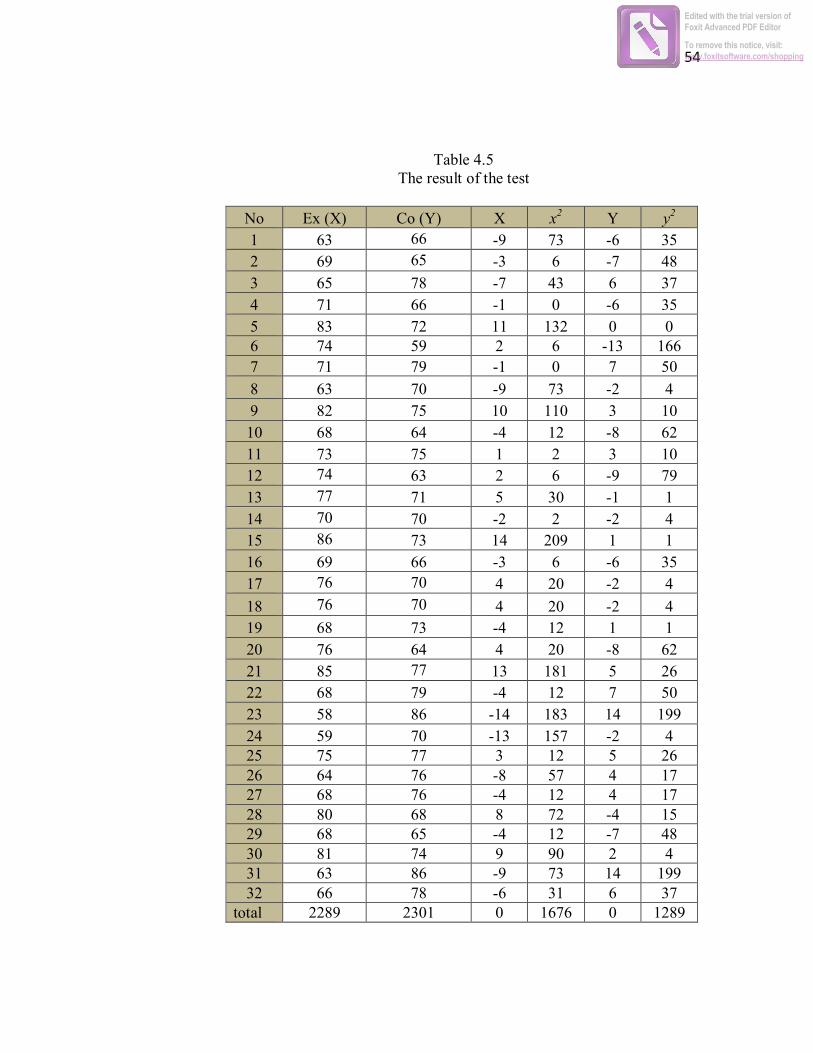
Table 4.5 The result of the test
No Ex (X) Co (Y) X x2 Y y2
1 63 66 -9 73 -6 35
2 69 65 -3 6 -7 48
3 65 78 -7 43 6 37
4 71 66 -1 0 -6 35
5 83 72 11 132 0 0 6 74 59 2 6 -13 166
7 71 79 -1 0 7 50
8 63 70 -9 73 -2 4
9 82 75 10 110 3 10
10 68 64 -4 12 -8 62
11 73 75 1 2 3 10
12 74 63 2 6 -9 79
13 77 71 5 30 -1 1
14 70 70 -2 2 -2 4
15 86 73 14 209 1 1
16 69 66 -3 6 -6 35
17 76 70 4 20 -2 4
18 76 70 4 20 -2 4
19 68 73 -4 12 1 1
20 76 64 4 20 -8 62
21 85 77 13 181 5 26
22 68 79 -4 12 7 50
23 58 86 -14 183 14 199
24 59 70 -13 157 -2 4 25 75 77 3 12 5 26 26 64 76 -8 57 4 17 27 68 76 -4 12 4 17 28 80 68 8 72 -4 15 29 68 65 -4 12 -7 48 30 81 74 9 90 2 4 31 63 86 -9 73 14 199 32 66 78 -6 31 6 37
total 2289 2301 0 1676 0 1289
Edited with the trial version of Foxit Advanced PDF Editor
To remove this notice, visit:www.foxitsoftware.com/shopping

55
To answer the question above, it should have an alternative
hypothesis (Ha) and null hypothesis (Ho).
Ha : there is a sigificant difference score between the students of the
experimental group and control group before the treatment.
Ho : there is no significant difference score between the students of the
experimental group and control group before the treatment
Next, the students’ score of the test was calculated using the formula
bellow:
� =��,� – ��,�
������ � ����
���������
�
���
�
���
� =0,38
�[1,728][0,062]
� = 0,216
Using the form above, it was found that the result of t is 4.78. The
next step compared the tscore to ttabel. To compare it, the number of degree
freedom (df) was calculated.
2 21 1
2
Mx Myt
X Y
Nx Ny Nx Ny
Edited with the trial version of Foxit Advanced PDF Editor
To remove this notice, visit:www.foxitsoftware.com/shopping

56
df = (N1+N2) – 2
df= (32+32) – 2
df= 62
The score of df=62 was assessed on a table by significance level 5%.
The T-table score was 2.000. The criteria is if tscore ≤ ttabel means = H0 is
accepted and Ha rejected. Or if tscore ≥ ttabel means H0 is rejected and Ha is
accepted.1 It is seen that t score was higher than t table. So, Ha is accepted.
B. Discussion
This study is about the effectiveness of teaching writing by using the
quasi experimental research design. There were two groups, the control group
and the experimental group. To determine the control and experimental group,
before the treatment a test was given to the students. And on the last meeting, a
final test was conducted on two classes of control and experimental groups. The
test was to know whether comic strips are more effective in generating idea to
start writing than LKS.
The result of the test of both groups showed different value. The mean
score of experimental group was 80.84 and mean score of control group was
72.00. The experimental group achieved higher than control group. Next, using t-
test to verify the significant those different score or it was only by chance.
1 Sugiyono, Statistika untuk ......................................97
Edited with the trial version of Foxit Advanced PDF Editor
To remove this notice, visit:www.foxitsoftware.com/shopping

57
Then from the calculation of t-test, the result shows that t value was
higher than t table. The criteria was if tscore ≤ ttabel means = H0 is accepted and Ha
is rejected. Or if tscore ≥ ttabel means H0 is rejected and Ha is accepted. Since the
experimental group achieved higher than control group, it means that the
alternative hypothesis (Ha) that say there is a significant difference score
between the students of the experimental group and control group after the
treatment is accepted. It concluded that the difference treatment of the two
groups gave a significance difference of their writing ability. It can be said that
teaching writing using comic strips as a media is more effective in generating
idea to start writing than teaching writing using LKS as a media among the
eighth graders at MTs At-Tawas Kalanganyar, Lamongan.
This effectiveness is possibly because the criteria of recount text and
comic strips are well matched. Recount text is a kind of text that retell past
events, usually in the order in which they occurred. The purpose of writing
recount text is to give the readers information by presenting series of events. And
comic strips present a series of picture that tell a story.
Looking at the definition and the purpose of the recount text and comic
strips, the writer assumed that comic strips and recount text have a similar thing.
Both of them are a series story. They tell the reader information step by step. But
comic strips present it by picture. And recount text presents it by text or in
paragraph. Comic strips are an appropriate teaching aid to write recount text.
Therefore, teaching writing using comic strips as a media is more effective in
Edited with the trial version of Foxit Advanced PDF Editor
To remove this notice, visit:www.foxitsoftware.com/shopping

58
helping students in generating idea to start writing than teaching writing using
LKS as a media, especially in recount text.
Comic strips can ease one of the toughest parts of the writing process:
finding ideas and getting started. Based on my pre observation, many students
regularly groan that they do not have anything to write about. Teachers can use
comic strips as visual aids to help students improving their writing skills. This
aid is useful to be an outline to make students easy to express what they want to
write. Furthermore, comic strips as a media made the students feel that writing
was not a difficult activity. Comic strips as a media help students to organize
their idea to start writing.
The result of this study shows that a comic strip is an effective media in
teaching writing in helping students in generating idea to start writing. It could
help the English teacher in teaching writing to increase their students’
achievement. Teaching English writing by using LKS makes the students feel
bored and did not interested to the learning process. Unfortunately, writing was
felt quite difficult to be taught. So, the teacher needs a new media that involves
students actively in the learning process. So students do not just shut up and
accept the explanation from the teacher only. Teacher must be able to make
learning interesting and fun by using an interesting media. The result of this
study can be used as the reference for teachers to use comic strips as a media in
teaching writing to increase the students’ achievement in writing.
Edited with the trial version of Foxit Advanced PDF Editor
To remove this notice, visit:www.foxitsoftware.com/shopping