chapter iv. diagnostics
TRANSCRIPT
IV. Diagnostics
Summary
Since the discovery of the hepatitis C virus in 1988, the field of HCV diagnostics has advancedrapidly. Key tests for diagnosing chronic HCV infection, assessing prognosis, predicting andmonitoring the effects of treatment, and measuring other complications of HCV infection include:HCV-antibody and RNA-PCR (viral load) tests; liver function tests (LFTs); HCV-genotypic tests;and body scanning technologies such as liver scan, computerized tomography (CT) scans, magneticresonance imaging (MRI) scans, and ultrasound surveillance for hepatocellular carcinoma (HCC).Liver biopsy is still considered the “gold standard” for assessing HCV-induced liver damage anddetermining the need for HCV treatment, though researchers are working intensively to discoveraccurate but less invasive techniques.
Diagnosis of Acute Hepatitis C Infection. Most individuals will develop antibodies to hepatitis Cvirus (HCV) six weeks to six months after they have been infected, although in some instancesantibodies to HCV will not appear for years after infection (M. J. Alter 1992; Beld 1999). TheEIA-3 (the latest version of the HCV antibody test) has a sensitivity of 97%; however, it has apositive predictive value of only 25% in low-risk individuals (Gretch 1997). Therefore, any positiveEIA-3 results, especially in individuals at low risk or individuals with rheumatoid factor or highimmunoglobulin levels, need verification with confirmatory testing using either a recombinantimmunoblot assay (RIBA, another test for antibodies to hepatitis C) or HCV-RNA testing (whichidentifies the presence of viral RNA and hence the actual virus). Because people who haveachieved spontaneous viral clearance of HCV may remain HCV-antibody-positive, confirmatorytesting for the presence of HCV RNA is needed to distinguish resolved infections from active,current infections. HCV-infected individuals may be intermittently viremic (Beld 1999; Villano1999). In order to confirm or rule out current HCV infection, it is recommended that people withundetectable HCV-RNA levels have a follow-up HCV-RNA test six months later.
Individuals with acute HCV infection may receive a false negative antibody test result prior toseroconversion (when blood tests change from antibody-negative to antibody-positive). Somepeople may not be able to produce antibodies to hepatitis C. Transplant recipients, active injectiondrug users, and HIV-positive individuals—especially those with CD4 counts below 200—mayrequire confirmatory HCV-RNA testing (Beggren 2001; Beld 1999; Busch 2001; H. H. Lin 2002;Thomas 1995).
Distinguishing Acute from Chronic Infection. Acute hepatitis C virus infections do not inevitablydevelop into chronic infections. Proper diagnosis of acute HCV infection with appropriate diagnosticfollow-up can distinguish acute infections from resolved or chronic infections. Acute HCV infectionmay be diagnosed using information from several tests that rule out acute infection with otherhepatitis viruses, measure alanine aminotransferase (ALT) levels, and look for the presence of HCVantibodies and HCV RNA. Chronic hepatitis C infection may be diagnosed by confirming positiveEIA-3 results with RIBA or HCV-RNA testing.
HCV-RNA Testing. Hepatitis C RNA is detectable between one and two weeks after exposure(H.J. Alter 1991). The amount of hepatitis C virus in a person’s blood varies among individuals,
73

but mode of transmission, length of infection, coinfection with hepatitis B, age, amount of alcoholconsumption, and HIV status may have an effect on HCV-RNA levels (Oshita 1994; Pessione1998; Sawada 1993; Thomas 2000). HIV-positive individuals who are coinfected with HCV havehigher levels of HCV RNA than individuals with HCV alone (Cribier 1995; Di Martino 2001; Eyster1994; Sherman 1993; Sulkowski 2002; Thomas 2001; Zylberberg 1996). Although HCV RNA isnot predictive of disease progression or indicative of liver injury, individuals with HCV-RNA levelsbelow 2,000,000 copies/mL or 800,000 international units (IU)/mL have better responses tointerferon treatment (Fried 2002; Lau 1993; McHutchison 1998; Poynard 1998; Rumi 1997).
Two different types of RNA tests, quantitative and quantitative, are available. Qualitative HCV-RNAtests measure the presence or absence of HCV RNA, giving a positive or negative result, whilequantitative tests measure the amount of HCV RNA per milliliter (mL) of blood. Qualitative testingis usually used to diagnose HCV infection, and may be used to measure response to HCV treatment(when quantitative test results are below the threshold of detection). Quantitative testing is used toestablish the baseline amount of HCV RNA in a person’s blood or tissue, to assess response totreatment and, sometimes, to diagnose HCV.
Liver Panel. The liver panel comprises a number of different blood tests and is used to providediagnostic information for acute and chronic HCV infection as well as to assess the liver’s capacityto metabolize drugs. Liver panel testing can identify possible liver damage and provide someinformation about response to HCV treatment (see A Guide to the Liver Panel at the end of thischapter). Frequent monitoring of liver enzyme levels is especially important for HIV-coinfectedindividuals in order to serially evaluate for evidence of HAART-associated hepatotoxicity.
Alanine Aminotransferase (ALT; a liver enzyme). Alanine aminotransferase (ALT) levels mayremain normal, or become transiently or persistently elevated during chronic HCV infection. Morethan two-thirds of HCV-infected individuals have abnormally elevated ALT levels (Dufour 2000);However, ALT elevations do not predict disease progression (Herve 2001; Jamal 1999; Persico2000). Some researchers have found less liver damage in individuals with persistently normal ALTlevels, while others have observed liver damage despite persistently normal ALT levels (Herve2001; Jamal 1999; Persico 2000; Puoti 1997).
Genotypic Tests. There are at least six different genotypes (viral strains) of HCV, and many sub-types. The genotype is the most important prognostic indicator of response to interferon treatment.Most HCV infections in the United States are genotype 1. Genotypes 1, 4, and 5 do not respondas well to interferon as do genotypes 2 and 3 (Fried 2002; Germer 2001; Mondelli 1999;Neumann 2000; Nousbaum 1998; Poynard 1998; Rosenberg 2001; Zein 1996b). A 48-weekcourse of treatment is recommended for individuals with genotypes 1, 4, and 5; only 24 weeksof treatment are recommended for individuals with genotypes 2 and 3 (McHutchinson 2002;Poynard 2000; Soriano 2002). It is possible to become re-infected with HCV, or to have a mixedinfection with more than one genotype (Accapezzato 2002; De Socio 1996; García- Samaniego1997; Jarvis 1994; Tuveri 1997), although it is not clear if mixed infection can accelerate HCVprogression.
Scans. Additional information about the condition of the liver can be obtained from tests such asliver scans, CT scans, MRI, and ultrasonography, but these tests cannot replace biopsy. A combination
74

of blood tests has shown promising results as an alternative to biopsy in some situations, but moreresearch is needed to identify and validate additional alternatives to biopsy (Boeker 2002; Forns2002; Guechot 1994; Imbert-Bismut 2001; Leroy 2004; Mehta 2004; Myers 2002; Patel 2003;Sud 2004; Wai 2003).
Liver Biopsy. Liver biopsy is the only way to assess the condition of the tissue in an individual’sliver. Information from liver biopsy is used to grade disease activity (assess the amount ofinflammation and cell death) and stage the amount of damage to the liver; to identify any othercauses of liver injury; and to make treatment decisions. Liver biopsy is usually performed in ahospital. A thin needle is quickly inserted between the ribs to remove a tiny sample of liver tissue.Liver biopsy can be painful and, occasionally, complications such as hemorrhage or puncture ofadjoining organs may occur. Fatalities from biopsy are very rare (0.01–0.1%). Having a biopsyperformed by an experienced physician using ultrasound guidance may reduce the risk of pain,complications, and sampling errors (Cadranel 2000; Pokorny 2002).
Ultrasound. Ultrasound surveillance for HCC in cirrhotic individuals (who are at higher risk forHCC than other HCV-infected individuals) increases early detection, but has not been proven toincrease survival (Larcos 1998; Solmi 1996).
Figure 1. HCV Diagnostic Algorithm
75

Hepatitis C Antibody Testing
Antibodies to hepatitis C usually develop six weeks to six months after infection, although someindividuals will not seroconvert (change from antibody-negative to antibody-positive) until 94months after infection (Alter 1992; Beld 1999). Some individuals never develop antibodies toHCV, even when HCV RNA is detected in their blood (Durand 2000). Others may lose theirantibodies to HCV years after infection, although they have detectable HCV RNA (M. J. Alter1992; Beld 1999).
The sensitivity of the EIA-3 is 97%, but in low-prevalence populations, it has a positive predictivevalue of only 25% (Thomas 1997). False negative antibody test results may occur among peoplewho are acutely infected with HCV and have not yet seroconverted. Immunocompromisedindividuals, such as transplant recipients and HIV-positive persons, may receive false negativeresults due to an inability to produce antibodies to hepatitis C. In some cases, injection drug usersmay not have antibody responses to HCV, although they have detectable HCV RNA (Beld 1999;Thomas 1995). Confirmatory HCV-RNA testing may be used to diagnose HCV infection in currentinjection drug users.
Because individuals who have had a recent exposure to HCV, as well as immunocompromisedindividuals who have been at risk for HCV infection in the past, may receive a false negativeantibody test result, confirmatory testing for HCV RNA (testing that looks for the actual virus) isrecommended. False positive results to HCV antibody testing may occur, especially among peoplewith rheumatoid factor or high immunoglobulin levels. In order to properly diagnose hepatitis Cinfection, a positive antibody test result needs to be confirmed by recombinant immunosorbentassay (RIBA) or by testing for HCV RNA.
The RIBA has been used as a supplemental test, but the EIA-2 and the EIA-3 are more sensitivethan the RIBA-2 and the RIBA-3 (Vrielink 1997). The RIBA test is useful for ruling out false positiveantibody test results in low-risk groups. In individuals with a recent exposure to HCV, a negativeRIBA does not rule out current HCV infection; these individuals need HCV-RNA testing to confirmor rule out current HCV infection.
The serum ELISA assay for HCV antibodies has been modified for oral fluid testing. The oral fluidELISA was tested in 109 individuals who were HCV-antibody-positive by serum ELISA and 107individuals who were HCV-antibody-negative by serum ELISA. The sensitivity of oral ELISA fluidtesting for HCV antibodies was 98.2% and the specificity was 99.1% (Sherman 1994). This iscomparable to the sensitivity (99%) and specificity (99.8%) of the serum EIA-3 (Abdel-Hamid2002). Despite the accuracy and convenience of oral fluid testing for HCV antibodies, the oralfluid test has not been marketed.
Many current and former injection drug users have poor venous access. In addition, they maynot seek HCV testing in clinical settings. An oral fluid test will facilitate individual testing in non-traditional venues such as syringe exchange programs and facilitate epidemiological surveys.
76
Diagnosis of Acute HCV Infection
Individuals with acute HCV do not invariably develop chronic HCV infection. Proper diagnosis ofacute HCV with appropriate diagnostic follow-up is necessary to distinguish between resolved orchronic infections. Some preliminary research has indicated that treatment of acute HCV mayreduce the likelihood of chronic infection (see Chapter V, Hepatitis C Treatment).
Acute hepatitis C infection may be identified by a combination of tests, beginning with screeningto rule out acute infection with hepatitis A (HAV) and hepatitis B (HBV). If HAV and HBV testresults are negative, acute HCV may be diagnosed by the presence of alanine aminotransferaselevels (ALT) >7 times the upper limits of normal, combined with HCV antibody testing andconfirmatory HCV-RNA (viral load) testing if the HCV antibody test result is positive. Identificationof the seroconversion from hepatitis C antibody-negative to antibody-positive is the only reliablemethod to classify acute HCV infection.
Diagnosis of Chronic HCV Infection
Chronic hepatitis C infection is diagnosed by the presence of HCV antibodies, with eitherdetectable HCV RNA on more than one occasion over a six-month interval or the presence ofabnormal liver enzyme levels for at least six months.
Liver Enzymes
Measurements of enzymes, proteins, and bilirubin from a blood sample constitute a liver panel.Information from a liver panel can be used to help diagnose hepatitis C infection, identify possibleliver damage, assess the liver’s capacity to metabolize drugs, and partially evaluate the responseto HCV treatment. A liver panel is usually comprised of measurements of the levels of alanineaminotransferase (ALT), alkaline phosphatase (ALP), aspartate aminotransferase (AST), bilirubin,albumin, and total protein. Other tests are often included, such as measurements of prothrombintime (PT), gamma-glutamyl transferase (GGT), and lactic acid dehydrogenase (LDH). For moreinformation, see A Guide to the Liver Panel at the end of this chapter.
Liver enzyme levels in people with chronic HCV infection can be normal, periodically elevated, orpersistently elevated (Herve 2001; Jamal 1999; Persico 2000). Liver enzyme levels are only roughindicators of liver disease and are not predictive of disease progression. In chronic HCV disease,ALT levels are more frequently elevated than AST levels (71% vs. 33%) (Dufour 2000).
Some studies have found less HCV-related liver damage in people with persistently normal alanineaminotransferase (ALT) levels (Jamal 1999; Persico 2000). In a two-year case-control study, Jamaland colleagues followed 75 people with normal ALT levels (defined as four consecutive normalALT values within 12 months) and 200 people who had abnormal ALT levels. Those with persistentlynormal ALT levels had less severe liver disease; just 6% had cirrhosis compared to 19% of thegroup with elevated ALT levels (P=0.007). Those with persistently normal ALT levels had lessfibrosis (P<0.05) and a slower rate of fibrosis progression (P<0.001), as well as significantlylower HCV-RNA levels (P=0.02) (Jamal 1999). In a study in chronically HCV-infected individualscomparing 80 with persistently normal ALT levels and 455 with elevated liver enzymes, Herve and
77

colleagues found an association with less severe liver disease, slower fibrosis progression, andpersistently normal ALT levels (Herve 2001).
However, mild-to-serious liver damage has been identified in HCV-infected persons with persistentlynormal ALT. In a retrospective study of 864 HCV-infected persons, some degree of fibrosis, usuallymild, was observed in a significant number of those with persistently normal ALT levels (Pradat2002). Puoti and colleagues found no difference in grading and staging of liver disease betweenthose with persistently normal levels (N=46) and those with ALT elevations (n=52) (Puoti 1997).A study of HCV-infected Japanese hemodialysis patients reported that although most patients hadpersistently normal ALT levels, ultrasonography revealed liver damage among 72% (Furusyo 2000).
Elevated aspartate aminotransferase (AST) levels may help to identify damaged liver tissue,although their predictive value for the development of cirrhosis is controversial (Assy 2000; T. F.Imperiale 2000; Michielsen 1997; Park 2000; Sheth 1998). Higher AST:ALT ratios have beenassociated with increasing grades of fibrosis (Park 2000; Sheth 1998). However, when AST:ALTratios were examined as potential predictors of cirrhosis, the findings were inconsistent. Shethand colleagues found an AST:ALT ratio of ≥ 1 in 25 of 47 cirrhotic individuals and in none of 92non-cirrhotic individuals. An AST:ALT ratio of ≥ 1 distinguished 100% of cirrhotic individuals fromnon-cirrhotic individuals in this study (positive predictive value of 100%). The AST:ALT ratioaccurately ruled out cirrhosis in 80.7% of non-cirrhotics (negative predictive value of 80.7%)(Sheth 1998). Park and colleagues found that only 5 of 123 non-cirrhotic individuals had anAST:ALT ratio of ≥ 1, while 14 of 30 cirrhotics had an AST:ALT ratio of ≥ 1. The AST:ALT ratiocorrectly identified cirrhosis in 73.7% and accurately ruled out cirrhosis in 88.1%. Imperiale andcolleagues attempted to validate the AST:ALT ratio as a clinical decision aid. The test incorrectlyidentified 13 of 36 individuals (36%) as cirrhotic (T. F. Imperiale 2000).
HCV RNA
Hepatitis C RNA levels are detectable between one and two weeks after infection (H. J. Alter1991). Those with chronic HCV infection may be intermittently viremic (Beld 1999; Villano 1999).Therefore, it is recommended that individuals who are HCV-antibody-positive but have undetectableHCV-RNA levels undergo retesting for HCV RNA in six months to confirm or rule out ongoingHCV infection.
Individual hepatitis C viral loads vary, although hepatitis C replicates rapidly; an estimated tentrillion virions (individual virus particles) are produced per day (Neumann 1998). HCV-RNA levelsmay be influenced by mode of transmission, duration of infection, concurrent infection withhepatitis B, age, consumption of alcohol, and HIV status. Individuals who acquired HCV fromblood transfusion have higher viral loads than those infected from injection drug use or needlestickinjury (Lau 1993). However, all the transfusion recipients were over 60 years of age, and age mayhave been a surrogate for duration of infection or infection at an older age. In a cohort of injectiondrug users, Thomas and colleagues found a range of serum HCV-RNA levels from <200,000 to>120 million eq/mL. Higher HCV-RNA levels were found in older participants. In this group, agewas strongly correlated with duration of drug use and HCV infection, suggesting that HCV viralload levels may increase with longer duration of infection. Lower HCV-RNA levels were associatedwith ongoing hepatitis B infection and not sharing needles (Thomas 2000b).
78
Alcohol consumption increases HCV RNA (Oshita 1994; Pessione 1998; Sawada 1993). Pessioneand colleagues found a strong correlation with HCV-RNA levels and alcohol consumption(P= 0.0001). They detected a dose-response relationship between HCV RNA and alcohol even inindividuals with moderate intake (30 grams/day). HCV-RNA levels in HIV-coinfected individuals arehigher than those found in individuals HCV monoinfection (Cribier 1995; Di Martino 2001; Eyster1994; Sherman 1993; Sulkowski 2002; Thomas 2000b; Zylberberg 1996).
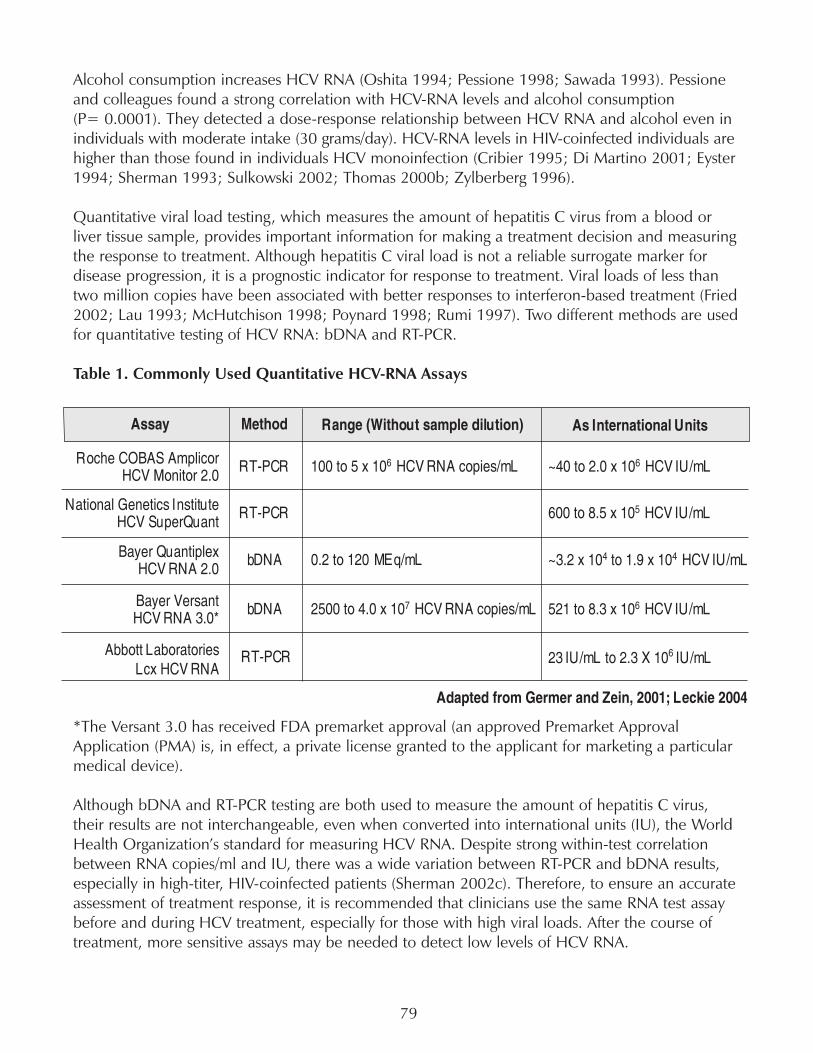
Quantitative viral load testing, which measures the amount of hepatitis C virus from a blood orliver tissue sample, provides important information for making a treatment decision and measuringthe response to treatment. Although hepatitis C viral load is not a reliable surrogate marker fordisease progression, it is a prognostic indicator for response to treatment. Viral loads of less thantwo million copies have been associated with better responses to interferon-based treatment (Fried2002; Lau 1993; McHutchison 1998; Poynard 1998; Rumi 1997). Two different methods are usedfor quantitative testing of HCV RNA: bDNA and RT-PCR.
Table 1. Commonly Used Quantitative HCV-RNA Assays
*The Versant 3.0 has received FDA premarket approval (an approved Premarket ApprovalApplication (PMA) is, in effect, a private license granted to the applicant for marketing a particularmedical device).
Although bDNA and RT-PCR testing are both used to measure the amount of hepatitis C virus,their results are not interchangeable, even when converted into international units (IU), the WorldHealth Organization’s standard for measuring HCV RNA. Despite strong within-test correlationbetween RNA copies/ml and IU, there was a wide variation between RT-PCR and bDNA results,especially in high-titer, HIV-coinfected patients (Sherman 2002c). Therefore, to ensure an accurateassessment of treatment response, it is recommended that clinicians use the same RNA test assaybefore and during HCV treatment, especially for those with high viral loads. After the course oftreatment, more sensitive assays may be needed to detect low levels of HCV RNA.
79

Qualitative testing has a much lower threshold of detection than quantitative testing and has beenused to identify individuals with acute HCV infection, to confirm or rule out chronic HCV infection,and to assess virologic response to HCV treatment.
Table 2. Qualitative Assays for Detection of HCV RNA
The sensitivity and specificity of testing for HCV RNA may differ, due to assay variability and a lackof standardization among laboratories. Consistent use of the same quantitative assay throughoutthe course of HCV treatment will increase the comparability of the results. Although consistent useof one assay is preferable, if necessary, results from different quantitative assays can be convertedinto IU.
Table 3. Conversion Chart for HCV RNA Assays: Copies per Milliliter (copies/mL) toInternational Units (IU)
Hepatitis C Genotyping
There are at least six known HCV genotypes (different hepatitis C viral strains, identified by theirspecific genetic makeup). Different viral isolates from around the world may vary genetically byas much as one third (Davis 1999; Okamoto 1992). Before 1994, there was no consistentclassification system to distinguish different HCV genotypes, making it very difficult to evaluate therole of HCV genotype in different studies. In 1994, Simmonds and colleagues suggested a systemfor nomenclature of hepatitis C viral genotypes, classifying them on the basis of their nucleotidesequence similarities into major genetic groups designated as genotypes. Each genotype wasassigned a number, based on the order of its discovery. The most closely related strains withingenotypes were designated as subtypes named in alphabetical order. All genetic variants within asingle isolate of the virus are designated as quasispecies. Quasispecies are a result of viral mutationsin the host; since HCV makes up to 10 trillion copies of itself on a daily basis, and replication iserror-prone, quasispecies diversity can be significant.
80
Liver Scan, Computed Axial Tomography (CAT) Scan, Magnetic Resonance Imaging (MRI), andUltrasound Testing
The liver scan is used to determine liver shape and function. It starts with an injection of aradioactive isotope. After injection, the person lies on a table under a scanner, which detects thepattern of the radioisotope’s distribution and sends images of the area to a computer. The amountof radiation used in a liver scan is less than that of an X-ray. A liver scan is an efffective and non-invasive method used to identify portal hypertension (high blood pressure in liver blood vessels),cirrhosis, hepatocellular carcinoma, and other liver disease.
Computed axial tomography (CT or CAT ) scans provide X-ray images of the body from manyangles. Beams from an X-ray device that quickly rotates around the body are sent to a computer,creating a cross-sectional image. Sometimes, as part of this procedure, a person will receive aninjection of dye to enhance the contrast between organs. CT scans are not painful, but the injectionof dye may be painful or dangerous to individuals with iodine allergies. CT scans can detecttumors and other irregularities of liver architecture.
Magnetic resonance imaging (MRI) uses magnets and radio waves to produce images of the body.During an MRI, a person lies on a narrow slab which is slid into a large tube. Inside the tube, radiowaves are broadcast towards hydrogen atoms in the body alinged with the magnetic field from theMRI scanner. These atoms reflect a signal back to the machine. MRI scans can distinguish differentdifferent body organs and tissues. Sometimes, if a sharper image is needed, small devices calledbody coils, which transmit and receive the radio waves, may be used. Sometimes an intravenousagent is given to increase the contrast. An MRI scan is used to detect cancers, obstructions in theflow of blood in the liver’s portal vein, and liver enlargement. The procedure is not painful, butsome peope find it claustrophobic.
Sonographic or ultrasound screening can identify irregularities in the shape of the liver, or screenindividuals at high risk for hepatocellular carcinoma. Ultrasound testing uses very high frequencysound waves which bounce off of the body to create an image of an organ. It has the advantage ofbeing non-invasive and painless, although it does not provide information about the condition ofliver tissue and the grade and stage of liver disease.
Hepatocellular Carcinoma: Screening and Surveillance
A key feature in the clinical management of people with cirrhosis is prompt identification ofhepatocellular carcinoma. HCC can be identified by measuring alpha-fetoprotein (AFP) levels andultrasound imaging, but the value of these tests for early detection of hepatocellular carcinoma incirrhotic individuals has not been sufficiently demonstrated. However, it is common practice forcirrhotic individuals to undergo hepatic ultrasound and alpha-fetoprotein (AFP) surveillance atsix-month intervals in the hope of early detection of HCC. The sensitivity and specificity of AFPlevels in the detection of HCC has varied considerably (from 39% to 64%, or 76% to 91%,respectively) in different studies (Collier 1997). Intermittent and persistent elevations in AFP levelshave been observed in individuals without HCC. Some research has shown that ultrasoundsurveillance increases early detection of HCC without reducing mortality (Larcos 1998; Solmi 1996).
81

Tong and colleagues performed a seven-year prospective assessment of the predictive value ofultrasound and AFP for detecting HCC. Five hundred and twenty-six of 602 participants werebiopsied, 173 (33%) of them cirrhotic. Ultrasound and AFP results were used to guide follow-upCT scans and biopsies to confirm HCC diagnosis. During surveillance, HCC was detected in 5%(31/602). All of those with HCC were cirrhotic. The mean AFP concentration was significantlyhigher among individuals diagnosed with HCC than those with no HCC (426.06 ± 67.23 ng/mLvs. 8.91 ± 11.34 ng/mL; P<0.001), although seven individuals who were diagnosed with HCChad normal AFP levels. By themselves, AFP levels alone are not sufficiently sensitive or specific fordetection of HCC. Ultrasound identified nine lesions that were not HCC; these were described asfalse positives. HCC was identified by ultrasound in 78% of cases (positive predictive value of 78%).Despite early HCC detection, 77% (24/31) individuals died within a mean of 16.70 ± 19.40months after diagnosis of HCC (Tong 2001).
A scoring system may help to differentiate cirrhotics at low risk from those at high risk for progressingto HCC. Demographic, clinical, and biochemical data collected from 463 cirrhotics followed for arange of 1–96 months were analyzed to determine the predictive value of each variable. In cirrhoticsaged 55 or over, the presence of HCV antibodies, prothrombin activity of <75%, or a plateletcount below 75,000/mm3 were identified by multivariate analysis as independent predictors ofHCC. Using a scoring range of 0 to 4.71 points, a threshold to distinguish high vs. low risk wasidentified, with 2.33 as the cutoff. Among 270 low-risk individuals with a score of 2.33 or less,cumulative four-year HCC incidence was 2.3% (4/270), while in the high-risk group, cumulativeHCC incidence was 30.1% (34/193) (P=0.0001) (Velázquez 2003). This system may help directHCC surveillance efforts towards those who are at greatest risk.
Liver Biopsy
Liver biopsy is the best way to assess the grade and stage of HCV disease. Biopsy can identify orrule out other causes of liver disease, and is the only test that provides specific information aboutthe condition of a person’s liver tissue. Biopsy results are used to inform treatment decisions.Those with no liver damage or mild damage may choose to delay treatment, while those withmore serious damage may need to initiate treatment.
During liver biopsy, a thin needle is quickly inserted between the ribs, where it collects a verysmall sample of liver tissue. Although it is an outpatient procedure, biopsy is usually performed inthe hospital. Patients usually are kept under observation for three to six hours after the biopsy towatch for complications (hemorrhage, severe abdominal pain, punctured gall bladder), whichusually become clinically apparent during the observation period (Janes 1993; Piccinino 1986).The risk of death from biopsy is low, ranging from 0.01% to 0.1%. The risk of complications rangesfrom 125 to 278 cases per 100,000 (Piccinino 1986). McGill and colleagues collected data from9,212 biopsies performed over 21 years. During that period there were ten fatal and nine non-fatal hemorrhages (0.11% and 0.24%, or a total incidence of 0.35%) (McGill 1990). Liver biopsycan be painful. Thirty percent of biopsy recipients report mild pain, 3% report moderate pain, and1.5% report severe pain (Gilmore 1995; Perrault 1978; Pokorny 2002).
New technology can reduce the risk of pain and complications from liver biopsy. The use ofultrasound to guide biopsy decreases the likelihood of puncturing the gallbladder, colon, bile
82
ducts, or large blood vessels, while increasing the likelihood of collecting adequate specimens inone pass (Soyer 1993). Cadranel and colleagues evaluated factors which increased or decreasedcomplications from 2,084 liver biopsies. They observed reduced incidence of complications whenbiopsies were performed by more experienced physicians (>150 biopsies performed), whensedation or medication was provided prior to biopsy, and when ultrasound guidance was used(Cadranel 2000). Pokorny and colleagues biopsied 251 individuals, using ultrasound or CT scans toguide the procedures. Pain at the site of the biopsy or in the right shoulder was reported as severein 1.2% (3/ 251), moderate in 2.4% (6/ 251), and mild in 21.5% (54/ 251) of biopsy recipients.Only one complication was reported—bleeding into the liver tissue (Pokorny 2002).
To reduce the risk of pain, complications, and sampling errors, liver biopsy should be performedby experienced physicians guided by ultrasound, and pain management should be provided tothose undergoing biopsy.
About Liver Architecture
The liver is composed of many small, grape-like structures called lobules. Lobules are made up ofplates of hepatocytes (liver cells) radiating outward from a central vein. The lobules are squeezedtogether in clusters. The portal zones are found between the lobules of the liver. Liver damagefrom hepatitis C can cause small areas of cell death (focal necrosis). As this necrosis worsens,dense, fibrous scar tissue may develop in portal zones. As the fibrosis worsens, it may extend fromone portal zone to adjoining portal zones; this is called bridging fibrosis. Bridging fibrosis is thestage before cirrhosis. Cirrhosis is characterized by serious scarring that has damaged the liver’sstructure and ability to function.
Evaluating Biopsy
Different systems have been used to evaluate the grade and stage of liver disease. Grading measuresthe amount of disease activity in a sample of liver tissue, while staging identifies the degree of liverdamage from the onset of disease to the development of cirrhosis. While liver disease grading mayimprove or worsen, staging is often stable or progressive.
The first system for scoring biopsy samples was developed by Knodell and colleagues in 1981;it has four components. Three components grade disease activity by area and extent; they areadded up with the fourth component to make up the histological activity index (HAI). The fourthcomponent stages disease, scoring the degree of fibrosis from zero to four. The HAI system is usedmore frequently in research settings than in clinical practice due to its complexity. In 1994 Desmeturged that that the grading score be separated from the staging, and that periportal necrosis andbridging necrosis be evaluated separately from each other, because of differences in prognosticimplications (Desmet 1994).
83

Table 4. The Histological Activity Index
A modification of the HAI described by Ishak and colleagues has supplanted the traditional HAI inmany studies. It adds finer detail to the fibrosis subscore to help delineate more subtle changes.
Table 5. The Ishak Modification of the Knodell HAI: Architectural Changes, Fibrosis andCirrhosis
84
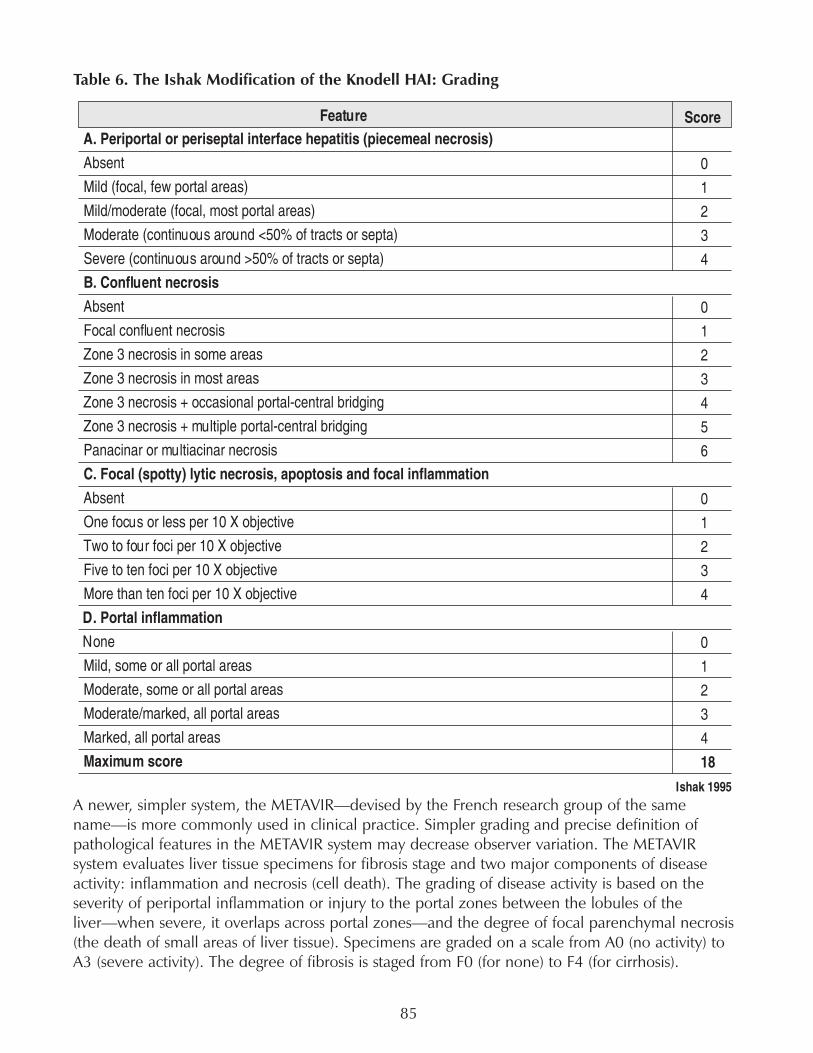
Table 6. The Ishak Modification of the Knodell HAI: Grading
A newer, simpler system, the METAVIR—devised by the French research group of the samename—is more commonly used in clinical practice. Simpler grading and precise definition ofpathological features in the METAVIR system may decrease observer variation. The METAVIRsystem evaluates liver tissue specimens for fibrosis stage and two major components of diseaseactivity: inflammation and necrosis (cell death). The grading of disease activity is based on theseverity of periportal inflammation or injury to the portal zones between the lobules of theliver—when severe, it overlaps across portal zones—and the degree of focal parenchymal necrosis(the death of small areas of liver tissue). Specimens are graded on a scale from A0 (no activity) toA3 (severe activity). The degree of fibrosis is staged from F0 (for none) to F4 (for cirrhosis).
85

Table 7. The METAVIR System
Other systems used to grade and stage liver disease include the Scheuer, the Sciot and Desmet(unpublished), and the Ludwig Batts with the Tsui modification.
Evaluating Cirrhosis: Child-Pugh and MELD Systems
Once an individual has been diagnosed with cirrhosis, a scoring system known as the Child-Pughcan assess its severity. The Child-Pugh system combines information from biochemical testing(bilirubin, albumin, and prothrombin time) with evaluations of hepatic encephalopathy and ascites.Another scoring system called MELD (Model of End-Stage Liver Disease) has replaced Child-Pughscores for grading of severity during work-up and prioritization for liver transplantation. The MELDscore is based on results from serum bilirubin, serum creatinine, and prothrombin time (calculatedas the International Normalized Ratio).
Table 8. The Child-Pugh Score
Problems with Biopsy and Alternatives
The risk of complications and possible pain involved with liver biopsy has made it an unpopularprocedure with patients. Sampling errors and variation between observers also occur. Bejaranoand colleagues assessed diagnostic inconsistencies from 125 biopsy specimens by comparingreports from community-based pathologists to reports from a hepatopathologist and a hepatologist.Results were classified as: major discrepancy (a diagnosis which might have resulted in inappropriatemanagement and/or treatment decisions, misdiagnosis, and inappropriate assessments), minordiscrepancy (considered unlikely to have an effect on future procedures or treatments, omissionsand incomplete descriptions were included as well), and full concordant agreement. Twenty-eightpercent (35/125) were categorized as major discrepancies. Failure to properly identify hepatocellularactivity was identified in 28% (9/35) within this group. Eleven of these cases involved discordant
86
assessments of cirrhosis: six of the eleven initial reports failed to diagnose established cirrhosis,and five initial reports diagnosed cirrhosis where none had developed. Minor discrepancies wereidentified in 38% (47/125) of the reports (Bejarano 2001). To ensure proper diagnosis of HCV-related liver damage, biopsies should be read by pathologists who are skilled in reviewing liverbiopsies.
The average biopsy specimen ranges from a few millimeters to several centimeters long, representingfrom one-hundred-thousandth to one thirty-thousandth of the liver (Scheuer 2003). Since liverdamage is not evenly distributed throughout the liver, it is difficult to accurately assess the gradeand stage of liver disease from a small biopsy sample (Bedossa 2003; Colloredo 2003). Colloredoand colleagues examined 161 biopsy samples from people with chronic hepatitis B and C. Whenthey reduced the size of individual samples, their grading and staging scores decreased significantly;samples that were 1 mm in width were underscored for both the grade and stage of liver disease,no matter their length (Colloredo 2003). Bedossa and colleagues studied 17 large liver tissuesamples from individuals with chronic hepatitis C. They used the same liver tissue to create virtualsamples of differing lengths. The virtual samples were compared with the original samples todetermine the minimum size for accurate liver biopsy specimens. The minimum length needed foraccurate METAVIR system staging was 25 mm (Bedossa 2003).
Within an individual, the grade and stage of liver disease may vary according to the area of theliver from which the sample is obtained. Regev and colleagues compared 124 liver biopsy samplessimultaneously obtained from the right and left liver lobes of 62 people with chronic hepatitis C.Samples were coded, and randomly divided between two hepatopathologists; after assessment bythe Scheuer system, they were uncoded and samples from the left and right lobes of the same liverwere compared to one another. The differences between right and left lobes were significant; onethird of samples differed by at least one stage, and one quarter differed by at least one grade. In14.5% (18/124) of samples from the same liver, cirrhosis was present in one of the lobes, whilestage 3 fibrosis was present in the other lobe. Fifty samples were de-identified and re-examined bythe hepatopathologists to assess intraobserver bias. Grading and staging of the 50 re-examinedsamples did not differ significantly from the first examination. Most of the differences in gradingand staging were attributed to sampling (Regev 2002).
Reliable, reproducible and non-invasive biopsy alternatives are highly desirable. In a prospectivestudy, Imbert-Bismut and colleagues assessed the predictive value of a combination of serumbiochemical markers to diagnose fibrosis in people with chronic hepatitis C. They analyzed theconcordance between 339 biopsy samples evaluated by the METAVIR scoring system and 11serum biochemical markers. They selected six serum biochemical markers (α2 macroglobulin,haptoglobulin, GGT, γglobulin, total bilirubin, and apolipoprotein-A1), and added ALT to increasediagnostic accuracy. These markers were validated in a group of 134 individuals by comparingthem with liver biopsy samples. A serum biomarker index score of <0.10 predicted no fibrosisor mild fibrosis (F0 or F1) in more than 90%, while a score ≥ 0.60 accurately predicted moderateto severe fibrosis and cirrhosis (F2, F3, or F4) in more than 90%. However, more than half of thescores fell in the range between 0.10 and 0.60; these scores did not have a high enough predictivevalue to eliminate the need for a biopsy (Imbert-Bismut 2001).
A panel of five serum biochemical markers (α2 macroglobulin, apolipoproteinA1, haptoglobulin,GGT, and bilirubin)— called Fibrotest— has been marketed for diagnosing fibrosis. Myers andcolleagues compared Fibrotest scores from 534 people to their METAVIR biopsy scores. They
87

reported that a Fibrotest score below 0.50 ruled out cirrhosis in 329 of 337 individuals (98%negative predictive value). A score >0.50 predicted cirrhosis in only 55/197 (positive predictivevalue of 28%) (Myers 2002). Fibrotest is not as accurate for identifying mild-to-moderate liverdamage.
Researchers continue to investigate non-invasive alternatives to liver biopsy (Boeker 2002;Forns 2002; Guechot 1994; Leroy 2004; Patel 2003; Sud 2004; Wai 2003). Sud and colleaguesidentified five independent predictors of fibrosis in people with chronic hepatitis C: age, AST,total cholesterol level, insulin resistance and past alcohol intake. These five markers accuratelypredicted significant fibrosis in 87% of cases among 176 individuals (Sud 2004). Wai and colleaguesreported that using an AST to platelet ratio index (APRI) predicted liver damage in individuals withchronic hepatitis C. The APRI accurately predicted significant fibrosis in 51%, and cirrhosis in 81%(Wai 2003).
While these serum biomarkers cannot provide data on liver histology equivalent to that from aliver biopsy, these tests may be a viable first-line alternative when biopsy is contraindicated orrefused. Further research is needed to determine which tests are most appropriate for diagnosingand staging fibrosis, monitoring fibrosis progression over time in untreated persons, and assessingresponse to HCV treatment, as well as how frequently these tests should be used.
HIV Coinfection: Diagnostic Considerations
Because of the overlap in modes of transmission, the CDC has recommended that all HIV-positiveindividuals undergo screening for hepatitis C infection. All positive results from HCV antibodytesting should be verified with qualitative HCV-RNA testing. In addition, confirmatory testing mayalso be used in certain situations when antibody test results are negative but HCV infection issuspected. For example, immunodeficient individuals may not be producing HCV antibodies.Qualitative HCV-RNA testing may be needed to diagnose HCV infection in HIV-positive individuals,especially those with CD4 cell counts below 200/mm3 (Berggren 2001; Busch 2001; H. H. Lin2002). CD4 cell counts <100/mm3 have been significantly associated with false-negative HCV ab(OR=49; P<0.01) (Berggren 2001). George and colleagues found a startling incidence of occultHCV infection among 131 HIV-positive individuals. Although only 31 of the HIV-positiveindividuals (23.7%) had antibodies to HCV, 19 of the remaining 100 (19% of the HCV-antibody-negative individuals, or 14.5% of the entire sample) had detectable HCV RNA despite being HCV-antibody-negative (George 2002).
HCV-RNA levels in coinfected individuals are higher than in those with HCV alone (Cribier 1995;Di Martino 2001; Eyster 1994; Sulkowski 2002; Thomas 2001; Zylberberg 1996). Sánchez-Quijano and colleagues found HCV-RNA levels close to ten times higher in coinfected persons.Higher HCV-RNA levels have been found in the liver and the blood of coinfected individuals(Bonacini 1999). Some studies have found HCV-RNA levels inversely correlated with CD4 cellcounts (Di Martino 2001; Eyster 1994; Ghany 1996; Thomas 2001). Although no association withHCV-RNA levels and HCV disease progression has been found, HCV viral loads under 2,000,000copies/ml (equivalent to 800,000 IU/mL) are associated with better responses to interferon-basedHCV treatment.
88
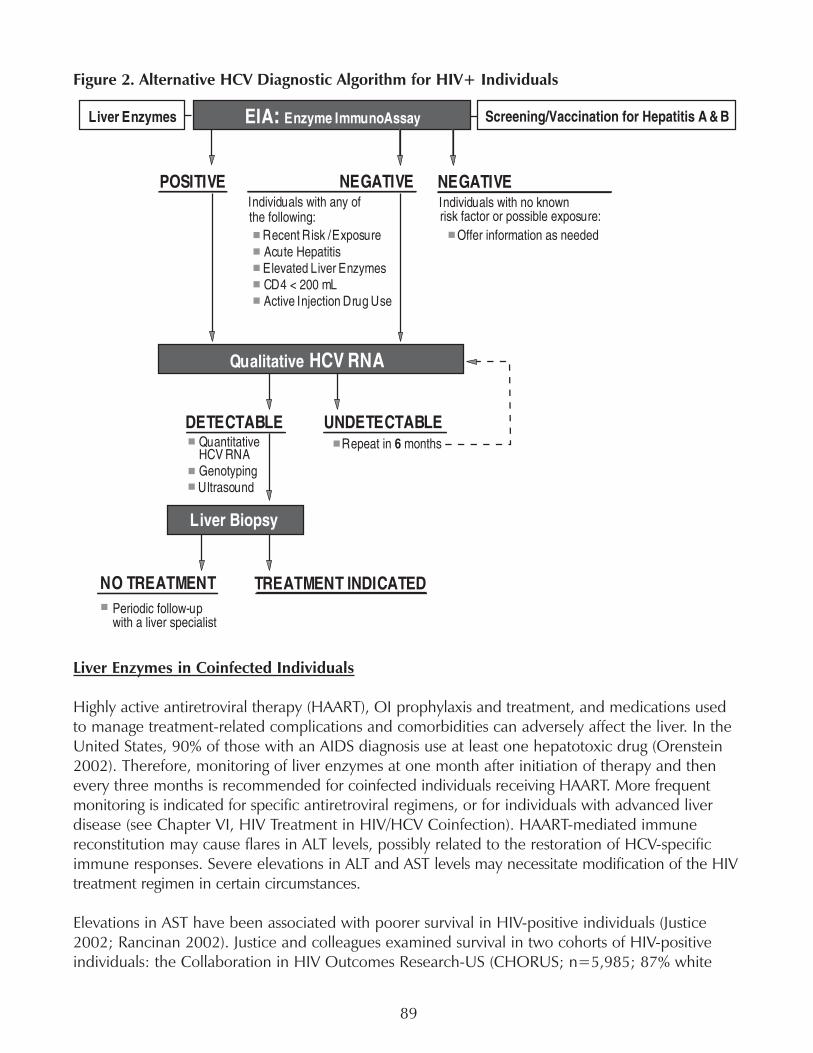
Figure 2. Alternative HCV Diagnostic Algorithm for HIV+ Individuals
Liver Enzymes in Coinfected Individuals
Highly active antiretroviral therapy (HAART), OI prophylaxis and treatment, and medications usedto manage treatment-related complications and comorbidities can adversely affect the liver. In theUnited States, 90% of those with an AIDS diagnosis use at least one hepatotoxic drug (Orenstein2002). Therefore, monitoring of liver enzymes at one month after initiation of therapy and thenevery three months is recommended for coinfected individuals receiving HAART. More frequentmonitoring is indicated for specific antiretroviral regimens, or for individuals with advanced liverdisease (see Chapter VI, HIV Treatment in HIV/HCV Coinfection). HAART-mediated immunereconstitution may cause flares in ALT levels, possibly related to the restoration of HCV-specificimmune responses. Severe elevations in ALT and AST levels may necessitate modification of the HIVtreatment regimen in certain circumstances.
Elevations in AST have been associated with poorer survival in HIV-positive individuals (Justice2002; Rancinan 2002). Justice and colleagues examined survival in two cohorts of HIV-positiveindividuals: the Collaboration in HIV Outcomes Research-US (CHORUS; n=5,985; 87% white
89
male MSM) and the Veterans Aging 3-Site Cohort (VACS 3; n=881; 99% male and 55% African-American, 53% infected with HIV from IDU or heterosexual exposure). There were 400 deaths inthe CHORUS cohort from 1997 until 2002, and 71 deaths in the VACS 3 cohort from 1999 until2000. In a multivariable analysis of survival, the hazard ratio of elevated AST for mortality was6.40 (P<0.001) in the CHORUS cohort, and 2.62 (P=0.09) in the VACS 3 cohort. Althoughcoinfection with hepatitis C was associated with elevated AST in both cohorts, (HR, 15.5;P<0.001 and HR, 6.1; P<0.001 respectively), HCV coinfection was not an independent predictorof survival (CHORUS HR, 1.53; P=0.1; VACS 3 HR, 0.24; P=0.8).
In an examination of survival in the Aquitaine cohort, (995 HIV-positive individuals; 576 of themHCV coinfected) Rancinan and colleagues found a significant association between AST elevationsand poorer survival (HR for elevations >200 IU/I of 2.30; 95% CI, 1.32-4.03; P=0.004), althoughthey did not find an association between HCV seropositivity itself and poorer survival. However,more coinfected individuals had elevated AST (15%, vs. 7% of those with HIV alone).
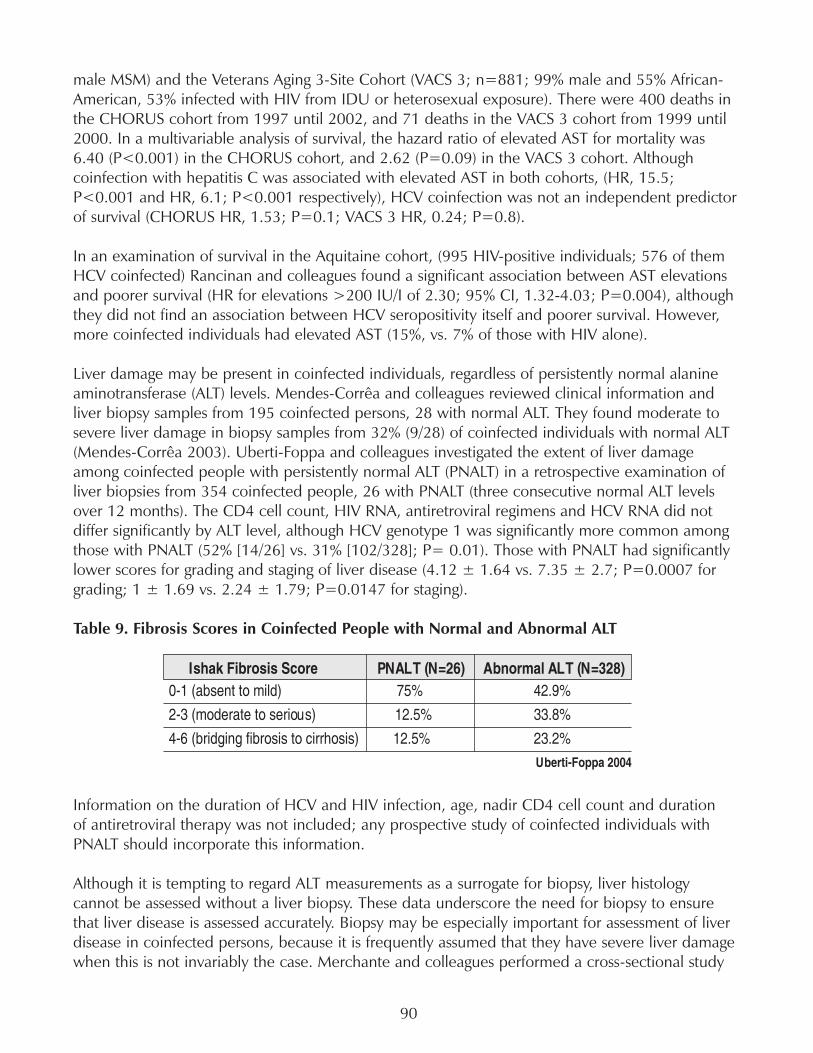
Liver damage may be present in coinfected individuals, regardless of persistently normal alanineaminotransferase (ALT) levels. Mendes-Corrêa and colleagues reviewed clinical information andliver biopsy samples from 195 coinfected persons, 28 with normal ALT. They found moderate tosevere liver damage in biopsy samples from 32% (9/28) of coinfected individuals with normal ALT(Mendes-Corrêa 2003). Uberti-Foppa and colleagues investigated the extent of liver damageamong coinfected people with persistently normal ALT (PNALT) in a retrospective examination ofliver biopsies from 354 coinfected people, 26 with PNALT (three consecutive normal ALT levelsover 12 months). The CD4 cell count, HIV RNA, antiretroviral regimens and HCV RNA did notdiffer significantly by ALT level, although HCV genotype 1 was significantly more common amongthose with PNALT (52% [14/26] vs. 31% [102/328]; P= 0.01). Those with PNALT had significantlylower scores for grading and staging of liver disease (4.12 ± 1.64 vs. 7.35 ± 2.7; P=0.0007 forgrading; 1 ± 1.69 vs. 2.24 ± 1.79; P=0.0147 for staging).
Table 9. Fibrosis Scores in Coinfected People with Normal and Abnormal ALT
Information on the duration of HCV and HIV infection, age, nadir CD4 cell count and durationof antiretroviral therapy was not included; any prospective study of coinfected individuals withPNALT should incorporate this information.
Although it is tempting to regard ALT measurements as a surrogate for biopsy, liver histologycannot be assessed without a liver biopsy. These data underscore the need for biopsy to ensurethat liver disease is assessed accurately. Biopsy may be especially important for assessment of liverdisease in coinfected persons, because it is frequently assumed that they have severe liver damagewhen this is not invariably the case. Merchante and colleagues performed a cross-sectional study
90
of liver histology in coinfected people. They examined biopsy samples collected from 152 coinfectedpeople between November of 1989 and March of 2003. Fibrosis was absent, or mild (F0 or F1) in37.5% (57/152) (Merchante 2003).
Genotype
García-Samaniego and colleagues investigated the influence of hepatitis C genotype on the liverhistology of coinfected individuals. In a cohort of 59 HCV-infected individuals, 48 (82%) coinfectedwith HIV, they found significantly higher histological activity scores (a measurement of diseaseactivity by the amount of inflammation and damage in liver tissue) and more fibrosis amongindividuals with HCV genotype 1b or a mixed infection including genotype 1b. The odds ratiofor an association between genotype 1b infection and higher histological activity scoring was 3.5(95% CI, 1.1–11.3; P=0.036). Genotype 1b was significantly associated with fibrosis (OR, 20.9;95% CI, 2.8-–157.2; P=0.003). Infection with genotype 1b was significantly associated withpiecemeal necrosis (liver cell death) and portal inflammation. HIV infection was also significantlyassociated with fibrosis, with an odds ratio of 17.9 (95% CI, 2.5–129.0; P=0.004) (García-Samaniego 1997). Because coinfection with HIV is known to accelerate HCV disease progression,and this study was finished before the HAART era, it is not possible to generalize the results toother circumstances and populations. Further study would be necessary to evaluate the influenceof genotype 1b on the severity of HCV disease in coinfected individuals during the HAART era.
Alternatives to Liver Biopsy: Serum Biochemical Markers in HIV/HCV Coinfection
A panel of six serum biochemical markers—total bilirubin, γ-glutamyltranspeptidase (GGT), α2macroglobulin, apolipoprotein-A1 and haptoglobulin—has been evaluated for use as an alternativeto liver biopsy for HIV/HCV coinfected individuals. The score from an index comprised of age, sex,and biomarker test results was compared to liver biopsy samples from 130 coinfected persons. If ascore of 50 was used as a cutoff, the absence of cirrhosis would be accurately predicted in 100%of cases, and the presence of cirrhosis would be accurately predicted in 65% of cases (Myers2003). Although this index is not equivalent to a biopsy, and does not accurately predict mild tomoderate liver damage, it may be a useful screening tool for fibrosis, especially in situations wherebiopsy is contraindicated or refused.
Mehta and colleagues compared serum marker testing with liver biopsy results from 96 coinfectedpeople. The threshold for each serum marker was as follows: alanine aminotranferase <93 IU/L;aspartate aminotransferase <61 IU/L; albumin >3.6 g/dL; total bilirubin <1.2 mg/dL; and hyaluronicacid <42. They found that hyaluronic acid (HA) levels were higher in coinfected persons withmoderate to severe fibrosis and cirrhosis than in those with no fibrosis. A fibrosis score of >2 onthe Ishak system was 12 times more likely among individuals with HA levels > 85 ng/mL (95% CI,3.46–43.35) and almost three times more likely with HA levels from 42 to 85 (95% CI, 0.87–9.20).Lower levels of HA, albumin and AST predicted milder liver damage. Thirty-five individuals hadHA, albumin and AST levels below the threshold; all had fibrosis scores of ≤ 2 (Mehta 2004).
These results merit prospective investigation of serum biochemical markers as a biopsy alternativefor HIV/HCV coinfected persons. Evaluation of serum biomarkers could be incorporated into largeobservational studies and treatment trials.
91
Recommendations
Develop and market oral fluid test kits for HCV antibody testing.
Oral fluid HCV antibody testing will provide opportunities to perform initial HCV screening inindividuals with poor venous access, and in venues frequented by high-risk individuals, includingsyringe exchange programs, methadone clinics, drug treatment facilities, shelters and correctionalfacilities. Oral fluid collection kits for HCV antibody testing would also increase the capacity tocollect epidemiological data. The National Institutes of Health and Industry should supportsurveillance initiatives for oral fluid testing of hard-to-reach populations.
Identify and validate prognostic markers and effective screening methods for early diagnosisof hepatocellular carcinoma (HCC).
Hepatocellular carcinoma is a known complication of hepatitis C. In the United States, the incidenceof hepatocellular carcinoma (HCC) in the general population has increased from a rate of 1.4cases per 100,000 between 1976 and 1980, to 2.4 cases per 100,000 during the period between1991 and 1995 (El-Serag 1999). This rise may reflect the consequences of an epidemic of increasedHCV transmission that occurred decades earlier. The annual incidence of HCC in hepatitis C-infected cirrhotics ranges from 1% to 4% (Di Bisceglie 1997; Lauer 2001).
HCC can be identified by measuring alpha-fetoprotein (AFP) levels and by ultrasound imaging,but the value of these tests for early detection of HCC in cirrhotic individuals has not beensufficiently demonstrated. The sensitivity and specificity of AFP levels for detection of HCC variesconsiderably (from 39% to 64% and from 76% to 91%, respectively) in different studies (Collier1997). Some research has shown that ultrasound surveillance increases early detection of HCC,but it may not reduce mortality (Larcos 1998; Solmi 1996). Mortality from hepatocellular carcinomais extremely high, with five-year survival rates of less than 5% (El-Serag 1999). Better interventionsto facilitate the early diagnosis of HCC and reduce the high fatality rate are urgently needed. TheNational Institutes of Health (NIH) must fund this research
Promote use of a standardized system for evaluation of liver biopsy.
A standardized system should be selected for evaluating the results of liver biopsy in research toenable cross-study analysis.
Continue research on non-invasive testing methods to replace or reduce the need for liverbiopsy.
Liver biopsy is still the only way to assess the condition of liver tissue. Information from liver biopsyis used to assess the degree of inflammation, gauge hepatic cell death and damage, identify othercauses of liver injury, and guide treatment decisions. Although fatalities from biopsy are extremelyrare (0.01% to 0.1%), liver biopsy can be painful, and occasional complications such as hemorrhageor puncture of adjoining organs may occur. The risk of complications and the potential pain of theprocedure have made liver biopsy unpopular with many patients.
92
Alternatives to liver biopsy using panels of serum biochemical markers are under investigation, andsome have been marketed. Although these panels may serve as substitutes in cases where a biopsyis contraindicated or refused, they yield far less precise information. The identification, development,and validation of a non-invasive, cost-effective replacement for liver biopsy would be an importantbreakthrough and merits research from the National Institutes of Health (NIH).
Educate primary care providers about diagnosis of acute and chronic hepatitis C infection.
Acute hepatitis C infection is clinically silent for most infected people, with only 15% to 20% ofindividuals developing symptoms (Koretz 1993). Symptoms, when they occur—low-grade fever,fatigue, appetite loss, abdominal pain, nausea, and vomiting—are typical of many common viralinfections. Chronic hepatitis C infection is also often asymptomatic, and both acute and chronichepatitis C infections may go undiagnosed by physicians who fail to ask about risk factors (Shehab2001; Shehab 2002; Villano 1999).
Many physicians are unaware of the proper procedures for diagnosing hepatitis C (Shehab 1997).HIV-positive individuals (especially those with fewer than 200 CD4 cells), injection drug users,and transplant recipients may harbor occult hepatitis C infection (Beggren 2001; Beld 1999;Busch 2001; H. H. Lin 2002; Thomas 1995). Routine HCV-RNA confirmatory testing following anegative HCV-antibody test result should be considered in populations who may harbor occultinfection, including HIV-positive individuals and injection drug users. Provider education initiativesmust be available from the Centers for Disease Control, the American Medical Association, andthe AIDS Education and Training Centers.
93

A Guide to the Liver Panel
Alanine aminotransferase (ALT; formerly known as serum glutamic pyruvic transaminase or SGPT)is an enzyme produced in the liver that metabolizes amino acids. During acute HCV infection,ALT levels in the blood may rise to twenty times above normal. Certain medications, includingsome antiretroviral agents, may cause ALT level increases. ALT levels usually decrease again whenthese drugs are discontinued. Excess ALT seeps into the bloodstream when liver cells are injuredor dying. However, if damage to the liver is widespread and the liver is incapable of producingsufficient ALT, enzyme levels in the blood may remain in a normal range. Blood ALT levels cannotreliably diagnose or predict the state or progression of HCV disease. However, a reduction in ALTlevels during HCV treatment—a biochemical response—is regarded as a positive development.
The normal reference range for ALT levels usually falls between 1 and 45 U/L, although this variesby laboratory. ALT levels typically reach a peak during the afternoon and are at their lowest levelsat night. Within an individual, ALT levels can vary by 10-30% from day to day. Body weight alsoaffects ALT levels. People with a high body mass index (BMI) tend to have ALT levels 40–50%higher than thinner people. Strenuous exercise may decrease ALT levels by 20%. ALT levels varywith age; standard reference ranges may not apply to children or to people over 60. Men typicallyhave higher ALT levels than women. Liver injury in women may be underreported if judged byreference ranges derived primarily from males.
Aspartate aminotransferase (AST; formerly known as serum glutamic oxalocetic transaminaseor SGOT) is an enzyme found in the heart, kidney, pancreas, spleen, liver, lungs, skeletal muscle,brain tissue, and red blood cells. When tissues in these organs are injured, AST is released intothe bloodstream. AST is neither as sensitive nor as specific to liver injury as ALT. However, ASTlevels may rise to twenty times above normal during acute HCV infection, and may remain elevatedduring chronic HCV infection. Anti-HIV medications may produce elevations in AST as the liverworks to metabolize these drugs, but AST levels usually decrease when these drugs are discontinued.AST levels do not predict HCV disease progression or severity, although a decrease in AST levelsduring HCV treatment is considered to be a good biochemical response.
The normal reference range for blood levels of AST falls between 1-36 U/L, though this varies bylaboratory. Individual AST levels can vary by 5-10% from day to day. Normal AST levels amongAfrican American males are typically 15% above the reference normal. Body weight also affectsAST levels. Individuals with a high body mass index (BMI) may have AST levels 40-50% abovethose of thinner people. Cardiac and skeletal muscle injuries may produce significant elevations inAST. Strenuous exercise before a blood test can produce a three-fold elevation in AST.
Alkaline phosphatase (ALP) is an enzyme primarily found in the intestines, bones, and liver; someis produced and found in cells lining the bile duct and in the placenta. Obstruction in the bileduct due to liver disease can cause an accumulation of bile acids in the liver, which in turn canstimulate the production of ALP. Therefore, elevated ALP may indicate an underlying cholestatic(obstructive) liver disease. Drugs that reduce bile transport from liver cells to the bile duct can alsostimulate increased production of ALP. In HCV-infected individuals, ALP elevations are associatedwith a type of serious liver injury called post-hepatitic cholestasis.
94
The normal reference range for blood ALP levels falls between 35-150 U/L for adults, 100-500 U/Lfor adolescents and 100-350 U/L for children. These values may vary by laboratory. Individual ALPlevels can vary from 5-10% from day to day. Someone with a full stomach may have ALP increasesof up to 30 U/L. Normal ALP levels are usually 15% higher than the reference range in African-American males and 10% higher in African-American females. ALP levels tend to increase in post-menopausal women. Body weight affects ALP; levels increase by 25% with higher BMI (body massindex). Smoking increases ALP by 10%. Oral contraceptives decrease ALP levels by 20%. ALPlevels are increased between two-and three-fold during the third trimester of pregnancy.
Gamma-glutamyl transferase (GGT) is an enzyme produced by the bile ducts. GGT levels may beelevated in individuals with any type of liver disease, and especially in individuals with bile ductdiseases. As many as 80 to 95% of individuals with acute hepatitis have elevated GGT levels.GGT levels increase with cirrhosis and hepatocellular carcinoma. Alcohol and certain medicationselevate blood levels of GGT, while other medications lower GGT.
The normal reference range for GGT falls between 0-51 IU/L. These values may vary by laboratory.Within each individual, GGT levels vary by 10-15% from day to day. Among African-Americans,normal GGT levels may be two times above the reference range. Men under 50 have GGT levels25-40% higher than those in women. Among those with moderately high body mass index (BMI),GGT levels may increase by 25%. When BMI is over 30, GGT levels may increase by 50%.Pregnancy reduces GGT levels by 25%. Smoking twenty cigarettes per day increases GGT levels by10%; levels double with heavier smoking. GGT levels may remain elevated for weeks after heavydrinkers stop drinking.
Bilirubin is a by-product of the breakdown of red blood cells. In the spleen, hemoglobin from redblood cells is broken down and the released heme is processed into bilirubin and transported tothe liver. In the liver, bilirubin undergoes further processing to become water-soluble and is excretedinto the gut as part of bile, which helps to break down fats. Non-water-soluble bilirubin is calledunconjugated or indirect bilirubin. Water-soluble bilirubin that has been metabolized by the liveris called conjugated or direct bilirubin. Two tests measure bilirubin levels. Total bilirubin includesboth direct and indirect bilirubin levels, while direct bilirubin testing measures the amount ofbilirubin processed in the liver. When both bilirubin levels are normal, it reflects a balancebetween bilirubin production from red blood cell breakdown and bilirubin elimination by the liver.Liver cell injury is indicated when the total bilirubin level is high while direct bilirubin is low.Hepatitis C infection can slow the processing of bilirubin in the liver, and bilirubin levels canbecome elevated, causing jaundice (yellowing of the skin and eyes). Some medications, includingcertain HIV protease inhibitors, can increase the level of total bilirubin by affecting the rate ofconversion of indirect to direct bilirubin.
The normal reference range for blood levels of total bilirubin falls between 0.3-1.1 mg/dl (5.1-19.0mmol/L in international units). The normal reference range for direct bilirubin falls between 0.1-0.4 mg/dl (1.7-6.8 mmol/L in international units). Values may vary by laboratory. Within anindividual, bilirubin levels may vary by 15-30% from day to day. Overnight fasting typicallyincreases bilirubin levels by 20-25%. Normal bilirubin levels are 33% below the reference rangein African-American males, and 15% lower in African-American females. Exercise can increasebilirubin levels by 30% in males. Oral contraceptives reduce bilirubin levels by 15%. Hemolytic
95
anemia, a potential side effect of ribavirin, causes an increase in indirect bilirubin.
Albumin is a protein made by liver cells. It helps maintains the pressure that prevents fluids fromseeping out of the bloodstream and into tissues. Albumin also carries drugs, hormones and wasteproducts through the bloodstream. A seriously damaged liver is unable to produce sufficientalbumin. Albumin levels usually remain normal during acute hepatitis. In chronic hepatitis,albumin levels may decrease gradually as progression to cirrhosis occurs. Abnormally low levelsof albumin can be a prognostic marker for liver decompensation and hepatocellular carcinoma.
The normal reference range for albumin blood levels is between 3.5-5.4 gm/dl, though values mayvary from lab to lab. Dehydration temporarily lowers albumin levels.
Total protein measures two major blood proteins, albumin and globulin. Approximately 60% oftotal protein is albumin. There are three types of globulins: alpha-, beta-, and gammaglobulins.Alpha globulins are made in the lungs and the liver. Betaglobulins, also known as low-densitylipoproteins (LDLs), transport fat throughout the body. The gammaglobulins are antibodies. Totalprotein and globulin levels may increase with cirrhosis. When a cirrhotic liver is unable to producesufficient albumin, the body produces extra globulin in an attempt to maintain sufficient totallevels of protein.
The normal reference ranges for these tests are 6.4-8.3 g/dl for total protein, 3.5-5.4 g/dl foralbumin and 2.3-3.4 g/dl for globulin. Values may vary by laboratory.
Alpha-fetoprotein (AFP) is produced in fetal liver tissue. After birth, blood AFP decreases to verylow levels. AFP levels may increase in cases of acute hepatitis, chronic hepatitis, cirrhosis, and livercancer.
AFP levels over 50 ng/ml are considered abnormal, while levels between 11-100 ng/ml may indi-cate liver cell regeneration. AFP levels over 100 ng/ml may indicate hepatocellular carcinoma(HCC); levels over 1,000 usually indicate HCC.
Prothrombin Time (PT) measures the amount of time needed for blood to clot. Clotting factorsare made in the liver. PT elevations may occur during acute hepatitis. In chronic hepatitis, PTusually remains normal, though abnormal PT prolongation usually accompanies progression tocirrhosis. PT is elevated in cirrhotic individuals, because a significantly damaged liver may not beable to produce enough clotting factors. Some medications increase PT. A PT in excess of threeseconds above the normal range is associated with increased risk of bleeding.
The normal prothrombin time is about 11-15 seconds, though values may vary from lab to lab.Some laboratories report the international normalized ratio (INR), a standardized ratio for sampleclotting time versus a control value; 1.0 represents normal.
96

List of Terms Used in This Chapter
Branched-chain DNA assay (bDNA): a test used to measure the amount of a virus inblood plasma.
Eq: is an abbreviation for virus equivalent. Eq is used to indicate that HCV geneticmaterial has been measured by weight in picograms. To convert picograms, multiply theresult by 1 million.
Reverse-transcriptase polymerase chain reaction (PCR) assay: a very sensitive test usedto detect and measure RNA or DNA of organisms and viruses in blood plasma or tissue.
97