chapter iv studies on the magnesium ferrite and manganese...
TRANSCRIPT
CHAPTER IV
Studies on the Magnesium Ferrite and Manganese zinc
Ferrites
Part I
Micros -ucture and property correlation of MgE '204
(ore rejects 1461 )
Part
Synthesis and Characterization of MgFe204
(Study Sample I)
Part III
Synthesis and Characterization of (Mn %Zn%)Fe204
(Study oample II)
General Introduction
Syr - ''csis of ferrites of general formula MR 204 is carried out by bringing solid
state reaction between cc-Fe 2O3 and divalent metal oxides, MO, or their easily
decomposable simple compounds such as MCO 3, M(NO3 )2, M(OH)2, etc. Since th solid
state reactions are sluggish, a ceramic technique is usually adopted to get product of the
desired stoit,liiometry having optimum intrinsic and extrinsic properties. In the c :ramie
technique the raw materials are first granulated, compacted, presintered, regranulat xl and
recompacte. -:. The recompacted materials are then heated to high temperatures. r lany a
times, one more grinding of the heated sample is needed. The ground materials a e then
compacted into the magnetic cores of the desired shapes and finally sintered at vei y high
temperature generally > 1200 °C.
73
The eramic technique is thus a laborious one and by adopting these d &rent
processes granulation, compact formation, presintering, regrinding, reheating etc., it
is fairly asce7tained that an adequate rate of reaction can be achieved as homogeneity in
reactant particle sizes is attained. These processes, hence, suggest that heterogene ties in
the particle sizes should be avoided [96] in order to get a uniform and cox trolled
microstructure. Chemical reactivity can be enhanced by increasing the surface area of the
reactant particles and hence, finer the grain size (and also uniform) better is the re: ctivity
and, in turn speedy reaction rate leading to the desired product is assured.
Although other factors like temperature, atmospheres and the nature of the , other
metal constituents are essential in obtaining ferrites of the desired electront gnetic
properties required for the applications in devices, many intrinsic properties depend solely
on extrinsic properties and hence, microstructure of the products is also important
criterion to be investigated in ferrites studies. Therefore, in ferrites research, an en phasis
is put on th microstructure of the reactants, as well as, products, for that matter these
aspects of microstructures are essential in any ceramic research.
Though solid state reactions are sluggish, the rate of reaction can, th , be
enhanced by considering the aspects discussed above. In ferrites synthesis a-Fe 2( )3 and
MO are effectively made to react by taking into consideration the microstructure,
temperature, atmosphere control to get the desired products. But, there are few refe7ences
[44,45] which report that the rate of reaction can be enhanced and also the tempera ure of
formation can be lowered in ferrites synthesis by using y-Fe 203 as a starting Iry terial.
This additional reactivity is due to the type of starting iron source for ferrite prepa-ation.
And, here the structural criterion may be considered to be playing an important ole in
enhancing the rate of reaction. Cubic y-Fe 2O3 reacts with the cubic MO giving the cubic
74
spine! prop , while corundum a-Fe 203 requires a lot of rearrangement to talc( place
before reacting with cubic MO to form the spine!.
Other than structural aspects, the reason for the increased rate of reaction bi tween
y-Fe203 and MO can be attributed to in situ transformation of y-Fe 203 to a-Fe203 during
the heating process and the a-Fe 203 thus formed has now more reactivity, because of
energy change in the transformation and increase in surface area (energy) of the ='reshly
formed a-Fe,03 particles. Ferrites preparation from Fe 304 and MO [39,41] fo and to
occur at lower temperatures and also the spinels formed well with better characteril tics or
ferritization took place early. Here the phase transformation of Fe 304 to Fee( that
occurs duc' g the heating process supplies energetic Fe203 particles of better reacti rity to
react with the MO. And if MO is also formed in situ during the heating process from the
starting compound like MCO 3, M(NO3)3 etc. then further enhancement in rate DI the
formation of ferrite is achieved.
In or laboratories [46,47] MgFe2a4 synthesized from freshly prepared y Fe 203
gave better characteristics than that obtained from commercial a-Fe 203 . Alre, idy, a
beginning has, thus, been made in our laboratory to explore the possibility of using
y-Fe203 in ferrite synthesis and the y-Fe 203 samples were obtained from the up, traded
iron ore rejects. We are continuing such investigations on the usefulness of T. Fe203
prepared fri iron ore rejects in ferrite synthesis.
In the present work we are using y-Fe 203 samples synthesized from in n ore
rejects, as ,:escribed in chapter 2 and 3 to prepare once again MgFe 20 and
(MnyZnA)Fc204. However, (MnyZn1/2)Fe204 system is the new system in our on going
research, b-'' the MgFe 2O4 is taken up here, not only to study and establif h the
preparation criterion using y-Fe20 3 as a starting material, but also to investiga :e the
micro-structural aspects in the synthesis. How the microstructure of the iron )xides
75
synthesized -rom iron ore rejects influence the products formation, as well as their
properties arc being investigated.
The present chapter, hence subdivided into 3 parts:
Part I: Mk' (structure and property correlation of MgFe2O 4 (ore rejects [46])
Part II: Synthesis and Characterization of MgFe 2O4 (study sample I)
Part III: Synthesis and Characterization of (Mn yZn1/2)Fe204 (study sample II)
Both IvIgFe 204 and (Mni/ZniA)Fe204 are being synthesized from iron aides
prepared from beneficiated iron ore rejects as described in chapter 2 and chapter 3 Part
II and Part Ill of this chapter deals with the synthesis and characterization of these
ferrites. However, the MgFe 2O4 samples that had already been systematically stet( ied in
our laboratories [46,47] are being further studied and their results, especiall:, the
microstructural aspects, are presented in the part I of this chapter. These Mg e204
samples too were prepared from iron oxides (mainly y-Fe 203) that had been ob ained
from beneficiated iron ore. Here we are making an attempt to correlat the
microstructures with the electromagnetic characteristics of these ferrites. Fcr the
comparison of the results, the MgFe 2O4 samples were also prepared from commercial
a-Fe203 and standard y-Fe 203 and characterized. And these results are also pre: ented
here.
The microstructural studies were taken up to see whether the different prec trsors
that had been used in producing iron oxides [46] from iron ore rejects have any infl tence
in forming particles of uniform reactivity in ferrite synthesis. This is due to the fa( t that
the MgFe2O4 sample prepared from 7-Fe 203 obtained from different precu -sors:
carboxylato-hydrazinate, iron oxyhydroxides and hydrazinated iron oxyhydroxides gave
almost similar electromagnetic characteristics, while the ferrite synthesized from
76
commercial a-Fe2O3 indicated different properties [46,47]. And, henc :, the
microstructutal studies are of significance and discussed here in Part I.
In part II the MgFe2O 4 system is once again studied. Here iron oxides the t used
for the ferrite formation are prepared from beneficiated iron ore of Goan or
different areas. Iron hydroxides were prepared from the acid extract of iron ore rejects
(chapter 2) by treating with NaOH, NH 4OH, NaOH + NH4OH and Na2CO3. These
hydroxides were then used for the preparation of iron formates. And, their ch nnical
analysis (Table 2.3a and b) indicate different percentage of main impurities, Mn, %1, Si.
Both the iron hydroxides and formates were then hydrazinated. These hydroxid .s and
formates of iron and their hydrazinated complexes all gave (chapter 3) iron ( xides,
mainly a-Fe2O3 or y-Fe203 or the mixture of these (Table 3.1 and 3.2). Thus, here ye are
studying Mge204 system synthesized from only these iron oxides, while in par I the
ferrites were synthesized [46] from iron oxides prepared from different precursor:: Iron
(H) carboxylato-hydrazinates ( Ferrous fumarato-hydrazinate, ferrous succ inato-
hydrazinate, ferrous malonato-hydrazinate, ferrous tartrato-hydrazinate, ferrous mz leato-
hydrazinate and ferrous malato-hydrazinate), iron oxyhydroxides (y-FeOOH, a-Ft OOH
and amorphous FeOOH) and their hydrazinates. Therefore, the present studies us ; iron
oxides prepared from simple precursors: hydroxides and formates and their hydrazin des.
(Mn1/22,n1/2)Fe204 system, however, is studied with a view to standardi .,—:. the
method of synthesis of this most complex ferrite, as Mn is susceptible to variation in its
oxidation state. We used different preparation techniques. Not only the ce .amic
technique using iron oxide (from iron ore rejects) + MO but also a coprecipi ation
techniques arc being adopted and presented in the part III. In coprecipitation tech rique
the iron hydroxide obtained from iron ore rejects were dissolved in acid and after a iding
the required soichiometric amount of Mn and Zn, the solution was treated with ami Ionia
77
to get hydroxides, From these hydroxides, formates were then prepared. The
hydrazinated complexes of these were also then synthesized. We are reporting only the
preparation of the precursors and their thermal decomposition leading to ferrite The
studies are restricted only to phase identification by x-ray diffraction and nu gnetic
characterizet'on by determining saturation magnetization values with respect to the
different heat treatments.
78
Pail
Microstructure and property correlation of Mgn 204
(ore rejects [46] )
4.1 Introduction
Magnesium ferrite, MgFe204, prepared in our laboratory [46] from chemically
beneficiated iron ore reject of one particular region of Goa was thoroughly studied ' .)y xrd
to establish the phase formation, magnetic characterization: saturation magneti: ation,
A. C. susceptibility and initial permeability as a function of temperature, and ele ;trical
characterization to evaluate the temperature dependence of resistivity. The proper ies of
the ferrite samples synthesized from iron oxides prepared from iron ore rejects by using
different precursors were then compared with the ferrites prepared from commerci; 1 iron
oxide, oc-Fe2 J . As the ferrite prepared from iron oxides (mainly y-Fe 203) that oh ained
from iron ore rejects gave superior properties compared to the one prepared from
commercial iron oxide, hematite, it was considered that the inferior propert es in
MgFe2O4 from hematite may be due to the presence of impure oc-Fe 2O3 phases n the
79
ferrite. Whereas, the iron oxides from ore rejects indicated the formation of sin& phase
MgFe204. Although, this reason for the inferior properties is fairly correct, we thoT fight of
inspecting the microstructures of the precursor iron oxides and the ferrites. And we in
the present Part-I are presenting the results of the scanning electron microscopic "SEM)
studies done on these samples [47].
4.1.1 Preparation and characterization of iron oxides and MgFe2O4
a) Chemical beneficiation of iron ore rejects
A representative iron ore reject dump sample of Goan origin containing 3f 5 (%)
Fe, 3.3 (%) Al203, 40.28 (%) SiO 2 and traces of manganese, calcium and magnesiu n was
chemically beneficiated [46] by acid extraction with dil.HC1 + di1.HNO 3 . T1. acid
extract was treated with 20 (%) NaOH to get metal hydroxides, mainly iron hydr( xides.
The hydroxide of iron was then used to prepare iron (II) carboxylato-hydrazinat :s and
iron oxyhydroxides: cc-Fe00H, 7-FeOOH and amorphous FeOOH and their hydrae nates.
The thermal products of these precursors are coded as [46,47],
1. Ferrous fumarato-hydrazinates (FFHA)
2. Ferrous succinato-hydrazinate (FSHA)
3. Ferrous malonato-hydrazinate (FMHA)
4. Ferrous tartrato-hydrazinate (FTHA)
5. Hydrazinated 7-FeOOH ('y-FA)
6. Hydrazinated amorphous FeOOH (Amp FA)
7. Hydrazinated (x-FeOOH (cc-FA)
The thermal products are mainly 7-Fe 2O3 (Table 4.1.1). Few products also cor tained
cc-Fe203 in minor quantities. These iron oxide samples were then used to r epare
MgFe2O4.
80
TABLE 4.1.1 XRD data of iron oxides ;46]
Sample d hki (A)
y-Fe2O3 * - 2.95 - - 2.51 2.09 - 1.70 1.60 1.47 1.20
y-Fe203 * - 2.95 2.78 - 2.52 2.08 1.70 1.61 1.48 1.2/
Fe304* - 2.97 - - 2.53 2.09 , - 1.71 1.61 L48 1.28
a-Fe2O3 * 3.66 - - 2.70 2.51 2.20 1.83 1.69 - 1.45 -
FFHA 3..68 - 2.78 2.70 2.52 2.08 1.84 1.70 1.60 - -
FSHA - 2.95 2.78 - 2.51 2.09 - 1.71 1.61 -
FMHA - 2.97 2.78 2.70 2.52 2.09 1.83 1.70 1.61 - -
FTHA - 2.95 2.78 2.70 2.52 2.09 1.84 1.70 1.61 - -
yFA - 2.96 - - 2.52 2.09 - 1.70 1.61 1.4i 1.27
AmpFA - 2.95 - - 2.51 2.08 - - 1.60 1.4; 1.27
aFA - - - 2.70 2.52 - 1.83 1.69 1.60 1.4i 1.27
* - Reported [62, 87, 94, 176]
b) Preparat:z..1 of MgFe 2O4
The iron oxides mainly y-Fe 2O3 synthesized as in 4.1.1a were mixed in the
required proportion with MgCO 3, pelletised and preheated - 800 °C for 12 h in ai The
cooled samples were ground, pelletised and then heated to 1000 °C for 24h in an o dinary
atmosphere. The samples thus prepared are named as below.
Iron oxide s urce Code name of magnesium ferrite
(1) FFHA MgFFHA
(2) FSHA > MgFSHA
(3) FMHA > MgFMHA
(4) FTHA > MgFTHA
82
F = ferrite
cx-Fe 2 0 3
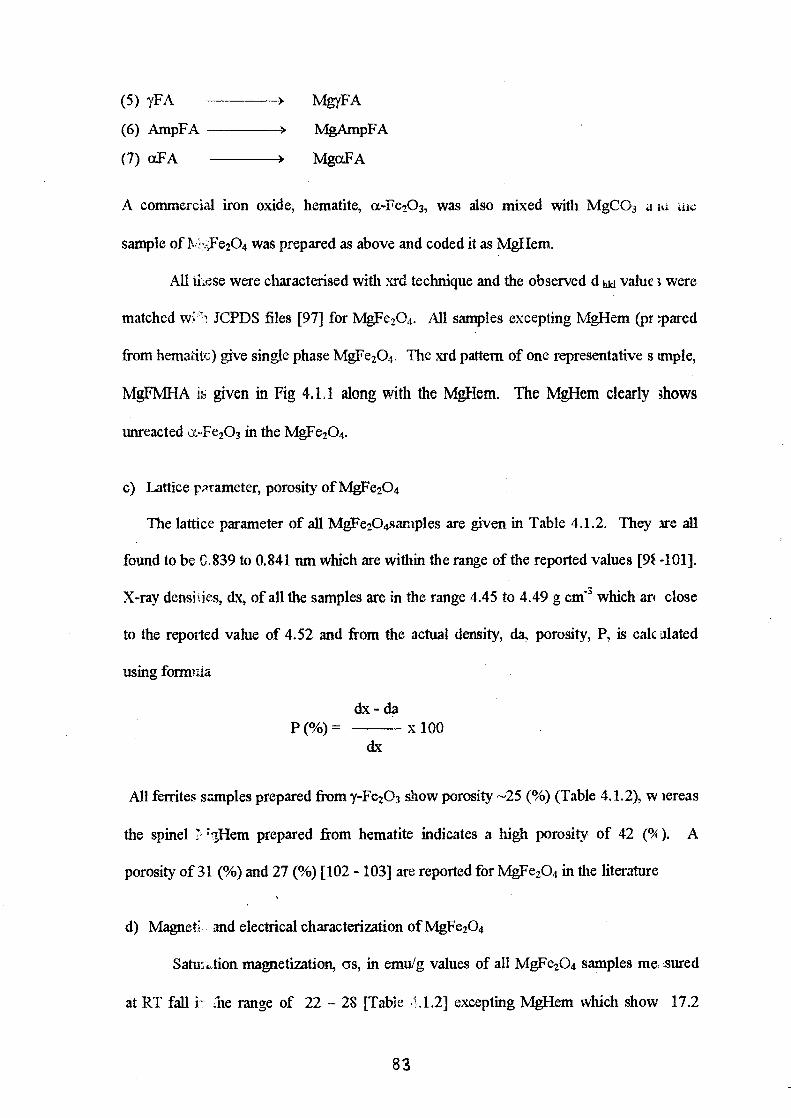
FIG. 4.1.1:— X-ray pattern of Mg Fe 2 04
20 30 40 50 60 70
2 e
C)
O Mg FMHA
Mg HEM
0 ch u)
tr) lD
8b
F oC
F
F
(5) yFA > MgyFA
(6) AmpFA > MgAmpFA
(7) aFA > MgaFA
A commercial iron oxide, hematite, a-Fe 203, was also mixed with MgCO3 a al Lak.:
sample of 1,:: ;_-Fe 204 was prepared as above and coded it as MgHem.
All these were characterised with xrd technique and the observed d hk1 value ; were
matched JCPDS files [97] for MgFe2O4 . All samples excepting MgHem (pt Tared
from hematite) give single phase MgFe 204 . The xrd pattern of one representative s tmple,
MgF1V1HA is given in Fig 4. 1. 1 along with the MgHem. The MgHem clearly ;bows
unreacted a-Fe 203 in the MgFe2O4 .
c) Lattice p?rameter, porosity of MgFe 2O4
The lattice parameter of all MgFe 204samples are given in Table 4.1.2. They ire all
found to be G.839 to 0.841 nm which are within the range of the reported values [9$ -101].
X-ray densities, dx, of all the samples are in the range 4.45 to 4.49 g cm -3 which ar( close
to the reported value of 4.52 and from the actual density, da, porosity, P, is calc alated
using formrda
dx-da P (%) — x100
dx
All ferrites samples prepared from y-Fe 203 show porosity —25 (%) (Table 4.1.2), w iereas
the spinel '11-lem prepared from hematite indicates a high porosity of 42 (9 ). A
porosity of 31 (%) and 27 (%) [102 - 103] are reported for MgFe 204 in the literature
d) Magnet: and electrical characterization of MgFe2O4
Satwaion magnetization, as, in emu/g values of all MgFe 2O4 samples me sured
at RT fall i he range of 22 — 28 [Table .A.2] excepting MgHem which show 17.2
83
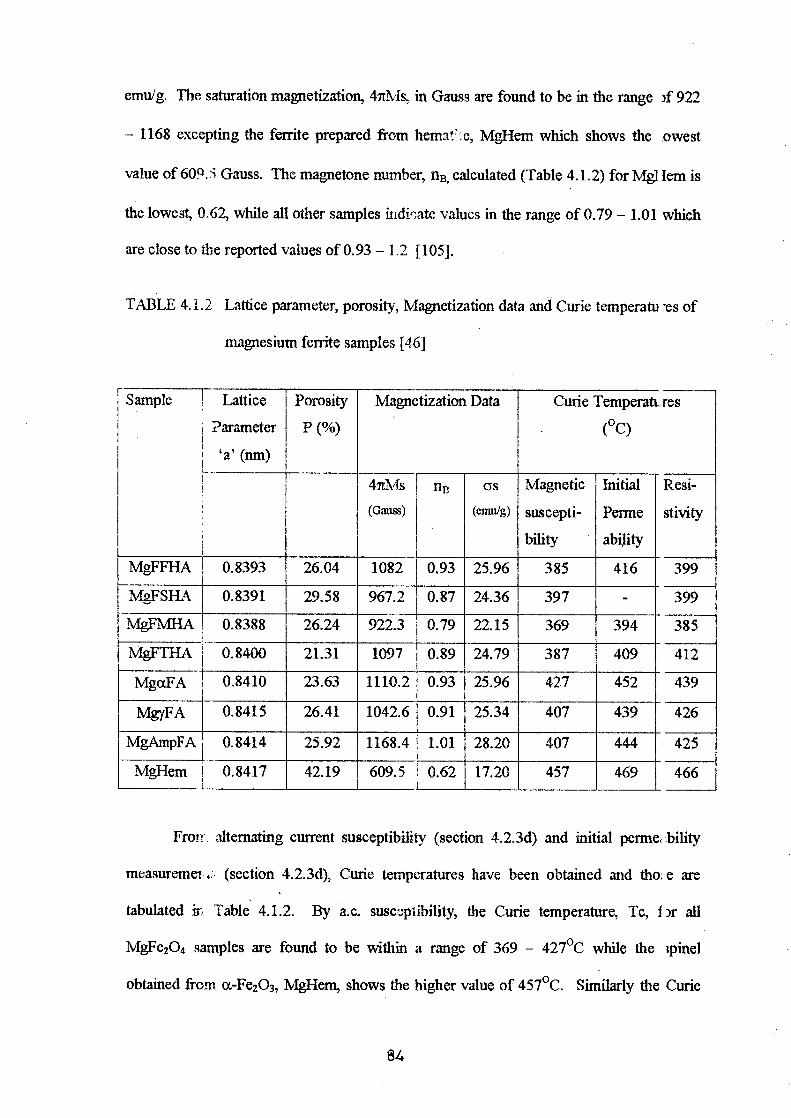
emu/g. The saturation magnetization, 4itMs, in Gauss are found to be in the range )f 922
- 1168 excepting the ferrite prepared from hema!',.e, MgHem which shows the .owest
value of 609.s Gauss. The magnetone number, n B, calculated (Table 4.1.2) for MglIem is
the lowest, 0.62, while all other samples indicate values in the range of 0.79 - 1.01 which
are close to the reported values of 0.93 - 1.2 [105].
TABI.F, 4.1.2 Lattice parameter, porosity, Magnetization data and Curie temperate vs of
magnesium ferrite samples [46]
Sample Lattice
Parameter
`a' (nm)
Porosity
P (%)
Magnetization Data Curie Temperate res
(°C)
4711% (Gauss)
nn as
(fig)
Magnetic
suscepti-
bility
Initial
Perme
ability
Resi-
stivity
MgFFHA 0.8393 26.04 1082 0.93 25.96 385 416 399
MilFSHA 0.8391 29.58 967.2 0.87 24.36 397 - 399
MgFMHA 0.8388 26.24 922.3 0.79 22.15 369 394 385
MgFTHA 0.8400 21.31 1097 0.89 24.79 387 409 412
MgaFA 0.8410 23.63 1110.2 0.93 25.96 427 452 439
MgyFA 0.8415 26.41 1042.6 0.91 25.34 407 439 426
MgArnpFA 0.8414 25.92 1168.4 1.01 28.20 407 444 425
MgHem 0.8417 42.19 609.5 0.62 17.20 457 469 466
Frop- alternating current susceptibility (section 4.2.3d) and initial perme, bility
measuremer .. (section 4.2.3d), Curie temperatures have been obtained and tho; e are
tabulated it Table' 4.1.2. By a.c. susceptibility, the Curie temperature, Tc, 1)r all
MgFe204 samples are found to be within a range of 369 - 427 °C while the ;pine'
obtained from a-Fe 203, MgHem, shows the higher value of 457 °C. Similarly the Curie
84
temperature measured from initial permeability for all MgFe2O 4 samples ranges fit ai 394
— 452°C, whereas the MgHem shows highest value of 469. The reported value: show
rather a wide range of Tc from 320 ° to 440°C [106,107].
Direct current electrical conductivity measurements (section 4.2.3d) also t sed to
locate Curie temperature by studying the temperature dependence of resistivity of all
ferrite same es. A transition temperature from fenimagnetic to paramagnetic is ob served
by the change in slope of the log p Vs 1/T plots. And the Tc values in the range 385 —
439°C for MgFe2O4 obtained from y-Fe 203 are tabulated in Table 4.1.2. A high v lue of
Tc of 466°C is observed for MgHem.
4.1.2 Microstructural studies by SEM
The MgFe2O4 prepared from y-Fe203 samples obtained from ch mical
beneficiated iron ore rejects, thus, show fairly unifomi magnetic and lectric
characteristics, as described in 4.1.1, while the ferrite prepared from corn] iercial
hematite, oc-Fe 2O3 (MgHem) indicated higher porosity, low saturation magnet zation
value and high Curie temperature. The xrd studies revealed an admixture of oc-Fe 203 in
MgFe2O4 prepared from oc-Fe 2O3 (commercial), on the other hand, all other M, ;Fe204
samples obtained from y-Fe 203 showed single phase in the xrd pattern. Althout h, this
admixture of oc-Fe2O3 in MgFe2O4 may be considered due to incomplete reaction in the
present investigation which may be causing different characteristics that observe 1, it is
important to look into microstructure of these ferrites. This is due to the fact hat all
MgFe2O4 samples show porosity — 25 % excepting MgHem (from oc-Fe 2O3) which shows
40 % porosity.
Grain size and porosity are the important factors which influence magne is and
electric properties in ceramics. And, therefore, the samples on which all above results
85
were obtained in our laboratories [46] were used to get microstructural infon ation
through scanning electron microscopy (SEM) and the results of such studies [47] are
presented here.
Microstructure of all y-Fe 203 samples and commercial hematite, a-Fe 203 ur ed for
the MgFe2O4 preparation and all the ferrite samples synthesized were studied by using
SEM, Model: Cambridge Stereoscam S 250 MK LH having accelerating voltage range
from 500 V io 40 kV and magnification range from 20x to 3,00,000x at 10 mm W) with
resolution 40A.
The samples in the pellet form and in powder form were used in obtainini SEM
results in the form of a micrographs on 35 mm B/W film.
From SEM micrographs the grain size is calculated as follows,
i) Drawing a diagonal on the photograph
ii) Measuring the maximum unidirectional particle size in the vertical direction against
diagonal
iii) Averaging the maximum unidirectional particle size
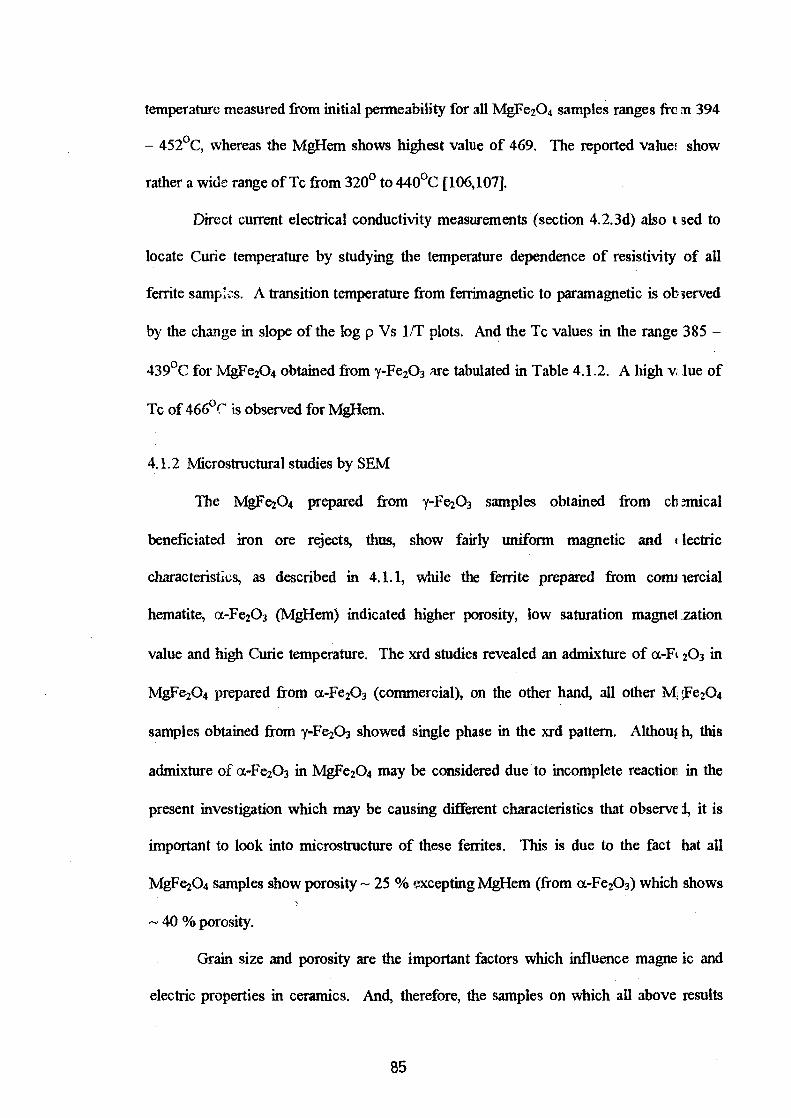
The distributions of grain sizes are then plotted as percentage (1/0) variation versus
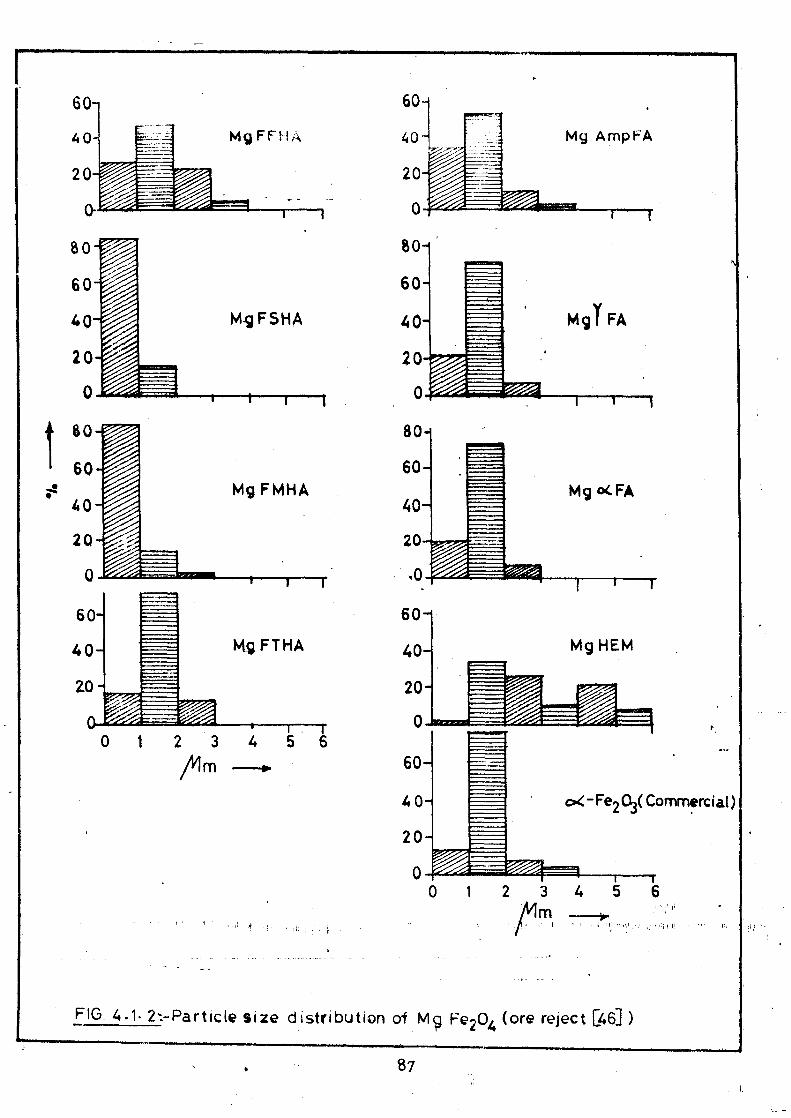
size of particles in pm and presented in the form of bar chart (Fig.4.1.2) for M ,,Fe204
samples. Few representative micrographs of iron oxides and the ferrites prepare 1 from
these oxides are also given here.
a) Particle size distribution
Scanning electron micrographs of all MgFe 204 samples prepared from ) -Fe2O 3
show a particle size didtribution (Fig 4.1.2) upto 3 pm, excepting the ferrite that p: epared
from a-Fe203 (MgHem) in which a wide range in sizes upto 6 pm is observed.
86
60
40
20
0-
•••■■••■■11.10
.111111011111
Mg FTHA
60-
MgFFHA 40 - Mg AmpFA
20
0
80
60
Mg FSHA 40 MO' FA
20
0
80
60 Mg FMHA Mg 04.FA
40 011111010111=.1011111•111.
20 MEE
2
ffim
• P"'"'"" ••■■•■••7
Mg HEM
0,4 - Fe2 03( Commercial) 40
to
60-
40-
20-
0
60
20
2 3 4 5 Mm
0 0 1
BO
60
40
20
0
60
40
20
80
60
40
20
0
FIG. 4.1. 2:-Particle size distribution of M 9 Fe204 (ore reject [46] )
87
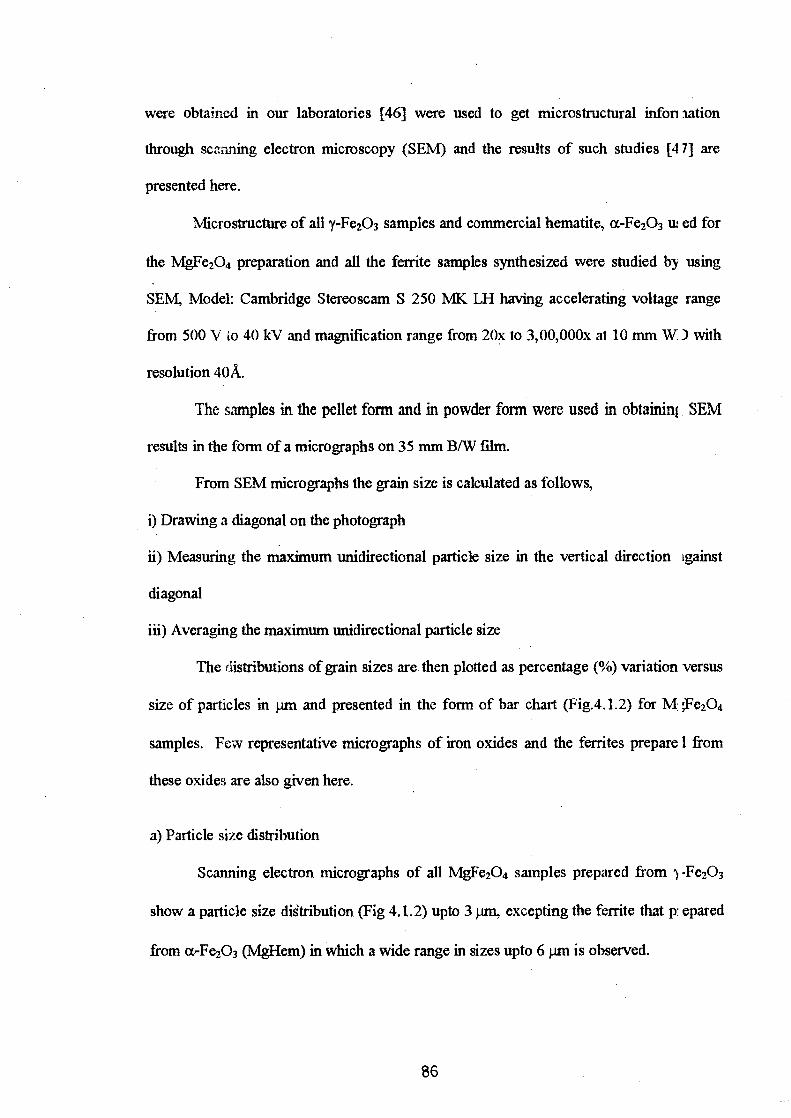
b
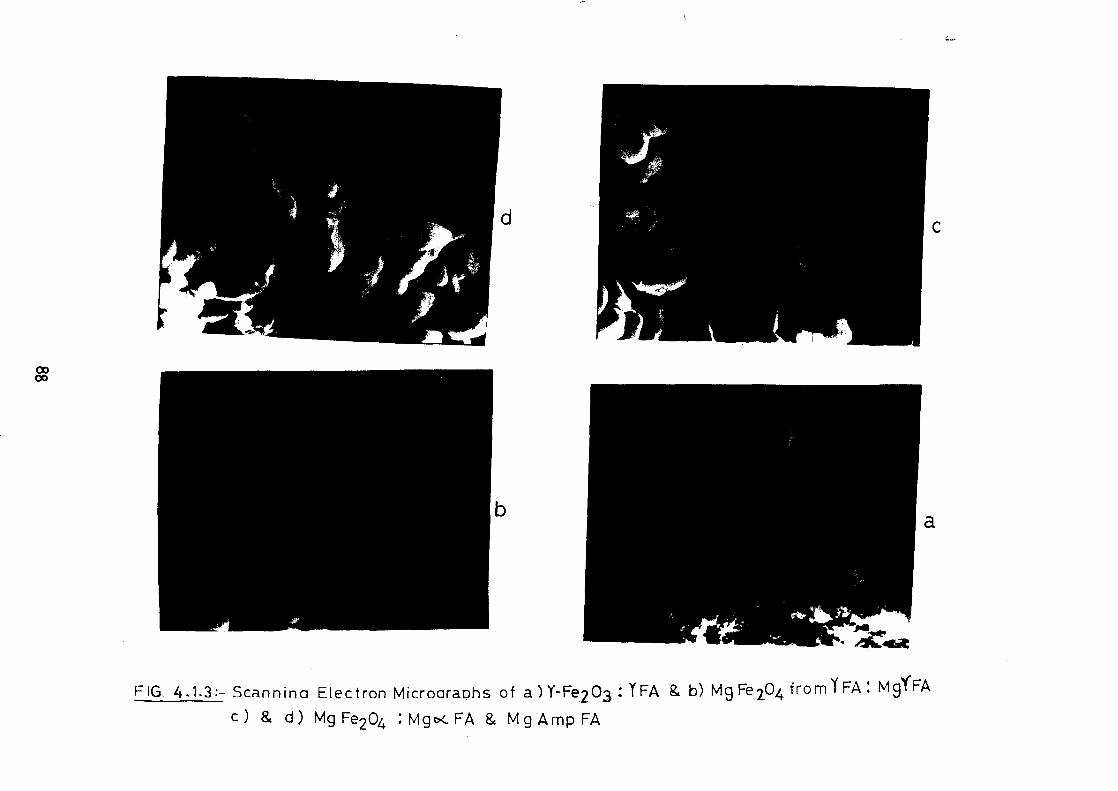
FIG 4.1.3:- Scannina Electron Microaraohs of a )Y-Fe203 : TFA & b) M9 Fe204 from Y FA : MO-FA
c) & d) Mg Fe204 Mgcx. FA & Mg Amp FA
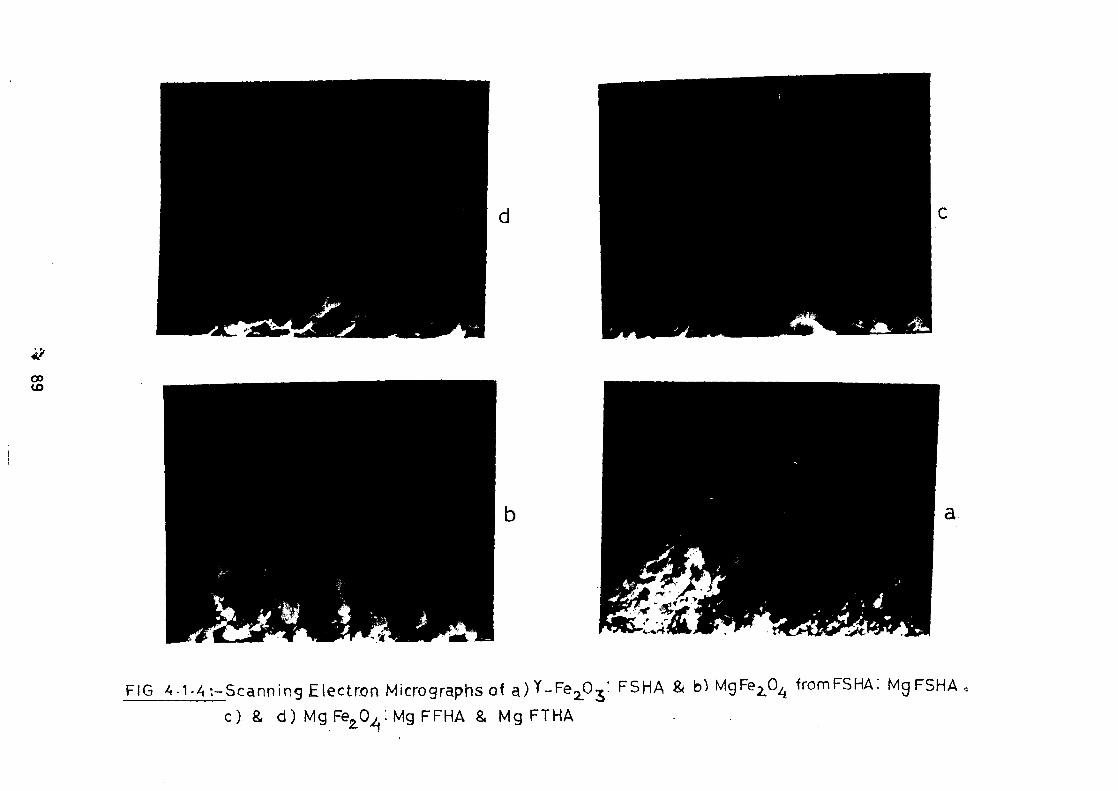
FIG 4-1.4 :-Scanning Electron Micrographs of a) Y_Fe 20 3: FSHA & b) MgFe204 fromFSHA: mg FSHA
c) & d) Mg Fez021 : Mg FFHA & Mg FTHA
a
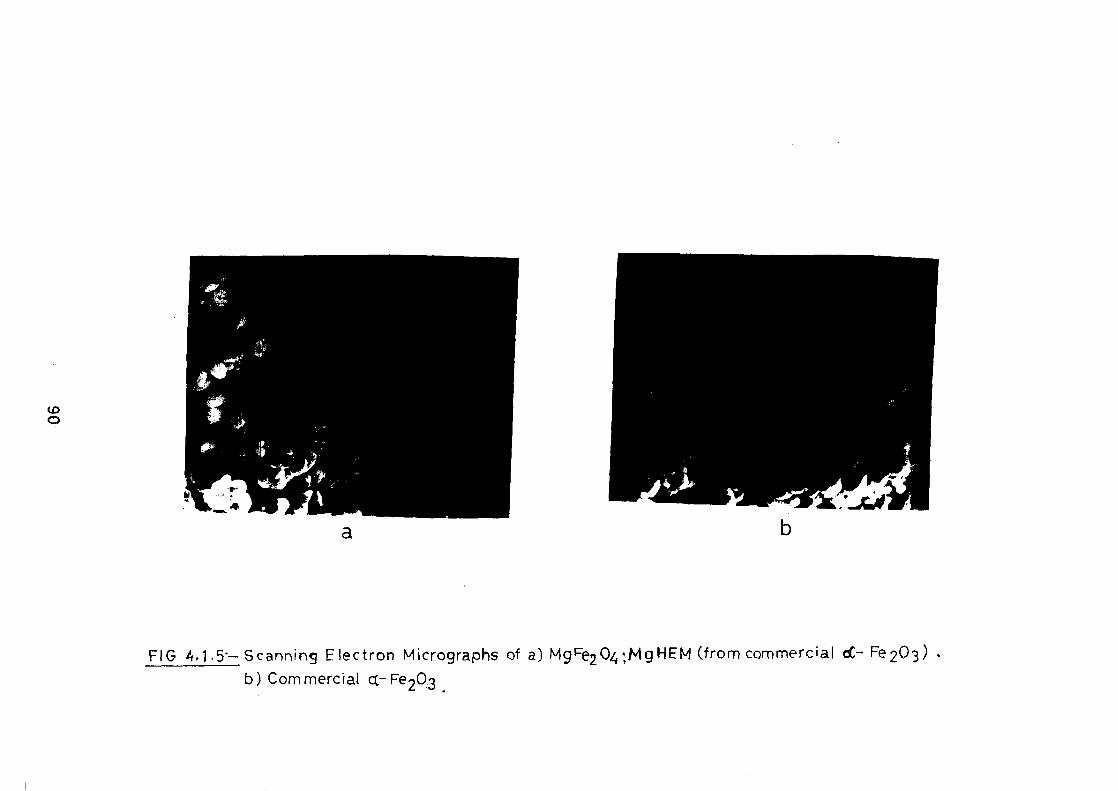
FIG 4,1.5 .— Scanning Electron Micrographs of a) MgEe204.,Mg HEM (from commercial Fe 203) •
b) Commercial a- Fe203.
MgyFA, Mga.FA and MgAmpFA
Tht i'v4gFe 204, MgyFA, prepared from. y-Fe 203 (y-Fe0OH autocatalytic), shows
72 (%) particle between 1 - 2 pm, 22 (%, grains < 1p.rn and 6 % in the range o f 2 - 3
pm. The sample MgaFA (y-Fe 203 source from a-FeOOH) and MgAmpFA (y •e 203
from amorphous FeOOH) also show more or less the similar grain size distribu ion as
MgyFA. The micrographs of these are shown in Fig. 4.1.3. There is a uniform grain size
distribution in these samples. The measured porosity from x-ray density and actual
density of ti -.cse are almost similar: 23.63 -- 26.41 (%) (Table 4.1.2).
MgFFHA, MgFSHA, MgFMHA and MgFTHA
The MgFe204 synthesized from y-Fe 203 obtained from iron (II) carbo: ylato-
hydrazinatee, (141, 11A, FSHA,FMHA and FTHA) show a .grain distribution (Fig.4.: .2) of
upto 3 pm. The MgFMHA and IVIgFSHA have — 85 (%) grains < 1 pm and — 14 4 (%)
particles of 1 - 2 pm. A few particles of 2 - 3 pm are also observed in MgFMHA. )n the
other hand, MgFFHA and MgFTHA show a majority of gains in 1 - 2 pm. The SEM
micrographs are shown in Fig. 4.1.4 and the porosity of these ranges from 21 - 29 (° 5).
MgHem
The .ivigFe204 prepared from commercial a-Fe 203 (MgHem) shows a wide range
of grain size distribution (upto 6 pm). In Fig. 4.1.2 it can be seen clearly that 34 ( %) of
particles are of 1- 2 pm, 26 (%) are in 2 - 3 prn, 10 (%) in 3 - 4 pm, 20 (%) are it 4 - 5
pm and 8 (%) in 5 - 6 pm range. Such a distribution of grains effectively makes these
sample more porous and the porosity observed from x-ray density & actual den; ity is
42 (%). The SEM- micrographs of commercial a-Fe 203 and MgHem are shown n Fig
4.1.5.
Thus, all samples excepting the ferrites prepared from a-Fe 203 (MgHem) sh( w
91
uniform mic:v3tructure. And this leads to different magnetic characteristics that has been
observed ir -)pr studies.
b) Rcactivit- of iron oxides leading to MgFe204
The MgFe204 synthesized from iron oxide (mainly y-Fe203) obtained from dii Terent
sources show almost similar micro-structural characteristics with majority of gra ns of
size < 2 pm. The MgFe204 obtained from commercial a-Fe 203 (MgHem), hoi /ever,
shows particles upto 6 gm with different grain sizes. The iron oxide (mainly e2 03)
sources used for the synthesis of MgFe2O 4 are from autocatalytically decompose I iron
carbory'Jo-hydrazinates and hydrazinated iron oxyhydroxides. The autoca :alytic
decomposinon leads to oxides of uniform particle size with very high surface area.
The BET surface area of iron oxides (mainly y-Fe 203) measured on few st tnples
show to ha °,' 30-70 mzig and SEM micrographs also indicated a uniform distribui on of
particles of 10-30 nm size. A representative micrographs of yFA (Fig. 4.1.3a) and 7SHA
(Fig. 4.1.4a) are shown along with the ferrite prepared from them. These iron oxick s then
react with VgCO3 and the ferrite samples that sintered at 1000 °C show < 3 }.0 2 size
grains in the ferrite, as described above.
On the other hand, the wide distribution of particle size in MgFe 2O4 (M. ;Hem)
obtained fr ,-.1.1 commercial ct-Fe 203 may be due to the large grain size of 1 - 2 pm
observed in this oxide. In Figures 4.1.2 and 4.1.5b it can be clearly seen that cc Fe 203
(commercial) has 76 (%) of grains 1 - 2 .tr11,. 13 (%) grains < 1 pm, 7 (%) panic es are
2 - 3 p.m, :a./o) are in 3 - 4 tun. Such a large grain sized ct-Fe 203 material in con rast to
small nanocootre sized 7-Fe 203 is responsible for the wide range of particles in the -errites
with large -orosity as observed in MgHem (Fig. 4.1.5a). The small grain y •Fe 203
samples, hr -.Tever, give uniform and smalle7 particles of ferrites with uniform p )rosity
9 2
but less than MgHem. These observations indicate nanometre size particles give u tiforrn
1 - 3 pm size ferrites at 1000 °C allowing further scope to increase the particle ize by
increasing sintering temperature, giving better characteristics. Whereas, non u tiform
particles in MgHem may further enhance non-uniform grains.
4.1.3 Conclusions
1. Iron (ID carboxylato-hydrazinates and iron oxyhydroxides obtained from in n ore
rejects decompose autocatalytically giving mainly y-Fe 2O3 . Few traces of a. Fe 2O3
are found, in few samples.
2. The iron oxides (mainly y-Fe 203) y: e1(1 single phase MgFe 2O4 when mixes with
MgCO3 nd heated — 1000°C.
3. Commercial a-Fe 203 (hematite) plus. MgCO3 — 1000°C give mainly MgFe2O ; with
few traces of a-Fe203, suggesting single phase spinel is not formed.
4. MgFe2O4 prepared from commercial a-Fe 203 shows high porosity of — 42 %, while
y-Fe203 sources result in the ferrites of porosity — 25 %.
5 A low .s.-1 uration magnetization value of 609 Gauss is observed for MgFe 2O4 pn pared
from a-Fe203 where as the ferrite obtained from all y-Fe 2O3 sources show the value
between 922 — 1168 Gauss.
6. Curie temperature, Tc, of 457, 469 and 466 °C is observed for MgFe2O4 ob ained
from a- 7e203 from temperature variation of magnetic susceptibility, initial
permeability and resistivity. All other samples showed Tc lower than this, whi :h are
close to the reported values.
7. Uniform grain size in the range of 0 - 3 pm is observed for MgFe 2O4 from nano metre
size y-Fe 2O3 prepared from hydrazine precursors. A large distribution in partie 3 size
93

0 - 6 pn-, is indicated by MgFe204 synthesized from commercial grade a-Fe2 ) 3 of
mainly 1 - 2 pm size grains.
94
Part II
Synthc-is and Characterization of MgFe2O4
(Study Sample I)
4.2 Intro(' :3tion
In Part I, we have described a detailed microstructural aspects of MI Fe 204
prepared from iron oxides containing y-Fe203 that obtained from chemically benef ciated
iron ore rejects. Iron (II) carboxylato-hydrazinates and hydrazinated iron oxyhydDxides
were the pr cursors for these iron oxides. The MgFe 2O4 samples thus obtainec. were
characterized for their important electronic and magnetic properties. These pro )erties
were then compared with the properties of MgFe 2O4 prepared from commercial he natite,
oc-Fe2O3 . Since, MgFe2O4 prepared from oc-Fe 203 (MgHem) showed low saturation
magnetization value compared to the ferrite prepared from y-Fe 203 obtained fa m ore
rejects, we suspected that MgHem differed in its characteristics due to an inco nplete
formation of MgFe2O4 as it had some adreixture of oc-Fe 203 in it. Also, MgHem s lowed
higher pore ty — 42 ( %) as compared to all the other samples, we considered this I lay be
95
the reason -C 3- the inferior characteristics in MgHem. The microstructural stud es too
indicated large particle size distribution in MgHem, while all the other samples lowed
almost uniform particles. Thus, from these studies we conclude that the startir g iron
oxide consi•':_ng of 7-Fe 203 is required for MgFe 204 formation of better quality. . Tence,
the 7-Fe 203 seems to be a better precursor as mentioned in the literature [44 — 5] for
ferrite preparation. We have, therefore, investigated this aspect further and the ref 'As of
such studies lre presented in this Part II.
In the present studies too iron ore rejects are being used to obtain 7-Fe20 2 The
detailed procedure to obtain the iron oxides from study sample I has been descri )ed in
chapters 2 and 3. These iron oxides are then used for MgFe 2O4 preparatic 1 and
characterized. For comparison the ferrite samples were also prepared from comrlercial
red oxide (a fresh sample other than that used in 4.1) and a standard y-Fe 203.
4.2.1 Preparation of MgFe 2O4
a) From iron oxides (study sample I)
The iron oxides mainly in the form of 7-Fe 203, a,-Fe203 and 7-Fe203 with some
admixture o a-Fe2O3 that obtained from iron ore reject study sample I (chapter 3)are
mixed with MgCO3 in the required proportion and performed heat treatment as in 4 1.1.b.
The sinterinz temperature was 1000 °/24h. The samples thus obtained were co( ed as
below, depeilding on the iron oxide source from which they are prepared.
Iron oxide source Code for MgFe2.04
Mainly a-Fe,03 (from hydroxides)
NaOH > MgFH / NaOH
FH / NH3 > MgFH / NH3
FH1 ma0H + NH3 > MgFH / NaOH + NH3
96
FH,INa2CO3 > MgFH /Na2C 03
Mainly y-Fe203 (from hydroxide hydrazinates)
FHB / NaOH
MgFHH / NaOH
FHFi / NH3 MgFHH / NH3
Firrl NaOH + NH3 MgFHH / NaOH + NH3
/Na2C O3 MgFHEI /Na2CO3
Mainly y-Fe203 (from formate / formate hydrazinate)
FF
FF I NH3
FF I NaOH + NH3
FF /7' Ta2CO3
FFH NaOH
14 1., ET NH3
FFE: NaOH + NH3
FF?-1 /Na2CO3
> MgFF NaOH
> Mot. i NH3
> MgFF / NaOH NH 3
/Na2CO3
> MgFFH / NaOH
MgH.H / NH3
MgFFH / NaOH + NH 3
MgFFH /Na2CO3
b) From commercial red oxide, RO
A commercial grade iron oxide, red oxide (RO), oc-Fe 203, was mixed w th the
required amount of MgCO 3 and the heat treatment was followed as in 4.2.1. The l roduct
was coded as MgRO.
c) From standard y-Fe203
A c—nmercial y-Fe 203 that procured was used to prepare magnesium fen te. A
mixture of gCO3 + y-Fe203 was heat treated in air as well as in an inert atmosph( re and
sintered '00°/24. The samples are coded as Mgy-air and Mgy-N 2 .
97
4.2.2 Shaping of MgFe 2O4
Although the ferrite samples were synthesized and sintered in pellet fo in, in
general, as in 4.2.1, they were then crushed to fme size and used for x-ray
characterization to establish the single phase ferrite formation and nu gnetic
characterization. However, samples for initial permeability measurements were re iuired
to be in the trmoid form and for dielectric and resistivity measurements in the pellet form.
They are prepared as follows.
a) Pellets and torroids
The ferrite sample prepared were crushed in an agate mortar to fme size an I used
to prepare pellets and torroids.
Pellets
A finely ground ferrite sample was compressed into a pellet using a die. A pellet
of 1-1.5 cm diameter and 0.2 — 0.3 cm thickness was obtained by applying press ire of
5 -- 10 tonic, ,2 for a duration of 2 minutes.
Torroids
Torroids of size of internal diameter 1 cm and outer diameter of 2 cm were
prepared from ground MgFe 204 samples.
b) Sintering
Pellets and torroids were heat treated in a muffle furnace. All were I eated
initially to 700°C for 24 hours and then increased the temperature to 1000 °('' and
maintained at that temperature for 24 hours. Samples were then furnace cooled.
4.2.3 Characterization
a) X-ray diffraction (XRD): Phase identification
98
The magnesium ferrite samples were x-ray analysed on Philips x-ray
diffi-actometcr model PW 1710 with Cu Ka radiation _ad nickel as a filter. The x-ray
diffraction ir the present study is used to (1) observe the impurity phase (2) confi m the
completion of solid state reaction and (3) determine the lattice constants, in ► ci
distances, octahedral and tetrahedral site radii, bond length, x-ray density etc. ts the
crystallites are randomly oriented, a reflection at the particular position is due to the set of
atomic planes satisfying Bragg's conditior. The Bragg's law is given as,
= 2d hu sin 0
where d hH S the interplaner spacing of crystal planes of miller indices (hid), 0 is the
glancing angle, 2k, is the wavelength of x-ray radiation and 'n' is the order of diffrac: ion.
For a cubic lattice, lattice parameter 'a', miller indices (hkl) and inter Dlaner
distance d h! are related by relation,
a
h2 k2 12
The planes that diffract x-rays in inverse cubic spinel systems are (220), (311), ;400),
(422), (44C], (533) etc. The interplaner distance (d) for each diffraction angl was
calculated by the above given relation and then the lattice parameter 'a' was calculated.
Finally the values of 'a' for all MgFe 2O4 samples were computed by the least quare
method.
Measurement of bond length
The values of bond lengths (R A and RB) and site radii (rA and rB ) were calc dated
by using the relations given below.
RA I3 (6 + 1/8)
99
RB = a 4 1/16 - 8/2 + 3d2
rA =(U-1/4) a -43 - Ro
rn, - 3/8 - u) a - Ro
where RA = The shortest distance between A-site (tetrahedral) cation and
oxy^en ion
RB = The shortest distance between B-site (octahedral) cation and oxygen
ion
rA = Tetrahedral site radius
TB = Octahedral site radius
Ro = Radius of oxygen ion (1.35 A)
8 = Deviation from oxygen ion parameter (u)
8 = - u ideal [U ideal ":" 0.375 A]
b) X-ray density, Physical density & Porosity
The x-ray density (dx), physical density (dp) and porosity (P) of the ferrite
samples were calculated from the relations
dx 8M/N a3
dp = m/v
and
P(%) = ( (dx-dp)/dx) • 100
Where M= Molecular weight of the sample
N = Avagadro' s number
a = 1 r,:tice parameter.
m = Mass of the pellet in air
100
v = Volume of the pellet measured using mercury balance by the relation
WI + W2 v —
d
where W i = Weight of pellet in air
W2 = Weight of pellet in mercury
d = Density of mercury
c) Infra - Red Analysis
The -nfra red analysis of all the magnesium ferrite samples were do le on
Shimadzu FTIR, model 8101 A. The pellets used for recording spectra were pr , pared
by mixing small amount of ferrite powder in KBr. The IR spectra in the frequency range
of 400 - 46"°0 cm -1 were recorded at room temperature.
d) Magnetic and Electric Characterization
i. Saturation magnetization
The saturation magnetization in Gauss (G) is determined by formula
Ms is calculated as
Ms = (1-P) dx as
When P is the Porosity
dx is the X-ray density
as is saturation magnetization in emu/g
The magnetone number, that is the magnetic moment per formula unit ( -4) in
Bohr magnetons is given by
= M us/ 5585
Where M is the molecular weight of the sample.
101
ii. A. C. Susceptibility
The curie temperature and domain structure of the ferrite samples were
determined by a. c. susceptibility method developed by Likhite et al [132]. The powdered
ferrite was taken in a quartz sample tube and placed at the centre of the pick up cc il and
Pt-Rh thermocouple was used to read the temperature of the sample. The same e was
heated by passing d.c. current through platinum heating coils and the signal fr( m the
thermocouple was converted to temperatures. The magnetic moment and temp Irature
were recorded till this moment becomes zero. The relative susceptibility ie. m. gnetic
moment at higher temperature to the moment at room temperature was plotted gainst
temperature. The curves are called x- T curves.
iii. Initial P zmeability
The initial permeability as a function of temperature was measured at 10 )0 Hz
over the temperature range from 27 to 527 °C using Hawlett Packard 42 A,
20 Hz —1 MHz precision LCR meter. The furnace temperature was regulated within
3°C. The initial permeability was calculated from the low field inch. -Jance
measurements with a torroidal core of 85 turns using the formula,
L = 0.0046 pi N2 h log d1/d2
where L is the inductance in Hz
d1 is the outside diameter of a torroid
d2 is the inside diameter of a torroid
pi is the initial permeability of the core
h is the height of the core in inches.
iv Resistivity
The electrical resistivity measurements of the magnesium ferrite samples we T
102
carried out using the two terminal d.c. Inethod, in a range of temperature from 27 to
527°C. The pellets of dimensions 10 mm diameter and 2-3 mm thickness were 1 ressed
between tif=7" platinum electrodes and then measurements were taken. The resistivi ty was
determined by the relation,
p = 7E1'2 / 0' R.
Where r is the radius of pellet
t is the thickness of pellet
R is the resistance
The Curie temperature of ferrites were determined from the plot log p ; gainst
L/T.
v Dieletric Constant and Dielectric loss Tangent
The dielectric measurements were made using the two - probe method. The
pellets of 1(? mm diameter and 2-3 mm thickness were used for the die ectric
rneasureme7:.s which were carried out against frequency on Haw/lett Packard 42 34 A,
20 Hz — 1 MHz precision LCR meter with 16048 C test leads. The capacitance, , was
measured and used in the calculation of dielectric constant, s', using the relation
= cd/ so A
where d is the thickness of the pellet
A is the cross-sectional area of the, flat surface of the pellet and s o is the free -
space permittivity.
The variation of tan 8 with the frequency is also measured along wit i the
dielectric constant.
e) Microstructural (SEM) studies
SEM of magnesium ferrite samples were taken on a Cambridge Stereoscan S 250
103
Table 4.2.1 XRD data of MgFe2O4 obtained using Iron oxides prepared from Iron
hydroxides / formates and their hydrazinates
MgFe2O4 d like 'a' (nm)
-.orm
MgFe2O4 JCPDS 4.84 ---- 2.53 ---- ---- ---- 1 .48 0.8375 Low 17-464 low (4) ( ) (100) (35) MgFe2O4 JCPDS 4.85 --- 2.53 --- --- 1.49 0.8397 High 17-465 high (8) ( .(100) (40) o.-Fe 2O 3 JCPDS 3.66 --- 2.69 - -- 2.51 2.20 1.84 -- 13-534 (25) (100) (50) (30) (40)
Mg y- air 4.85 ---- 2.97 2.53 2.52 ---- --- 1.48 0.8388 (3) (42) (100) (44) (41)
Mg Y- N2 4.86 --- 2.97 -- 2.53 --- --- --- 1.48 0.8391 (4) (41) (100) (22)
Mg.RO air 4.84 2.97 --- 2.53 --- --- --- 1.48 0.8386 (4) (43) (100) (40)
Mg.FII / NaOH 4.85 ---- 2.97 2.53 ---- --- --- 1.48 0.8398 air (3) (37) (100) (40)
Mg.FHH / NaOH 4.85 - -- 2.97 --- 2.53 --- --- 1.48 0.8393 air (3) (35) (100) (36)
Mg.FHH / NaOH 4.81 --- 2.96 --- 2.53 -- --- --- 1.48 0.8380 N2 (2) (36) (100) (25)
Mg.FF / NaOH 4.84 --- 2.97 2.53 ---- - -- 1.48 0.8388 air (3) (42) (100) (44)
Mg.FF / Na0I-I 4.85 2.97 --- 2.53 --- ---- --- 1.48 0.8407 N2 (3) (40) (100) (44)
Mg.FFH 1 Na011 4.85 --- 2.97 ---- 2.53 --- ---- ---- 1.48 0.8394 air (4) (40) (100) (40 )
Mg.FFH / Na0I-I 4.88 --- 2.97 --- 2.54 - -- ---- - -- 1.48 0.8407 N;, (2) (34) (100) (46)
Mg.FH / NH3 4.81 --- 2.95 2.69 2.52 --- ---- 1.84 1.48 0.8349 air (3) (34) (1) (100) (2) (39)
Mg.FHH / NH3 4.83 3.69 2.95 2.70 2.51 -- 2.21 1.84 1.48 0.8353 air (5) (1) (33) (5) (100) (1) (3) (42)
Mg.FF / NH 3 4.83 3.69 2.96 2.70 2.52 2.21 1.84 1.48 0.8360 air (3) (4) (40) (12) (100) (3) (4) (42)
Mg.FFH / NH3 4.83 3.69 2.96 2.70 2.52 2.51 2.21 1.84 1.48 0.8363 air (3) (4) (33) (11) (100) (56) (3) (4) (38)
Mg.FH / NaOH 4.80 --- 2.95 2.69 2.51 2.51 - -- --- 1.48 0.8343 + NH3 air (2) (35) (2) (100) (57) (43) Mg.FHH / NaOH 4.81 3.69 2.95 2.71 2.52 --- 2.21 1.84 1.48 0.8356 + NH3 air (2) (6) (100) (1) (2) (40) Mg.FF / NaOH 4.81 --- 2.95 2.70 2.52 2.51 2.21 --- 1.48 0.8355 + NH3 air (4) (36) (1) (100) (51) (0.3) (37)
Mg.FFH / NaOH 4.84 --- 2.96 2.52 --- --- --- 1.48 0.8356 + NH3 air (2) (38) (100) (47) Mg.FH / Na2CO3 4.84 --- 2.96 2.69 2.52 --- --- 1.84 1.48 0.8365
air (3) (38) (2) (100) (1) (45) N1gFHH/Na2CO3 4.81 3.69 2.95 2.69 2.52 2.51 2.21 1.84 1.48 0.8357
air (4) (0.4) (35) (2) (100) (52) (0.4) (0.6) (39) Mg.FF / Na2CO3 4,83 3:68 2.95 2.71 2.52 --- 2.21 1.84 1.48 0.8359
air (4) (0.5) (36) (2) ( 100) (0. 7) (1) (38) Mg.FFH/Na2CO 3 4.83 2.96 --- 2.52 ---- 1.48 0.8370
air (4) (36) (100) (35)
104
Table: 4.2.? X-ray density, physical density and porosity of magnesium ferrites usilg
iron oxides prepared from iron hydroxides, iron formates and their
hydrazinates
Sr. Nos. Mg- Ferrite Sample
X-ray density gi,
CM3
Physical density g/cm3
Poros ty ( 9/0 ,
1 Mg.RO 4.50 3.22 28.5 ;
2 Mgy 4.50 3.34 25.7
3 N' gY (N2) • 4.50 --7 ----
4 Mg.FH / NaOH 4.49 ---- ----
5 Mg.FHH / NaOH 4.49 3.35 25.3 ;
6 IvIg.FHH / NaOH (N2) 4.51 3.35 25.7, )
7 1V, ,, .1,1, / NaOH 4.50 3.17 29.6 ;
8 Mg.FF / NaOH (N2) 4.47 --- ---
9 Mg.FFH / NaOH 4.49 --- ---
10 1\fig.FFH / NaOH (N2) 4.47 --- ---
11 A.,• _-:,.FH / NH3 4.57 3.37 26.1 ,
12 Mg.FHH / NH3 4.56 3.87 15.0 )
13 Mg.FF / NH3 4.55 3.71 18.4 '
1 . 4 N,1g.FFH I NH3 4.54 3.15 30.7
15 I'vta.FH / NaOH+NH3 4.57 3.27 28.5 :
16 Mg.FHH / Na0H+NH3 4.55 3.15 30.8 t
17 Mg.FF / Na0H+NH3 4.56 3.26 28.3
18 Mg.FFH / NaOH+NH3 4.55 --- ---
19 Mg FH / Na2CO3 4.54 3.12 31.1 ;
20 Mg.FHH / Na2CO3 4.55 3.47 23.8 i
21 Mg.FF / Na2CO3 4.55 --- ---
22 Mg.FFH / Na 2CO3 4.53 2.87 36.8 ;
105
The values of bond lengths (R A and RB) and site radii (rA and rB) are preset .ted in
Table 4.2.3 The bond length RB is greater than RA as expected is observed.
Table 4.2.3 Lattice parameter, bond length (RA & RB) and site radii (r A and rB) for
magnesium ferrites
Sr. Nos Precursors
Mean Lattice parameter
`a' (nm)
Bond Length (nm) Site radii (nm) RA-0 RB-0 rA rB
1 Mg.RO 0.8386 0.1903 0.2047 0.0553 1).0696
2 Mg -7 0.8388 0.1903 0.2048 0.0553 0.0697
3 Mg-y (N2) 0.8391 0.1904 0.2049 0.0554 11.0697
4 Mg.FH / NaOH 0.8398 0.1905 0.2050 0.0555 11.0699
5 Mg.FHH / NaOH 0.8393 0.1904 0.2049 0.0554 1%0698
6 Mg.FITH / NaOH (N2) 0.8380 0.1901 0.2046 0.0551 t'.0695
7 Mg.FF / NaOH 0.8388 0.1903 0.2048 0.0553 .0697
8 Mg.FF / NaOH (N2) 0.8407 0.1908 0.2053 0.0558 .0701
9 Mg.FFH / NaOH 0.8394 0.1905 0.2049 0.0555 I .0698
10 Mg.1-TH / NaOH (N2) 0.8407 0.1908 0.2053 0.0558 t .0701
11 Mg.FH / NH3 0.8349 0.1894 0.2038 0.0544 '.0687
12 Mg.FHH / NH3 0.8353 0.1895 0.2039 0.0545 I .0688
13 Mg.FF / NH3 0.8360 0.1897 0.2041 0.0547 .0690
14 Mg.F7H / NH3 0.8363 0.1898 0.2042 0.0548 .0691
15 Mg.FH / Na0H+NH3 0.8343 0.1893 0.2037 0.0543 .0686
16 Mg.FHH / NaOH+NH3 0.8356 0.1896 0.2040 0.0546 I .0689
17 Mg.FF / Na0H+NH3 0.8355 0.1896 02040 0.0546 I .0689
18 Mg.FFH / NaOH+NH3 0.8356 0.1896 0.2040 0.0546 .0689
19 Mg.FH / Na2CO3 0.8365 0.1898 0.2042 0.0548 .0691
20 Mg.FHH / Na2CO3 0.8357 0.1896 0.2040 0.0546 (.0689
21 Mg.FF / Na2CO3 0.8359 0.1897 0.2041 0.0547 .0690
22 Mg.FFH / Na2CO3 0.8370 0.1899 0.2044 0.0549 I .0692
106
MK M. A well polished surface of the pellet was used for taking micrographs. The
average grain size of these samples were computed from these SEM micrographs.
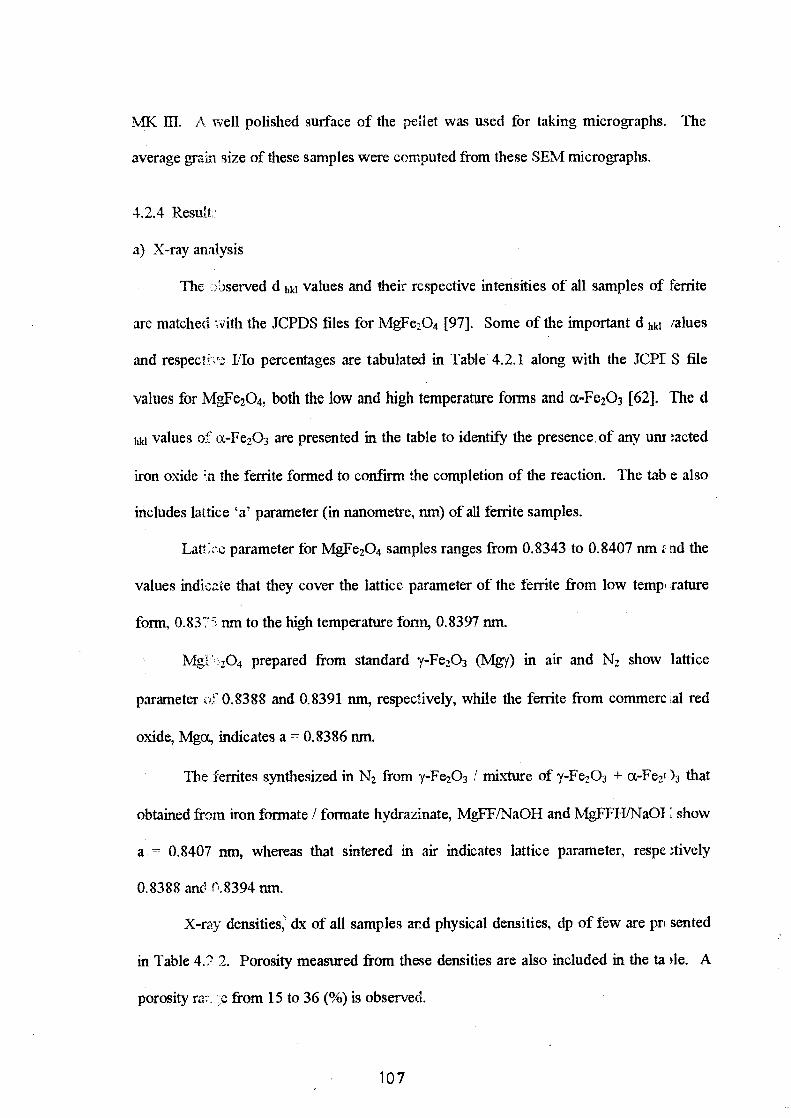
4.2.4 Result
a) X-ray analysis
The .):Jserved d hid values and their respective intensities of all samples of ferrite
are matched with the JCPDS files for MgFe 2.04 [97]. Some of the important d hkl values
and respecti 1/10 percentages are tabulated in Table 4.2.1 along with the JCPI S file
values for MgFe2O4, both the low and high temperature forms and oc -Fe203 [62]. The d
hk1 values of a-Fe2O3 are presented in the table to identify the presence, of any um .,acted
iron oxide 'a the ferrite formed to confirm the completion of the reaction. The tab e also
includes lattice 'a' parameter (in nanometre, run) of all ferrite samples.
Latrce parameter for MgFe2O4 samples ranges from 0.8343 to 0.8407 nm z nd the
values indicate that they cover the lattice parameter of the ferrite from low temp , rature
form, 0.83" nm to the high temperature form, 0.8397 run.
Mgf. .:I04 prepared from standard y-Fe203 (Mgy) in air and N2 show lattice
parameter of 0.8388 and 0.8391 nm, respectively, while the ferrite from commerc :al red
oxide, Mga, indicates a = 0.8386 nm.
The ferrites synthesized in N2 from y-Fe203 / mixture of y-Fe203 + a-Fe'? ) 3 that
obtained from iron formate / formate hydrazinate, MgFF/NaOH and Mg1TH/Na0I t show
a = 0.8407 nm, whereas that sintered in air indicates lattice parameter, respe
0.8388 and n,8394 run.
X-ray densities,' dx of all samples and physical densities, dp of few are pr sented
in Table 4.2 2. Porosity measured from these densities are also included in the to )1e. A
porosity ra; . from 15 to 36 (%) is observed.
107
b) Infra red analysis
The IR spectra of all the magnesium ferrite samples are shown in Fig 4.2. . The
IR spectroscopy is an important technique to describe the local symmetries in cry talline
[109] and non-crystalline solids [110] and, various ordering phenomena in spinels {111 —
112].
In the present IR studies, the high frequency band v 1 between 565 — 580 cr r -1 and
low frequez ,4 band v2 at — 410 cm' and between 425 — 440 cm' match well w nth the
reported MgFe204 [113]. This confirms the formation of MgFe204. Since mag iesiurn
ferrite is sensitive to humidity, the absorption bands are also observed at — 340( cm'.
Then bands are due to stretching and bending vibrations of water molecule [114].
The lattice vibrations of oxide ions with cations give rise to absorption bl nds in
spinel ferrites, producing various frequencies for the unit cell. Generally the spinel
ferrites show four IR bands, v 1 , v2, v3 and v4 in the range of 100 — 1000 cm' The
occurrences of these four bands have been computed on the basis of group the retical
calculations, using space groups and symmetries.
The first three fundamental bands are due to [115] tetrahedral and oct hedral
complexes and the fourth one due to some type of lattice vibrations. It has been X ointed
out [116] thlt vibrational frequencies depend on the mass of the cation, bonding for ;e and
unit cell dimensions.
For inverse and partially inverse spinels these four active models are triply
degenerate and may split [117] into three vibrations. If the splitting is not too lar: ;e and
there is certain statistical distribution of various cations over tetrahedral and octz hedral
sites, one c. -- not observe the splitting but only broadening of the spectral lines in he IR
spectra. This may be the reason why such behaviour is observed in our samples.
108
I 1 I 1 4000.0 3000.0 2000-0 1500.0 1000.0
Wave number (cm-1 )
FIG. 4.2.1:-IR Spectra of Mg Fe204 .
109
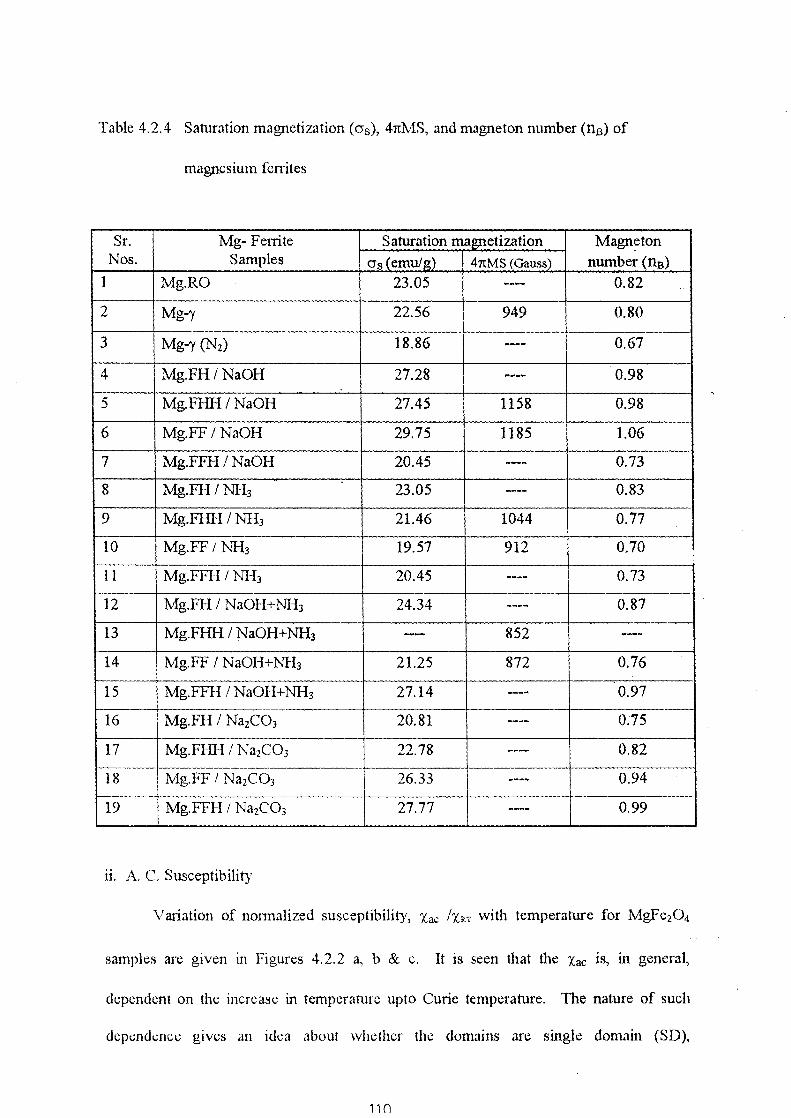
Table 4.2.4 Saturation magnetization (o s), 47rMS, and magneton number (nB) of
magnesium ferrites
Sr. Nos.
Mg- Ferrite Saturation magnetization Magneton number (n8) Samples as (emu/g) 4itMS (Gauss)
1 Mg.RO 23.05 0.82
2 Mg-y 22.56 949 0.80
3 Mg-1 (N Z) 18.86 ---- 0.67
4 Mg.FH / NaOH 27.28 ---- 0.98
5 Mg.FHH / NaOH 27.45 1158 0.98
6 Mg.1.1, / NaOH 29.75 1185 1.06
7 Mg.FFH / NaOH 20.45 ---- 0.73
8 Mg.FH / NH3 23.05 ---- 0.83
9 Mg.FHH / NH3 21.46 1044 0.77
10 Mg.141, / NH3 19.57 912 0.70
11 Mg.FFH / NI-13 20.45 ---- 0.73
12 Mg.FH / NaOH+NH3 24.34 ---- 0.87
13 Mg.FHH / NaOH+NH3 --- 852 ----
14 Mg.FF / NaOH+NH3 21.25 872 0.76
15 Mg.FFH / Na0H+NH 3 27.14 ---- 0.97
16 Mg.FH / Na2CO3 20.81 ---- 0.75
17 Mg.FIIII / Na2CO3 22.78 ---- 0.82
18 IvIg.FF / Na 2CO3 26.33 ---- 0.94
19 Mg.FFH / Na 2CO3 27.77 ---- 0.99
ii. A. C. Susceptibility
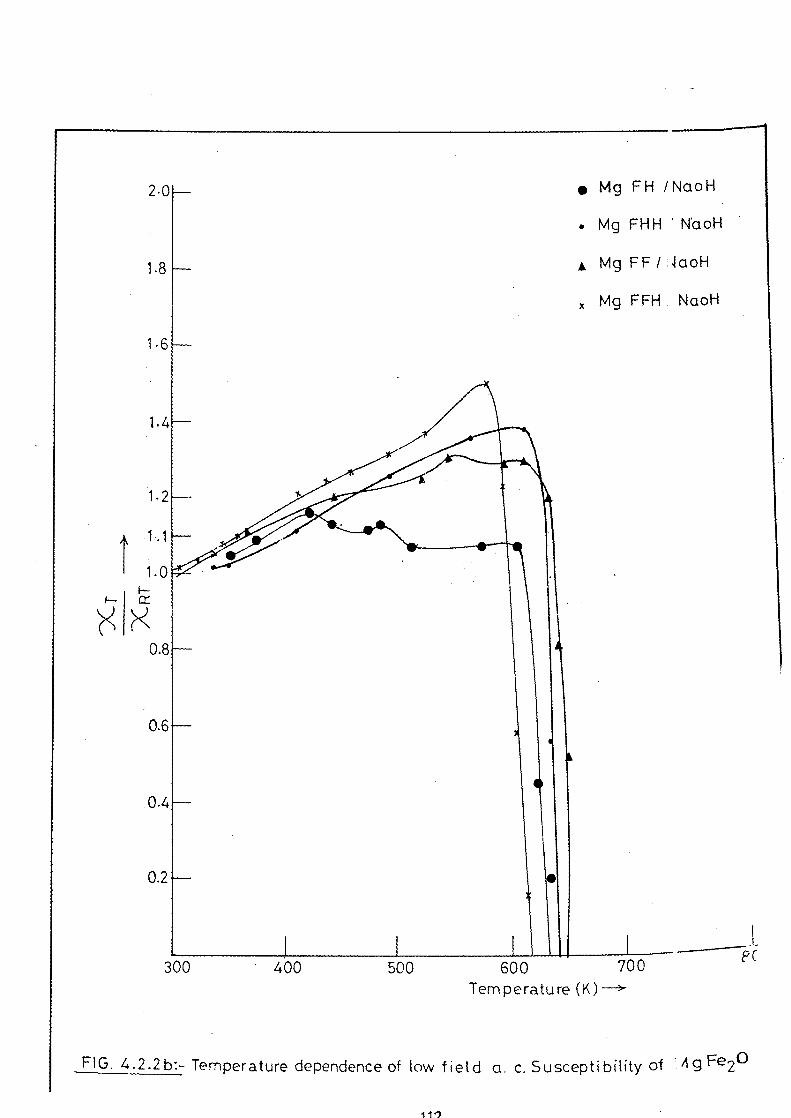
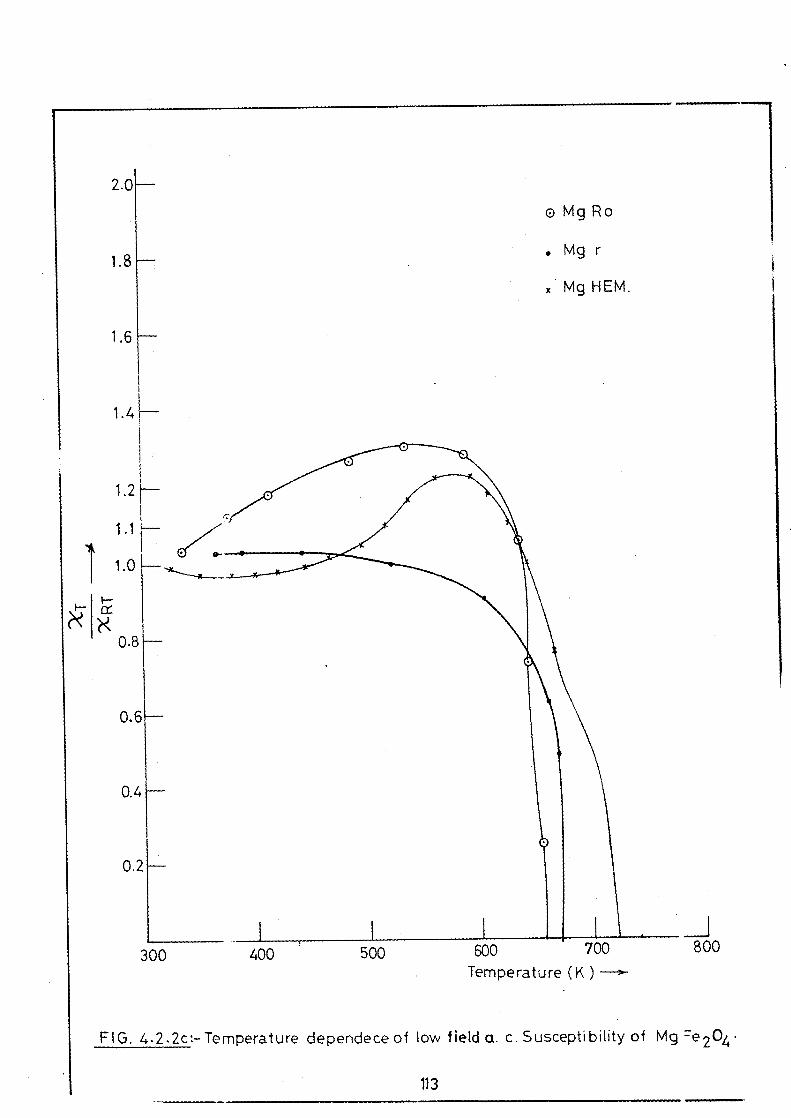
Variation of normalized susceptibility, Xac /XRT with temperature for MgFe 2O4
samples are given in Figures 4.2.2 a, b & c. It is seen that the x a, is, in general,
dependent on the increase in temperature upto Curie temperature. The nature of such
dependence gives an idea about whether the domains. are single domain (SD),
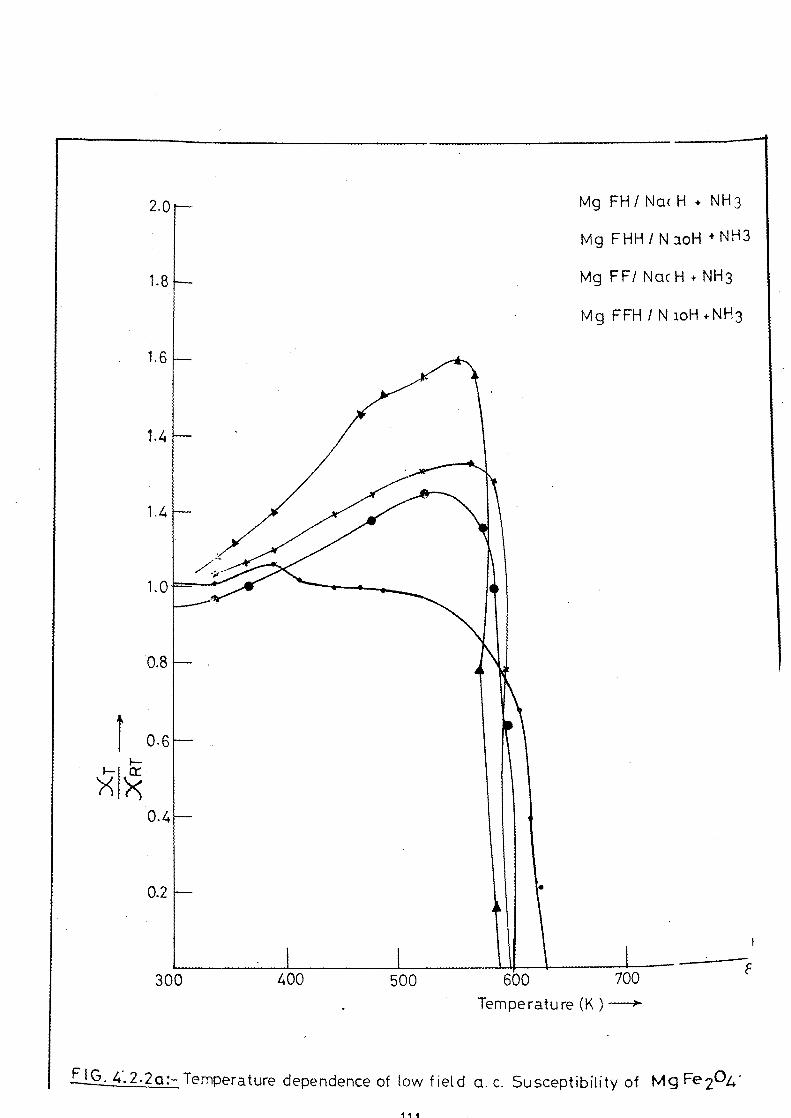
Mg FH / Nac H NH3
Mg FHH / N aoH + NH3
Mg FF/ Nac H NH3
Mg FFH / N ioH .NH3
300 F
400 500 600 700
Temperature (K)
F I G. 4 ..2.2a:- Temperature dependence of tow field a. c. Susceptibility of Mg Fe 2 04'
700
.
1
.
P
fa Mg FH /NaoH
. Mg FHH N'aoH
A Mg FF / laoH
x Mg FFH NaoH
500 600
Temperature (K) --
FIG. 4.2.2 b:- Temperature dependence of low field a. c. Susceptibility of A g Fe20
2.0
1.8
o Mg Ro
. Mg r
x Mg HEM.
1.6
1.4
0.8
0.6
0.4
0.2
300 II I . 400 500 600 700 800
Temperature (K) --->-
FIG. 4.2.2c:- Temperature dependece of low field a. c. Susceptibility of Mg 're 2 04 •
113
The A• 1 band is assigned to intrinsic vibrations of the tetrahedral group an• i v 2 to
the octahe(?al group [113, 118]. The absorption band v 1 is caused by stretd ing of
tetrahedral 7etal — oxygen and v 2 by the oxygen vibrations in the direction perpen licular
to the tetrahedral oxygen ion axis. These two have been associated with the vibrat ons of
the metal ions in the isotropic force fields to their octahedral and tetra hedral
environments. The bands v 3 and v4 are not observed in spinel ferrites [119].
Cubic lattice distortion or Jahn - Teller effect have marked influence on he IR
spectra [120 — 122] of spinets and the presence of ferrous ions, Fe z+, in spinel car cause
[123] splitting of absorption bands. The abs?,nce of such split or double band — 6C ) cm .1
(v1 band) inAicate no impurity Fe z+ ions in our samples. However, few samples tic show
such preseric.,; (Fig. 4.2.1) of the band or just slight dent in the region or a shoulder in the
spectra — 610 cm'''.
c) Magnetic and Electric Characterization
i. Saturation magnetization
A saturation magnetization value, us in emu/g, for all ferrite samples are gi yen in
Table 4.2.4. The values at RT are found to be in the range of 18 — 30 emu/g. These are in
the comparable range of 22 — 28 emu/g reported for MgFe 2O4 [104, 124 — 126. 132].
Magnetization, 4itMs, values calculated from relation mentioned above are also pre vented
in the table and they are in the range 852 — 1185 Gauss. These values are 13W as
compared to the reported values of 1140 — 1530 G [99, 127 — 128]. The mag tetone
number, n. between 0.67 and 1.06 is observed for all samples of which fe N are
comparable to the reported values [104 — 105, 108] of 0.93 — 1.2 Bohr magnetone.
114
40
30
20
10
300
• Mg FH/Naol-
. Mg FHH
• Mg FF. / Nciol-
x Mg FFH/Na01-1
70
60
50
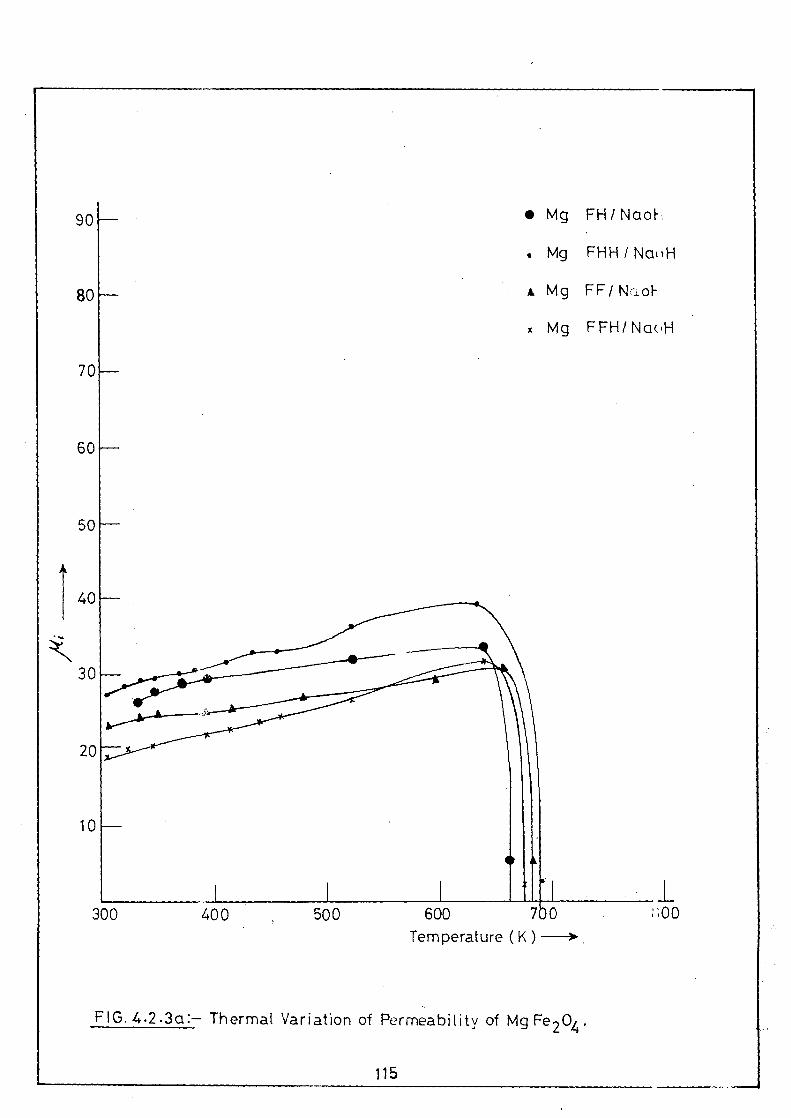
FIG. 4.2.3a:— Thermal Variation of Permeability of Mg Fe 2 04 .
90
80
.;00
115
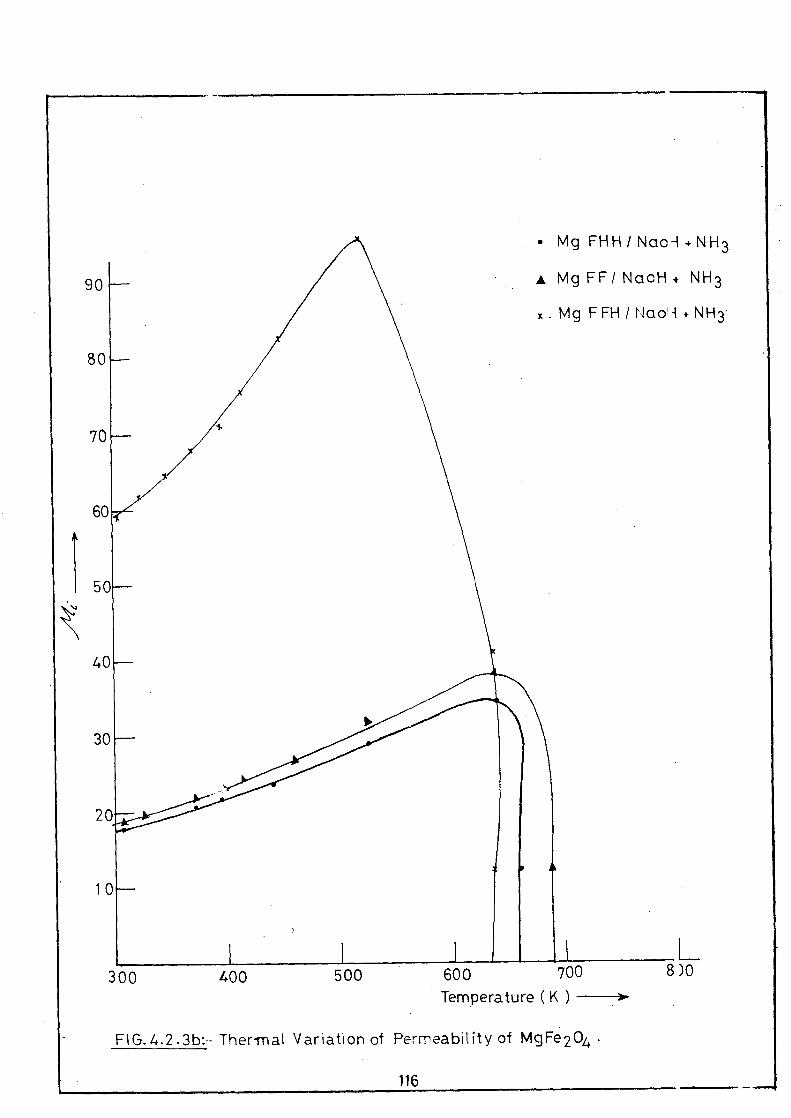
• Mg FHH / Nao-I • NH3
A Mg FF/ NaoH* NH3
X . Mg F FH / Nao'i NH3'
90
80
I I I 400 500 600
1
700 8)0
10—
300 Temperature (K )
Then -mat Variation of Permeability of MgFe204
116
• Mg RO
I I I I 300 400 500 600 700
Temperature (K ) --1-
FIG. 4.2.3o:-Thermal Variation of Permeability of Mg Fe204.
300
117
120
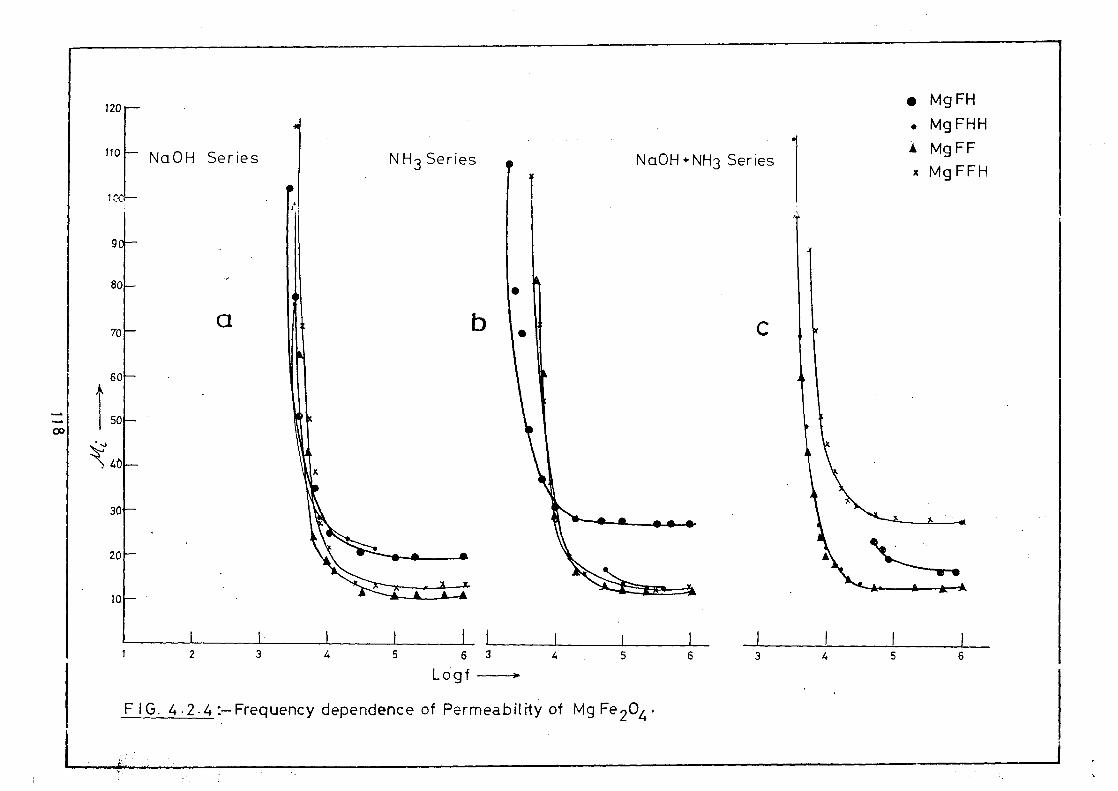
110 NaOH Series NH 3 Series
• Mg FH
• Mg FHH
A Mg FF
x MgFFH
C
5 6 3 4 5 6 4 2 3 4 5 6
Logf
80
70
60
50
40
30
20
FIG. 4.2.4 :—Frequency dependence of Permeability of Mg Fe 2 04
110
10
90
80
70
60
60 Na2CO3 Series
50
40
30
20
10
4 1 1 I i
6 3 4 5 6
Log f -4,-
FIG. 4 .2. 4 :- Frequency dependence of Permeability of Mg Fe 2 04 •
1 0 1.5 2.0 .5 1.0 1.5
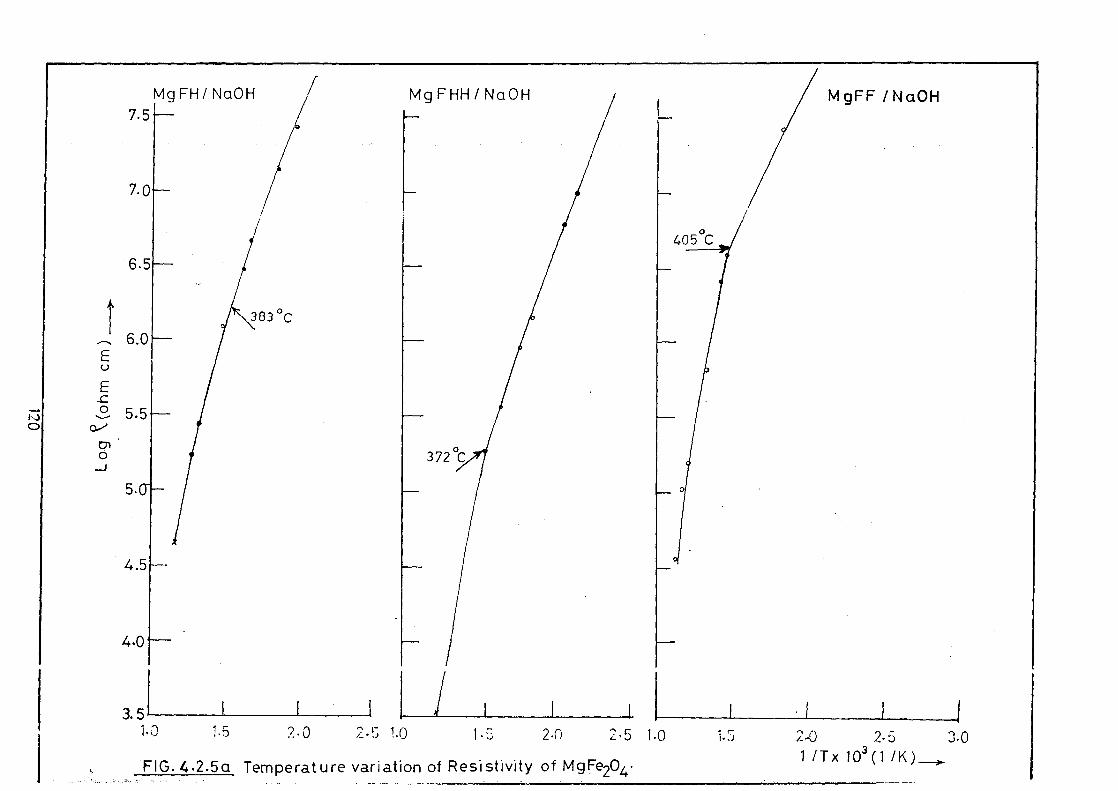
FIG.4.2.5a Temperature variation of Resistivity of M g Fe204 •
2.n 2.5 10 1.5 2-0 2-5 3.0 1 /Tx 103 (1 /K),
1
Mg FH/ NaOH Mg FHH / NaOH 7.5
7.0
3.5
6.5
/ MgFF / NaOH
Mg FH/NH3 Mg FHH /NH3
7.5
7.0
6.5
Lo
g
(ohm
cm
)__3. -
5.0
6.0
5.5
- 4.5
4.0
J • 0
1.0 1.5 2.0 2.5 1.0 / 1.5
362 °C
_L 1 I 1 1.5 2.0 2.5 3.0
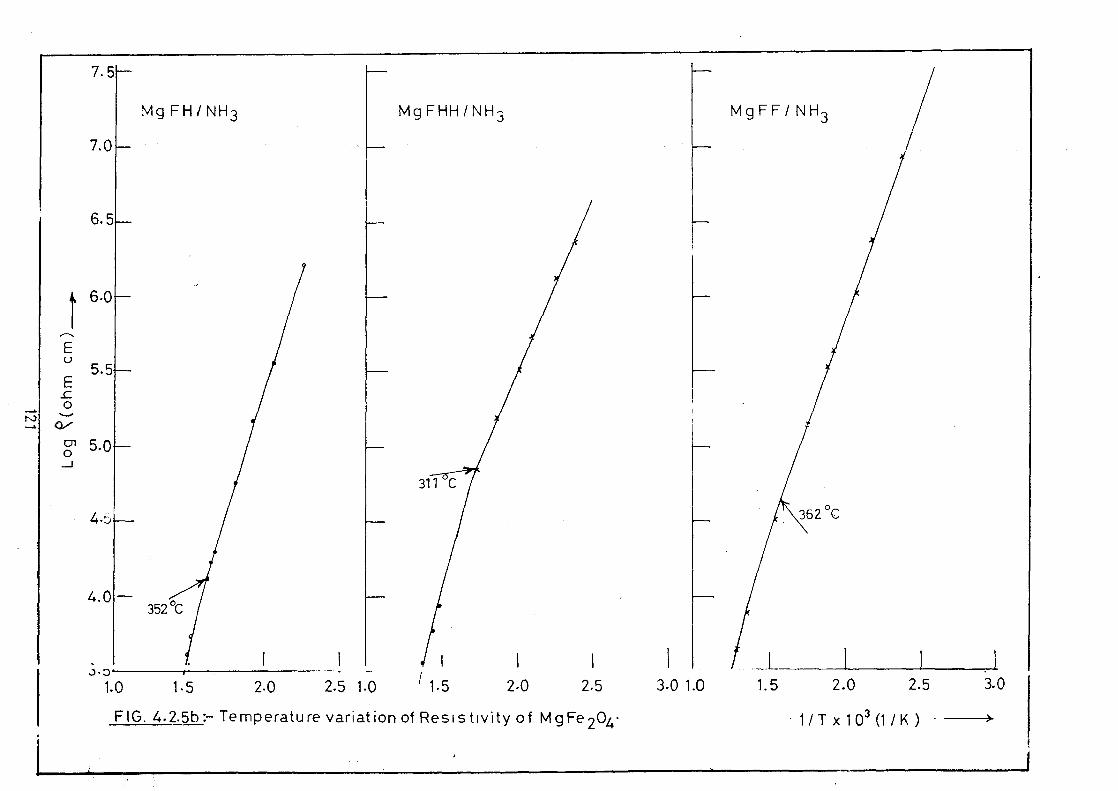
FIG. 4.2.5b:- Temperature variation of Resistivity of MgFe204• • 1/T x103(1/K)
Mg FF/ NH 3

MgFH/NaOH + NH3 MgFHH/Na0H+ NH3 Mg FF/NaOH +NH3 Mg FFH/Na0H+NH3
7.0
6.0
4.5
4.0
5.5
5.
O
333 °C
383 °C
3.5 1 t 1 '
1 0 1-5 2.0 2.5 1.0 1.5 2.0 2.5 1.0 1.5 2.0 2.5 1.0 1.5 2.0 . 2.5
1 /T x 10 3(1 /K)---, .5c :— Ternperature variation of Resistivity of MgFe204•
7.5
7. 0 Mg FFH /Na CO3
1' , 6.5 E E
_c 6.0
cn
5.5
5.0
4.5
4.0
Mg RO
1.0 1.5 2.0 2.5 3.0 10 7 1.5' 2.0 2.5 10 1.5 2.0 2.5 3.0 1 /T x103(1/K)—*
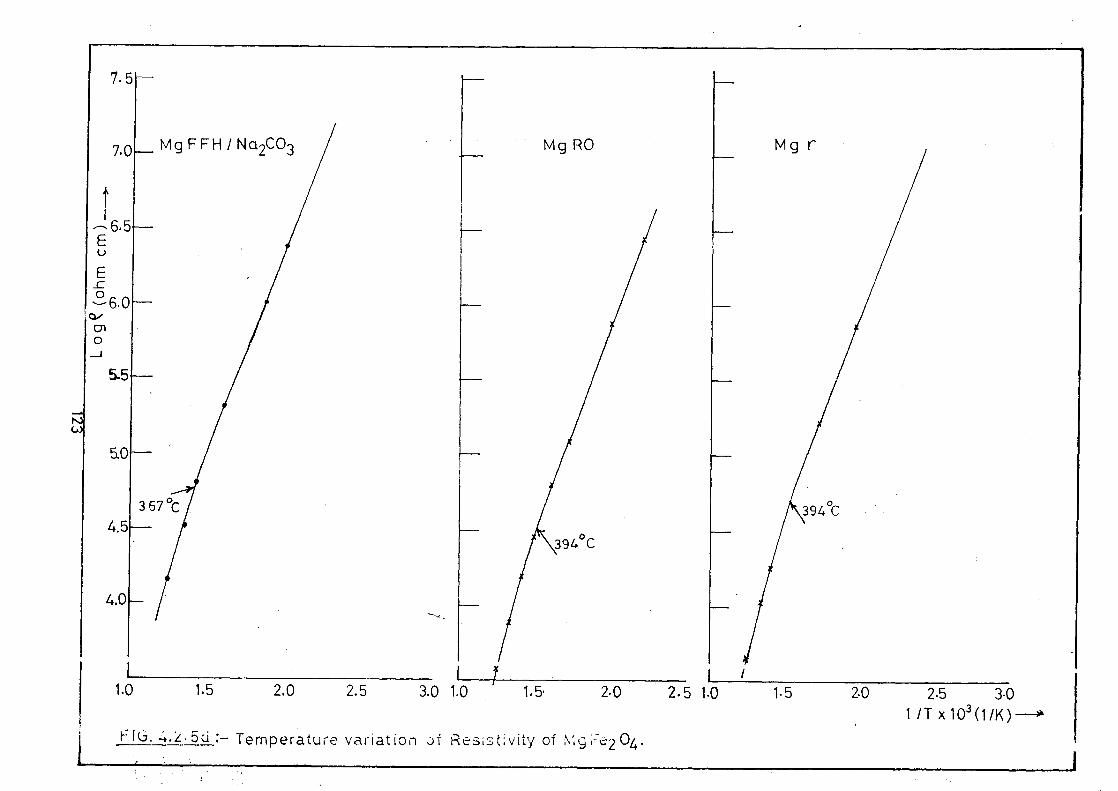
F G• 4•2•5d:— Temperature variation :if Res.stvity of ":2°4-
the ferrite preparation from red oxide, MgRO, shows cusps like behaviour which -nay be
due to the presence of single domains: For e )mparison the ferrite prepareC from
commercial hematite, MgHem (section 4.1.1b), which clearly shows a Hopkinsot effect
is also included in the figure.
x,ac Vs temperature plots are not showing a smooth increase in xac in ( ase of
MgFH/Na01 i, MgFF/NaOH (Fig 4.2.2b).
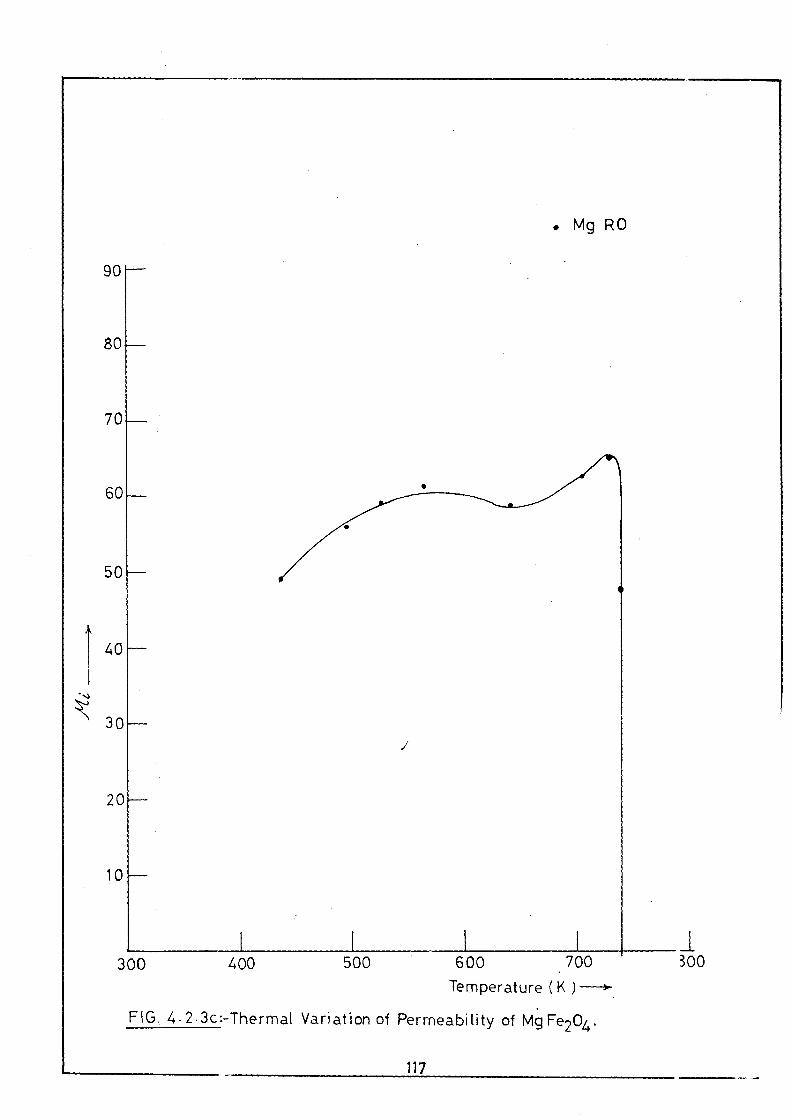
iii. Initial Permeability, IA
The thermal variation of initial permeability, for all MgFe204samples hav ; been
measured and few representative sample plots are presented in Figure 4.2.3a-c. In l eneral
1.4 is found ) increase and near Tc a sharp decrease in the value observed. Fron these
plots the Curie temperature of the samples are spotted and put in the Table 4.2.5.
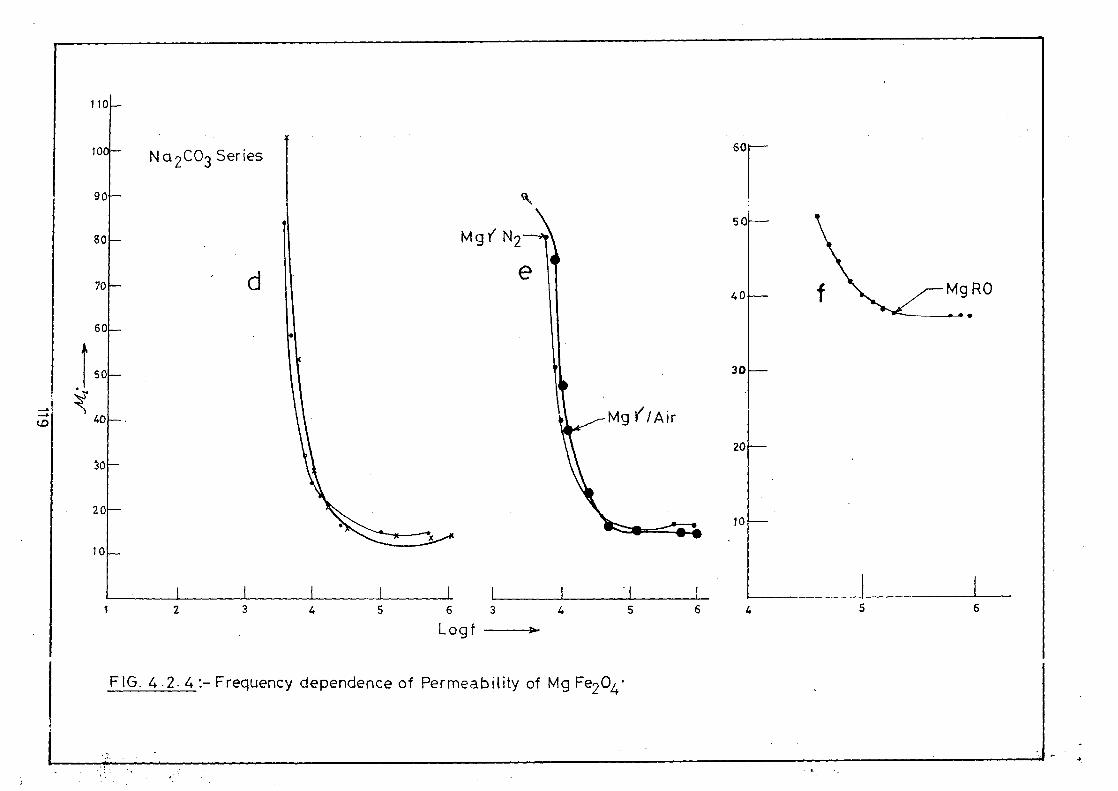
The frequency variation of initial permeability, IA — f, of all MgFe 2O4 mples
upto 1 MHz -,re plotted and shown in Figure 4.2.4 a-f.
There is }Ai decrease in all samples upto 50 — 100 kHz and then the permeab lily is
observed to be frequency independent.
iv. Direct Current Resistivity
D.C. resistivity measurements done on all MgFe204 samples as a funct on of
temperature are shown as log p Vs 1/T x 10 3 plots in Figure 4.2.5 a-d. A linear p ots of
the resistivity show break in plot showing two different inclinations of different 5. topes.
At the break in the plot a temperature indicates [63, 130] a change in ferrimagneti state
to paramapetic state. s This temperature is taken as a Curie temperature, Tc. these
values of TC., are placed in Table 4.2.5.
124
multidomai.0 ;MD) or super paramagnetic (SP). Temperature at which a decrease in x a,
is observed is followed to obtain Curie temperature, Tc. The Curie temperatures )f few
samples are placed in Table 4.2.5.
Table 4.2.5 Comparative values of Curie temperatures for magnesium ferrites by
different methods
Sr. Nos.
Mg-Ferrite Sample
Curie Temperatures ( °C) From Magnetic
susceptibility Initial
permeability_ 467
Resist vity
1 Mg.RO 384 39 I
2 Mg- y (N2) 396 ---- 391
3 Mg.A-1 / NaOH 370 390 38 ;
4 Mg.FHH / NaOH 367 417 37 !
5 Mg.FF / NaOH 374 410 40 ;
6 IVIg.FFH / NaOH 380 404 37 !
7 Mg. 171-1 / NH3 ---- ---- 35 !
8 Mg.F1-111 / NH3 ---- ---- 31 .
9 Mg.FF I NH3 ---- ---- 36',
10 IvIg.FH I NaOH+NH3 327 ---- 33 i
11 Mg.FITH / Na0H+NH3 357 384 37'.
12 Mg.FF / NaOH+NH3 317 417 38 ;
13 Mg.FFH / NaOH+NH3 327 364 35 !
14 Mg.FFH / Na 2CO3 ---- ---- 391
xac1 „Ter Vs temperature plots in general show increase in x a, just before dc crease
to almost zero, indicating Curie temperature. This nature of plot is indicative of single
domain type particles in the ferrite. An increase in x a, just before Curie temp( rature
indicates Hopkinson effect. The temperature independent x a, upto just before Curie
temperature is found in the ferrite preparation from Std. y-Fe 203, Mgy (Fig. 4.2.2c, while
125
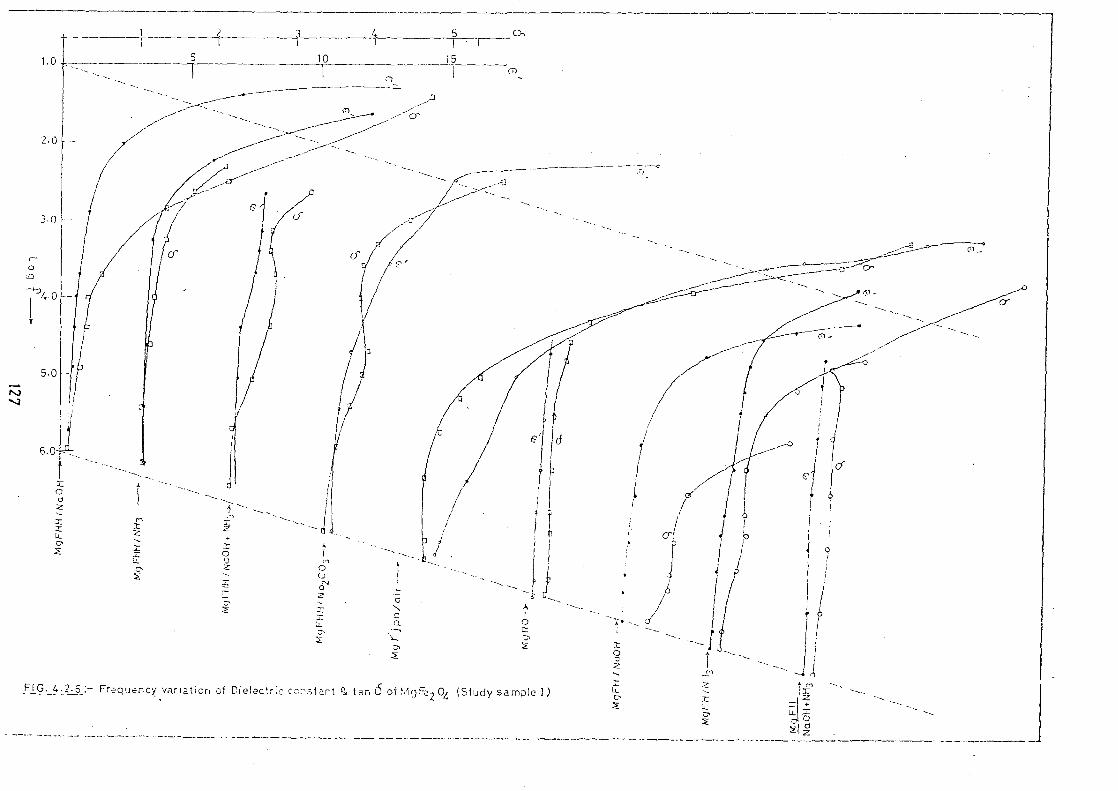
v. Dielectric Constant and Dielectric Loss Tangent
Frequency variation of dielectric constant, s and the dielectric loss tangent tan 8,
at room temperature was carried out from 100 Ez to 1 MHz on all MgFe 204 sample s from
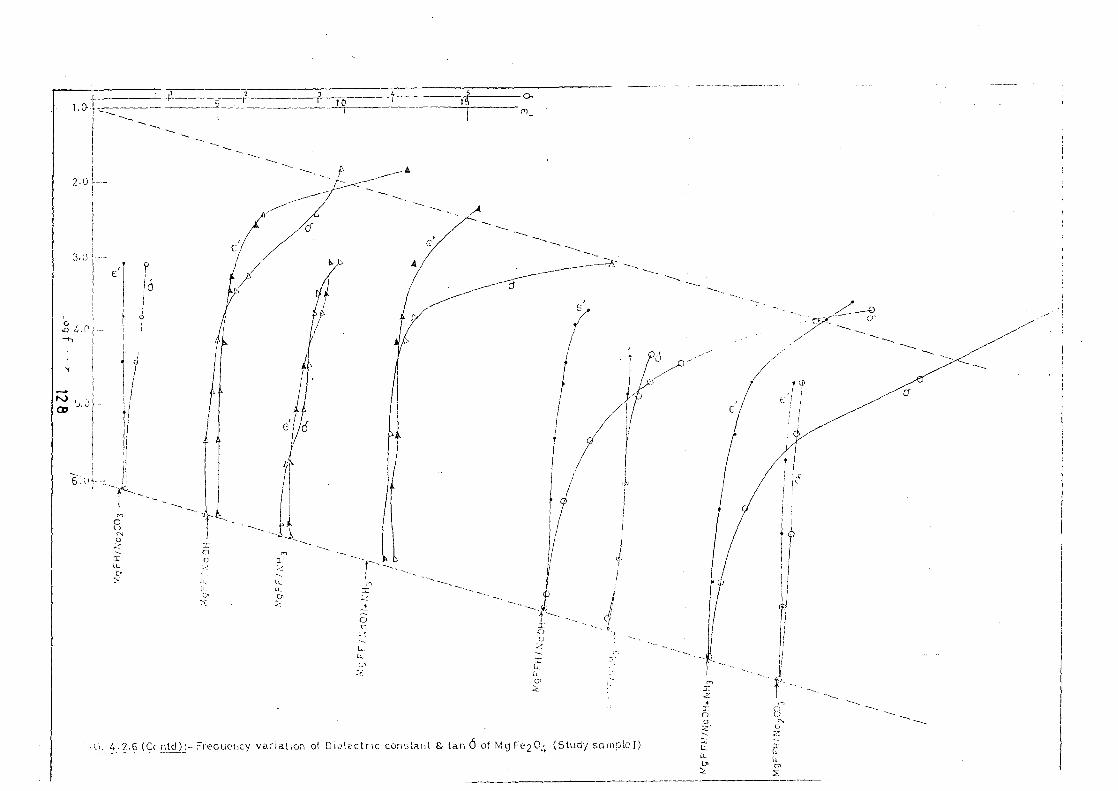
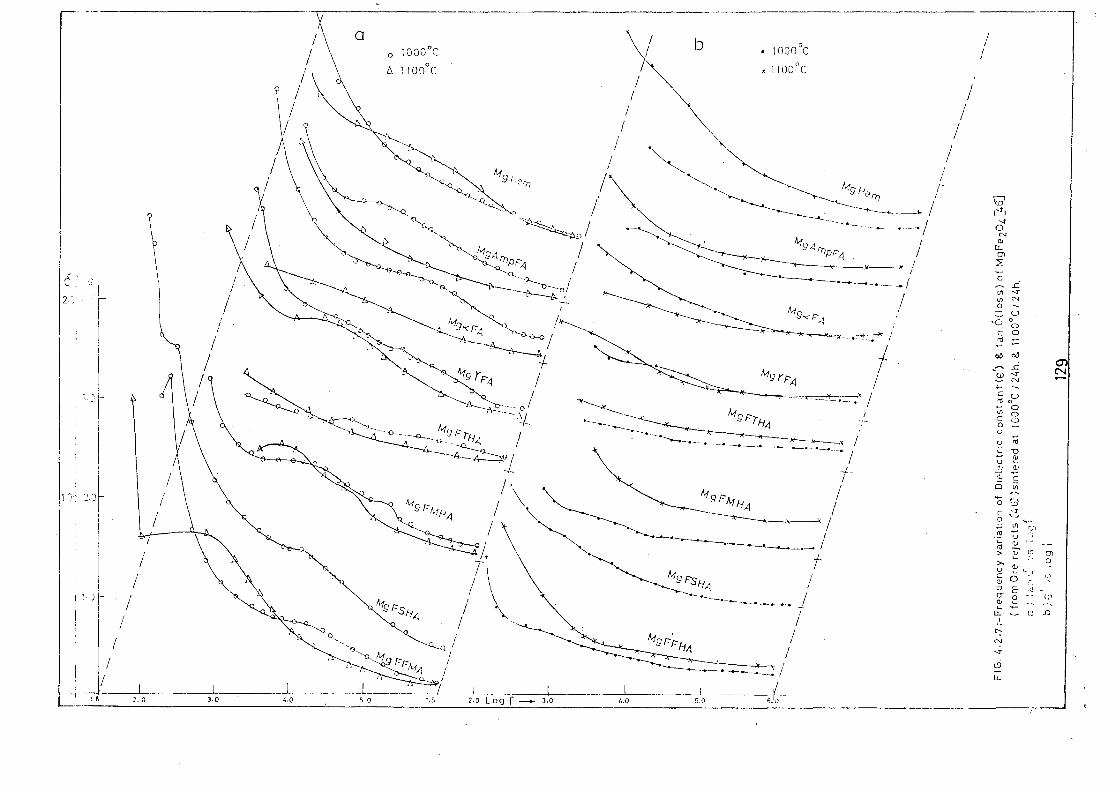
study sample I of ore rejects and presented in Fig. 4.2.6. It can be seen that the v due of
dielectric c, -,-(stant decreases continuously with the increasing frequency upto 50 — 100
kHz, beyond that there is almost frequency independent behaviour is observe I upto
1 11411z, in ?;1 samples. The plots of dielectric loss tangent (tan 8) against freque: tcy, in
general, inc;:cate a decrease in the value with the increase in frequency. Howe Per, in
some samplcs a decrease in tan 8 —1 kHz is followed by slight increase and plots c f such
samples show a broad hump peaking — 10'— 20 kHz.
The ivigFe204 sample that had been synthesized from a representative in n ore
reject [46] on which we conducted microstructural studies as described in 4.1.2. The
same samples were then used to investigate dielectric constant and tan 8 behavior: r as a
function of :requency. The results are presented in Fig. 4.2.7. These samples were
sintered in air — 1000 °C / 24h. However, our objective was to explore all the pc 3sible
reasons to achieve a ferrite of good quality, therefore, these samples were further sii .tered
at 1100°C ar , ', theirs and tan 8 variations as a function of frequency are presented h :re in
Fig.4.2.7. F6,- better comparison of the influence of heat treatment / sintering, the r :sults
of c' and tan 8 on samples sintered at 1000 and 1100 °C are given in the figure.
d) Microstructure (SEM) studies
In part I the microstructural studies on MgFe 204 samples, synthesize( and
characterized in our labOratory [46] from iron ore rejects of one representative iro] t ore
reject, were Giscussed. In the present Part II the microstructures of the ferrite sar tples
126
5 0, 3
15 10
A
(41
z U-
A
0
(r)
CV 0
a
cn
FIG. 4.2.6:- Frequency variation of Dielectric constant g, tan 6 of MgFe 2 04 (Study sample I)
A
..-
z
Mq
HIH
/ N
o O
H
0
1
Cr)
3
to 1 .0
2.0
3.0
o' -
0 4-7 ■-■ (•-■
T_
0
6. 4.2.6 (Cc ntd):--Frequency variation of Dielectric constant & tan (5 of Mg Fe204 (Study sarrip1o1) Lt.
U
El
IL
1'6 0
o U
I
IL C
I I_
IL 11
e'
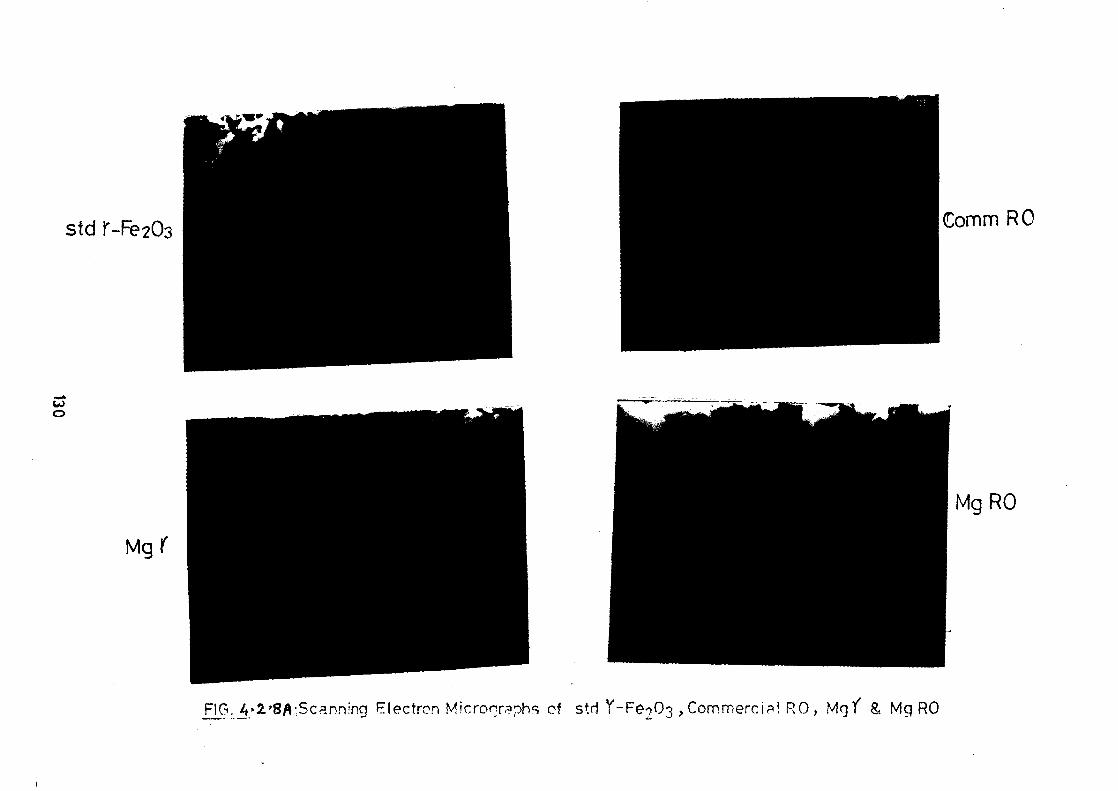
std r-Fe203 Comm RO
Mgt'
Mg RO
FIG. 4.2.'8A.Scanning Electron Microgr aphs of stri Y-Fe 03 ,CommerciP! R 0 , Mg)' R. Mg RO
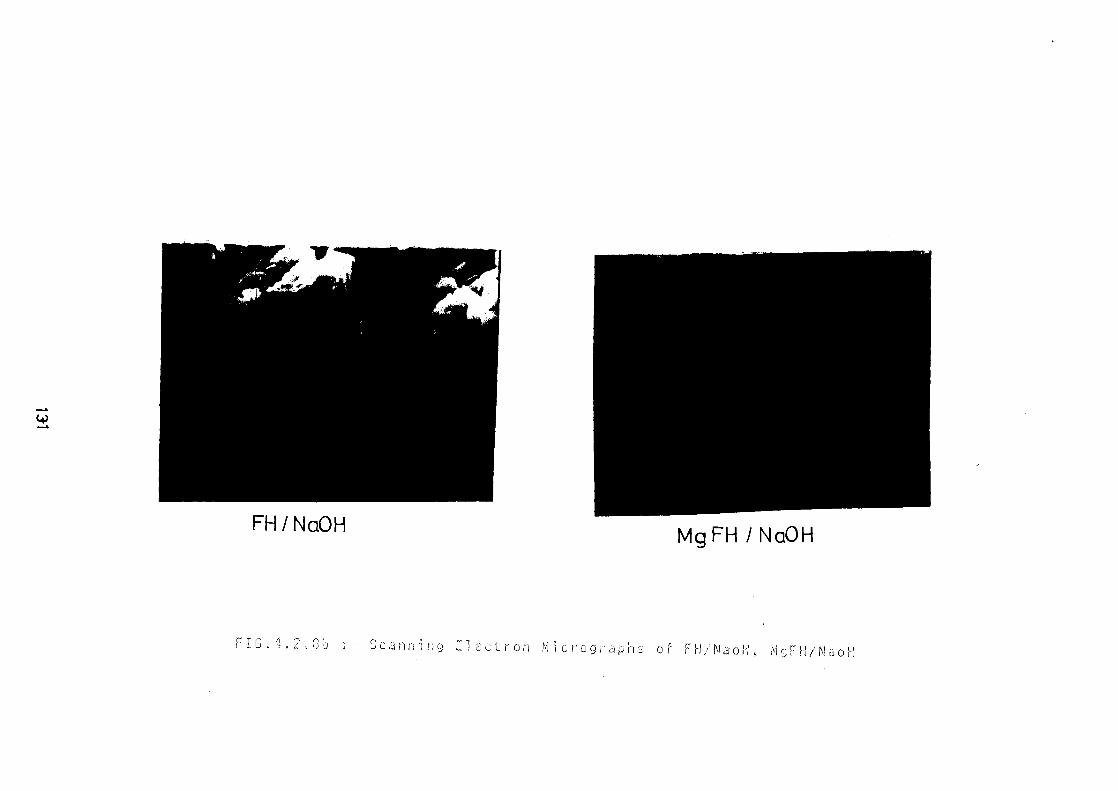
FH / NaOH Mg FH / NaOH
FIG.1.2,0b 1•.. S c a nil ' .1 n g Elect r• o ri Micrograp }-) :ri,.,... o .1 F ll ,/ N a o VI , Pri r; F 11 / N. o I-1
FHH/_NaOH Mg FHH / NaOH
Mg FHH/ Na2CO3
FIG 4.2 , 8 ,CScanning Electron Micrographs of FHH/Nooff, Mg FHFI / NacH & Mg FI-1/4 / Na2 CO3
Mg RO
/If M
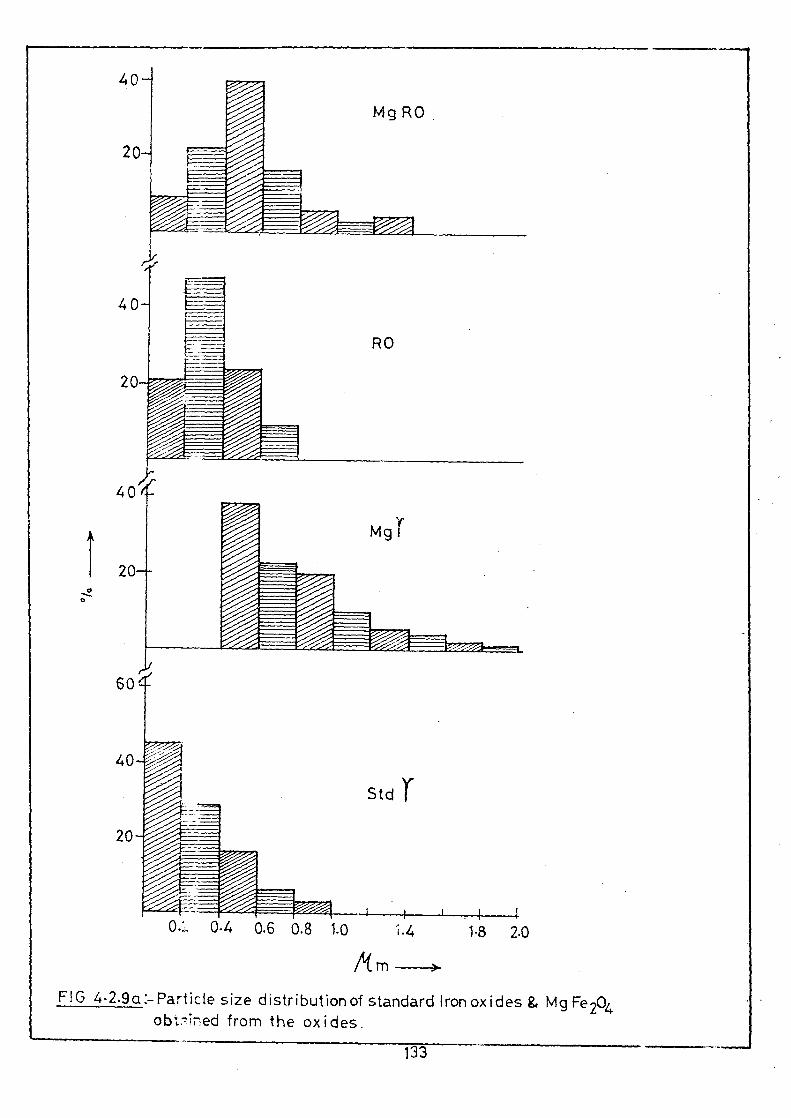
FIG 4.2.9a:-ParticIe size distribution of standard Iron oxides & Mg Fe204 obt,Tned from the oxides.
133
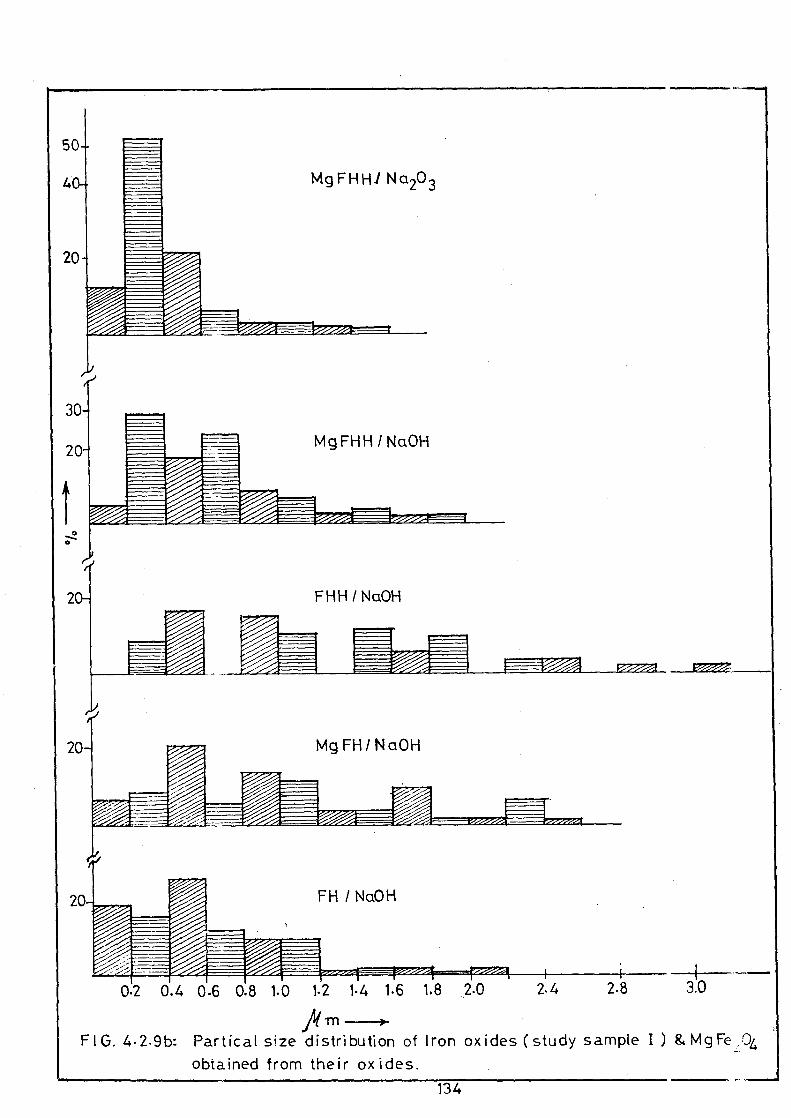
134
02 0.4 0.6 08 1.0 1.2 1.4 1.6 1.8 2.0 2.4
m FIG. 4.2.9b: Partical size distribution of Iron oxides (study sample I) & Mg Fe : 04
obtained from their oxides.
from study sample I of iron ore rejects have been characterized and their result ; have
been presented in this section.
The SEM micrographs of few representative crrite samples have been gl yen in
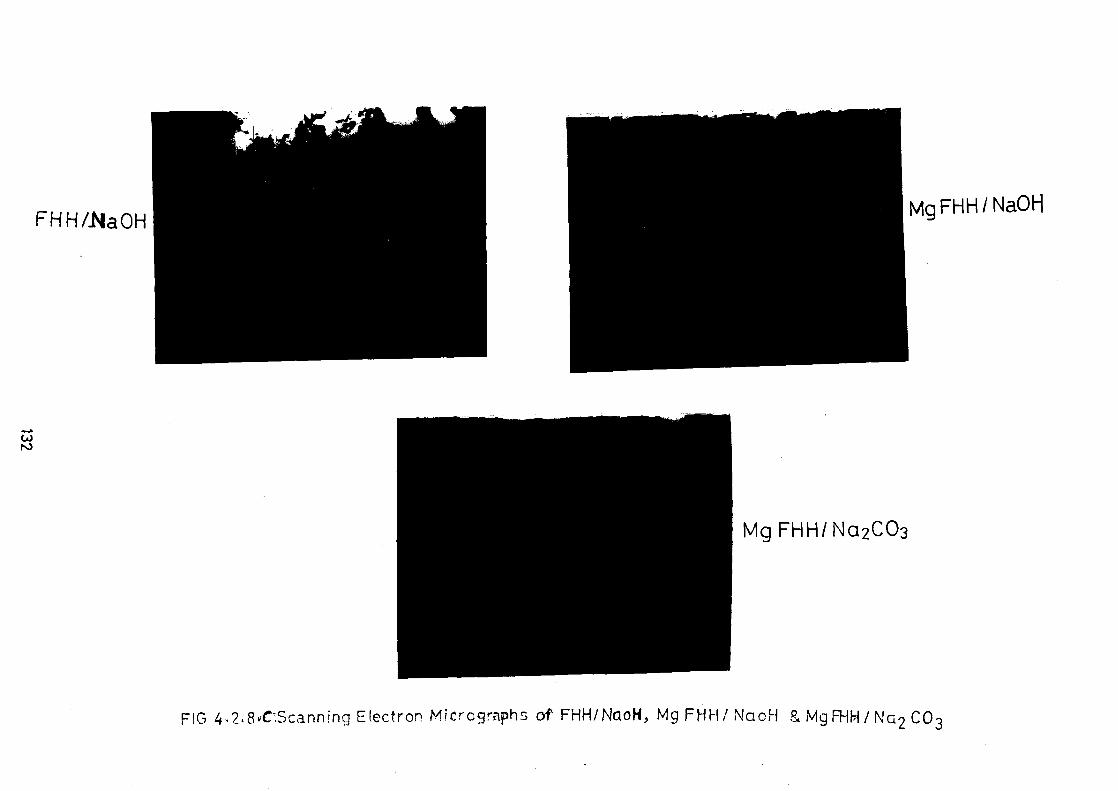
figure 4.2.8 a-c.
The micrographs of the iron oxides used for the preparation of these ferri es are
also presented in the figures. The particle size distributions have been plot:ed as
percentage of the particles verses size of the particles in }AM and the bar chart c f such
measurements are shown in Fig. 4.2.9 a-b.
The standard y-Fe 203 shows spindle shape particles of sizes, 0.0 —.0.2 pm (15 %),
0.2 — 0.4 pm (28 %), 0.4 — 0.6 pm (17 %) and the rest between 0.6 and 1 pm. Th is, the
particles are, in general, of very small sizes. The MgFe 204 prepared from this oxide,
Mg y-, give dumb-bell shape grains of sizes more than 0.4 pm. It is clearly seen tat the
0.00 — 0.4 pin spindle shape particles of Std. y-Fe 203 have grown into dumb-be 1 type
particles of the ferrite of > 0.4 ptin particles. The Mgy- indicates a size distributiol upto
2 1..1111
The commercial red oxide (cc-Fe 2O3 ), RO, has 48 (%) 0.2 — 0.4 pm pi rticles
which look rod like. There are about 20 (%) 0.00 — 0.20 and 24 (%) 0.4 to 0.6 p n size
particles and the rest > 0.6 f.1211. The ferrite prepared from this oxide, MgRO, ho vever,
shows a wide variations in the particles upto 1.4 pun. The particles of 0.0 to 0.4 Am of
RO have grown to the sizes upto L4 pm in MgRO.
The ',-on oxide (mainly cc-Fe2O 3) obtained from the ore reject, 11-1/Na0: I, has
distribution of particles upto 2.2 pm. But, mainly, the majority particles are < 1 2 pm.
The ferrite, MgFH!NaOH, obtained from this oxide shows a wide variation in p; rticles
upto 2.6 p.m
135
On the other hand, the iron oxide (mainly y-Fe 203) that obtained from t ie ore
rejects by ilArazin.e method, FHH/NaOH indicates very wide distributions in j article
sizes, upto 4 pm. It looks quite uneven distribution of particles. However, the ferrite
MgFITH/NaCE that obtained from this oxide show particles of good distribution below
1.2 pm. The ferrite MgFHH/Na 2CO3 obtained from . y-Fe 203 that obtained from
FITII/Na2CO3 gives rather particles of even distribution below 0.8 pm; the n Ajority
particles are in the range of 0.2 — 0.4 j_tm (52 %). From these results it can be iv ferred
that y-Fe 203 samples show better reactivity with MgO leading to uniform particles in the
ferrite. Whereas, the of.-Fe 203 samples give the ferrite of uneven distribution. It is
important to make note that the ferrite MgFITH/Na 2CO3 has better particle distr bution
than MgFrf-1/Na0H. Although both the ferrite samples are prepared from y Fe 203
obtained from hydrazine method, the 7-Fe203, FIIHINa2CO3, has lower impuri ies as
compared t.T. the oxide FHEI/Na0H.
4.2.5 Discussion
a) Phase Identification
The phase identification by xrd reveals that all samples synthesized in the I resent
investigations are MgFe 204. Only samples MgFHH/NH 3, MgFF/NH3, MgFFE/NH3,
MgFHH/Na0H-+NH3, MgFfili/Na2CO3, tvIgFF/Na 2CO3 (Table 4.2.1) indica . e the
presence of minor quantities of x-Fe 203 iii them.
The lattice parameter, a, ranging from 0.8343 to 0.8407 run observed (Table 4.2.3)
in these samples indicate that most of the samples show the parameter pertaining o low
temperature phase of MgFe 204 (a = 0.8375). the high temperature form of the fe rite is
reported to be having a = 0.8397 and here it is observed that Ivlgy- sintered in air ; nd N2
give, respectively, the parameter 0.8388 and 0.8391. Also, the high temperature f gm is
136
observed in MgF1-11-1/NaOH sintered in air, while that sintered in N2 gave a = ( .8380.
Both MgFi ;/NaOH (air) and MgFFH/NaOH (N 2) give the parameter pertaining to the
high temperature form.
From these results it is difficult to give any reason for such behaviour in the lattice
parameter, ;''though all are being synthesized —1000 °C / 24h and furnace cooled. In the
literature both these forms are observed in MgFe 2O4 depending on the prep tration
conditions. Those prepared from MgO + a-Fe 2O3 at 71320°C and quenching [9! , 129]
yield a higi temperature form, while the annealed samples show a low temperatur form
of the ferrite. The thermal decomposition of mixed metal oxalato-hydra
MgFe2(C 204)3 .5N2H4 —120°C leads [130] to a high temperature form. The hydi Dxides
obtained bc' coprecipitation of nitrates of Mg and Fe from NH IC1 + NH4OH at pH
9.5 - 10 dt,c1mpose — 950°C giving MgFe2O4 of high temperature form [131] The
variations in lattice parameter of the low temperature form is observed for M1 Fe204
prepared b'' methods [104] like chemical (0.8323 nm), ceramic (0.8367 nn ) and
annealing (0.8354 run).
Lattice parameter, thus, seems to depend on the method of preparation. The
lattice parameter of 0.8375 nm, the low temperature form of MgFe 2O4 is found [991 to be
increased to 0.840 tun when it was quenched from 1302 °C. At high temperatut es the
migration of Mg2+ ions from the octahedral sites (B) to the tetrahedral sites (A) in the
otherwise inverse spinet, MgFe 2O4, (Fe3+)8 [Mg2+8Fe3+8]032 causes an increase in the
average radius of the A (tetrahedral) sites.
Bond lengths between A sites cation and oxygen ion (R A-0) and B site cati tn and
oxygen (RB-0) and radii of A site cation (r A) and B site cation (T B) measured For all
MgFe2O4 samples are given in Table 4.2.3.
137
In general, RB—O, 0.20369 — 0.20525 tun and RA—O, 0.1852 — 0.19054 i m are
observed which are close to the reported values [100]. A careful observation of th table
indicates that site radii of cation in the tetrahedral ( A) site for the high temperatur form
is higher than that of the low temperature form. The MgFFH/Na2CO3, for ex ample,
shows lattice parameter 0.8370 nm (low temperature form) and r A = 0.054S 1 tun,
whereas, the high temperature form, MgFH/NaOH gives a = 0.8398 and r A = 0.055 nm.
The migration of Mg2+ ion (radius 0.078 nm) from octahedral site to the
tetrahedral (A site) by substituting Fe 3+ ion (radius 0.067 nm) can cause an increase in the
radii of the A site (rA). Since the high temperature form has higher r A than t le low
temperature form of MgFe204, the migration of the Mg 2+ions may be causing the it crease
in the lattice parameter. A cation distribution of Mgo.12Fe0.88[Mgo. 88Fe 1 . 12104 for ar nealed
sample (low temperature form) [99] and Mg0.225Fe0.745[Mgo.745Fe1.zsd04 for qu :nched
sample (high temperature form) have been suggested. From neutron diffraction studies
[146] a degree of inversion 0.88 ± 0.01 and 4.1' parameter of 0.381 ± 0.001 ha`, been
observed. These studies suggest that the migration of Mg 2+ ions to A sites and the higher
percentage of Mg2+ ion in the high temperature form of MgFe 2O4 hence causes the higher
lattice parameter.
Our all samples were prepared —1000 °C and furnace cooled and henc., they
should have shown low temperature form of the ferrite. Both the low temperate re and
high temperature forms of MgFe2O 4 that observed in our samples, prepared from d fferent
iron oxide precursors and are sintered in air and N2. Hence, any conclusion can not be
arrived at. May be detailed cation distribution studies required to be done.
Further, the migration of Mg2+ may also be influenced by the other it 'purity
cations that present in the iron oxide obtained from ore rejects. There are major
impurities like (Table 2.3a) Si, Al and Mn in our precursor iron oxides whit may
138
compete for the sites in the spinel MgFe 2O4 . A competition in site occupancy of S 4+ (on
tetrahedral Htes), Al 3+ (on B sites) and Mn2+/Mn3+ (on tetrahedral sites) may, fence,
contribute to the Mg2+ ion distribution over A and B sites.
b) Magnetic and Electric Characterization
All MgFe 2O4 samples show (Table 4.2.4) as, 47tMs and n i; in the range 1 - 30
emulg, 635 1185 G and 0.67 - 1.06 Bohr magnetone, respectively. Ferrites, MFe 0 4, in
which divalent ions M2+ like Mn2+, Fe2+, Co2+ and Ni2+ that present on the octahedral
sites, Fe3+A[M2 FeIB04, are called inverted spinels and they all are ferrimagneti ; with
saturation magnetic moments appropriate to the divalent ions alone. According to the
Neel theory [133] there exists a strong negative exchange coupling between the atc ms on
A sites and -le atoms on the B sites. This results in a spin alignment in which the A site
moments are all antiparallel to the B site moments. In the inverted ferrites th iron
moments A sites just cancel those on B sites, leaving the crystal with a net rr ament
equal to that` of the divalent ion.
The case of magnesium ferrite, MgFe 2O4, is some what exceptional. Its sti acture
was originally reported [134] to be inverted, Fe 3+A[Mg2+Fe31 ]B04. On the basis o' Neel
theory it woAd then be expected to have zero magnetic moment. However, it is net what
is observed experimentally. The saturation is found to vary within 1 - 2.4 Bohr
magnetone depending on the condition of preparation. This discrepancy has been
explained c• , the assumption that magnesium ferrite is incompletely inverted, the n amber
of iron atoms on the B sites thus exceeding the number on A sites. But, this inversi(m is
10 - 15 (9'0 and hence the ferrite shows low saturation magnetization values, in g :neral.
Hence, a wide variation in as, 47tMs and nB observed (Table 4.2.4) indicates di ferent
percentage of inversion in our samples of MgFe 2O4 .
139
Not - Illy this degree of inversion which causes large variations in the m: gnetic
characteristics in our samples but also the impurities present in the precursor iron )rides
may too be responsible.
The qandard 7-Fe 2O3 contains no measurable impurities in it and the ferrite
prepared from this in air (Mg 7-air), however, shows, nB = . 0.81, while that synthes - zed in
inert atmosphere (Mg 7-N2) gives the value of 0.67 Bohr magnetone (Table 4 2.4). Both
these samplf-s indicate lattice parameters (a = 0.8388 ±0.0003) close to the high
temperature form. The ferrite obtained from iron ore rejects, MgFF/Na0H, in air, shows
the maximum nB = 1.06. This too has the lattice parameter similar to Mgy-/ai • (a =
0.8388), bu. then MgFF/NaOH has major impurities: Al, Si, Mn. Thus, it is diffi lilt to
give any conclusive reasons for such variations in the magnetic values in the I resent
investigations.
Bull: magnetic behaviour can generally be understood starting from the e amain
structure. The temperature variation of the a. c. magnetic susceptibility and hys -eresis
provide usefi)1 data on the domain structure. The thermal variation of x ac for Mf Fe204
prepared fri;i1 standard 7-Fe 2O3, Mgy- (Fig. 4.2.2c) shows a temperature independent
behaviour ard then it falls to zero — 396 °C. This is the Curie temperature, Tc. The
temperature dependence of x ac is observed, however, in the ferrite prepared from
commercial red oxide, MgRO, the increase in 'Lc upto Tc is followed by sharp deer( ase at
Tc = 384°C. A multidomain (MD) type behaviour is observed in Mgy, while single
domain (SD) behaviour observed in MgRO. For comparison the ferrite prepare( from
commercial :tematite, MgHem (as described in 4.1)is also given in the same figu e and
this shows a temperature independent 'Lc followed by a sharp peak before falling I) zero
140
at — 457°C. This is a typical single domain behaviour with a Hopkinson effect [135].
The behavior of MgRO, is not typical for single domain.
Ferrites when prepared by a ceramic method, mixed domain states tend to be
formed resulting in the bulk magnetic properties appropriate to a mixture of SD, IV D and
super paran:1:gletism (SP). In few ferrites I\ or SD behaviour is determined pri marily
by the composition and the structure [135]. Such mixed domain type of behaN lour in xac
- temperature curves are observed in most of our samples [Fig. 4.2.2 a&b). The sharp
decrease in 7,ac at Tc is indicative of single phase ferrite. A tailing of x ac near Tc is also
observed in few samples. The Tc between 317 — 396 °C found in our samples are falling
in the range normally observed in MgFe 2O4 from 320 — 440°C [107].
The domain behaviour and also the saturation magnetization values are i'sually
determined by the composition and structure of ferrites. Hence, they can be contro led by
fixing the stoichiometry of the desired ferrite. But the technological importance of the
ferrites privarily lies in their high resistivity. All ferrites prepared here shot i high
resistivities at RT of — 107 S2 cm [Fig. 4.2.5] and ferrites in the range of 1 to 10 12 Q cm
are being used depending on the applications. Resistivities of ferrites decrease to ith the
temperatures and the log p Vs VT plots in our samples show a break in the line ar plot
indicating the switch over from ferrimagnetic to paramagnetic region. Curie temperatures
measured from these breaks are given in Table 4.2.5. Tc between 311 and 405 °C found
in the ferrite samples match well with the reported values [107].
Although high resistivity ferrites are preferred in device application as the
important eddy current, losses can be minimised and hence joule losses, the knowlc - dge of
the losses d . e to other mechanism are also equally important to establish the efficit ncy of
these materials having desired properties. Initial permeability is one such property which
is being studied. The initial permeability, called simply [136] the peimeabili y of a
141
material is defined as the derivative of the induction B with respect to the internal field H
in the demagnetized state
dB H > 0, B ---> 0
dH
In the case of polycrystalline materials containing a large number of randomly oriented
crystallites the permeability will be a scalar, at least at low frequencies.
Permeability measured as a function of temperature and frequencies of few
representative samples are shown in figures 4.2.3 and 4.2.4. IA , in general, shows low
frequency dispersion upto 10-20 kHz and then there is frequency invariant behaviour of
permeability in all ferrites studied. The ferrite Mgy prepared from standard y-Fe 203 , both
in air and nitrogen shows almost similar behaviour. The ferrite from red oxide, MgRO,
also indicates the low frequency dispersion but upto 100 kHz. The low frequency
dispersion in ferrites have been attributed to [137] the domain wall displacements. Pores
hinder domain wall motion and also give rise to a local demagnetization field. The
hindrance to the domain wall motion results in low values of
The porosities observed in most of our samples (Table 4.2.2) lie in the range
25-30 (%) with kw exception showing 15 and 36 (%). IA; value of — 100 that observed at
100 Hz for all samples decrease upto 100 kHz, while the ferrite prepared from red oxide, -
MgRO, hoWever, starts showing ui = 50 at 40 kHz which then decreases upto 100 kHz
and then it remains frequency invariant.
The thermal variation of permeability of all samples of MgFe204 (Fig. 4.2.3)
indicates an increase in ui with temperature upto Curie temperature and then it falls
sharply at Tc. Curie temperatures measured from these show 364 417 °C which arc in
the range of 320 440 °C as reported [107]. The t.ti variation with temperature of the
ferrite prepared from red oxide, NIgRO shows one broad hump (Fig. 4.2.3c) in the value
142
before reaching a peak at Tc and then sharply decreases at Tc = 467 °C. A very higl Tc is
observed.
The susceptibility behaviour of MgRO temperature (x a, Vs tempe ature)
shows (Fig. 4.2.2c) mixed domain type behaviour. Since all other samples
peak in the thermal variation of }.k , and indicate sharp decrease in the value at Tc, a single
phase ferrite may be present in these samples. The /v1gRO, therefore, may be mull phase
one, but the :a.d rules out this.
The initial permeability is reported [138, 139] to be dependent on the met Lod of
preparation, porosity within the material and grain size.
The frequency variation of dielectric constant, c', and tan 8 (loss) for all Mt Fe2O4
samples are given in Fig. 4.2.6.
The and tan 8 values fall upto 10 kHz in all samples and after that they rer Lain
frequency invariant. The dispersion of these is found to be maximum in MgFHH/I1a0H,
IvIgFHI-1/N1 -;, IVIgy-air and MgFH/Na0H, MgFFH/NaOH + NH3 .
In case of MgFHH/Na2CO3 there is a maximum dispersion in c', but the tan 8
decrease is c.11owed by a small increase which then filially decreases. A hump — 8 kHz
thus indicates that there occurs some increased loss. Such increased loss is indicate I by a
hump 7 kHz in IVIgFHET/NaOH and — 12 kHZ in MeFl- /NH 3 .
Almost invariance in c' and tan is observed from 100 Hz to 1 MI Ez for
MgFFH/Na2CO3 and in MgFH/Na2CO3 from 1 kHz to 1 MHz.
Polycrystalline ferrites are very good dielectric materials. This is because [140],
in the process of preparation of ferrites when the powders are sintered under s ightly
reducing co-Llitions, the divalent iron ions formed in the body leads to high condu
grains. Whca such materials are cooled in an oxygen atmosphere, it is possible fi . form
layers of vv.— low conductivity over their constituents grains. Almost all the fen ites in
143
the polycrystalline form have such high conductivity grains separately b: - low
conductivity layers so that they behave as inhomogeneous dielectric materials. A ; such
the dielectric properties of ferrites are dependent on several factors including the n ethod
of preparation, sintering temperature, sintering atmosphere, chemical comp() ;Won,
microstructure etc. As a consequence of the inhomogeneous dielectric bell; viour,
dielectric constants as high as 10 6 are found in the case of ferrites at low fregth ncies.
Fcrrites having very high dielectric constants are useful in designing good micr wave
devices such as isolators, circulators etc.
In oar samples the dielectric constant values at low frequencies at room
temperatures lie between 10 — 22 and decrease to 1— 2 beyond 10 kHz.
Room temperature dielectric constant of CdFe 2O4 at 5 kHz found to be 52.01
[140]. On adding lithium to the ferrite, Li o I C(10.8Fe2.104, the g' value decreases to 29.49
and further decrease is found in Li0.3Cd0.4Fe2.304 which indicated the value of 39.9! . The
CdFe2O4 1r ,1 RT conductivity (a), 1.10 x 10 -5 Q-i cni l and this is attributed eo the
presence of Fe 2+about 1.586 (%) on the octahedral sites which play a dominant role in the
process of ::,onduction due to hopping of electrons between Fe 2+ > Fe3+. Th Fe2+
concentration decreases with the substitution of Cd2 by Li 1+ ions and a 0.684 (%) f Fe 2+
is found in .3Cd0.4Fe2.304 and hence low conductivity of 4.37 x 10⁻⁶ Q-lcm-1 The
dielectric constant of CdFe 2O4 decreases with the addition of lithium in it, hence, su ggests
that there is a strong correlation between the conduction mechanism and the die lectric
behaviour of ferrites. Higher ferrous ions which exchange with Fe 3+ ions thus give :ise to
maximum dielectric polarization. A correlation between conduction and die [ectric
processes h ; been done on several ferrites [141 — 146].
The MgFe2O4 samples in the present investigations have all high resistivit (low
conductivity'; of — 10 7 Qcm (Fig. 4.2.5) and hence they all may have negligible c r very
144
low concentration of Fe 2+ (chemically not measurable). The low dielectric c( nstant
observed here may be due to this. The frequency dependence of F;' in all these are ; imilar
to the ferrites mentioned above; there is continuous fall in c' with frequency.
The frequency dependence of loss tangent (tan 5) in all MgFe 204 slit )w, in
general, decrease. But in few samples there occurs a slight increase in the loss — ; 1 12
kHz. Lithium substituted CdFe 204 samples too [140] show such a maximum — 1 , ) — 20
kHz, specially a maximum loss in CdFe 204 and least in Li03Cd0, 4Fe2 . 304 and this an be
correlated with their electrical conductivity behaviours. The least loss observed in the
sample which has low concentration of Fe 2+ ions. The tan 5 maximum around a
particular frequency is considered to be due to the equalisation of the externally z , pplied
field with the hopping frequencies in the samples. And, this may be the reason wl y few
samples in the MgFe204 show, in our case, a maximum — 8 — 12 kHz. Although, ve are
unable to detect Fe 2+presence in these samples, the infra red data analysis on our s; mples
reveal some presence of Fe 2+ in few of them as shown in Fig. 4.2.1, especially a slight
split in the band — 600 cnf l .
c) Frequeney dependence of c', and tan 6 of MgFe204 (ore reject [46])
The samples of MgFe 204 that prepared from a representative iron ore rej , :cts as
described [46], in our laboratories on which we have presented microstructural asp acts in
4.1 are beirl studied by us and their results are presented here. As it was observe ,d that
the MgFe 204 synthesized from the ore rejects show almost similar behaviour i their
magnetic characteristics with the exception of the ferrite prepared from come tercial
a-Fe203, IVIglietn; we undertook dielectric constant and tan 6 measurements or these
samples as a function of temperature to get further insight in their property diffe: ences.
The samples that obtained — 1000 ° / 24h from our laboratory [46] were Used as su :;h and
145
the measurements were carried out. Also, few samples were then further sint :red —
1100°C an s the measurements were done. The results of such measurements are
presented here and discussed.
It be seen from the Figure 4.2.7 that there is a normal dispersion in :' with
frequency. However there is no much difference in 6' values at low frequencies of 1000 °
and 1100°C sintered samples. MgHem, however, shows maximum dispersion in the
sample sintered at 1100°C; the c' values at low frequency also increased. MgFFI IA too
showed maximum dispersion in 6'. Increased s' is found to be more for Melvt TA on
sintering to 1100°C.
MgHem sintered at 1100°C which showed increased s' value and ma: itnum
dispersion with frequency also indicated a tan 8 maximum (hmp) — 9 kHz (Fig. 1.2.7),
while that sintered at 1000°C showed normal dispersion. But the MgFFHA which
showed incrcased s' on 1100 °C sintering now shows normal dispersion in tan 6, vt tiereas
the 1000°C sintering gives an increased tan 8 — 12 kHz. Mgc(FA sintered at 1)00 °C
gives frequency independent tan 5 which is in general lower through out the fre( uency
range as compared to that sintered At 1100 °C.
Thus, higher temperature sintering has some beneficial effect on tan 5 va ues in
NtFe204 excepting MgHem. The maximum dielectric dispersion observed in 1V gHem
sintered at 1100°C suggests that it may have some Fe e ' ions present in it whic I then
reflected in its tan S loss maximum.
d) Microstmc,ture (SEM) analysis
The standard y-Fe 203 has spindle shape particles (Fig. 4.2.8) of sizes, 45 (9, upto
0.2 }_un (Fig. 4.2.9a), 45 (%) of 0.2 — 0.6 p.m and the ferrite 1VIgy, prepared from this oxide
show dumb-bell shape particles of sizes more than 0.4 pun. The commercial red oxide,
146
a-Fe203 (RO), indicate particles rod like of sizes 0.2 — 0.4 µm (48 %) and 44 (% upto
0.6 µm, but e ferrite obtained from this, MgRO, show particles upto 1.4 µm. The ferrite
MgHem prepared from commercial a -Fe203 (section 4.1; Fig. 4.1.5) shows a wide
variations in the particle distributions and has a porosity of 42 (%) (Table 4.1.2). These
are the fenit's obtained 1000 °C using commercial iron oxides.
The MgHem shows the saturation magnetization, 6s, values (Table 4.1.2) of 17.20
emu/g, while the Mgy and MgRO indicate (Table 4.2.4) the values of 22.56 and 23.05
emu/g, respectively. Both the MgRO and Mgy have single phase MgFe 204i while
MgHem has few admixture of a-Fe 203 indicating incomplete formation of the ferii e and
hence the lowest os may be observed.
Thes r three MgFe 204 samples, however, show temperature variati n of
susceptibility (Fig. 4.2.2c) quite different from each other. A multidomain type beh LAiour
is observed in Mgy and a single domain type nature in MgRO. But, the MgHem sl ows a
Hopkinson fect.
Although, the particle size distributio and shapes may not directly influenci 1g the
nature of y - T plots, the different domain types observed in these three ferrite s mples
can be rouR' ly considered due to variations in particle distribution. Also, the 1 article
shapes and sizes are not influencing the saturation magnetization values and her :e the
lowest cis values of 17.2 emu/g observed in MgHem may be due to incomplete MrFe20 4
formation. The dumb-bell shape Mgy and MgRO having usual particles, however, have
as values of 22.56 and 23.05 emu/g, respectively. But the permeability of fen ites is
much influenced by factors such as imperfections, porosity and crystalline shaj e and
distribution. Permeability values are dependent, hence, on the method of preparati m.
147
The frequency dependence of permeability of Mgy (Fig. 4.2.4e), both sint( red in
air and nitrogen, show almost 6 order dispersion. The MgRO, however, indica es the
frequency dispersion but of 1'./2 order. The low frequency permeability values a e also
low in Mg ° compared to Mgy. The Mgy has dumb-bell shape particles, wh is
MgRO has normal size particles of wide distributions.
The frequency dependence of dielectric constant (s') and tan 8 loss of N gHem
(Fig. 4.2.7) ,intered at 1000°C show usual dispersions. The sample that sint( red at
1100°C indicates maximum dispersion in c' but then it also shows a low frequenc' • tan 6
maximum (a hump). As particle size distribution in MgHem that sintered at 1000'C led
to high porosity, the sintering to 1100°C must have increased porosity clue to Ilneven
growth of the particles.
The MgRO, on the other hand, has usual particle size distribution (Fig. 4.2.5 a) and
it has both frequency independent Ev and tan 6 (Fig. 4.2.6) in the frequency range of our
measurements. The dumb-bell shape Mgy, however, shows (Fig.4.2.8) very large
dispersions in both the Et and tan 6 values as a function of frequency.
Thm_ there seems to be some influence of particle sizes, shapes on the e .ectro-
magnetic properties in MgFe 2O4 in our studies. However, further syst :matic
investigations are required to correlate the electromagnetic properties with that of the
nature of particles. In part I of this chapter we did make some attempt in this egard.
However, one important aspect has not been taken into consideration here abt ut the
influence of impurities on the particle size distribution and electromagnetic prof erties,
especially on the other ferrite samples that prepared from iron ore rejects. Th( three
ferrite samples discussed so far are obtained from commercial grade iron oxide.
148
Part III
Synthesis and Characterization of (MnyZn3.2)Fe204
(Study [-:ample II)
4.3 Introduction
Mn-Z' n ferrites are technologically important soft magnetic materials [14' 1 find
use as cores in high frequency coils and transformers. High permeability and low losses
along with good stability of permeability with temperature and time are the charact( ristics
of such ferrites and as such fine control of Fe 2+ (ferrous) ions is essential to achieve these.
The large permeability is primarily associated with low crystal anisotropy in 14n-Zn
ferrites and attains maximum value as the crystal anisotropy K approaches zero. Al' td this
is achieved by introducing a small calculated amount of Fe 2+ ions which contribu e to a
positive aniotTopy; Mn-Zn ferrite has a negative crystal anisotropy and hence th Fe 2+
nullifies this resulting it into 0. Hence, in the synthesis of Mn-Zn ferrites a prop( r care
has to be tt " - en to have this compromise in the concentration of Fe 2+ ions and Tystal
anisotropy. !emperature and atmosphere controls are needed in processing the fi rrites.
149
Apart from *'were compositional restrictions in the ferrite preparation a strict con rol of
microstructures of the final products is also to be carr: ,A out as these to a great exte it also
allow the fc-r:ites to achieve final magnetic properties. Grains with large grain si !.e and
trapped porosity make the ferrite cores susceptible to eddy currents. Among ferri es the
preparation of MnZn ferrites is further complicated because of variable man ;anese
oxidation stPtes and the ferrites should have Mn 2+ in its normal sites. Ilere: bre, a
systematic synthetic research is still in progress. And, we in the present investit ,ations
restricting ourselves to the synthesis, xrd phase characterization and m: gnetic
characteriz2;:on (saturation magnetization, as in emu/g) of Mn1/22m/Ye204 from up raded
iron ores, especially from a study sample H. The results of such studies are dis nissed
here.
In ft- rite processing the properties of the starting materials are of ritical
importance [148 - 1491 because they greatly influence the process parameters and,
especially in less flexible production processes, determine the quality of the fmal
products. Iron oxide, a-Fe2O3, is the starting material, which represents about 70% of the
raw materials in ferrite synthesis. The quality of the oxide is of paramount imports :we as
iron oxide for ferrites preparation are drawn from various sources, especially frog i steel
pickle solution (spray roasted) and upgraded hematite. Both cation impurities, as I fell as
anion impurities in iron oxide [149 — 150i have been found to influence the ferrite
properties.
The iron oxide if exhibits self sintering at lower temperatures before it read 3 with
the other metal ion constituents of ferrite raw material, the product formatiou gets
delayed. The self sintering means the oxide shrinks (compresses) and becomes in fictive.
This is in accordance with the general observation that the lower the decompcsition
temperature of the basic salts from which the oxide (say from metal hydrc xides/
150
nitrates/carbonates) the lower the temperature region where the decomposition I roduct
reaches its optimum reactivity. The free surface of Fe, : in the starting mixtu .e will
strongly decrease during heating, thus impeding the solid state reaction betwe :In the
starting oxides. Such observations are made [1511 during the Mn-Zn ferrite forr cation.
And it is oi'served here that — 600 °C the raw mix containing Fe 2O3 + ZnO + vIn304
shows mainly ZnMn2O4 leaving aside Fe 2O3 unreacted. The ferrite formation i3 then
delayed.
The :Qactivity of iron oxide and its solid state reaction with the other metal »cides
in ferrite prenaration is an important study one has to carry out to get well dense pr( ducts.
And, this is our main objective in the present research activities. Therefore, we hav t been
working with different iron oxide samples that obtained from iron ore rejects. We ; re not
only using iron oxide, a-Fe203, thus prepared but also y-Fe 203 or mixture of y-Ft 203 +
a-Fe203 that obtained by special technique in preparing ferrites. In Part I and II )f this
chapter we we described our studies on MgFe2O4 and in this chapter we are pre :Ming
our data on Mn-Zn ferrite. The y-Fe 203 may have added advantage in ferites prepq ration
as it during eating of raw mix of ferrites transforms into a-Fe 203 which may b now
more reactiv2 and hence ferrite formation may occur readily or it may become mad ye by
self sinterinc and hence fenitization may be delayed.
4.3.1 Experimental
a) Preparation
The iron oxide obtained from study sample II of iron ore rejects, FH-11/21a0H,
FHH-II/NaOH , FF-II/NaOH and FFH-IUNaOH are being used for the synthe sis of
MIly.2111/2Fe204.
151
i) Ceramic .cchnique
Iron oxides as mentioned above were mixed in the desired percentag ; with
manganese formate (MO and zinc formate (ZF') and ground in an agate mortar ar d then
pelletised. The pellets of 15 mm diameter and 5 — 6 mm thickness (compressed in ;
5 — 10 tons/inch2) were then heated slowly to 700 °C in air or nitrogen for 24 holm . The
cooled samples were crushed, ground and then repelletised. Binder PVA (Po yvinyl
alcohol) wa- used in few cases. The pellets were then heat treated at 1150 — 1200 °1 1- for 3
- 6 hours in air or N2. The samples were furnace cooled.
Few , ainples were heated to 1200 °C and then quenched by dropping sam )Ies in
water. They are coded as MF'/ZF'/FH, MF'/ZF'/FHHz, MF'/ZF'/FF . and MF./ZF'/Fil;-Iz.
ii) Coprecipitation method
The iron oxides as mentioned above from study sample II were broug it into
solution by adding HC1 and adequate amounts of MnC12 and ZnO were then put in the
same solution. The solution was then coprecipitated with NaOH. The mixed metal
hydroxides, MZFH (from FH-EUNa0H) were filtered, washed and dried. The drie 1 mass
was then used to prepare the mixed metal formates by same method as described earlier
for iron formates.
The city MZFH and MZFF were then equilibrated in hydrazine I ydrate
atmosphere in a desiccator. The samples are named as MZFHH and MZFFHz.
The coprecipitated samples MZFH and MZFF' were pelletised an then
decomposed in air or nitrogen — 700 °C/24 hr. the cooled samples were crushed, found
and repelletised. Then they were heated slowly in air or nitrogen to 1150 — 1200 )C/3-6
hours. Fu-nace cooled samples were stored in desiccator. They are coded as MZ ;Hair,
MZFH/N2, MZFF'/air and MZFFHz/N2. The hydrazine equilibrated samples fume 3 soon
after they v re removed from the desiccator. They were then crushed, ground, pe letised
152
as above and samples sintered in air or nitrogen at 1150 — 1200 °C are nar ied as
MZFHHz/2:1. and MZFHHz/N2, MZFF'Hz/air and MZFVH.z./N 2 .
b) X-ray characterization
The samples were x-ray characterized as described in section 2.3.4.
c) Magnetic characterization
The saturation magnetization, as in cmu/g of the samples were calculates as in
section 3.4.3
4.3.2 Res and Discussion
The observed d hki values of all samples studied here are given in Table 4.3.1. All
xrd peaks are matching well with each other. However, the Mn-Zn ferrite prepared in the
present studies is to get Mn3,Zne,,Fe 204. The JCPDS file [152] mentions only about
Zno.6Mno.8Fe1.604 (Franklinite (ZtiMnFe)(FeMn)204 with lattice parameter a = 1.8474
mm The d Lk; values of Franklinite are also given for comparison in the table and t sere is
a close resemblance of these with our values. Our samples have lattice par; meter
between 0.8 ;26 and 0.8543. The lattice parameter variation between 0.854 and 0.355 is
observed [153] with zinc content for Mn-Zn ferrite of composition be tween
Mn0.6Zno.4Ffs204 and M110,5Zno.5Fe204. Since all our samples show more or less san e d hid
values as observed [14] for Mn a5Zna5Fe204, we consider that we have achieve d the
ferrite of same composition.
The saturation magnetization values measured at room temperature of all sg. mples
are presented in Table 4.3.2.
The rrite synthesized by ceramic technique using iron oxides from in n ore
rejects (study sample II) indicate as values between 34 and 86 emu/g. The iron Aide,
a-Fe203, obf-fined in air from iron hydroxides, FH-IIJNaOH when mixed with man anese
153
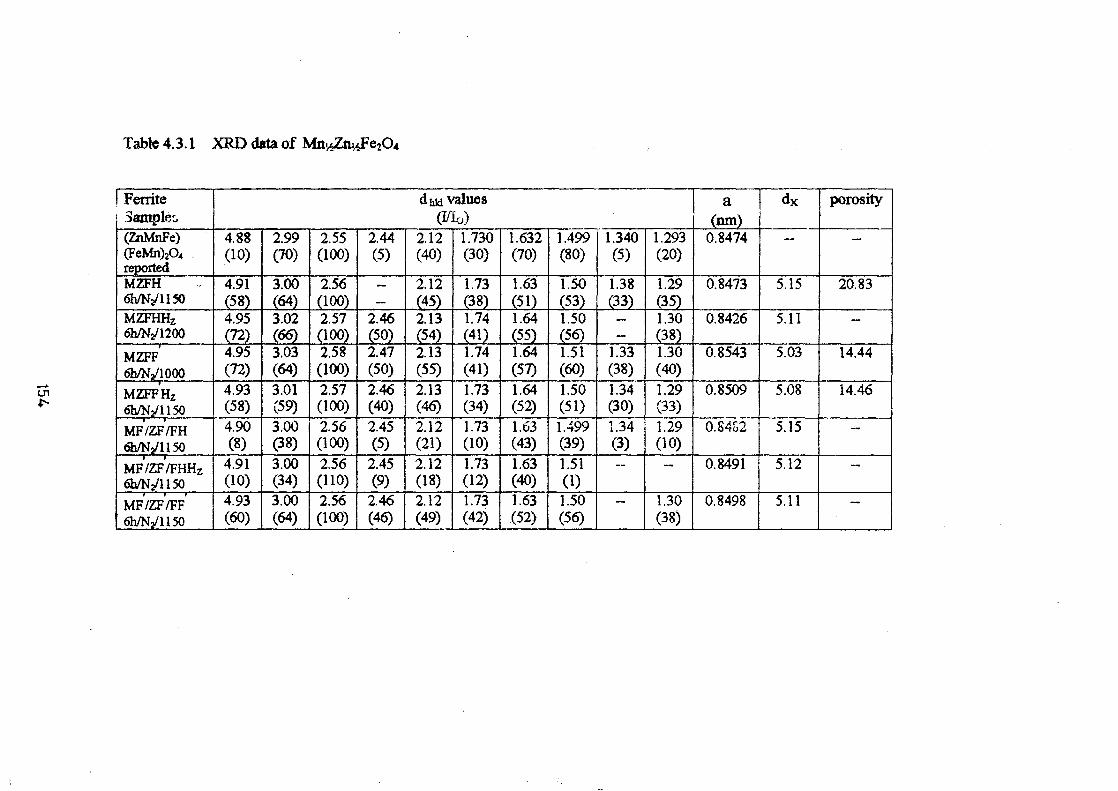
Table 43.1 XRD data of Mnv,Zny,Fe204
Ferrite .ample.,
d hid'
values (1-0)
a (nm)
dx porosity
(ZnMnFe) 4.88 2.99 2.55 2.44 2.12 1.730 1.632 1.499 r 1.340 1.293 0.8474 -- - (FeMn)204
reported (10) (70) (100) (5) (40) (30) (70) (80) (5) (20)
MZFH 4.91 3.00 2.56 -- 2.12 1.73 1.63 1.50 1.38 1.29 0.8473 5.15 20.83 6h/N2/1150 (58) (64) (100) - (45) (38) (51) (53) (33) (35) MUHHz 4.95
(72) 3.02 (66)
2.57 (100)
2.46 (50)
2.13 (54)
1.74 (41)
-6h/N2/1200
1.64 (55)
1.50 (56)
- -
1.30 (38)
0.8426 5.11
MZFF 4.95 3.03 2.58 2.47 2.13 1.74 1.64 1.51 1.33 1.30 0.8543 5.03 14.44 6h/Ni1000 (72) (64) (100) (50) (55) (41 ) (57) (60) (38) (40) WIT Hz 4.93 3.01 2.57 2.46 2.13 1.73 1.64 1.50 1.34 1.29 0.8509 5.08 14.46 6hilN2/1 1 50 (58) (59) (100) (40) (4.6) (34) (52) (51) (30) (33)
Mi/ZF /FH 4.90 3.00 2.56 2.45 2.12 1.73 1.63 1.499 1.34 1.29 0.842 5.15 - 6h/N2/1150 (8) (38) (100) (5) (21) (10) (43) (39) (3) (10)
Mi/ZF/FHHz 4.91 3.00 2.56 2.45 2.12 1.73 1.63 1.51 - 0.8491 5.12 - 6h/N2/1150 (1 0) (34) (110) (9) (18) (12) (40) (1) miai/FF 4.93 3.00 2.56 2.46 2.12 1.73 1.63 1.50 - 1.30 0.8498 5.11 -
6h/N2/1150 (60) (64) (100) (46) (49) (42) (52) (56) (38)
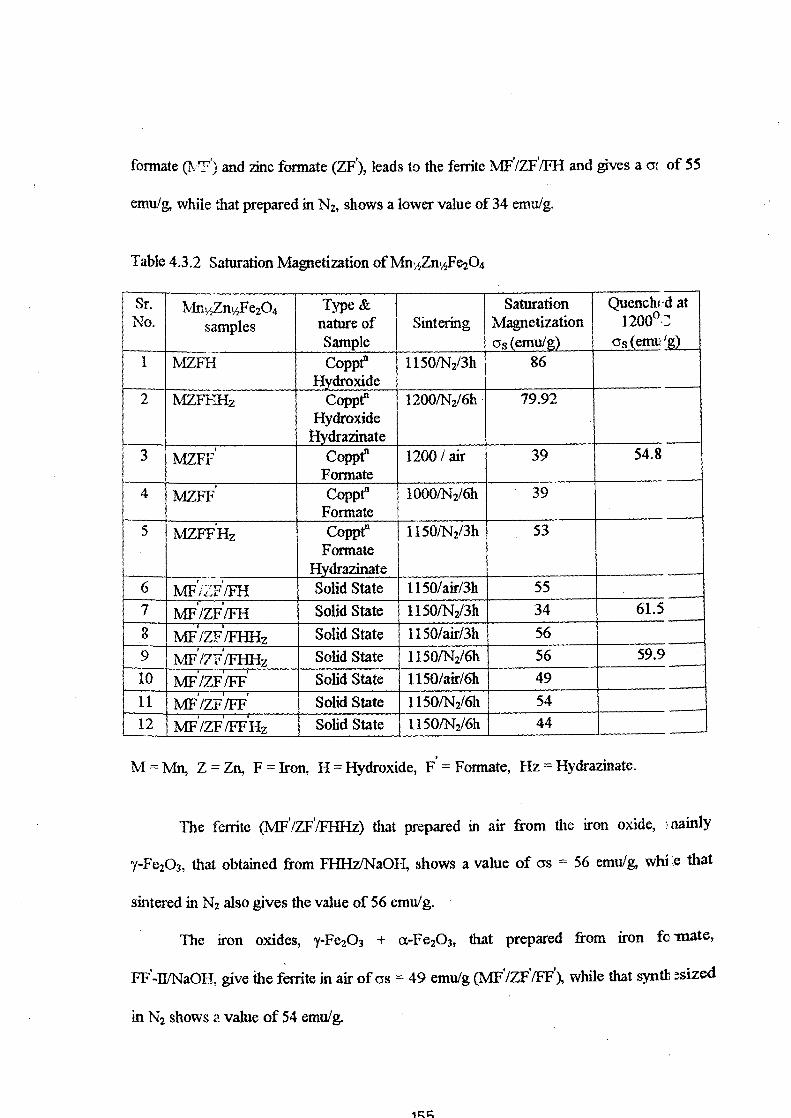
formate (.7\,77) and zinc formate (ZF'), leads to the ferrite MF'/ZF'/FH and gives a a: of 55
emu/g, while that prepared in N2, shows a lower value of 34 ernu/g.
Table 4.3.2 Saturation Magnetization of Mn. ,,Zny,Fe204
Sr. No.
/vInv,Zny,Fe204 samples
Type & nature of Sample Copp?
Hydroxide
Sintering
1150/N2/3h
Saturation Magnetization as (emu/g)
86
Quenched at 1200° •
as (emu': 1 MZFH
C'l
,
MZFIalz 1200/N2/6h 79.92
3 MZFF. Copp? Formate
1200 / air 39 54.8
4 MZFF. Copp? Formate
1000/N2/6h 39
5 MZFF'Hz Copp? Formate
Hydrazinate
1150/N2/3h 53
6 MF'/Z17./FH Solid State 1150/air/3h 55
7 Mi/ZF/FH Solid State 1150/N2/3h 34 61.5
MF /ZF /FHHz Solid State 1150/air/3h 56 9 MV/7171/F11Hz Solid State 1150/N2/6h 56 59.9
10 Mi/ZFI/FF Solid State 1150/air/6h 49 11 Mi/Zi/FF Solid State , 1150/N2/6h 54 12 MF''/Zi/E14'1.1z Solid State 1150/N2/6h 44
M = Mn, Z = Zn, F = Iron, H = Hydroxide, F = Formate, Hz = Hydrazinate.
The ferrite (MF'/ZF'/FHHz) that prepared in air from the iron oxide, laainly
y-Fe2O3, that obtained from FHHz/Na0H, shows a value of as = 56 emu/g, whi .e that
sintered in N2 also gives the value of 56 emu/g.
The iron oxides, y-Fe 203 + a-Fe203, that prepared from iron fo mate,
F17*-1UNa0H., give the ferrite in air of as = 49 emu/g (MF'/ZF'411), while that synth esized
in N2 shows a value of 54 emu/g.
icc
A saturation magnetization of 55.85 emu/g was obtained for Mn0,5Zn05Fe204
[154] from a solid state reaction between MnFe2O4 + ZnFe2O 4 — 1000°C/24h. Out values
are found to be very close to this reported value.
The Mny,Zn1/2Fe204 prepared in N2, however, from coprecipitation techniqu ,; gave
very high as of the order of 79.92 to 86 emu/g. The MZFH is the ferrite obtainel from
precursor hydroxides of manganese zinc iron shows a value of 86 emu/g. The hycroxide
precursor on equilibrating in hydrazine hydrate and on decomposition and sintering in N2
give a ferrite MZFHHz of value 79.92 emu/g. On the other hand, the coprecipitai ion of
manganese, zinc and iron as formates on decomposition and sintering in air at d N2,
/vIZFF./N2/ait., gives as value of 39 emu/g. The formate on equilibrating with hyd •azine
and then decomposing and sintering in N2 gives a value of 53 emu/g.
A study carried out to see the reactivity of iron oxide in the synthe, is of
Mil0.4Zn0,6Fe204 and its influence in microstructure development from the mixtt re of
a-Fe203 + ZnO + Mn304 precalcined at different temperatures before fmal sinter ag at
high temperatures, the authors [151] observed low as values for the ferrite of < 30 t mulg
when sintered and cooled in air, while higher values with maximum 85 emu/g were
obtained when sintered in air and then cooled in N2. The variations in as values obs , Tved
in our samples may, hence, due to the processing conditions. Although 55.85 emu/ was
observed [154] for Mn0. 5Zno. 5Fe204, we do get values in this range. But, then h gher
values that obtained in our studies from coprecipitation technique of — 80 - 86 emt /g is
surprisingly very high.
The Mn-Zn ferrites preparation is very sensitive to the methods of preparation and
atmospheres of sintering. Sintering of Mn-Zn ferrite is an important and elaborate step
[147]. Amon: 2 many reasons for getting variation in magnetic, permeability etc va ues,
zinc loss posstts a problem when high sintered density is required. This sintering re: orts
156
to high temperatures and hence loss in zinc is possible. If atmospheres are not con _rolled
the oxidation of Mn2+ may lead to high valence states (and consequent reduction ( f Fe 3+
to lower valtlIce state) may occur. As concentration of Fe 2+ in the ferrite is also ri ;eded,
controlled atmospheric sintering is essential. Inert gas atmosphere sintering or coo ing of
the ferrite (after heating in air / oxygen) is required to be undertaken. The cooling in N2
also helps iii avoiding reoxidation of Mn 2+ and Fe2+. A systematic heat schedul ;s are
normally adopted to avoid microcracks development in the dense samples. Thus, many
precautionary measures are required in the synthesis of Mn-Zn ferrites. Many a times, to
freeze the obtained composition at higher temperatures, one needs to quench the sa , nples.
This way, magnetic and electric characteristics of the ferrites can be optimised.
Few samples of the ferrites in the present investigations have been quenched The
sample MZY''/air having as = 39 emu/g on quenching from 1200°C showed an in ;rease
in the value to 54.8 emu/g. Similarly, the IvIF'/ZF'/FH sample of 34 emu/g increa ced to
61.5 emu/g on quenching.
157