chapter nine : traffic and transport - dorset · chapter nine -traffic and transport ... (dmrb)...
TRANSCRIPT

Chapter Nine - Traffic and Transport
Weymouth Relief Road - Environmental Statement 81
INTRODUCTION AND SCOPE
9.1 This chapter assesses the traffic and transportimpacts of the proposals in accordance with currentGovernment web based Transport Analysis Guidance(WebTAG) and Design Manual for Roads and Bridges(DMRB) guidance. It identifies the study area, themethodology used to assess the proposals, the existingbaseline conditions and details of relevant policies andguidance. It then sets out the future position if theproposals were not to go ahead before identifying andassessing the significance of the impacts of theproposals.
STUDY AREA
9.2 The study area for this assessment topic is definedin Figure 9.1. It has been defined to enable the robusttesting of possible impacts on the local transport networkgenerated by the proposals.
9.3 The main area of interest in the study area isWeymouth and the various routes connecting it withDorchester. To enable a wide extent of connections toWeymouth to be considered the study area includes theA350 in the east, Bridport in the west, the A35 in thenorth and Portland in the south. These widerconnections include the A31/A35/A354 andA351/A352/A353 routes from the east and the A35/A354and B3157 routes from the west.
DEFINITIONS
9.4 Throughout this assessment a number of terms orphrases are used. These phrases and their definitionsare set out below:
• Base year: this is the base year taken for assessmentpurposes i.e. 2001.
• Opening year: this is the year the proposals are considered likely to be first in operation i.e. 2010.
• Design year: this is the year used to assess the impacts of the proposals, and following standard practice set down in DMRB Volume 12A Chapter 5, is 15 years after the proposals first operate i.e. 2025.
• Do–Minimum: this is the future position without the proposals. It is referred to as the do-minimum ratherthan the do-nothing as it assumes that minimum roadimprovements will take place. These minimum road improvements include the addition of the Chickerell Link Road (which was opened in January 2006) andchanges to speed limits in Nottington Lane due to traffic calming.
• Do–Something: this is the future position with the proposals in place. It should be noted that for this assessment the do-something scenario has not included the indicative improvements to the A35/A354 junction outlined in Chapter 5, as these were not considered likely to alter the assessment ofsignificance of the effects of the proposals
• High Growth: this is the future growth of traffic usinghigh growth assumptions which is in line with standard practice as set down in DMRB Volume 12AChapter 5. This is the scenario which has been usedin predicting the impacts of the proposals because itrepresents the worst case scenario.
• Low Growth: this is future traffic growth using low growth assumptions which is in line with standard practice as set down in DMRB Volume 12A Chapter 5.
• AADT: Annual Average Daily Traffic Flows.
METHODOLOGY
9.5 Following the definition of the study area theassessment identified the baseline environment withinthis area. Consideration was then given to theimplications of relevant policy and guidance, and also towhat is likely to happen in the future in terms of traffic andtransport without the proposals. The assessment thenidentified and assessed the possible traffic and transportimpacts of the proposals.
9.6 The overall significance of impacts have beendefined as being insignificant or of minor, moderate ormajor significance. The overall level of significance wasdetermined using professional judgement, taking accountof:
• the sensitivity of the receiving environment – this is the adaptability and resilience of an environment when affected by an impact and is categorised as high, medium or low.
• the magnitude of the impact – this is the scale of change which the impact causes compared to the baseline and is categorised as high, medium or low.
• the frequency of the impact – this is the duration of the impact compared to the activity causing it and iscategorised as infrequent, frequent or continuous.
• the extent of the impact – this relates to the geographical area that the impact may affect and is categorised as local/immediate, regional or international/national.
• the timescale of the impact – this relates to the duration of the impact irrespective of the activity causing it and is categorised as short term, medium term or long term.
9.7 A comprehensive programme of roadside interview(RSI) surveys to determine the origin and destination oftrips, automatic traffic counts (ATC), driven journey timesurveys and public transport surveys were undertaken in2001 during the neutral months of May and June. Highseason traffic counts and driven journey time surveyswere also carried out in August. The 21 RSI survey sites(shown on Figure 9.2) formed an inner and outer cordonaround Weymouth with a sample of traffic beinginterviewed, in separate directions, as it passed througheach site. The surveys were undertaken over a 12-hourperiod between 0700 and 1900 hours. Full manualclassified counts (MCC) were taken at all 21 surveystations over a 12-hour period between 0700 and 1900hours. Approximately 38,000 drivers were interviewedwhich accounted for 20% of all vehicles crossing thecordons. Automatic volumetric counts were taken at thesites to give background traffic information over thenetwork as a whole.
9.8 The modelling of patterns of traffic and publictransport user movements has been undertaken using ahighway/public transport model. The modelling processhas used the SATURN (Simulation and Assignment ofTraffic in Urban Road Networks) Highway suite ofprograms and the TRIPS (TRansport ImprovementPlanning System) Public Transport module as containedwithin the CUBE travel forecasting software. The modelwas used to define the 2001, 2010 and 2025 scenariosreferred to in this chapter.
9.9 The 2001 baseline position defined by the modelwas validated and calibrated against the collected dataoutlined in paragraph 9.7 above, using current WebTAGand DMRB guidance. It is therefore considered to be arobust basis against which the potential impacts of theproposals have been predicted and assessed.
Chapter Nine : Traffic and Transport

Chapter Nine - Traffic and Transport
Weymouth Relief Road - Environmental Statement82
9.10 DMRB Volume 12 states that “maximum useshould be made of suitable existing data, whereverpossible, provided they are sufficiently up to date andtheir source is sufficiently well documented.” The datathat has been used to define the 2001 baseline position isnot more than 6 years old therefore DMRB indicates thata present year (2006) validation report is not required.
9.11 In determining the impacts of the proposals inrespect of traffic flows the likely situation in the years 2010(the opening year) and 2025 (the design year) have been
predicted, both with and without the proposals in place(do-something and do-minimum), and compared with theposition in 2001 (the base year).
9.12 In predicting the opening and design year trafficflows, suppressed and induced traffic effects due toconstraints in highway capacity have been assessed inaccordance with guidance set down in WebTAG andDMRB.
9.13 Cost Benefit Analysis software (COBA) has beenused to carry out an accident only cost benefit analysis ofthe scheme. TUBA (Transport User Benefit Appraisal)software, developed to carry out an economicassessment of the costs and benefits experienced byeach person or organisation as a result of a project basedon their willingness to pay, has been used to produce anappraisal of the proposals.
9.14 Journey time assessments have been undertakenby comparing driven journey times with predicted journey
times from the model over the same route. The drivenjourney time surveys were conducted according to theMoving Observer Method outlined in DMRB Volume 12,Chapter 6, Section 6.9. This involved driving the samejourney several times on different days with timing pointsat major junctions along the route. The driven journeytimes were averaged over each peak period and theresults compared with the modelled journey times for thesame peak period.
9.15 An assessment has also made of the severance
A350
Figure 9.1 Traffic and Transport Study Area
Scale. 1:250 000
This map is based upon Ordnance Survey material with thepermission of Ordnance Survey on behalf of the Controller of HerMajesty's Stationery Office.© Crown Copyright 2006. Unauthorisedreproduction infringes Crown copyright and may lead to prosecutionor civil proceedings. © Dorset County Council. LA 100019790. 2006.
North
NorthSource. Dorset Engineering Consultancy

Chapter Nine - Traffic and Transport
Weymouth Relief Road - Environmental Statement 83
caused by traffic passing through communities or cuttingacross rights of way as a result of building the proposals.This firstly considered the severance that would continueto be caused if the proposals were not built (the do-minimum scenario) and this was then compared to thepredicted severance after the construction of theproposals. The overall significance of severance effectsis assessed using the methodology set out in Appendix 4of this ES, which is different to the methodology outlinedabove in paragraph 9.6.
EXISTING BASELINE CONDITIONS
Highway Conditions
9.16 The existing highway network is shown on thevarious figures accompanying this Chapter. The A354 isboth a County and National Primary Route and providesone of the two main routes which serve Weymouth andPortland (the other route being the A353). The A354provides the main link from Weymouth and Portland to theA31 / A35 Folkestone to Honiton Trunk Road whichbypasses Dorchester.
9.17 From Dorchester the A354 enters Weymouth as asingle carriageway road passing through the settlementsof Upwey, Broadwey and Redlands. A new link runningsouth west from the Manor Roundabout at Redlandstowards Weymouth town centre was constructed in 1987to relieve the southern part of the A354 Dorchester Road.This link crosses the River Wey and follows the westernshore of Radipole Lake. Access to the town centre is viaSwannery Bridge. The A354 continues southwardsthrough the town via Rodwell, Southlands and WykeRegis before crossing The Fleet and providing the onlyroad access to Portland.
9.18 The A353 is a single carriageway road providingaccess to Weymouth from the east, through Osmingtonand Preston and along the seafront through Overcombeto Weymouth town centre.
9.19 Littlemoor Road links the A353 at ChalburyRoundabout, Preston with the A354 Dorchester Road atBroadwey. It serves the Littlemoor and Preston housingarea providing direct access to residential properties,schools, a local shopping centre and a garden centre.This road provides a useful local link road that allowstraffic to avoid using the A353 through Weymouth towncentre.
North
North
BER 2006
19
18
17
16
15
1413
12
11
10
9
8
7
14
13
1
2
3
4
5
6
20
21
1
4
5
ENVIRONMENTAL SERVICESMiles Butler - Director
DORSET ENGINEERING CONSULTANCYM
10
1 Way Site
Interview/traffic count site
Scale. Not to Scale
This map is based upon Ordnance Survey material with the permission ofOrdnance Survey on behalf of the Controller of Her Majesty's StationeryOffice.© Crown Copyright 2006. Unauthorised reproduction infringes Crowncopyright and may lead to prosecution or civil proceedings. © Dorset CountyCouncil. LA 100019790. 2006.
Figure 9.2 : Location of Road Side Interview andAutomatic Traffic Count Sites
Source. Dorset Engineering Consultancy
4
4
ENVIRONMENTAL SERVICESMiles Butler - Director
DORSET ENGINEERING CONSULTANCYMichael Winter - Head of DEC
10
1 Way Site
Issue/Rev
Traffic and Transport
Interview/traffic count site

9.20 The A354 passes through Conservation Areas atUpwey and Broadwey, where there are numerous listedbuildings, including 17 that front the road. As a result ofpast ribbon development 392 dwellings and smallbusinesses front the 3.5 km length of road betweenManor Roundabout and the foot of the Ridgeway withmany dwellings set close to the highway. Outside thebuilt-up area, the A354 has a poor alignment with steepgradients, a hairpin bend and a bridge under the railwaywith sub-standard headroom. The only other classifiedroutes to Weymouth, the A353 eastwards and B3157 tothe west, are on poor alignments.
9.21 The existing A353 between Weymouth andPreston provides access to the sea front and manyfacilities such as the Lodmoor Activity Centre, otherrecreation areas and holiday parks. Through theresidential areas of Overcombe and Preston the roadcontains several junctions with housing estates as well asfrontage access for individual properties, hotels andshops. East of Chalbury Roundabout there are a numberof holiday and residential caravan parks. Further east, theroad climbs on a steep gradient with no verges to passthrough the villages of Osmington and Poxwell wherevehicles have to negotiate tight bends with lorries forcedto cross the centre line of the road. In places there areno footways and pedestrians, including school children,walk in the road.
9.22 Any traffic entering Weymouth from the east whichdoes not have a destination in the area betweenWeymouth Harbour and the beach, i.e. the mainshopping area, hotels, ferry etc, will almost inevitably useKing Street and Swannery Bridge to link to the A354Westwey Road. Hence King Street gets congested andis the cause of many of the traffic delays in the towncentre.
9.23 The single carriageway B3157 has been improvedfrom its junction with the A354 in Weymouth, westwardsfor 2.3km to Chickerell. This section of road servesseveral residential areas and the expanding GranbyIndustrial Estate and it carries large volumes of traffic atpeak times. The road then passes through the Chickerellresidential area with several junctions before becoming abendy rural road through villages on its 25km routetowards Bridport. The road is often narrow and tortuouswith vehicles forced to slow or stop for oncoming traffic.There are several steep gradients on this length of road
with many poorly located junctions and numerous farmand private accesses.
9.24 Traffic conditions on the A354 and the A353Preston Road / Preston Beach Road are considered to bepoor. Traffic congestion on these routes is commonthroughout the year. Traffic often queues and is slowmoving in both directions along the A354 throughRedlands, Broadwey and Upwey, with queues frequentlystretching back onto the Ridgeway and as aconsequence along Littlemoor Road. Traffic also backsup along the A353 from Weymouth town centre, throughGreenhill and along Preston Beach Road to Overcombe.There is also frequent congestion at the A354 / A35junction on the Dorchester Bypass, and in Weymouth atKing Street, Boot Hill and Foords Corner.
9.25 There are a number of knock on traffic relatedeffects that occur as a result of these conditions. Journeytimes along the Weymouth/Dorchester corridor are longand unreliable with resulting implications for localresidents, public transport services, local businesses andvisitors to the town. Frequent peak hour delays on theA354 also lead to rat-running on unsuitable alternativeroutes through the Area of Outstanding Natural Beauty(AONB), particularly Coombe Valley Road to the east ofthe main corridor, and via Portesham and the B3157 tothe west.
9.26 The Annual Average Daily Traffic (AADT) flow in2005 on the A354 north of the Manor Roundabout was25,600 vehicles per day (vpd), of which approximately2.5% were heavy goods vehicles (HGV’s). On the A353in Overcombe the AADT flow in 2005 was 15,400 vpd,whilst on the Littlemoor Road the AADT flow in 2005 was9,300 vpd. The actual 1994, 2001 and 2005 AADT flowson the network in and around Weymouth obtained fromATC and the growth in AADT flows on these routes duringthis period is shown in Table 9.1.
9.27 Figure 9.3 sets down the traffic flows across thewhole of the network which have been produced by thetraffic model and validated by the data obtained duringthe 2001 surveys.
Journey Times
9.28 Tables 9.2 and 9.3 show that there was a widerange of journey times on the existing A354 between
Chapter Nine - Traffic and Transport
Weymouth Relief Road - Environmental Statement84
RoadNo.
A354A354A353A354A354A354A353B3159B3157B3157C905A353
199417,20016,20013,80024,00017,50015,40027,5001,1004,40011,7009,8008,800
200120,00018,60014,20025,40024,80015,70027,5001,5005,30012,70010,1008,700
200520,70019,30015,40025,60025,40016,20028,8001,5005,70013,8009,3009,900
Growth over11 years20%19%12%7%45%5%5%36%30%18%-5%13%14%
Location
DORCHESTER/WEYMOUTH/PORTLAND CORRIDORNorth of Weymouth (Monkton Hill)Weymouth Way (North) Preston Road – Overcombe Dorchester Road – Redlands Rodwell Road – Boot Hill Portland Beach RoadSwannery BridgeNorth of UpweyChickerell Lanehouse Rocks RoadLittlemoor Road - WestPoxwell Overall Growth
Annual Average Daily Traffic
Table 9.1: Growth in AADT flows 1994 to 2005
Table 9.2 Journey Time Reliability: May 2001 values, in seconds – Northbound.
Time Period07:30 – 09:3009:30 – 16:3016:30 – 18:30
Average761613590
Minimum581515511
Maximum942759737
Table 9.3 Journey Time Reliability: May 2001 values, in seconds – Southbound
Time Period07:30 – 09:3009:30 – 16:3016:30 – 18:30
Average762578911
Minimum563489668
Maximum10086781253

Chapter Nine - Traffic and Transport
Weymouth Relief Road - Environmental Statement 85
Traffic flows in vehicles per day(the sum of the flows in each direction)
B3159
A35A35
A35
4
B3157
A353
traffic flow1500
Year2001
DORCHESTER
WEYMOUTH
traffic flow100
Year2001
traffic flow15300
Year2001 traffic flow
17500Year2001
traffic flow18600
Year2001
traffic flow3000
Year2001
traffic flow2200
Year2001
traffic flow8500
Year2001
traffic flow5200
Year2001 traffic flow
3600Year2001
traffic flow13100
Year2001
traffic flow9500
Year2001
traffic flow15800
Year2001traffic flow
13200Year2001
traffic flow5200
Year2001
traffic flow19100
Year2001
traffic flow16800
Year2001
traffic flow21500
Year2001
traffic flow9900
Year2001
traffic flow9700
Year2001
traffic flow6700
Year2001
traffic flow5100
Year2001
traffic flow3000
Year2001
traffic flow17300
Year2001
traffic flow2900
Year2001
traffic flow23900
Year2001
traffic flow2900
Year2001
traffic flow21300
Year2001
traffic flow2700
Year2001
traffic flow1200
Year2001
A353
C54
C126
traffic flow6300
Year2001
traffic flow14700
Year2001
traffic flow500
Year2001
traffic flow600
Year2001
traffic flow7400
Year2001
traffic flow7000
Year2001
A354
A353
CoombeValley Road
Littlemoor Road
B3157
B3159
C10
C53
DM33006200
Year20102025
DS15002300
Predicted traffic flows in the year 2010, under thedo minimum (DM) and the do something (DS) scenarios
Predicted traffic flows in the year 2025, under thedo minimum (DM) and the do something (DS) scenarios
Locations referred to in Table 9.6 and Table 9.9
DM6200
Year2025
DS2300
C54
Scale. 1km
This map is based upon Ordnance Survey material with the permission ofOrdnance Survey on behalf of the Controller of Her Majesty's StationeryOffice.© Crown Copyright 2006. Unauthorised reproduction infringes Crowncopyright and may lead to prosecution or civil proceedings. © Dorset CountyCouncil. LA 100019790. 2006.
North
North
Figure 9.3 : Baseline Traffic Flow Predictions for 2001
Source. Dorset Engineering Consultancy
Manor Roundabout and A35/A354 Stadium Roundaboutthroughout the whole day in 2001. This is due to thenumber of obstructions and restrictions such as thenumber of vehicles turning into and out of side roads andlorry deliveries. A related consequence is that servicebus journey time reliability suffers.
Bus services
9.29 Dorchester is relatively well served by a network ofbuses including inter-urban, local and express coaches.There are bus services between Portland and Weymouth,with a high frequency (every 8 - 10 minutes) serviceduring peak hours operated by First, and a lowerfrequency (every 30 minutes) service operated bySureline.
9.30 Between Weymouth and Dorchester, the mainroutes operated by First and Sureline run at 20 and 30minute frequencies respectively, which, when combinedwith other routes, give approximately six buses per hourbetween the towns. The timetabled journey time forthese services (between Weymouth Kings Statue andDorchester Trinity Street) is between 22 and 40 minutesand they run along the entire length of the A354Dorchester Road. Between Portland and Dorchesterthere is a half-hourly direct service operated by Surelinewith First running direct buses in morning and eveningpeak periods and these buses run along PortlandRoad/Buxton Road/Rodwell Road/Town Bridge to thetown centre. From there they run along the entire lengthof the A354 Dorchester Road.
9.31 Improved bus services can provide an alternativeto the private car and hence contribute to the aim ofreducing congestion in the corridor, but existingcongestion problems have proved a hindrance toimproving services. In order to improve journey timereliability of bus services on the existing A354, buscompanies are known to currently incorporate dead time(up to 20 minutes) into services in order to cover therandomly but regularly occurring delays.
Rail Services
9.32 There are currently 17 trains running daily Mondayto Friday between Weymouth and London Waterloo.These services, operated by South West Trains takebetween 2 hours 50 minutes and 3 hours 17 minutes andrun between 06.00 and 21.00.
9.33 All trains running between Weymouth andWaterloo call at Dorchester South Station. A total of 21services operate daily via Dorchester South fromWeymouth between Monday and Friday, with a journeytime of around 12 minutes. In addition to the Waterlooservices there are two morning services betweenWeymouth and Brockenhurst and two evening servicesbetween Weymouth and Eastleigh and Weymouth andBournemouth.
9.34 Weymouth rail station is also served by First GreatWestern services, with 8 services daily betweenWeymouth and Bristol Temple Meads and 7 services dailybetween Bristol Temple Meads and Weymouth. Theseservices stop at Dorchester West Station en route.
9.35 Between Weymouth and Dorchester there is anintermediate station at Upwey serving the local areas ofUpwey, Broadwey and Littlemoor, which is used by alltrain services between Dorchester and Weymouth. Thetimetabled service takes 12 minutes between Weymouthand Dorchester South and 11 minutes betweenDorchester South and Weymouth. Between Weymouthand Dorchester West it takes 13 minutes and 12 minutesbetween Dorchester West and Weymouth.
Pedestrian and cyclist facilities
9.36 The recreational footpaths and cycleways withinthe study area are described and analysed in Chapter 14,including a plan showing existing routes.
9.37 There is a designated cycle route betweenWeymouth and Portland. This is formed by the RodwellTrail and a shared footway / cycleway along the PortlandBeach Road. This is a useful facility for both commutersand leisure users, although the requirement to cross theA354 at Ferrybridge is considered likely to deter someusers. There is no designated cycle route betweenWeymouth and Dorchester.
9.38 In built up areas the highway network generally haspedestrian footpaths running alongside, however theseroutes do not combine to make a coherent network. It isnot possible, for example, to walk along the length of thePortland – Weymouth – Dorchester corridor.
Commuting Patterns
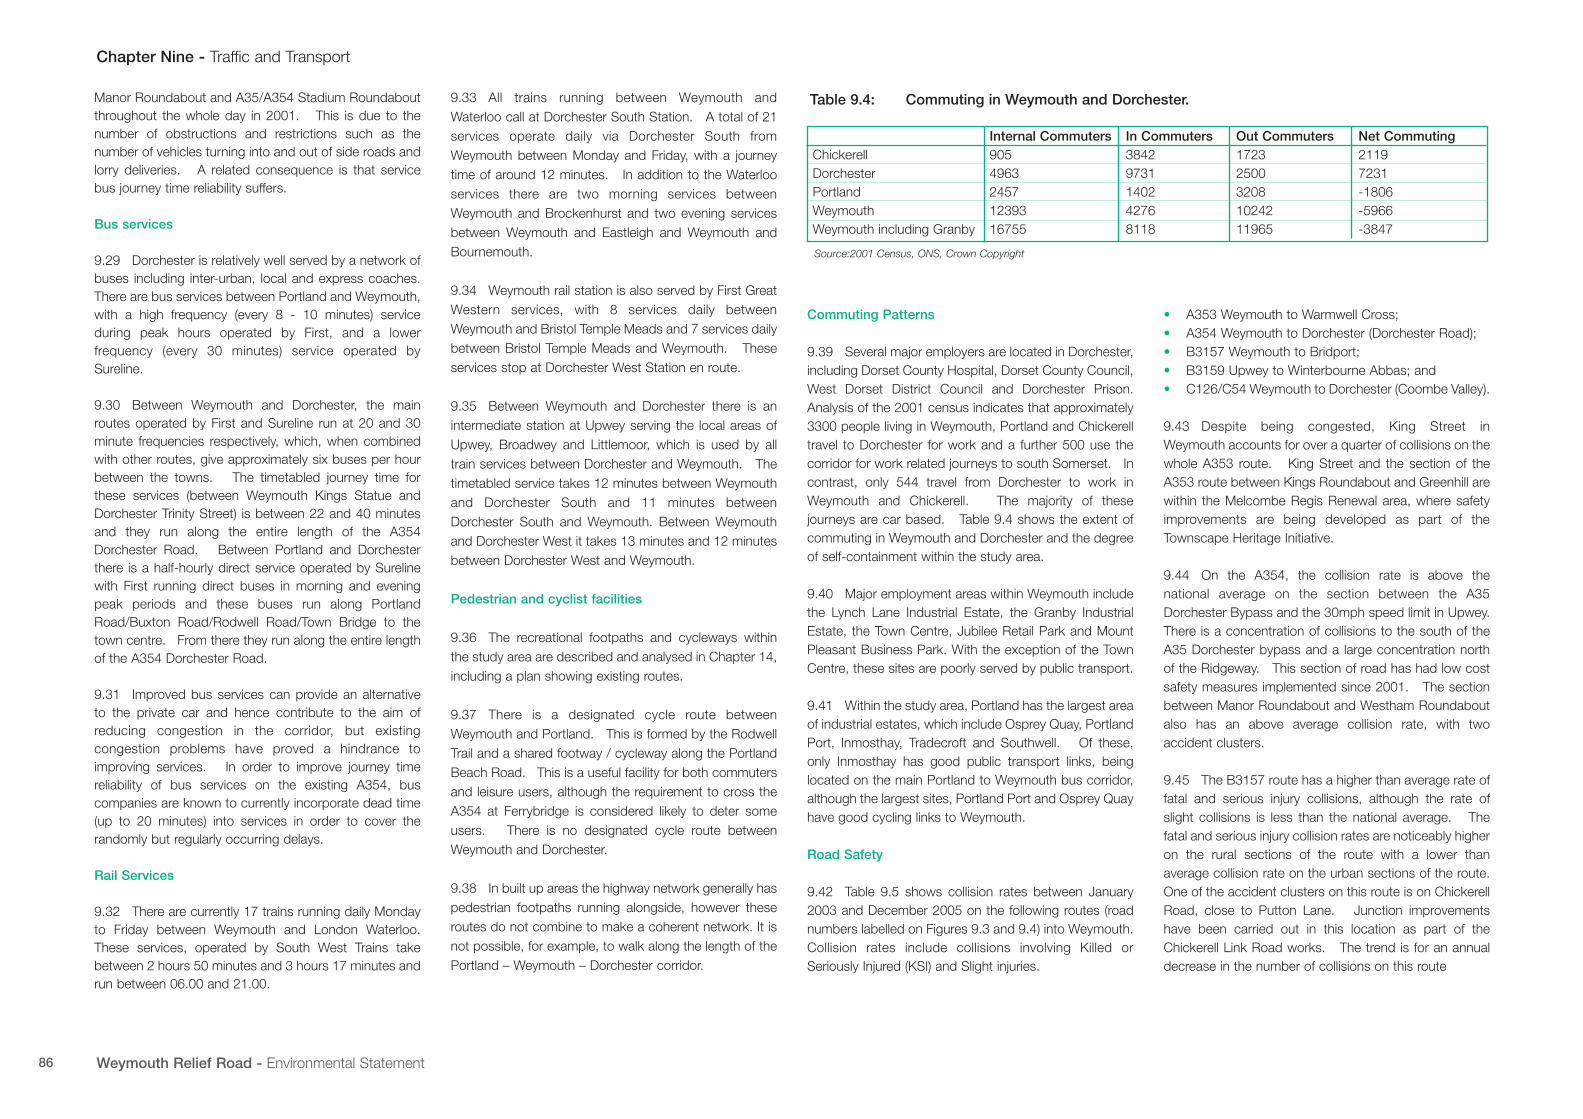
9.39 Several major employers are located in Dorchester,including Dorset County Hospital, Dorset County Council,West Dorset District Council and Dorchester Prison.Analysis of the 2001 census indicates that approximately3300 people living in Weymouth, Portland and Chickerelltravel to Dorchester for work and a further 500 use thecorridor for work related journeys to south Somerset. Incontrast, only 544 travel from Dorchester to work inWeymouth and Chickerell. The majority of thesejourneys are car based. Table 9.4 shows the extent ofcommuting in Weymouth and Dorchester and the degreeof self-containment within the study area.
9.40 Major employment areas within Weymouth includethe Lynch Lane Industrial Estate, the Granby IndustrialEstate, the Town Centre, Jubilee Retail Park and MountPleasant Business Park. With the exception of the TownCentre, these sites are poorly served by public transport.
9.41 Within the study area, Portland has the largest areaof industrial estates, which include Osprey Quay, PortlandPort, Inmosthay, Tradecroft and Southwell. Of these,only Inmosthay has good public transport links, beinglocated on the main Portland to Weymouth bus corridor,although the largest sites, Portland Port and Osprey Quayhave good cycling links to Weymouth.
Road Safety
9.42 Table 9.5 shows collision rates between January2003 and December 2005 on the following routes (roadnumbers labelled on Figures 9.3 and 9.4) into Weymouth.Collision rates include collisions involving Killed orSeriously Injured (KSI) and Slight injuries.
• A353 Weymouth to Warmwell Cross;• A354 Weymouth to Dorchester (Dorchester Road);• B3157 Weymouth to Bridport;• B3159 Upwey to Winterbourne Abbas; and• C126/C54 Weymouth to Dorchester (Coombe Valley).
9.43 Despite being congested, King Street inWeymouth accounts for over a quarter of collisions on thewhole A353 route. King Street and the section of theA353 route between Kings Roundabout and Greenhill arewithin the Melcombe Regis Renewal area, where safetyimprovements are being developed as part of theTownscape Heritage Initiative.
9.44 On the A354, the collision rate is above thenational average on the section between the A35Dorchester Bypass and the 30mph speed limit in Upwey.There is a concentration of collisions to the south of theA35 Dorchester bypass and a large concentration northof the Ridgeway. This section of road has had low costsafety measures implemented since 2001. The sectionbetween Manor Roundabout and Westham Roundaboutalso has an above average collision rate, with twoaccident clusters.
9.45 The B3157 route has a higher than average rate offatal and serious injury collisions, although the rate ofslight collisions is less than the national average. Thefatal and serious injury collision rates are noticeably higheron the rural sections of the route with a lower thanaverage collision rate on the urban sections of the route.One of the accident clusters on this route is on ChickerellRoad, close to Putton Lane. Junction improvementshave been carried out in this location as part of theChickerell Link Road works. The trend is for an annualdecrease in the number of collisions on this route
Chapter Nine - Traffic and Transport
Weymouth Relief Road - Environmental Statement86
Table 9.4: Commuting in Weymouth and Dorchester.
ChickerellDorchesterPortlandWeymouthWeymouth including Granby
Internal Commuters905496324571239316755
In Commuters38429731140242768118
Out Commuters1723250032081024211965
Net Commuting21197231-1806-5966-3847
Source:2001 Census, ONS, Crown Copyright

Chapter Nine - Traffic and Transport
Weymouth Relief Road - Environmental Statement 87
9.46 The section of the B3157 between the Wych40mph speed limit and Burton Bradstock records anabove average accident rate, with a high percentage offatal and serious injury collisions. Improvements havebeen carried out to this section of road, including areduction in the speed limit, but the current trend is for anannual increase in the number of collisions.
9.47 The B3159 route has a higher than nationalaverage collision rate on the section of the route betweenGoulds Hill and Martinstown and between Martinstownand Winterbourne Steepleton.
9.48 The C126/C54 route is recorded as having a belowaverage collision rate. During the recording period,Coombe Valley Road was closed for three monthsbetween the 25th July 2005 and the 20th October 2005,which will have suppressed the collision rate for theperiod. Generally the collision rate on Coombe ValleyRoad is below average, due to traffic cautiouslynegotiating single lane sections.
IMPLICATIONS OF POLICY
National Policy
9.49 Transport 2010: The Ten Year Plan 2000 publishedin July 2000 sets out the Government’s strategy formodernising the transport network to provide anintegrated transport system covering all modes oftransport. Its objective is to tackle congestion andpollution, increase choice and raise standards to maketravel safer, more attractive and accessible to all. At thelocal level, the delivery of the 10 Year Plan will be throughLocal Transport Plans (LTP).
9.50 The Future of Transport: A Network for 2030published in 2004 looks at the factors that will shapetravel and transport over the next thirty years and sets outhow the Government will respond to the increasingdemand for travel, maximising the benefits of transportwhile minimising the negative impact on people and theenvironment. A central theme is to seek improvementsin transport management. Where it makes senseeconomically and environmentally, capacity will be addedto the road network and steps will be taken to ensure thatthe benefits are locked in and that the design issympathetic to the environment.
9.51 Planning Policy Guidance Note 13: Transport(2001) sets out national planning policy on transport andforms part of the Government’s overall approach toaddressing the needs of motorists, other road and publictransport users, and businesses by reducing congestionand pollution, and achieving better access todevelopment and facilities. Well-designed trafficmanagement measures are highlighted as beingimportant in terms of reducing community severance,noise, local air pollution and traffic accidents; helping toavoid or manage congestion pressures as well asproducing better and safer local road conditions in ruralareas and reducing the impacts of traffic in sensitivelocations, while facilitating the access that is important tomaintaining a vibrant rural economy.
Regional Policy
9.52 Regional Planning Guidance for the South West(2001) - RPG10 identifies the Weymouth and Portlandarea as an area of special need. One of the aims of thesouth eastern sub region is to spread the benefits ofeconomic growth to the more disadvantaged parts of thesub region, particularly to Weymouth and Portland by,amongst other things, co-ordinating transport and otherinfrastructure improvements to encourage regeneration.
9.53 Elsewhere in RPG the port/resort of Weymouthand Portland is singled out as a location suffering frompoor landward communications (paragraph 3.83) andthat improving access to Weymouth is an importantobjective that will also assist in the development ofPortland Port (paragraph 3.37). The RPG then makesclear that consequently provisional approval was given toa range of integrated measures in the December 2000Local Transport Plan settlement to achieve this objective.These integrated measures included the provision of aWeymouth Relief Road.
9.54 The Regional Transport Strategy (RTS) forms partof RPG10. In order to maintain a strategic transportsystem to enhance the competitiveness of the regionPolicy TRAN 2 confirms that local authorities and otheragencies should support selective infrastructureproposals to improve the safety and operational efficiencyof the road network, reduce congestion and achieveenvironmental improvements.
Table 9.5: Collision Rate Analysis.Note: The values in bold show a collision rate which is at or above the national average for that type of road.
Section of Road
A353 Weymouth to Warmwell Cross
Jct A354 Westham Rbt to Preston Beach Rd –
30mph section
Preston Beach Road 50mph section
Preston Rd, Overcombe Corner to Preston
Preston to Osmington
Osmington 30mph section
Osmington to Poxwell
Poxwell 40mph section
Poxwell to Warmwell Cross
A354 Dorchester to Weymouth (Dorchester Road)
A35 Dorchester Bypass to Upwey
Upwey to Nottington Lane
Redlands 40mph section
Manor Roundabout 30mph section
Weymouth Way to Westham Rbt
B3157 Weymouth to Bridport
Chickerell Rd to Putton Lane
Chickerell Rd, Putton Lane to Moonfleet Rbt
Chickerell to Portesham village
Portesham 30mph section
Portesham to Abbotsbury village
Abbotsbury 30mph section
Abbotsbury to Swyre village
Swyre 30mph section
Swyre to Burton Bradstock
Burton Bradstock 40mph section
Burton Bradstock 30mph section
Burton Bradstock to Wych
Wych 40mph section
Chestnut Way to Crown Rbt
B3159 Upwey to Winterbourne Abbas
Jct A354 at Upwey to Goulds Hill
Goulds Hill to Martinstown
Martinstown Village 30mph section
Martinstown to Winterbourne Steepleton
Winterbourne Steepleton 30mph section
C126/C54 Dorchester to Weymouth, Coombe
Valley Road
Dorchester, Maumbury Traffic Signals to
Herringston Rd (Hospice)
Dorchester (C126/C54) to Coombe Valley Rd, Preston
Preston, Coombe Valley Rd 30mph section
Type
Urban
Rural
Urban
Rural
Urban
Rural
Urban
Rural
Rural
Urban
Urban
Urban
Rural
Urban
Urban
Rural
Urban
Rural
Urban
Rural
Urban
Rural
Urban
Urban
Rural
Urban
Urban
Urban
Rural
Urban
Rural
Urban
Urban
Rural
Urban
Speed
limit
30mph
50mph
30mph
60mph
30mph
60mph
40mph
60mph
60mph
30mph
40mph
30mph
50mph
30mph
40mph
60mph
30mph
50mph
30mph
50mph
30mph
50mph
40mph
30mph
50mph
40mph
30mph
30mph
60mph
30mph
60mph
30mph
30mph
60mph
30mph
Fatal
0
0
0
0
0
0
0
0
2
2
1
0
1
0
0
3
0
1
0
0
0
0
0
0
1
0
0
0
0
0
0
0
0
1
0
Serious
4
2
2
1
0
1
0
0
1
1
1
1
2
0
1
1
0
1
0
4
0
0
1
1
3
1
0
0
1
0
0
0
0
4
2
Slight
37
4
20
3
2
4
6
0
41
23
10
4
21
7
10
13
1
2
1
6
0
5
1
1
5
1
1
1
6
0
2
1
3
12
0
Length
of road
(kms)
1.85
1.12
2.50
1.40
1.05
1.20
1.25
1.00
5.00
2.50
1.00
0.20
2.70
0.75
2.00
6.00
0.75
2.00
1.22
5.25
0.50
3.50
0.40
0.87
1.95
0.77
0.20
1.95
3.55
1.24
1.70
1.20
1.00
7.27
0.75
Collision
rate/
100M
Veh Kms
99
26
43
26
17
38
44
0
39
45
44
91
42
145
85
44
27
40
16
46
0
35
99
45
60
34
65
28
107
0
64
45
60
47
53
National
Average
Collision rate/
100M Veh Kms
70
25
70
25
70
25
70
25
25
70
70
70
25
64
64
46
64
46
64
46
64
46
64
64
46
64
64
64
46
64
46
64
64
46
64

Chapter Nine - Traffic and Transport
Weymouth Relief Road - Environmental Statement88
9.55 The draft Regional Spatial Strategy (RSS) for theSouth West identifies the A354 between Weymouth andDorchester as a regionally significant transport route,recognising that it is one of the regions primary arteries forlong distance intra regional freight and passenger traffic.The upkeep and management of the route is referred toas being essential to the efficient functioning andmovement of goods across the region, a matter identifiedas being needed to support the economy. The accessregionally significant transport routes offer to the SouthWest’s ports and airports is also recognised. Themaintenance of the reliability of journey times on regionalroutes, rather than improved journey time or speeds, isidentified as the priority.
9.56 Policy TR10 of the draft RSS advocates a corridormanagement approach to make the best use of thenetwork and improve the reliability and resilience ofjourney times for regionally significant routes. Within thescope of the Corridor Management approach, the policystates that highway authorities should develop proposalsto reduce the impact of long distance traffic on the builtand natural environment and improve the quality of life ofcommunities by seeking to improve air quality, and toreduce accidents, severance and the impact of noise.
9.57 In Policy TR12 of the draft RSS the A354 fromWeymouth to Dorchester is identified as a regional freightroute and therefore forms part of the strategic networkthat will be promoted for use by HGV vehicles rather thancounty routes. Local authorities are required, throughtheir Local Transport Plans, to reflect the regionalhierarchy of routes and give priority to strategic routes indetermining road maintenance allocations.
Local Policy
9.58 The transportation policies contained in theBournemouth, Dorset and Poole Structure Plan (October2000) seek to achieve the best balance between theneed for the safe and efficient movement of people andgoods and the need to protect and enhance theenvironment. Transportation Policy U states that majorimprovements to the strategic highway network will beprogressed to support other policies within the StructurePlan and as part of the integrated transport strategy.Such improvements must be essential to meet theeconomic objectives of the Plan and/or ameliorateunacceptable environmental conditions caused by trafficand be cost effective.
9.59 Proposed strategic highway improvements arelisted in priority order in Transportation Policy X.Improvements to the A354 Ridgeway to Mount Pleasant,Weymouth, incorporating Preston link, is identified as thetop priority.
9.60 Policy T13 of the Weymouth and Portland LocalPlan (adopted December 2005) reserves land for theconstruction of a Relief Road from Mount Pleasant toRidgeway for a single carriageway including crawlerlanes. The reservation also includes the A353 PrestonLink, a cycleway and a new park and ride site at LodmoorNorth. It confirms that development that would prejudicethe construction of the road will not be permitted.
9.61 Policy TRAN4 of the West Dorset Local Plan(adopted July 2006) confirms that land identified as beingrequired for improved transport or highway infrastructurewill be protected from development which wouldprejudice the implementation of the proposal. Thesupporting text notes that schemes identified in the Planare subject to regular review and other improvementsmay be identified as a result of changes in strategy,circumstance or network management and that suchchanges will be identified and progressed through theLocal Transport Plan Review process.
9.62 Policy EA35 refers particularly to the A354 MountPleasant to Ridgeway ‘Orange Route’ identified on theProposals Map for completion within the plan period.Paragraph 13.9.6 notes that the scheme represents amajor strategic link to the A35 and A37 through andnorthward from Dorchester and is an important elementof an Integrated Transport Strategy to address thetransport needs of the interrelationship between theDorchester, Weymouth and Portland corridor and thesurrounding hinterland.
9.63 A Weymouth Relief Road forms a key element ofan Integrated Transport Strategy prepared for thePortland / Weymouth / Dorchester corridor which is setdown in the Local Transport Plan (LTP).
9.64 The LTP states that the new road would meet theneed for improved reliability and resilience of journeytimes identified in the emerging RSS, and enabletransport linkages to, from and within the town ofWeymouth to function more efficiently. It would alsoenable the other measures of the package to be
implemented, which include a step-change improvementin the quality of bus services, bus priority measures, parkand ride provision, the formation of commuter cycleroutes, and more restrictive town centre parking policiesfor both Weymouth and Dorchester.
ENVIRONMENTAL CHANGE WITHOUT THEPROPOSAL
Traffic Flows
9.65 Figure 9.3 shows the AADT 2001 Base Yearscenario, predicted by the highway/public transportmodel. Figure 9.4 shows predicted AADT high growthflows within the study area in both 2010 and 2025 withthe proposals in place (the do-something scenario), incomparison to the predicted flows if the proposals werenot provided (the do-minimum scenario). High growthflows are shown because these represent the worst casescenario.
9.66 The do-minimum figures for 2010 and 2025 showthat there would generally be an increase in traffic flows inthe study area compared to 2001, and that the increasein traffic flows would not just be on the A354 but on otherroads within the study area, including many of thosepassing through the Area of Outstanding Natural Beauty(AONB).
9.67 Table 9.6 sets down the predicted traffic flows forthose routes that access Weymouth and are within theAONB. These show that there would be a significantincrease in AADT flows between 2001 and the do-minimum scenarios for 2010 and 2025. The location ofthe sites referred to are shown on Figures 9.3 and 9.4.
Journey Times
9.68 Tables 9.2 and 9.3 showed the wide range ofjourney times on the A354 between Manor Roundaboutand A35 Stadium Roundabout throughout the whole dayin 2001. An assessment has been undertaken of journeytimes on the A354 corridor in the 2025 do-minimumscenario. For this assessment the corridor for the do-minimum scenario has been taken to be ManorRoundabout to the A35/A354 Stadium Roundaboutusing the existing A354 Dorchester Road. The results ofthis assessment are shown in Tables 9.7 and 9.8.
9.69 This assessment shows that average journey timeson the existing A354 Weymouth to Dorchester transportcorridor for both private and public transport would besignificantly increased without the proposals.
Table 9.6: Comparison of 2010 and 2025 modelled High Growth AADT flows without theproposals with 2001 modelled Base Year AADT flows within the AONB.
Road No.
B3157C10B3159C53C126C54A353Total A354 atWinterborneMonkton
2001 ModelledBase Year - AADT
7,0001,5005001003,0002,2009,50023,800
18,600
2010 ModelledHigh Growth -AADTDo-minimum8,5002,1005001003,3002,20012,10028,800
21,900
Difference betweenmodelled 2010 and2001 AADT flows
+1,500 (+21%)+600 (+40%)00+300 (+10%)0+2,600 (+27%)+5,000 (+21%)
+3,300 (+18%)
2025 ModelledHigh Growth -AADTDo-minimum10,4003,1004003006,2002,90015,80039,100
23,700
Difference betweenmodelled 2025 and2001 AADT flows
+3,400 (+49%)+1,600 (+107%)-100 (-20%)+200 (+200%)+3,200 (+107%)+700 (+32%)+6,300 (+66%)+15,300 (+64%)
+5,100 (+27%)

Chapter Nine - Traffic and Transport
Weymouth Relief Road - Environmental Statement 89
Traffic flows in vehicles per day(the sum of the flows in each direction)
A35
A35
DM2000024100
Year20102025
DS2340028100
DM1780022900
Year20102025
DS1860023600
DM2190023700
Year20102025
DS2790033800
DM600700
Year20102025
DS300400
DM100300
Year20102025
DS100100
DM700800
Year20102025
DS200300
DM22002500
Year20102025
DS14001900
DM2450025800
Year20102025
DS25003200
DM2670028100
Year20102025
DS49006400
DM15001500
Year20102025
DS23003100
DM910011900
Year20102025
DS870010800
DM990012600
Year20102025
DS1030013000
DM33006200
Year20102025
DS15002300
DM22002900
Year20102025
DS13001700
DM1210015800
Year20102025
DS960012700
DM43007900
Year20102025
DS23003500
DM950011300
Year20102025
DS1700021000
DM53007200
Year20102025
DS1080013100
Year20102025
DS2670032300
Year20102025
DS3050037700 DM
1620020600
Year20102025
DS1400018200
DM2010027400
Year20102025
DS1300016700
DM2280029300
Year20102025
DS1910024300
DM1400016700
Year20102025
DS1350017200
DM48006300
Year20102025
DS54007200
DM2060023700
Year20102025
DS1790021600
DM2690031500
Year20102025
DS2510030500
DM660010400
Year20102025
DS56008000
DM860010700
Year20102025
DS870010800
DM2070022800
Year20102025
DS2510030700
DM34004000
Year20102025
DS26003300
DM41005100
Year20102025
DS37004700
DM1360017800
Year20102025
DS1430019200
DM72008900
Year20102025
DS74009100
DM57007500
Year20102025
DS59007700
DM21003100
Year20102025
DS21002600
DORCHESTER
WEYMOUTH
DM2140024200
Year20102025
DS2300026500
DM850010400
Year20102025
DS850010800
DM500400
Year20102025
DS200300
Littlemoor RoadLittlemoor Road
B3159 A35
4
B3157
A353
A353
C54
C126
A354
A353
CoombeValley Road
Littlemoor Road
B3157
B3159
C10
C53
DM33006200
Year20102025
DS15002300
Predicted traffic flows in the year 2010, under thedo minimum (DM) and the do something (DS) scenarios
Predicted traffic flows in the year 2025, under thedo minimum (DM) and the do something (DS) scenarios
Locations referred to in Table 9.6 and Table 9.9
DM6200
Year2025
DS2300
C54
Scale. 1km
This map is based upon Ordnance Survey material with the permission ofOrdnance Survey on behalf of the Controller of Her Majesty's StationeryOffice.© Crown Copyright 2006. Unauthorised reproduction infringes Crowncopyright and may lead to prosecution or civil proceedings. © Dorset CountyCouncil. LA 100019790. 2006.
North
North
Figure 9.4 : Predicted High Growth traffic flows 2010 &2025
Source. Dorset Engineering Consultancy
Chapter Nine - Traffic and Transport
Weymouth Relief Road - Environmental Statement90
IMPACT IDENTIFICATION AND ASSESSMENT
Construction Phase
9.70 It is predicted that the proposals will take aroundthree years to construct and that there will be three entrypoints into the construction site from the highwaynetwork, i.e. at the Ridgeway, along Littlemoor Road andat Manor Roundabout / Mercery Road. The predictedconstruction methodology is provided in Chapter 5.
9.71 Construction activity will generally take placeduring the hours of 0700 and 1830 Monday to Friday andbetween 0900 and 1500 on Saturdays. It is estimatedthat during the construction period approximately 14,000one way vehicle movements would be generated.During the whole construction process this would equateto an average of 6 two way construction vehiclemovements per hour on the A354. Assuming all of thistraffic uses the A354 the proposed increase fromconstruction traffic represents less than 1% of the existingaverage two way traffic flow along the A354, which isapproximately 1,500 per hour. It is therefore concludedthat there would be an insignificant impact on currenttraffic flows due to the addition of construction traffic.
9.72 Prior to the operation of the proposals it will benecessary for the newly created road proposals to beconnected into the existing road network. Theseconnections will be made at Manor Roundabout,Littlemoor Road and at the Ridgeway. Works to existingelements of the highway network i.e. at ManorRoundabout, Littlemoor Road and the A354 hairpin bendare also required.
9.73 In carrying out these works traffic control measuressuch as traffic signals will have to be used for a period oftime. Although disruption will occur as a result, theworks will be planned to ensure that traffic will still be ableto travel along these routes. It is considered that theworks required at the Manor Roundabout and theRidgeway are more critical than those along LittlemoorRoad because of the level of traffic using the A354.
9.74 The overall impact of connecting the proposals intothe existing highway network in a controlled andmonitored manner is considered to be adverse but ofminor significance. However, the impact will be shortterm and temporary in nature, and it is considered thatmotorists and vehicle travellers will accept the disruptioncaused as it cannot be avoided if the longer term trafficand transport benefits of the proposals are to beachieved.
Operation Phase
Traffic Flows
9.75 Figure 9.4 shows the predicted AADT highgrowth flows for the do-minimum and do-somethingscenarios in 2010 and 2025. These figures have beenpredicted using the highway/public transport modelreferred to earlier and assume a high level of traffic growthin accordance with guidance contained in DMRB Volume12A, Chapter 5.
9.76 These figures indicate that in 2010, the year ofopening, the proposals would provide:
• traffic relief on parts of the A354 Dorchester Road ranging from a 90% reduction at Broadwey to 82% reduction at Redlands; and
• traffic relief in the A353 Preston Beach Road corridorwith Preston Road traffic reducing by 14%, Preston Beach Road by 35%, The Esplanade by 16% and King Street by 13%.
9.77 The proposals would also reduce the volume oftraffic using the B3390/A353 through the villages ofAffpuddle, Crossways, Warmwell, Poxwell, Osmingtonand Preston to the east of the study area. These roadsare currently used by some traffic travelling between theA35 west of Bere Regis and Weymouth. The proposalswould attract more of this traffic to go via the A35 toDorchester and the improved A354 to Weymouth.
9.78 There would be a significant reduction in trafficthrough the AONB on Coombe Valley Road, north ofPreston. Although the flows are fairly small compared tothose on the main roads in the area, a drop of 47% withthe proposals would improve the safety on this route andthe amenity of the AONB for those people living at thesouthern end of this road.
9.79 By 2025 the figures indicate that the proposalswould provide:
• traffic relief on parts of the A354 Dorchester Road ranging from a 88% reduction at Broadwey to 77% reduction at Redlands; and
• traffic relief in the Preston Beach Road corridor with Preston Road traffic reducing by 12%, Preston BeachRoad by 39%, The Esplanade by 17% and King Street by 9%.
9.80 Again there would be a significant reduction in rat-running traffic through the AONB on Coombe Valley Roadwith a drop of 56% in 2025 if the proposals were built.
9.81 Table 9.9 sets down the predicted traffic flows forthose routes that access Weymouth and are within theAONB in both the do-minimum and the do-somethingscenarios for 2010 and 2025. The trend which emergesis that the minor roads within the AONB would have asignificant decrease in traffic flows under the do-something scenario with the A354 as the primary routebetween Dorchester and Weymouth having an increase intraffic. These figures indicate that the proposals wouldresult in the transfer of traffic from inappropriate routesthrough the AONB to the primary route betweenWeymouth and Dorchester.
9.82 The overall level of traffic relief on the existing A354Dorchester Road in Broadwey and Upwey as a result ofthe proposals is a beneficial impact considered to be ofmajor significance. However, there is considered to be anegative impact of moderate significance on the existingA354 Dorchester Road between the A35 StadiumRoundabout and the proposals where traffic increases.This is due to the fact that traffic is predicted to switchfrom inappropriate roads within the surrounding AONBonto the primary route between Weymouth and
Table 9.7: Average Journey Times, inseconds, on the northbound A354 Weymouth toDorchester corridor: 2025 High Growth.
Time Period
07:30 – 09:3009:30 – 16:3016:30 – 18:30
2001 Base Year
761613590
2025 Do-Minimum
907613793
Table 9.8: Average Journey Times, inseconds, on the southbound A354 Weymouthto Dorchester corridor: 2025 High Growth.
Time Period
07:30 – 09:3009:30 – 16:3016:30 – 18:30
2001 Base Year
762578911
2025 Do-Minimum
10628071206
Table 9.9: Comparison of 2010 and 2025 modelled High Growth AADT flows within the AONB withand without the proposals.
Road No.
B3157C10B3159C53C126C54A353Total A354 atWinterborneMonkton
Do-Minimum(DM)
8,5002,1005001003,3002,20012,10028,800
21,900
Do-Something(DS)
8,5002,1002001001,5001,3009,60023,300
27,900
Differencebetween DSand DM00-300 (-60%)0-1,800 (-55%)-900 (-41%)-2,500 (-21%)-5,500 (-19%)
+6,000 (+27%)
Do-Minimum(DM)
10,4003,1004003006,2002,90015,80039,100
23,700
Do-Something(DS)
10,8002,6003001002,3001,70012,70030,500
33,800
Differencebetween DSand DM+400 (+4%)-500 (-16%)-100 (-25%)-200 (-67%)-3,900 (- 63%)-1,200 (-41%)-3,100 (-20%)-8,600 (-22%)
+10,100(+43%)
2010 High Growth - AADT 2025 High Growth - AADT

Chapter Nine - Traffic and Transport
Weymouth Relief Road - Environmental Statement 91
Dorchester. The traffic reduction on roads within theAONB is a beneficial impact of major significance.
Journey Times
9.83 Tables 9.10 and 9.11 show that the total travel timewithin the study area increases and average speeddecreases for both the AM and PM peaks between 2001and 2025 under the do-minimum scenario. Theproposals would have the effect of reducing the totaltravel time and increasing average speeds within thestudy area. It should be borne in mind that the study areaincludes all roads in both rural and urban areas includingDorchester and Weymouth town centres.
9.84 An assessment has been undertaken of theaverage journey time savings on the A354 corridor thatwould result from the proposals. For this assessment thecorridor for the do-minimum scenario has been taken tobe Manor Roundabout to the A35/A354 StadiumRoundabout using the existing A354 Dorchester Road.For the do-something scenario the corridor has beentaken as the proposals and the existing A354 from theRidgeway to the A35/A354 Stadium Roundabout. Theresults of this assessment are shown in Tables 9.12 and9.13.
9.85 This assessment shows that average journey timeson the existing A354 Weymouth to Dorchester transportcorridor for both private and public transport would besignificantly improved as a result of the proposals.Journey times in the do-something scenario for 2025 arebelow that for 2001. The proposal has a major benefit inthat the journey times have been reduced between ManorRoundabout and A35 Stadium Roundabout.
9.86 The proposed new route has few junctions, noadjacent dwellings and businesses and therefore it isreasonable to assume that the journey time reliability fortravellers would improve. Overall the reduction in averagejourney times for private vehicles would be a beneficialimpact of moderate significance. A related issue is thatthe proposal would have a major benefit to bus servicesas reduced traffic levels and therefore congestion on theexisting A354 Dorchester Road would ensure that servicebus journey time reliability is improved and would be abeneficial impact of major significance.
Cost Benefit Analysis (COBA)
9.87 COBA software has been used to carry out anaccident only cost benefit analysis of the proposals. Anaccident only COBA predicts the accident numbers,severity split and costs as well as an analysis of accidentbenefits by year for road links and junctions. StandardCOBA11 parameters and methods have been usedthroughout the evaluation although local growth has beenapplied to the evaluation. Locally derived accident datahas been input based on five-year statistics for 2001-2005. Traffic flow data has been obtained from variabletrip assignments as produced by the Weymouthhighway/public transport model.
9.88 Table 9.14 summarises the existing accidentrecord on the major sections of road affected by theproposals for the five years between January 2001 andDecember 2005.
9.89 Tables 9.15 and 9.16 below show the predictedtotal accident benefits in terms of the number ofcasualties that have been estimated to be saved over aperiod of sixty years for low and high traffic growth withthe proposals across the study area.
Table 9.10 Modelled Network SummaryStatistics: 2025 High Growth AM Peak (08:00-09:00).
Scenario
2001 Base Year
2025 Do-Minimum
2025 Do-Something
Average
Speed (kph)
79
63
69
Total Travel Time
(passenger car unit hours)
2371
4539
4142
Table 9.11 Modelled Network SummaryStatistics: 2025 High Growth PM Peak (17:00-18:00).
Scenario
2001 Base Year
2025 Do-Minimum
2025 Do-Something
Average
Speed (kph)
83
70
72
Total Travel Time
(passenger car unit hours)
2692
4971
4800
Table 9.12: Average Journey Time, in seconds, on the northbound A354 Weymouth to Dorchestercorridor: 2025 High Growth.
Time Period
07:30 – 09:3009:30 – 16:3016:30 – 18:30
2001 Base Year
761613590
2025 Do- Minimum(DM)
907613793
2025 Do- Something(DS)
705504486
Journey TimeSavings (DM minusDS)202109307
Table 9.13: Average Journey Time, in seconds, on the southbound A354 Weymouth to Dorchestercorridor: 2025 High Growth.
Table 9.14: Existing accident data for the five years between January 2001 and December 2005.
Table 9.15: Accident Benefits - Low Growth Traffic.
Time Period
07:30 – 09:3009:30 – 16:3016:30 – 18:30
2001 Base Year
762578911
2025 Do- Minimum(DM)
10628071206
2025 Do- Something(DS)
562450689
Journey TimeSavings (DM minusDS)500357517
Road Section
A354 Manor Roundabout to Ridgeway
A353 Chalbury Roundabout to Westerhall Road
C905 Littlemoor Road A353 to A354
Fatal
4
1
0
Serious
11
5
1
Slight
119
29
23
Total
134
35
24
Pre-Scheme Five year Total
Do-Minimum (DM)
366
2,763
22,162
17,519
Do-Something (DS)
357
2,594
20,456
16,131
Accident Savings (DM minus DS)
9
169
1,706
1,388
Fatal Casualties
Serious Casualties
Slight Casualties
Number of accidents
Table 9.16: Accident Benefits - High Growth Traffic.
Do-Minimum (DM)
463
3,480
27,825
21,984
Do-Something (DS)
455
3,297
26,004
20,500
Accident Savings (DM minus DS)
8
183
1,821
1,484
Fatal Casualties
Serious Casualties
Slight Casualties
Number of accidents
(Costs in market prices discounted to 2002 in multiples of a thousand pounds.)
(Costs in market prices discounted to 2002 in multiples of a thousand pounds.)

9.90 There is therefore considered to be a beneficialimpact of major significance in terms of the number ofcasualties that have been estimated to be saved over aperiod of sixty years as a result of the proposals. Interms of monetary benefits the accident savings are£53.623m for the low growth scenario and £56.485m forthe high growth scenario.
Transport User Benefit Appraisal (TUBA)
9.91 TUBA has been used to carry out an economicappraisal of the proposals. TUBA undertakes a matrixbased assessment with either fixed or variable tripmatrices. It takes trip, time, distance and chargematrices from a transport model and these matrices maybe disaggregated by vehicle type, purpose and persontype. When scheme costs are input TUBA calculates theuser benefits in time; fuel vehicle operating costs (VOC)and non-fuel VOC over a sixty year period and thendiscounts these benefits and scheme costs to thepresent value year.
9.92 The TUBA assessment compares the do-minimumtrip, time, distance and charge outputs from thehighway/public transport model with similar data from thedo-something scenario.
9.93 Results of the appraisal of the proposals based onboth low and high growth scenarios are shown in Table9.17. The results show that construction of theproposals would produce good Benefit to Cost Ratios forboth low and high growth scenarios.
Bus Services
9.94 In order to improve journey time reliability of busservices on the existing A354, bus companies are knownto currently incorporate up to 20 minutes of “dead” timeinto services in order to cover the randomly but regularlyoccurring delays. This can include up to 5 minutes withinthe running time with the remaining 15 minutes asstandby time at Weymouth.
9.95 The proposals would show considerableimprovements to the journey time reliability of the existingbus services between Weymouth and Dorchester. As aresult it is considered that service frequency could beincreased between Weymouth and Dorchester from 3buses per hour to 4 buses per hour. The proposalswould result in a beneficial impact of major significance interms of improved journey times and reliability for busjourneys within the Weymouth – Dorchester transportcorridor.
Pedestrians and Cyclists
9.96 The proposals include considerable improvementsto the footpath and cycleway network within the areassurrounding the proposals. In transport terms this isconsidered to be a beneficial impact. Not only do theproposals provide new routes along which pedestriansand cyclists can travel, they are also considered tosignificantly improve the connections between differentparts of the built up area. By providing these improvedconnections the proposals will make it more attractive for
people within local communities to walk, cycle or usepublic transport in preference to the private car.
9.97 An example of this is the improved accessibility toUpwey station for pedestrians and cyclists from theLittlemoor area that would be provided by the proposals.Overall the improvements to the rights of way network asa result of the proposals are considered to be a majorpositive impact in terms of travel.
9.98 An assessment has been undertaken of theexisting community severance caused by traffic on theA354 and A353, and the future severance that would becaused by the proposals. This is detailed in Appendix 4of this ES. Taking into account the total number ofpedestrians affected, this assessment concludes thatoverall the proposals would reduce community severanceand result in a beneficial impact of moderate significancefor pedestrians.
Chapter Nine - Traffic and Transport
Weymouth Relief Road - Environmental Statement92
Net Consumer User BenefitsNet Business User BenefitsAccident BenefitsPresent Value of Benefits (PVB)Present Value Costs (PVC)Net Present Value (NPV)Benefit to Cost Ratio (BCR)
Do-Something £ MillionLow Growth80,573128,29753,623262,49370,260192,2333.736
Do-Something £ MillionHigh Growth255,876368,34956,485680,71078,294602,4168.694
(All prices are present values discounted to 2002, in 2002 prices.)
Table 9.17: TUBA Economic Appraisal.