chapter overview populations and samples probability sampling strategies nonprobability sampling...
TRANSCRIPT
CHAPTER OVERVIEW
• Populations and Samples• Probability Sampling Strategies• Nonprobability Sampling Strategies• Sampling, Sample Size, and
Sampling Error
SAMPLES AND POPULATIONS
• Inferential method is based on inferring from a sample to a population
• Sample—a representative subset of the population
• Population—the entire set of participants of interest
• Generalizability—the ability to infer population characteristics based on the sample
CHOOSING A REPRESENTATIVE SAMPLE
• Probability sampling—the likelihood of any member of the population being selected is known
• Nonprobability sampling--the likelihood of any member of the population being selected is unknown
PROBABILITY SAMPLING STRATEGIES
• Simple random sampling– Each member of the population has
an equal and independent chance of being chosen
– The sample should be very representative of the population
1. Jane 18. Steve 35. Fred
2. Bill 19. Sam 36. Mike
3. Harriet 20. Marvin 37. Doug
4. Leni 21. Ed. T. 38. Ed M.
5. Micah 22. Jerry 39. Tom
6. Sara 23. Chitra 40. Mike G.
7. Terri 24. Clenna 41. Nathan
8. Joan 25. Misty 42. Peggy
9. Jim 26. Cindy 43. Heather
10. Terrill 27. Sy 44. Debbie
11. Susie 28. Phyllis 45. Cheryl
12. Nona 29. Jerry 46. Wes
13. Doug 30. Harry 47. Genna
14. John S. 31. Dana 48. Ellie
15. Bruce A.
32. Bruce M.
49. Alex
16. Larry 33. Daphne 50. John D.
17. Bob 34. Phil
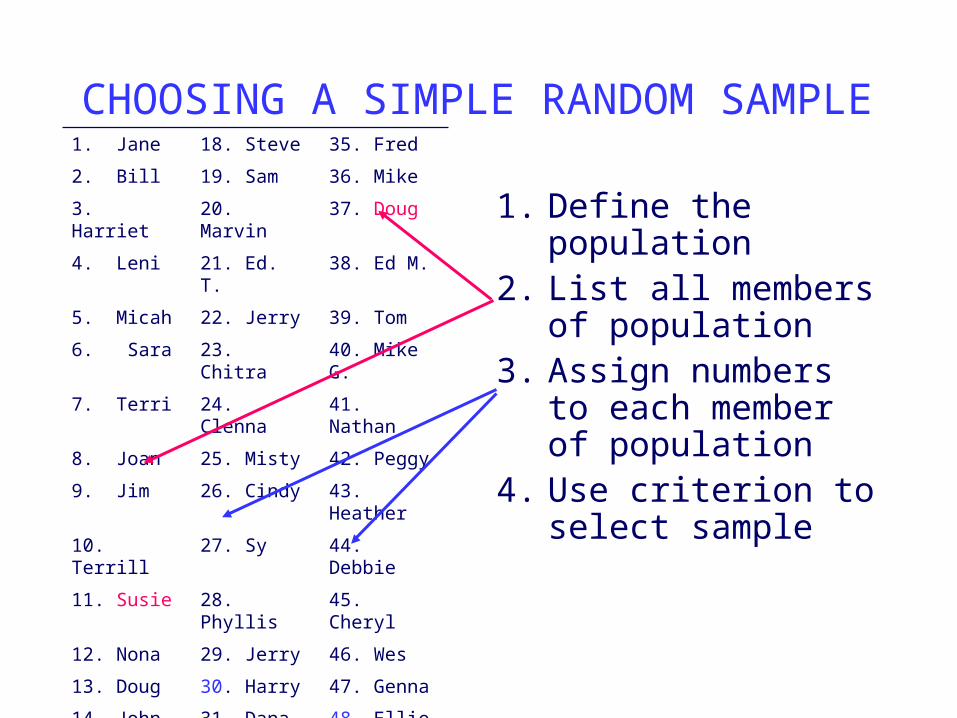
1. Define the population
2. List all members of population
3. Assign numbers to each member of population
4. Use criterion to select sample
CHOOSING A SIMPLE RANDOM SAMPLE
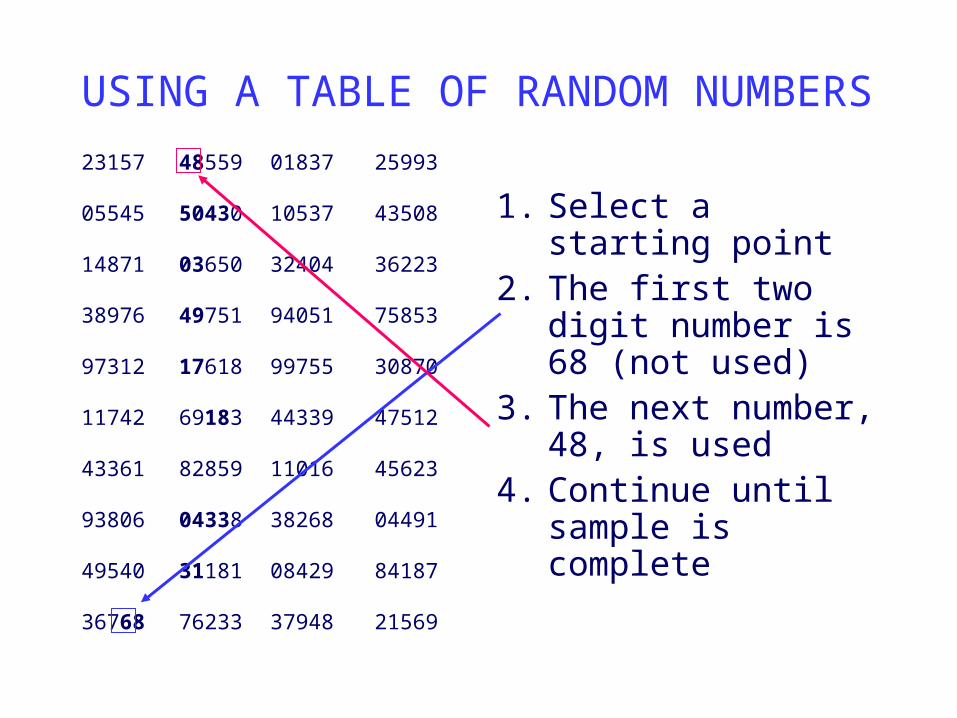
1. Select a starting point
2. The first two digit number is 68 (not used)
3. The next number, 48, is used
4. Continue until sample is complete
23157 48559 01837 25993
05545 50430
10537 43508
14871 03650 32404 36223
38976 49751 94051 75853
97312 17618 99755 30870
11742 69183 44339 47512
43361 82859 11016 45623
93806 04338
38268 04491
49540 31181 08429 84187
36768 76233 37948 21569
USING A TABLE OF RANDOM NUMBERS
KEYS TO SUCCESS IN SIMPLE RANDOM SAMPLING
• Distribution of numbers in table is random
• Members of population are listed randomly
• Selection criterion should not be related to factor of interest!!
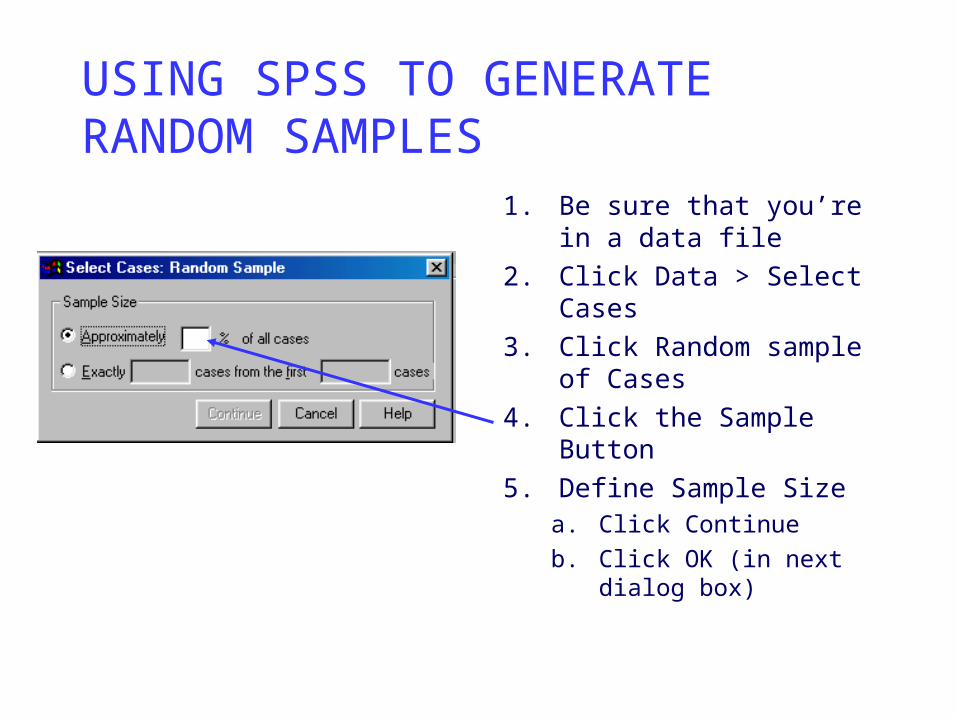
USING SPSS TO GENERATE RANDOM SAMPLES
1. Be sure that you’re in a data file
2. Click Data > Select Cases
3. Click Random sample of Cases
4. Click the Sample Button
5. Define Sample Sizea. Click Continueb. Click OK (in next
dialog box)
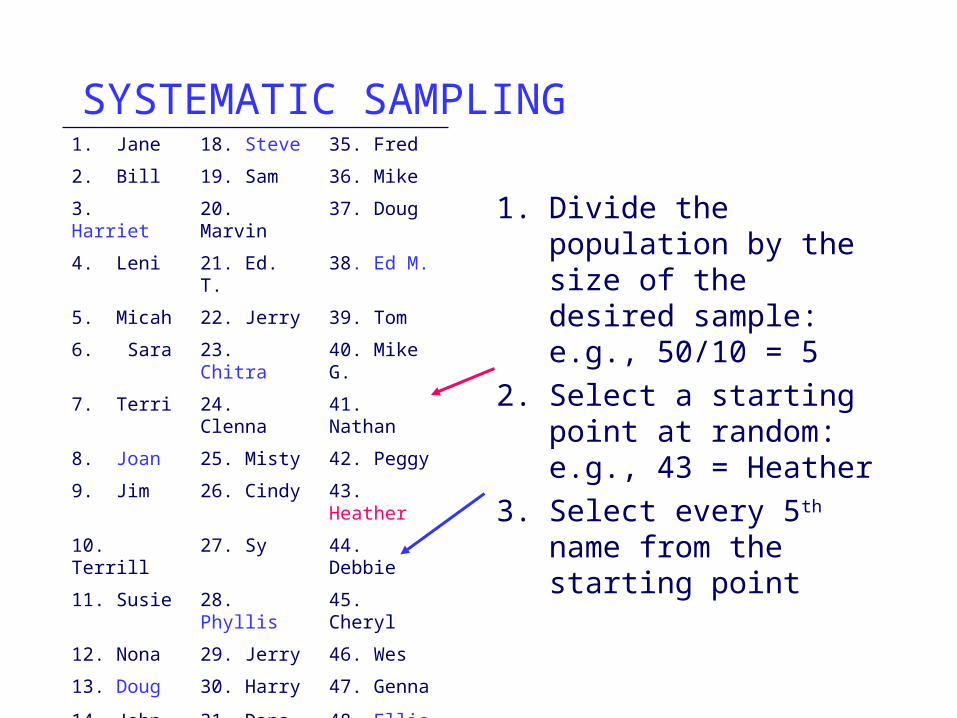
1. Divide the population by the size of the desired sample: e.g., 50/10 = 5
2. Select a starting point at random: e.g., 43 = Heather
3. Select every 5th name from the starting point
SYSTEMATIC SAMPLING1. Jane 18. Steve 35. Fred
2. Bill 19. Sam 36. Mike
3. Harriet 20. Marvin 37. Doug
4. Leni 21. Ed. T. 38. Ed M.
5. Micah 22. Jerry 39. Tom
6. Sara 23. Chitra 40. Mike G.
7. Terri 24. Clenna 41. Nathan
8. Joan 25. Misty 42. Peggy
9. Jim 26. Cindy 43. Heather
10. Terrill 27. Sy 44. Debbie
11. Susie 28. Phyllis 45. Cheryl
12. Nona 29. Jerry 46. Wes
13. Doug 30. Harry 47. Genna
14. John S. 31. Dana 48. Ellie
15. Bruce A.
32. Bruce M.
49. Alex
16. Larry 33. Daphne 50. John D.
17. Bob 34. Phil
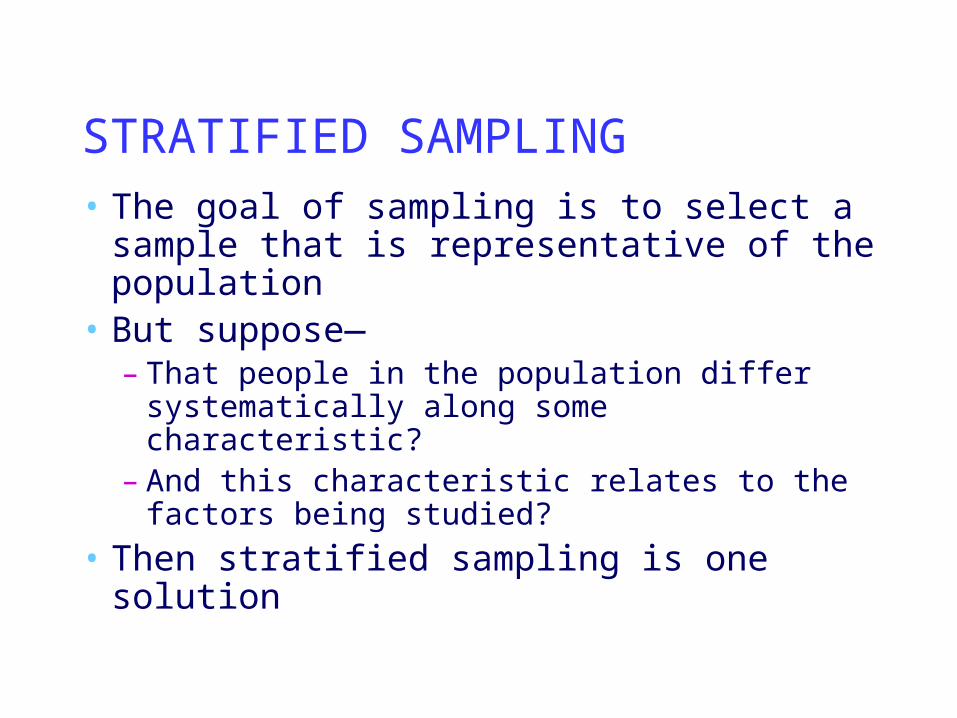
STRATIFIED SAMPLING• The goal of sampling is to select a
sample that is representative of the population
• But suppose—– That people in the population differ
systematically along some characteristic? – And this characteristic relates to the
factors being studied?• Then stratified sampling is one
solution
STRATIFIED SAMPLING
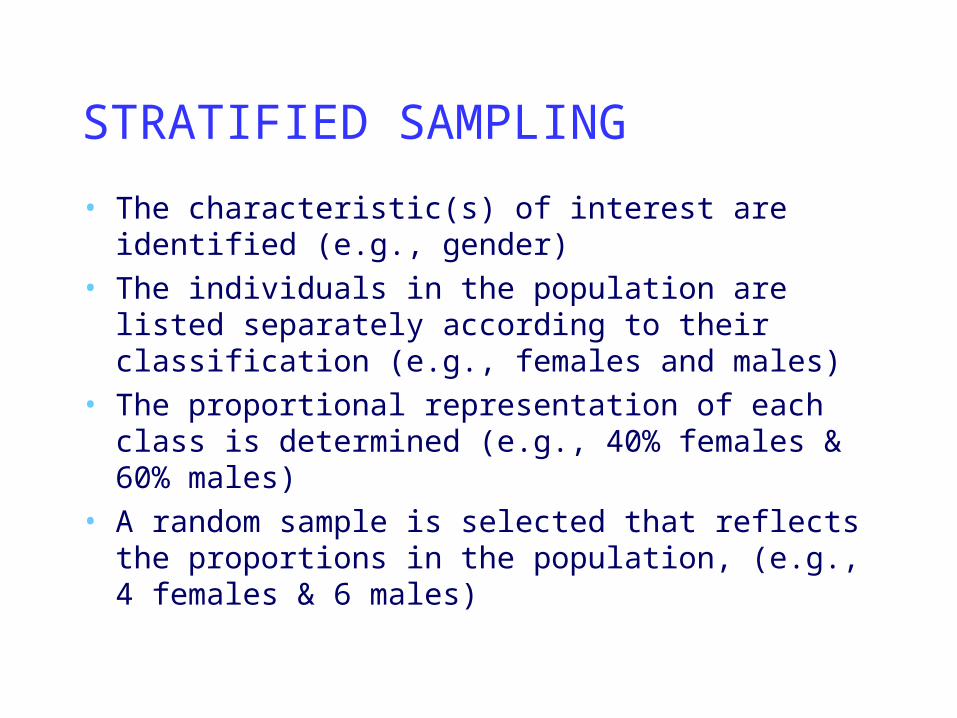
• The characteristic(s) of interest are identified (e.g., gender)
• The individuals in the population are listed separately according to their classification (e.g., females and males)
• The proportional representation of each class is determined (e.g., 40% females & 60% males)
• A random sample is selected that reflects the proportions in the population, (e.g., 4 females & 6 males)
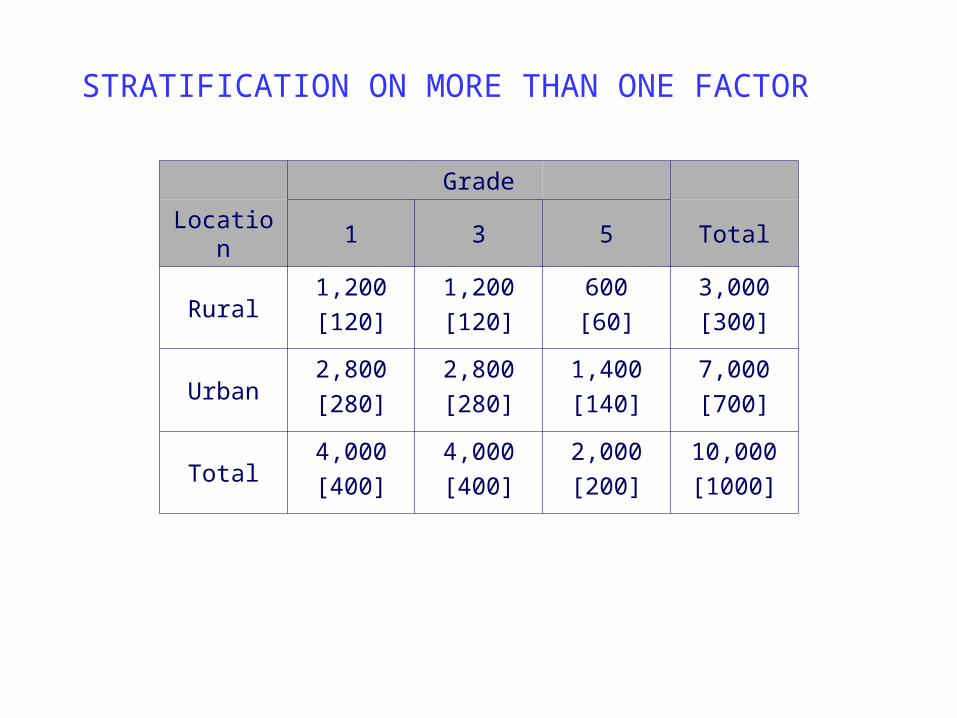
STRATIFICATION ON MORE THAN ONE FACTOR
Grade
Location 1 3 5 Total
Rural1,200[120]
1,200[120]
600[60]
3,000[300]
Urban2,800[280]
2,800[280]
1,400[140]
7,000[700]
Total4,000[400]
4,000[400]
2,000[200]
10,000[1000]
CLUSTER SAMPLING
• Instead of randomly selecting individuals– Units (groups) of individuals are identified– A random sample of units is then selected– All individuals in each unit are assigned to
one of the treatment conditions
• Units must be homogeneous in order to avoid bias
NONPROBABILITY SAMPLING STRATEGIES• Convenience sampling
– Captive or easily sampled population– Not random– Weak representativeness
• Quota sampling– Proportional stratified sampling is desired
but not possible– Participants with the characteristic of
interest are non-randomly selected until a set quota is met
SAMPLES, SAMPLE SIZE, AND SAMPLING ERROR• Sampling error = difference
between sample and population characteristics
• Reducing sampling error is the goal of any sampling technique
• As sample size increases, sampling error decreases
HOW BIG IS BIG?
• The goal is to select a representative sample—– Larger samples are usually more
representative– But larger samples are also more
expensive – And larger samples ignore the power
of scientific inference
ESTIMATING SAMPLE SIZE• Generally, larger samples are needed
when– Variability within each group is great– Differences between groups are smaller
• Because– As a group becomes more diverse, more data
points are needed to represent the group– As the difference between groups becomes
smaller, more participants are needed to reach “critical mass” to detect the difference