chapter six safety and access to justice - women nsw · chapter six safety and access to justice...
TRANSCRIPT

Chapter Six
Safety and access to justice
Women continue to be more vulnerable to particular types of crime, namely sexual and domestic-related violence. In 2011, sexual assault victims were twice as likely as men to experience domestic violence-related assaults.
106

Safety and access to justice
Key findings
NSW
Bureau Brief
Key Issues in Domestic Violence
Key Issues in Domestic Violence
107

Gender indicators: safety and access to justice
Topics
Linkages
Topic 1: Safety in families and households
Topic 2: Safety in the community
Topic 3: Transport-related safety
The justice system
108

Current levels and trends
Topic 1: Safety in families and households
amongst women in NSW is
1.1 Recorded domestic violence-related assaults
Current position
Gender gap:
The direction of change over time
Discussion
, encompasses acts of personal violence against someone with whom the perpetrator has, or has had, a domestic relationship. This includes spouses, people in de facto relationships, children, step-children, and other relatives. Domestic violence assaults reported here include physical violence and threats of violence, but not sexual offences or other forms of domestic violence (such as emotional or social abuse – preventing contact with friends and family or withholding money).
Trends and Patterns in Domestic Violence Assaults: 2001 to 2010
109

Figure 6.1
0
500
1,000
1,500
2,000
2,500
3,000
3,500
4,000
2011201020092008200720062005200420032002
Rate
per
100
,000
Non-Aboriginal menAboriginal men Non-Aboriginal womenAboriginal women
Projected Experimental Estimated Resident Australian Indigenous Population by RCMG region, age groups, 2001-2011 at 30 June 2011.
1.2 Sexual assaults against women
Current position
The direction of change over time
110
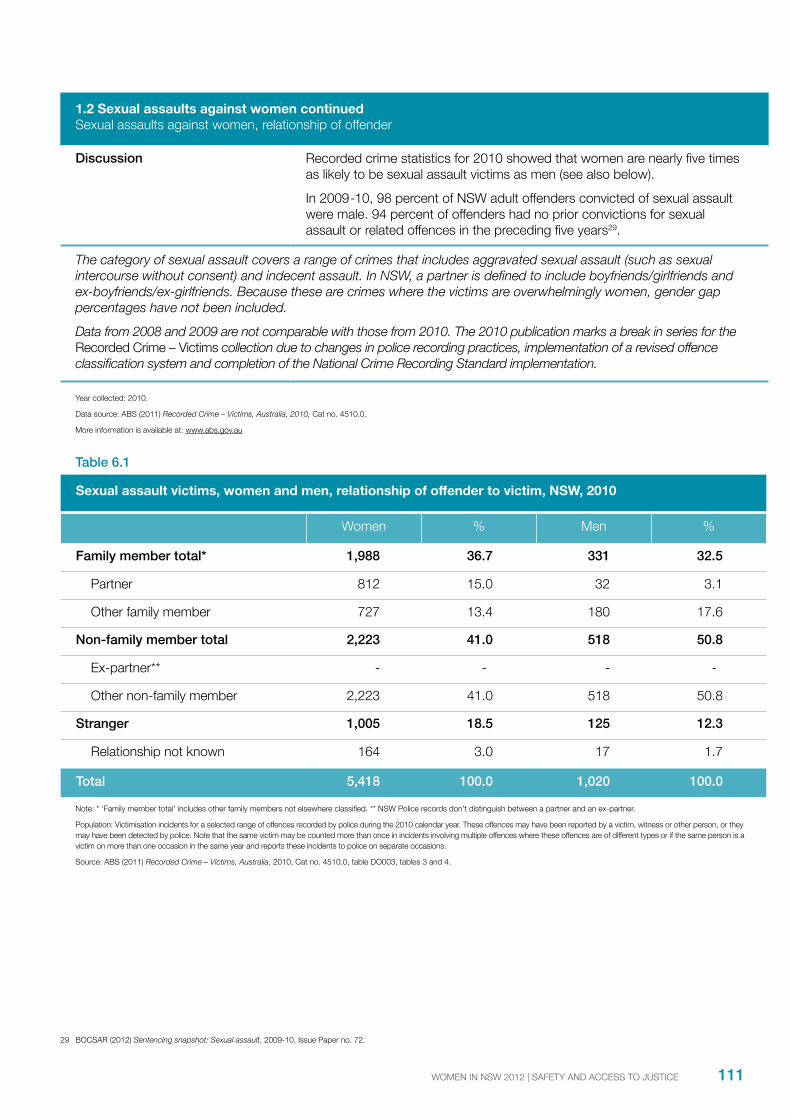
1.2 Sexual assaults against women continued
Discussion
The category of sexual assault covers a range of crimes that includes aggravated sexual assault (such as sexual
ex-boyfriends/ex-girlfriends. Because these are crimes where the victims are overwhelmingly women, gender gap percentages have not been included.Data from 2008 and 2009 are not comparable with those from 2010. The 2010 publication marks a break in series for the
collection due to changes in police recording practices, implementation of a revised offence
Recorded Crime – Victims, Australia, 2010,
Table 6.1
Women % %
Family member total* 1,988 36.7 331
Non-family member total 2,223
Stranger 12.3
Total 100.0 1,020 100.0
Recorded Crime – Victims, Australia
Sentencing snapshot: Sexual assault
111

1.3 Self-reporting of domestic violence by women attending NSW health services
Current position
The direction of change over time
Discussion
The NSW Health Routine Screening for Domestic Violence Program is implemented in antenatal services and early childhood services, and for women aged 16 and over who attend mental health and alcohol and other drug programs. All women who attend these services are asked standardised questions (except in certain circumstances, for example if the woman is accompanied by a family member over three years of age) about any incidence of violence from a
‘Violent, abusive or intimidating behaviour carried out by an adult against a partner or former partner to control and dominate that person’31. In 2009, 68 percent of eligible women were screened.
After the Questions: Impact of Routine Screening for Domestic Violence in NSW Health Services
Routine Screening for Domestic Violence Program: Snapshot Report 3, November 2005 and Snapshot Report 4, November 2006
112

Topic 2: Safety in the community
Women are around four times more likely than men to be victims of sexual o"ences and indecent assault, but less than half as likely as men to be victims of murder, non-domestic assault, and robbery.
2.1 Self-reported rates of victims of physical and threatened assault
Current position
Gender gaps:
The direction of change over time
Discussion
The crime victimisation rates reported here represent the percentage of the relevant population that has been a victim
anyone used physical force or violence against a respondent. It excludes incidents that occurred during the course of
physical assault.
which the person believed was able and likely to be carried out. It also includes incidents where a respondent was threatened in their line of work (eg while working as a security guard).
Crime Victimisation, Australia, 2010-11
113

Current position
Gender gap:
The direction of change over time
Discussion
individual is considered to be the victim of the crime’. Murder and steal from person have also been included.
Annual Report 2010-2011

Figure 6.2
Table 6.2
12 months ended September 2011
Total % Women
Sexual assault
Other sexual offences
Domestic violence related assault
Steal from person
Harassment, threatening behaviour and private nuisance
Total % Women
Murder
Non-domestic violence related assault
Robbery
500
1,000
1,500
2,000
2,500
3,000
3,500
4,000
Oct 10 - Sep 11Oct 09 - Sep 10Oct 08 - Sep 09Oct 07 - Sep 08Oct 06 - Sep 07Oct 05 - Sep 06
Vict
ims
of s
exua
l ass
ault
Women Men

3.1 Satisfaction with safety of public transport services
Current position
Gender gap:
The direction of change over time
Discussion
Topic 3: Transport- related safety
Personal Safety Survey
116

3.1 Satisfaction with safety of public transport services continued
Discussion continued Personal Safety Survey
the NSW Transport Customer Survey
The NSW was conducted to determine the level of satisfaction with NSW public transport services. It covered public transport users across the CityRail network, metropolitan bus contract regions and Sydney Ferries network. The survey was conducted by means of on-board distributed self-completion survey forms in May 2011, including weekdays and weekend days. Two of the survey questions related to safety: ‘Feeling safe at the station/stop/wharf’ and ‘Feeling safe while on the service’. Other questions related to accessibility, timeliness, cleanliness, comfort, convenience and ticketing.
Transport Customer Survey Personal Safety Survey
Transport Customer Survey Personal Safety Survey Australia
The proportion of women who feel safe between 6.31 am and 6.00 pm is 78 percent. This decreases by 6 percentage points, to 72 percent, between 6.01 pm and 6.30 am.
By contrast, men’s feeling of safety remains the same when waiting for public transport (76 percent), regardless of the time of day or night.
117
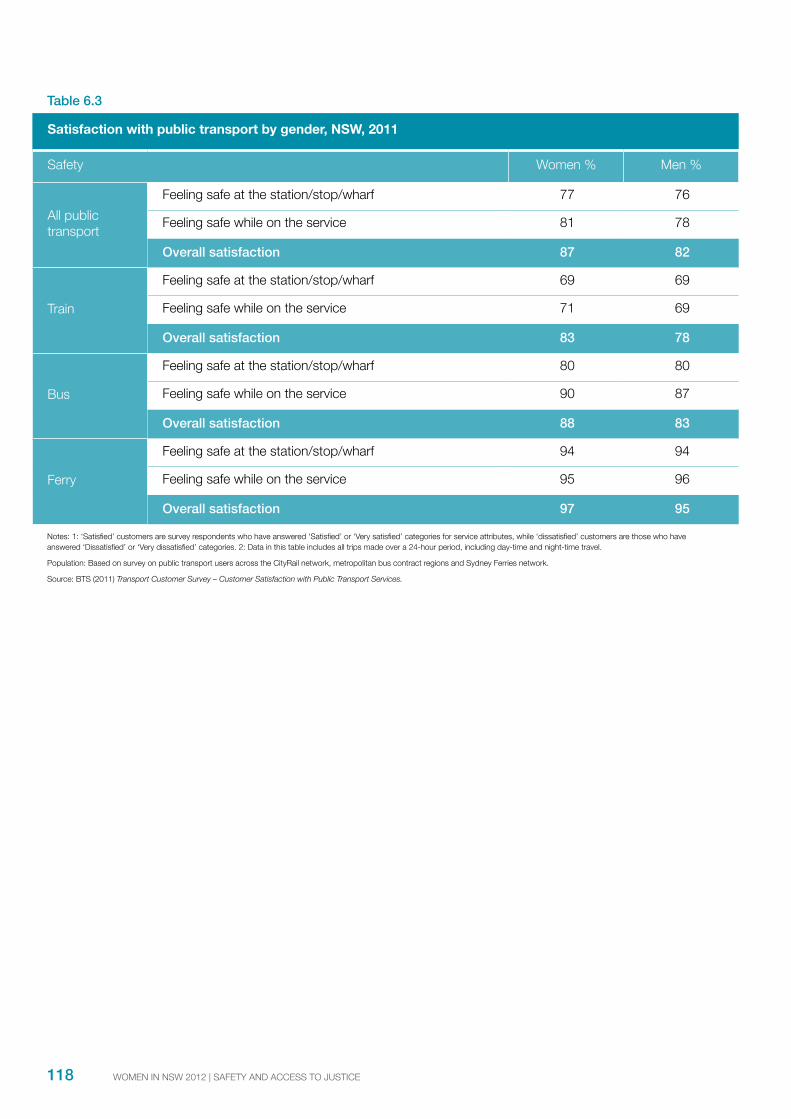
Table 6.3
Satisfaction with public transport by gender, NSW, 2011
Women %
Overall satisfaction 87 82
Overall satisfaction 83 78
Overall satisfaction 88 83
Overall satisfaction 97
Transport Customer Survey – Customer Satisfaction with Public Transport Services.
118

3.2 Frequency of walking and cycling
Current position
Gender gap:
The direction of change over time
Discussion
Data collected by the NSW BTS amongst residents of the Sydney Greater Metropolitan Area through the Household
of all travel undertaken for a nominated 24-hour period.
Household Travel Survey
Women’s experiences with transport reflect their sense of safety in their communities. There is a perception that, especially after dark, women do not feel safe waiting for or travelling on public transport.
119

Topic 4: The justice system
4.1 Rate of reporting personal crimes (including sexual assault)
Current position
Gender gaps:
The direction of change over time
Discussion
Crime Victimisation, Australia, 2010-11
120
The attrition of sexual offences from the New South Wales criminal justice system

4.1 Rate of reporting personal crimes (including sexual assault) continued
Discussion continued
Reporting rates used in the ABS publication are expressed as the percentage of victims whose most recent incident of crime had been reported to the police.
Crime Victimisation, Australia
121
Figure 6.3
0
10
20
30
40
50
60
70
80
2010-112009-102008-09
Perc
enta
ge (%
)
Robbery Sexual Assault
Crime Victimisation, Australia
Current position

Incidents involving a child victim (0-15 years) Incidents involving adults
0
2
4
6
8
12
10
201020092008201020092008
Perc
enta
ge (%
)
The Progress of Sexual Offences Through the NSW Criminal Justice System 2006-2010
The attrition of sexual offences from the New South Wales criminal justice system
The attrition of sexual offences from the New South Wales criminal justice system
The direction of change over time
Discussion
* The term attrition refers to the reduction in sexual offence case numbers as matters progress through the justice system.
The Progress of Sexual Offences Through the NSW Criminal Justice System, 2006-2010.
Recorded crime statistics for 2010 showed that women are nearly five times as likely to be sexual assault victims as men. In 2009-2010, 98 percent of NSW adult o!enders convicted of sexual assault were male.
122

Inve
stig
atio
n ph
ase:
Poli
ce re
port
to
com
men
cem
ent o
f pro
ceed
ings
Cour
t pha
se:
Cour
t ref
erra
l to
cour
t out
com
eiv
Stage 1Incidents reported to policei
Stage 2Clear up status 180 days
after reporting
Stage 3Criminal proceedings
commenced against suspect
Stage 4Cases finalised in courtiii
Stage 6Penalty
Incidents witha child victim
Incidents withadult victims
3,104 (63.5%) of these incidentsinvolving victims aged 0-15 were NOT cleared up within
180 days of reporting.
2,586 (62.8%) of these incidentsinvolving victims aged 16 or
older were NOT cleared up within180 days of reporting.
Stage 5Cases proven
No criminal proceedingswere commenced in 1,192 (66.9%)
of the incidents clearedwithin 180 days of reporting.
No criminal proceedings werecommenced in 777 (50.7%) of
the incidents cleared within 180 days of reporting.
236 (39.1%) persons chargedwith a child sexual offence were not found guilty. 1,258 (53.4%)
charges were not proven.
392 (49.8%) persons chargedwith a sexual offence not involving
children were not found guilty.995 (58.7%) finalised charges
for sexual offences not involvingchildren were not proven.
148 (40.3%) persons found guilty of a sexual offence involving children received a non-custodial
penalty. The most common non-custodial penalty was a
suspended sentence withsupervision (59 persons).
226 (57.2%) persons found guiltyof a sexual offence not involvingchildren received a non-custodial
penalty. The most commonnon-custodial penalty was a bondwithout supervision (66 persons).
1,782 (36.5%) of these incidentswere cleared up within180 days of reporting.
1,533 (37.2%) of these incidentswere cleared up within180 days of reporting.
4,886 sexual offenceincidents involving a victimaged 0-15 were reported to
NSW Police in 2010.
4,119 sexual offence incidentsinvolving victims aged
16 years or older were reportedto NSW Police in 2010.
Criminal proceedingsii werecommenced in 590 (33.1%) of theincidents cleared within 180 days
of reporting.
Criminal proceedingsii werecommenced in 756 (49.3%) ofthe incidents cleared within
180 days of reporting.
In 2010, 603 persons appeared in the NSW Local and Higher Courts
charged with at least one childsexual offence. 2,354 individual
charges for sexual offenceswere finalised.
In 2010, 787 persons appeared inthe NSW Local and Higher Courtscharged with at least one sexualoffence not involving children.
1,696 individual charges for sexualoffences were finalised.
Of the 603 persons charged,367 (60.9%) were found guilty ofat least one child sexual offence.Of the 2,354 individual finalised
charges for child sexual offences,1,096 (46.6%) were proven.
Of the 787 persons charged, 395 (50.2%) were found guilty of at
least one sexual offence notinvolving children. Of the 1,696
individual finalised charges for sexualoffences not involving children,
701 (41.3%) were proven.
Of the 367 persons found guiltyof at least one child sexual offence,
214 (58.3%) received a sentenceof full-time imprisonmentv and5 received periodic detention.
Of the 395 persons found guiltyof a sexual offence not involvingchildren, 166 (42.0%) received
a sentence of full-time imprisonmentv and 3 received
periodic detention.
123
The Progress of Sexual Offences Through the NSW Criminal Justice System 2006 to 2010.

Focus on penalties for selected personal crimes in NSW
In NSW Higher Courts in 2010, imprisonment was the most common penalty for personal crimes, including sexual assault.

4.3 Apprehended Domestic Violence Orders (ADVOs) granted
Current position
Gender gap:
The direction of change over time
Discussion
An Apprehended Domestic Violence Order (ADVO) is a court order which prohibits a person from behaviour that harasses or intimidates another person. ADVOs apply when a domestic relationship exists between the victim (complainant) and the abuser (defendant), such as spouses or separated spouses. The purpose of the ADVO is to protect the victim from acts of violence such as physical assault, non-physical abuse (harassment or intimidation), or damage or threatened damage to property. The victim does not have to be living with the person who abuses them.In cases where there is not a domestic relationship between the victim and the abuser, the court may issue an Apprehended Personal Violence Order (APVO). An APVO might apply in cases involving work colleagues or neighbours. The data in this section refers only to ADVOs, not APVOs.

Figure 6.6
0
100
200
300
400
500
600
700
800
201020092008200720062005200420032002200120001999199819971996
Rate
per
100
,000
pop
ulatio
n
Women Men
Apprehended Domestic Violence Orders granted, by residence of the person of interest, 2010
Outer South Western Sydney
Blacktown
Central Coast
Outer Western Sydney
Central Western Sydney
Canterbury-Bankstown
St George-Sutherland
Eastern Suburbs
Northern Beaches
Lower Northern Sydney
Central Northern Sydney
126

Apprehended Domestic Violence Orders granted, by residence of the person of interest, 2010 continued
Far West
North Western
Northern
Murrumbidgee
Central West
Murray
Mid-North Coast
Richmond-Tweed
South Eastern
Hunter
New South Wales (total)
Regional Population Growth Australia
How does NSW compare?
Gender Indicators, Australia
Gender Indicators, Australia
The imprisonment rate in NSW is slightly higher than in Australia as a whole (24.4 per 100,000 in NSW, compared to 22.9 per 100,000 nationally), and the o"ender rate is lower in NSW (738.5 per 100,000 in NSW, compared to 861.7 per 100,000 nationally).
127