chapter six: sectoral gravity models this chapter …
TRANSCRIPT

85
CHAPTER SIX: SECTORAL GRAVITY MODELS
6.1 Introduction
This chapter presents the results from the estimated sectoral gravity trade models.
Given that the results of the F-test reported in Chapter 3 showed the Fixed Effects
Model (FEM) as the most appropriate estimation procedure, this section will analyze
and interpret the estimated results from the FEM. Besides the F-test confirmation, the
FEM is also a logical model to use given that the country’s trading partners have
different and distinct features which renders then totally different. For instance, there
is no doubt that trading partners such as USA and Zambia, or Canada and
Mozambique are totally different. Nevertheless, the pooled model equation which
assumes that Botswana’s trading partners for each of the three sectors are the same
will also be presented, and interpreted only for dummy variables which cannot be
estimated by the FEM. In estimating gravity models for both pooled and FEM
models, Equations (12) and (13) will be employed, with the difference between the
two being that the latter has one extra explanatory variable to cater for IIT in the
diamond model, and INT in textiles, and meat and meat products models. As will be
shown, since estimations from Equation (13) in each of the three gravity models have
more variables that are significant and also have higher adjusted-R2 and F-values, this
section will mainly analyze results estimated by Equation (13), although results
estimates from Equation (12) will also be shown.
As alluded to before, Ghosh and Yamarik (2004) point out that a total of 48
explanatory variables have been used in the gravity equation in literature. This
presents a potential challenge in terms of which variables to choose for each of the
three gravity trade model equations. Whilst a number of these explanatory variables
have been experimented with in the estimations, the fact of the matter remains the
same that no one has ever designed an experiment that is free of bias, and no one can
(Leamer, 1981). As such, robustness analysis whereby the coefficients of the final
variables selected for each of the gravity models have been checked for consistency
by way of adding or deleting the explanatory variables have been done. The results of
this robustness investigation indicate that the coefficients of the explanatory variables

86
presented in this section do not change significantly as variables are added or deleted
from the respective gravity trade model equations. Table A3 to Table A5 in Section 3
of the Appendices presents the results of the robustness estimations. The
experimentation with a number of these potential explanatory variables also acts as a
reliability check especially given that results from these gravity models estimations
will be used further to investigate export destinations with untapped potential exports
in Chapter 7.
In terms of interpretation of explanatory variables, Jayasinghe and Sarker (2007)
argue that because of the double-logarithmic representation of the gravity Equations
(12) and (13) to be estimated, the parameter estimates on non-dummy variables such
as Yik, kik/lik, Yj, Dij, Pi, Пj and exri,usa variables can be interpreted as elasticities. For
instance, in both Equations (12) and (13), α1 shows the percentage change in Xijk
induced by a 1% change in Yik while holding all other variables constant.
6.2 Diamond sector
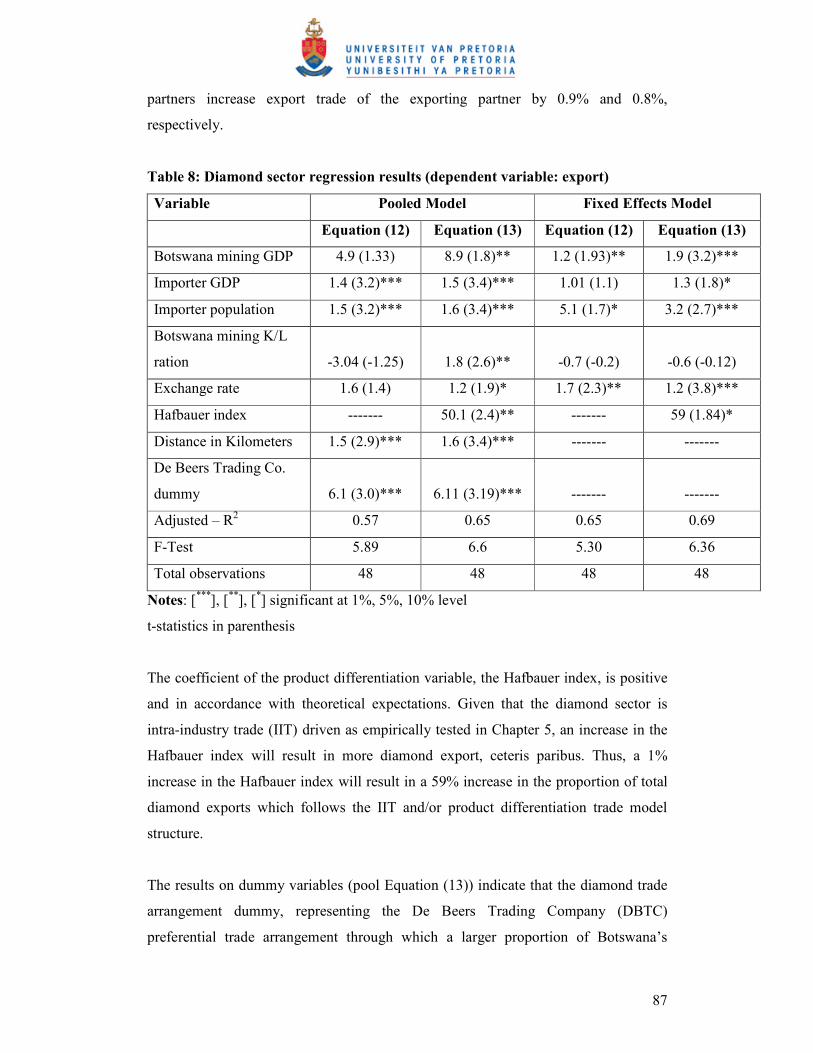
The results from the gravity trade model estimations of Equations (12) and (13)
presented in Table 8 show that both Botswana’s sectoral GDP and the importers’
GDP are important factors which encourage exportation of diamond. A 1% increase
in GDP in the mining sector in Botswana and a 1% rise in the GDPs of importing
countries will increase diamond export by 1.9% and 1.3%, respectively. This positive
relationship is, as explained earlier, according to theoretical expectations. These
results compare well with the findings of most studies on gravity equations estimated
on trade, including a study by Chan-Hyun (2001), Jayasinghe and Sarker (2007) and
Rojid (2006). The Chan-Hyun study showed that Korea’s mineral exportation was,
among other factors, propagated by both the importers’ and exporter’s GDPs. In
particular, the paper found that a 1% increase in the product of Korea’s GDP and the
GDP of any of its trading partners resulted in an increase in mineral exportation by
1.1%. In the case of the Jayasinghe and Sarker’s (2007) study, a 1% increase in the
GDPs of the exporter and importer trading partners increased the export trade of the
exporting partner by 8.24% and 17.49%, respectively. Finally, Rojid’s (2006) findings
showed that a 1% increase in GDP of both the importing and exporting trading
87
partners increase export trade of the exporting partner by 0.9% and 0.8%,
respectively.
Table 8: Diamond sector regression results (dependent variable: export)
Variable Pooled Model Fixed Effects Model
Equation (12) Equation (13) Equation (12) Equation (13)
Botswana mining GDP 4.9 (1.33) 8.9 (1.8)** 1.2 (1.93)** 1.9 (3.2)***
Importer GDP 1.4 (3.2)*** 1.5 (3.4)*** 1.01 (1.1) 1.3 (1.8)*
Importer population 1.5 (3.2)*** 1.6 (3.4)*** 5.1 (1.7)* 3.2 (2.7)***
Botswana mining K/L
ration -3.04 (-1.25) 1.8 (2.6)** -0.7 (-0.2) -0.6 (-0.12)
Exchange rate 1.6 (1.4) 1.2 (1.9)* 1.7 (2.3)** 1.2 (3.8)***
Hafbauer index ------- 50.1 (2.4)** ------- 59 (1.84)*
Distance in Kilometers 1.5 (2.9)*** 1.6 (3.4)*** ------- -------
De Beers Trading Co.
dummy 6.1 (3.0)*** 6.11 (3.19)*** ------- -------
Adjusted – R2 0.57 0.65 0.65 0.69
F-Test 5.89 6.6 5.30 6.36
Total observations 48 48 48 48
Notes: [***], [**], [*] significant at 1%, 5%, 10% level
t-statistics in parenthesis
The coefficient of the product differentiation variable, the Hafbauer index, is positive
and in accordance with theoretical expectations. Given that the diamond sector is
intra-industry trade (IIT) driven as empirically tested in Chapter 5, an increase in the
Hafbauer index will result in more diamond export, ceteris paribus. Thus, a 1%
increase in the Hafbauer index will result in a 59% increase in the proportion of total
diamond exports which follows the IIT and/or product differentiation trade model
structure.
The results on dummy variables (pool Equation (13)) indicate that the diamond trade
arrangement dummy, representing the De Beers Trading Company (DBTC)
preferential trade arrangement through which a larger proportion of Botswana’s

88
diamond sells are handled, positively affect the mineral’s exportation. This sign is
theoretically expected, since trade arrangements are mostly aimed to improve trade
flows, exports and imports. These results are also supported by the findings of Rose
(2005) whereby PTA in the form of regional trade arrangements (RTA) increased
trade for both export and import gravity equations.
The positive sign on distance is wrong as theory predicts that it should be negative
under the assumption that the longer distances between trading partners increase
costs, hence negatively affecting trade flows. Three possible reasons for the wrong
sign can be postulated. First, since diamond is a high valued product, and its
exportation mostly uses air transport, as opposed to sea or road transport, distance
may not be a major huddle. Second, purchase of diamond is associated with rich
people. Thus, for the rich diamond buyers, what matters is the need to have diamond
products to oestantiously or proudly show off their riches and hence, costs (including
transport) do not matter. Third, as a means of avoiding the sector’s activities falling
into the trap of ‘blood diamond’, like other African countries, Botswana prefers
trading with buyers in far nations, as opposed to customers in the domestic market or
neighbouring countries. The assumption being that, with proximity buyers, there will
be a temptation by many potential illegal diamond miners to come into the industry as
they will be able to illegally sell the diamond quickly to nearby buyers located in the
country or neighbouring countries. A positive sign for the distance coefficient,
although rare, is however also present in literature. For instance, Jayasinghe and
Sarker’s (2007) gravity estimations on red meat found a positive coefficient on
distance on two (i.e, 1985-1987 and 1988-1990) of the five time periods for which the
estimations were done.
The importer countries’ population, as shown in Table 8, is associated with an
increase in diamond export and this implies that as the populations for the trading
partner countries grow, the international market expands and there will be an increase
in the export of diamond. This result is in line with Rose’s (2005) study which also
found a positive coefficient for the importer country’s population.
A depreciation of the pula is associated with an increase in diamond exports and this
is according to theoretical expectations. Table 8 indicates that a1% depreciation (or

89
increase in exchange rate) will increase Botswana export trade by 1.2%. These results
compare well with the findings of most studies on gravity equations estimated on
export trade, including a study by Rahman et al, (2006), Rahman (2003) and Molinari
2003. Rahman et al, (2006) found that a 1% depreciation (or increase in exchange
rate) resulted in an increase in Bangladesh’s exports by 0.077%, while Molinari
(2003) found that a 1% increase in exchange rate (depreciation) increased exports by
a range of 0.023% to 0.123% for the eight sectoral exports that were investigated.
Comparing the performance of the two equations, for both pooled and FEM, using the
adjusted R2 and F-test (Equation (13)), the modified gravity model performs better
than the traditional gravity trade model of Equation (12).
6.3 Textile sector
The textile sector’s exports increased as the GDP for the importing countries and the
Botswana manufacturing sector’s GDP increased. Specifically, textile exports
increased by 1.1% and 1.5%, respectively, when both the GDP for Botswana’s
manufacturing sector and that of importing countries increased by 1%. These results
are shown in Table 9. This result is closer to Rojid’s (2006) findings where a 1%
increase in the GDP of the importing country increased exports by 0.9% while a rise
in the GDP of the exporting trading country increased exports by 0.8%.
The estimated coefficient for distance, from the pooled Equation (13), has the
expected negative sign and is statistically significant. For instance, a 1% increase in
distance will reduce textile exports by approximately 2.3%. This negative finding is in
line with most studies, for instance, Marques (2008), Kandogan (2008), and Baier and
Bergstrand (2005), to mention just three papers.
The dummy variable representing Botswana’s textile export trade under AGOA is
positive and significant. This is in agreement with trade theory which expects trade to
increase in the presence of regional trade arrangements. A study by Eita and Jordaan
(2007) found that the SADC regional trade arrangement was one of the factors which
boosted South Africa’s wood exports to other regional member countries.

90
The coefficient RCAI is positive, and according to theoretical expectations. Given
that the textiles sector is INT driven, as empirically tested in Chapter 5, an increase in
the RCAI index will result in more textile export, ceteris paribus. Thus, a 1% increase
in the RCAI index will result in a 0.5% increase in the proportion of total textile
exports which follows the INT model structure.
Table 9: Textiles regression results (dependent variable: export)
Variable Pooled Model Fixed Effects Model
Equation (12) Equation (13) Equation (12) Equation (13)
Botswana
manufacturing GDP 2.83 (3.89)*** 2.56 (2.1)** 1. (2.1)** 1.1 (1.8)**
Importer GDP 0.92 (4.6)*** 0.91 (4.58)*** 1.6 (1.2) 1.5 (2.4)**
Importer population 0.57 (1.82)* 0.57 (1.83)* 2.1 (2.3)** 2.6 (3.7)***
RCAI for textiles ------- 0.74 (2.7)*** ------- 0.50 (2.1)**
Importer Inflation 0.01 (1.83)* 0.01 (1.81)* 0.001 (2.2)** 0.01 (3.8)***
Botswana manuf. K/L
ration -1.57 (-1.65)* -1.61 (-1.41) -0.24 (-0.04) -0.22 (-0.03)
Exchange rate 0.1 (2.2)** 0.2 (2.9)*** 0.12 (1.8*) 0.22 (2.5)**
AGOA dummy 4.04 (2.69)*** 2.4 (6.8)*** ------- -------
Distance -2.4 (-3.83)*** -2.3 (-3.82)*** ------- -------
Adjusted – R2
0.61 0.66 0.64 0.69
F-Test 15.30 15.61 9.26 9.80
Total observations 192 192 192 192
Notes: [***
], [**
], [*] significant at 1%, 5%, 10% level
t-statistics in parenthesis
The positive coefficient on exchange is according to theory. Tabulated results indicate
that 1% depreciation increases textile exports by 0.22%. This result is closer to
Rahman (2003) findings where a 1% depreciation (or increase in exchange rate)
increased exports by 0.34%.

91
Comparing the performance of the two equations using the adjusted R2 and F-test, the
modified gravity trade model Equation (13) relatively performs better than the
traditional or basic gravity trade model Equation (12).
6.4 Meat and meat products sector
Increases in both Botswana’s agricultural GDP and importers’ GDP, as shown in
Table 10, result in a positive effect on the sectoral meat export. For instance, meat and
meat products exports increased by 1.9% and 0.74%, respectively, when the GDP for
Botswana’s agriculture sector and that of importing countries increased. These
positive signs, as explained above, are according to theoretical expectations and
compare well with studies by such researchers as Eita and Jordaan (2007), and Rose
(2005), who among others, also found positive impacts of both the importers’ GDP
and exporters’ GDP on exports of a given partner.
The importer’s inflation has a negative sign, implying that an increase in the inflation
levels of the trading partners will cause them to reduce their expenditure, including
imports of meat from Botswana. For example, a 1% rise in importers’ inflation will
reduce meat imports from Botswana by 0.21%.
The negative coefficient on distance is according to theoretical expectation, whereby
an increase in distance will increase such things as transaction and transportation
costs, among other expenses, thus resulting in a reduction in exports of meat and meat
products. According to Table 10, a 1% increase in distance reduces Botswana’s meat
exports by 0.77%. Previous studies by Marques (2008) Kandogan (2008), Baier and
Bergstrand (2005), among others also found a negative sign for the coefficient of
distance in their respective gravity trade equations.
The coefficient RCAI is positive, and according to the theoretical expectations. Given
that the meat and meat products sector is INT driven, as empirically tested in Chapter
5, an increase in the RCAI index will result in more textile export, ceteris paribus.
Thus, a 1% increase in the RCAI index will result in a 0.43% increase in the
proportion of total meat and meat exports which follow the INT model structure.

92
Although, the capital-labour ratio is correctly signed, it is however not statistically
significant.
The dummy variable representing Botswana’s meat and meat products export trade
under Cotonou agreement positive and significant. This is in agreement with trade
theory which expects trade to increase in the presence of regional trade arrangements.
A study by Eita and Jordaan (2007) found that the SADC regional trade arrangement
was one of the factors which boosted South Africa’s wood exports to other regional
member countries.
Table 10: Meat regression results (dependent variable: export)
Variable Pooled Model Fixed Effects Model
Equation (12) Equation (13) Equation (12) Equation (13)
Botswana agriculture
sector GDP 1.8 (3.5)*** 2.1 (2.5)**
1.0 (2.5)***
1.9 (3.5)***
Importer GDP 0.61 (2.86)*** 0.63 (2.9)*** 0.74 (2.2)** 0.74 (1.8)*
Importer Inflation -1.23 (-3.72)*** -1.2 (-3.28)*** -0.19 (-2)** -0.21 (-3.7)***
RCAI for meat ------- 0.52 (2.67)** ------- 0.43 (2.1)**
Botswana agriculture
K/L ration 2.91 (0.55) 1.11 (4.6)***
1.1 (0.9)
2.4 (1.4)
Exchange rate 1.3 (2.3)** 1.9 (1.8)* 0.9 (1.2) 1.4 (2.2)**
Cotonou dummy 0.9 (1.8)** 1.2 (2.3)** ------- -------
Distance -0.66 (-1.50) -0.77 (-1.72)* ------- -------
Adjusted – R2
0.62 0.67 0.64 0.65
F-Test 6.12 6.5 5.16 7.3
Total observations 88 88 88 88
Notes: [***
], [**
], [*] significant at 1%, 5%, 10% level
t-statistics in parenthesis
A depreciation of the pula is associated with an increase in meat and meat products
exports and this is according to theoretical expectations. Table 10 shows that a1%
depreciation (or increase in exchange rate) will increase Botswana’s meat export trade

93
by 1.4%. These results compare well with the findings of most studies on gravity
equations estimated on export trade, including a study by Molinari (2003). The
Molinari (2003) investigation found that a 1% increase in exchange rate
(depreciation) increased exports by a range of 0.023% to 0.123% for the eight sectoral
exports that were investigated.
Comparing the performance of the two equations in terms of the maximum number of
significant coefficients in each equation, Table 10 indicates that the modified gravity
model Equation (13) performs better than the traditional gravity model Equation (12).
6.5 Conclusions
This chapter investigated the determinants of sectoral exports from Botswana for the
period 1999 to 2006 and these estimations were done for the country’s exports of
diamond, textile, and meat and meat products sectors. The following are the
conclusions that emanated from the empirical evidence done on the three sectors.
i. In all the three sectoral results, the respective Botswana’s sectoral GDPs and
the GDPs for the importing countries were positive and statistically significant
determinants of Botswana’s sectoral exports. This implies that growth in the
GDP or economic activities in mining, manufacturing and agriculture
enhanced Botswana’s diamond, textiles, and meat and meat products,
respectively.
ii. With the exception of diamond exports, results from the sectoral gravity
estimations indicate that distance retarded exports, and this is expected from
theory. The negative correlation implies that, as distance increased from
Botswana to any trade partner, the country’s export trade from both textiles
and meat and meat products sectors declined.
iii. Regional trade arrangements contributed positively to the country’s exports in
all the three sectors for the period under review. For instance, in the case of
textiles, the AGOA trade preferences in the form of duty-free-quota-free

94
(DFQF) resulted in Botswana’s textiles entering the USA market freely since
2000 than was the case before the arrangement was initiated. This has
increased exports of textiles.
iv. The statistically significant positive signs on the IIT trade variable in the
diamond gravity equation and INT variables in both textiles and meat and
meat products indicate that product differential in the diamond sector; and
factor endowments in the other two sectors promote sectoral exports.
v. The relationship between exchange rate on one hand, and exports from the
sectors on the other hand was found to be positive and statistically significant.
This implies that currency devaluation leads to increase in exports across these
three sectors.
6.7 Policy recommendations
The findings from the gravity trade model estimations suggest the following policy
recommendations for consideration by Botswana policy makers.
i. Given that higher GDPs for importing partners promote Botswana’s export
trade, the country needs to continue its engagement especially with those
partners with higher GDPs. This can be easily achieved if the country remains
committed in such trade arrangements as the envisioned Economic Partnership
Agreement (EPA) with the EU, and the AGOA trade arrangements with the
USA. Continued engagement with high income countries can also be
enhanced if the country implements the various agreed trade liberalizations
promulgated by the WTO so that it can get reciprocal treatment and trade
preferences from some of the high income and developed WTO members
ii. The fact that distance retards exports especially in textiles, and meat and meat
products means that the country should increase its trade as much as possible
95
with proximity countries. Botswana, besides being a full member of the
already advanced and highly integrated Southern African Customs Union
(SACU), should also move together with other member states of the Southern
African Development Community (SADC) in their endeavour to move from
the current Free Trade Area (FTA) to higher stages of regional integration
such as Customs Union (CU), Common Market (CM), Monetary Union (MU)
and Economic Union (EU). These higher stages of integration, especially with
geographically close countries will also mean enlarged markets for
Botswana’s exports, among other benefits.
iii. To continue increasing its exports, the country needs to remain in its current
trade arrangements, ranging from bilateral, regional (for instance with SACU
and SADC), inter-regional (with EU) and multilateral (at WTO level). The
country can also consider entering into new preferential trade arrangements
not only with the current rich countries, but also with emerging and fast
growing economics such as China, India and Brazil, among others, as they
provide huge future potential in terms of markets for Botswana’s exports.

96
CHAPTER SEVEN: SECTORAL EXPORT TRADE POTENTIALS
7.1 Introduction
Following estimations of Botswana’s three sectoral gravity equations for bilateral
export flows in Chapter 6, the study continues with the next step of estimating the
trade potential for the same sectors. Thus, in this Chapter, the sectoral model
estimates from the previous chapter are employed to predict Botswana's sectoral trade
with all the relevant countries in the respective samples.
This section of the thesis is important especially at this juncture given that the country
is still finalizing its national export strategy policy, which inter alia, seeks to promote
exports from textiles, and meat and meat products sectors, among others, in its drive
to diversify away from diamond exports. As such, the policy implications associated
with the presence of unrealized trade potential with relevant trading countries in the
above sectors would, according to Ram and Prasad (2007), "extend from the necessity
of country-specific trade promotional campaigns and bilateral integration to the need
to anticipate relevant distributional changes due to the effect of the expansion in
bilateral flows in the near future". This section of the thesis is also helpful as it will
assess the extent to which Botswana has some unrealized sectoral trade potential with
its relevant major (sectoral) trading partners and with its diverse preferential trade
partners with whom it has a number of operational trade arrangements. Lastly, the
study will provide valuable indicators for current negotiations for the new Economic
Partnership Agreement (EPA) with the European Union to be introduced at any time
from 2010.
7.2 Objectives
Given the above introduction, the main objective of this chapter is to empirically
investigate Botswana's trade potential for its three sectors under study. In pursuit of

97
this objective, the following are the three questions that this chapter will try to
answer:
i. With which trading partners has Botswana reached its trade potential in these
three sectors?
ii. With which trading countries has Botswana gone beyond its trading potential
in these three sectors?
iii. With which partner countries does Botswana still have untapped (or
unrealized) trade potential in these three sectors?
7.3 Export trade potential
In this section, coefficients from gravity trade models estimated in Equation (13) of
Chapter 6, also presented below, will be used to analyse the unrealised export
potential for the country’s sectoral exports.
ijikusaijj
ijjijkik
ikikijk
INTIITexrP
DYPTAL
KYX
εαααα
αααααα
+++Π+
++++
++=
)(lnlnln
lnlnlnlnln
9,876
543210 (13)
The gravity trade model Equation (13) will be simulated to get within export potential
for all the three sectors, diamond, textiles, and meat and meat products. This is mainly
because results from this equation are more significant than those from Equation (12)
for these three sectors’ gravity estimations presented in the previous chapter. As
indicated earlier in Chapter 6, the coefficients of these gravity models have been
tested for sensitivity and robustness, and the conclusion made was that they are
relatively stable. Thus, this section uses the coefficients of each of the three gravity
equations estimated in the previous chapter assuming them to be reliable.
98
Analysis of untapped trade potential with some regional groupings have been chosen
keeping in mind the current and approaching preferential trading arrangements that
are already operational (e.g., SACU and SADC FTA) as well as those that are in
offering in the near future (EU, SADC CU, EPA). The regional blocs that will be
analyzed for sectoral trade potential with Botswana are the group of countries under
the SADC and SACU. Furthermore, this chapter will investigate Botswana's export
trade potential with the European Union (EU) under the Economic Partnership
Agreement (EPA) regime which is expected to enter into force any time from January
201024.
Having estimated the respective sectoral gravity models for bilateral export trade
flows between Botswana and its respective trading partners, the study proceeds to
estimate the export trade potential for the country. This section relies on the sectoral
model estimations from the previous chapter. The ratio of sectoral export trade
potential (P) as simulated/predicted by the model and actual sectoral export trade (A),
i.e., (P/A), will be used to analyze the future direction of export trade for the country's
three sectors. In terms of interpretation, in a case where the value of the ratio (P/A)
exceeds 1, that will indicate existence and evidence of export trade potential between
Botswana and the country in question. Following Batra (2004) and the International
Trade Centre (ITC) (2005, 2003), evidence of unrealized export trade in turn implies
the potential for Botswana to expand its exports to that country. On the other hand, if
the value of (P/A) is less than 1, it indicates that Botswana has exceeded its trade
potential with that country. In short, values of (P/A) can either be greater than or less
than 1, with the former indicating countries with which Botswana has potential for
expansion of export trade in the foreseeable future, while the latter shows trading
partners with which Botswana has already exceeded its trade potential.
Conversely, the absolute difference between the potential and actual level of export
trade, that is, the value of (P-A) can also be used to indicate whether a country has
unrealized export trade potential with Botswana or not. In this case, a positive value
will indicate unrealized export trade potential, thus the possibility of future export
24 EPAs were supposed to have come into effect from January 1st 2008. However, due to delays in completion of the negotiations, they have been postponed to at least enter into force anytime in 2010.

99
trade expansion into that country while a negative value will indicate that the
country’s exports have already exceed their trade potential.
7.3.1 Export trade potential in diamond sector
An analysis of Botswana’s diamond export trade potential indicates that there is, on
average, untapped potential in three destination countries, Israel, South Africa and
Switzerland, as shown in Table A6 of the Appendices. Figure 4 graphically depicts
the trade potential for Israel. Note that South Africa and Switzerland could not be
depicted graphically due to the fact that the range between some figures across the
years is so big resulting in drawing scale problems. Existence of unrealized export
potential implies that Botswana should export diamond products to these partner
countries so as to exhaust the unrealized trade potential. On the other hand, the
country has exceeded its export trade potential in diamonds with Belgium, United
Kingdom (UK) and United States of America (USA).
Figure 4: Diamond export potential
Israel
0.00
10.00
20.00
30.00
40.00
50.00
60.00
70.00
1999 2000 2001 2002 2003 2004 2005 2006
Years
US$m Actual
Potential
100
7.3.1.1 Botswana’s diamond trade potential with regional groupings
This part of the study will analyze the country’s export trade potential with regional
trade groups to which Botswana is a member. The analysis is done on both already
existing regional trade blocs as well as those to be operationalized in the near future,
using estimates from the gravity model. In particular, this section will investigate the
group of trading partners constituting SADC, SACU, and the EU (both under the
Cotonou agreement and under the envisioned Economic Partnership Agreement
(EPA)).
Among the trading partners who are members of the EU, there is only one country,
Switzerland, where there is unrealized trading potential for Botswana's diamond
exports according to Table A8 of the Appendices. This suggests that Botswana and
Switzerland are trading much less than what the gravity model predicts and this
implies that Botswana has untapped export trade potential in diamond with this EU
trading bloc nation. This scenario suggests that it will be an advantageous move for
Botswana to make all efforts to implement its free trade area (FTA) commitments
under the envisioned EPA with the EU.
Table A9 of the Appendices shows the trading partners in America and EU regional
groups where Botswana has exceeded its export trade potential in the export of
diamond. This implies that Botswana and these respective countries in these regional
groupings are trading more than the gravity model predicts and this is an indication of
a successful partnership, using the trade dimension only, among trading countries
(International Trade Centre (ITC) (2005, 2003).
7.3.2 Export trade potential in textile sector
When Botswana’s textile export potential is compared among different trading
partners, maximum potential is indicated for Ghana and Mozambique. Figure 5 also
shows that Canada, Denmark, Finland, Saudi Arabia, Spain, and Switzerland are the
other export destinations in which textiles exports from Botswana have unexploited
trade potential. This suggests that Botswana should export textile products to these

101
countries so as to exhaust the unrealized trade potential. See also Table A10 in the
Appendices.
Figure 5: Textile export potential
Canada Denmark
0
10
20
30
40
50
60
70
80
90
100
1999 2000 2001 2002 2003 2004 2005 2006
Years
US$ '000'
Actual Potential
0
5
10
15
20
25
30
1999 2000 2001 2002 2003 2004 2005 2006
YearsUS$ '000'
Actual Potential
Finland Ghana
0
2
4
6
8
10
12
14
16
1999 2000 2001 2002 2003 2004 2005 2006
Years
US$ '000'
Actual Potential
0
1
1
2
2
3
1999 2000 2001 2002 2003 2004 2005 2006
Years
US$ '000'
Actual Potential

102
Mozambique Spain
0
20
40
60
80
100
120
1999 2000 2001 2002 2003 2004 2005 2006
Years
US$ '000'
Actual Potential
0
20
40
60
80
100
120
140
1999 2000 2001 2002 2003 2004 2005 2006
Years
US$ '000'
Actual Potential
Saudi Arabia Switzerland
0
10
20
30
40
50
60
70
80
1999 2000 2001 2002 2003 2004 2005 2006
Years
US$ '000'
Actual Potential
0
10
20
30
40
50
60
1999 2000 2001 2002 2003 2004 2005 2006
Years
US$ '000'
Actual Potential
7.3.2.1 Botswana’s textile trade potential with regional groupings
In this section the study analyzes Botswana’s export trade potential with sets of
countries defined by some preferential trading arrangements which are already in
existence as well as those to be operationalized in the near future, using estimates
from the gravity model. In particular, the thesis investigates the group of trading
partners constituting the SADC, SACU, USA’s AGOA and EU (both under Cotonou
agreement and the envisioned EPA).
103
Among the trading partners who are members of EU, the highest unrealized trading
potential in textile for Botswana, according to the calculation in Table A12 of the
Appendices, is shown in Spain, followed by Switzerland and Finland, among other
countries. On the other hand, highest export textile trade potential according to the
magnitude of the trade potential calculation is indicated for Mozambique, followed by
Tanzania and lastly by Swaziland, for countries in the SADC regional configuration.
Thus, tabulated information shows that Botswana and its respective trading partners in
the EU and SADC are trading much less than what the gravity model predicts and this
implies that Botswana has untapped export trade potential in textiles with countries in
both the EU and SADC. This scenario suggests that it will be a noble move for
Botswana to continue making all efforts to implement its free trade area (FTA)
commitments under the SADC and also for the country to enter into an EPA with the
EU, i.e. expected to be implemented any time from 2010.
Table A13 shows the trading partners in America, EU and SADC (SACU) regional
groups where Botswana has exceeded its export trade potential in textile products.
This implies that Botswana and these respective countries in these regional groupings
are trading more than the gravity model predicts. This is an indication of a successful
partnership among trading countries (International Trade Centre (ITC) (2005, 2003).
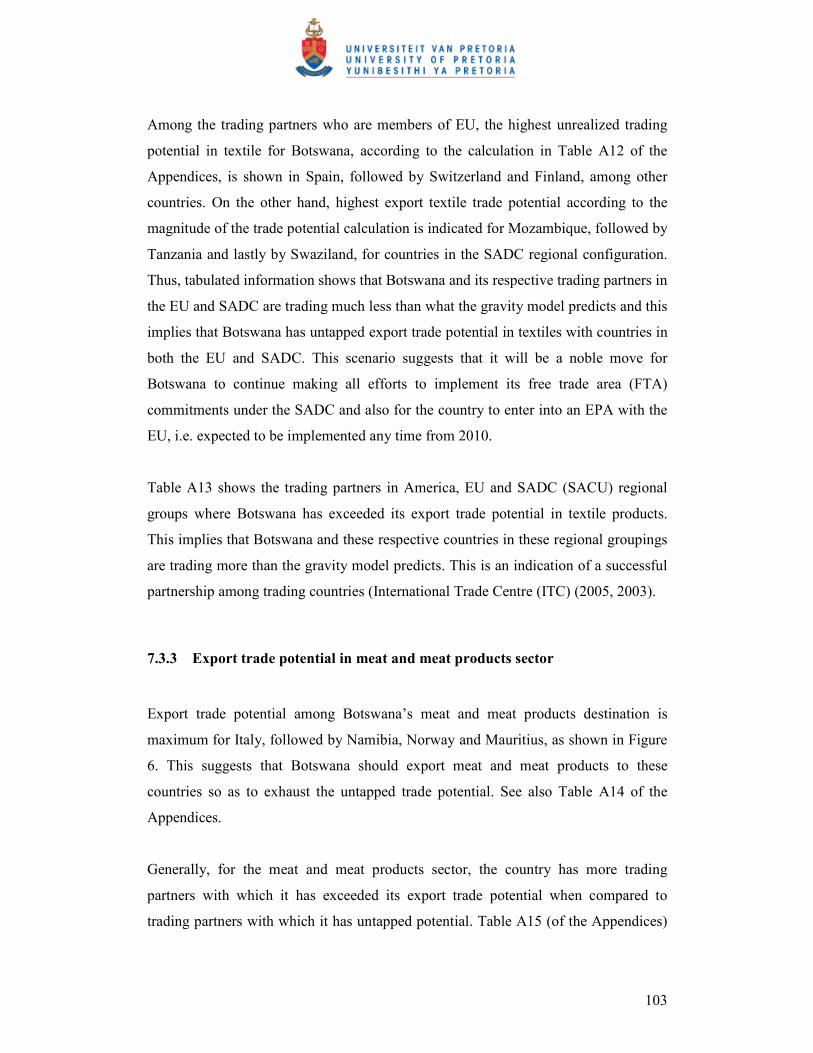
7.3.3 Export trade potential in meat and meat products sector
Export trade potential among Botswana’s meat and meat products destination is
maximum for Italy, followed by Namibia, Norway and Mauritius, as shown in Figure
6. This suggests that Botswana should export meat and meat products to these
countries so as to exhaust the untapped trade potential. See also Table A14 of the
Appendices.
Generally, for the meat and meat products sector, the country has more trading
partners with which it has exceeded its export trade potential when compared to
trading partners with which it has untapped potential. Table A15 (of the Appendices)

104
presents the countries that Botswana has exceeded its export potential during the
period 1999 to 2006.
Figure 6: Meat and meat products export potential
Italy Mauritius
0
200
400
600
800
1,000
1,200
1,400
1,600
1,800
1999 2000 2001 2002 2003 2004 2005 2006
Years
US$ '000'
Actual Potential
0
20
40
60
80
100
120
140
160
180
200
1999 2000 2001 2002 2003 2004 2005 2006
YearsUS$ '000'
Actual Potential
Namibia Norway
0
20
40
60
80
100
120
140
1999 2000 2001 2002 2003 2004 2005 2006
Years
US$ '000'
Actual Potential
0
1,000
2,000
3,000
4,000
5,000
6,000
7,000
1999 2000 2001 2002 2003 2004 2005 2006
Years
US$ '000'
Actual Potential
105
7.3.3.1 Meat and meat products trade potential with regional groupings
At regional level, Table A16 of the Appendices indicates that the EU (Italy) and
SADC (Mauritius and Namibia) are the trading blocs with which Botswana has
unrealized export trade potential. On the other hand, Germany, the Netherlands and
United Kingdom from the EU, and South Africa and Zimbabwe from SADC, are the
countries with which Botswana has successful bilateral partnerships given that trade
potential with these countries in meat and meat products has been exceeded. See
Table A17 of the Appendices.
7.4 Comparison with other studies
The unrealized export potential results are not unique to the findings of this thesis, but
compares well with other previous studies which also found untapped potential in
various trading partners for a given country’s exports. For instance, Ram and Prasad’s
(2007) found that Fiji had untapped trade potential for its aggregate exports with its
trading partners such as Australia, New Zealand, Thailand and the United States. A
study by Eita and Jordaan (2007) found that South Africa’s leather products for the
period 1997 to 2004 had unrealized export trade potential to such trading partners as
South Korea, UK, USA, and Zimbabwe. Batra’s (2004) study on India’s global trade
indicates that the country, for the year 2000, had highest unexploited export trade
potential with trading partners from the Asia-Pacific region followed by Western
Europe and North America. At country level, India had the highest unrealized export
potential with countries like China, UK, Italy and France
7.5 Causes of unrealized export trade
The existence of unrealized trade potential with a number of trade partners signifies
that there might be some trade barriers still inhibiting export trade to some of these
trade partners. The following are some of the possible trade barriers that Botswana’s
sectoral exports face in a number of countries.

106
i. Stringent rules of origin (RoO)
Although tariffs applied by most of Botswana’s export partners have generally
declined over the years, stringent rules of origin (RoO)25 continue to present
challenges to the country’s exports. For instance, in the case of textiles, whilst
the USA’s AGOA allows even for global cummulation26 under the “Special
Rule” (Allen et al., 2007); while trade with EU (under Cotonou and the
envisioned EPA) only allows regional (SADC) and diagonal cummulation27,
thereby limiting the ability of Botswana manufacturers to source textiles
inputs from potentially cheaper countries. Thus, these RoO have limited
Botswana’s exports to the EU, especially those from the textiles sector,
resulting in the actual exports being less than the predicted or simulated
exports.
ii. Non-tariff barriers (NTBs)
Most countries, especially from the developed world have over the years
developed sophisticated NBTs which are arbitrary, difficult and costly to meet,
especially for the developing exporting countries. In the case of the EU,
application of Sanitary and Phyto-sanitary Standards (SPS) measures whose
25 RoO can be simply defined to mean the country of origin from which a given exported product came or was manufactured. 26 Cummulation when applied within RoO concepts implies that if Botswana textile manufacturers use cotton or yarn imported say from Zimbabwe (an Africa/SADC country) to manufacture their textiles for exports, the exported textiles will be considered as wholly originating from Botswana. Thus Africa-wide cummulation implies that Botswana can import cotton or yarn from any African country for manufacturing its textiles for exports and those exports will be considered as originating from Botswana. SADC cummulation means the manufactured exported textiles will only be considered as originating from Botswana if the yarn, cotton, etc., used to manufacturer them were imported from SADC countries. Thus, SADC cummulation when compared to Africa-wide cummulation limits the sources from which Botswana’s textiles manufacturers imports their production inputs. 27 Diagonal cummulation means that any material, e.g. cotton, yarn, zips, etc., used to manufacture textiles in Botswana should be imported only from EU member countries so that the exported textiles can be considered as wholly originating from Botswana. If the manufacturers import cotton or yarn say from India or USA, the exported textiles will not be considered as originating from Botswana when entering EU markets, and thus will not be given any preferential treatment within the ACP-EU trade preferential arrangement, and will be levied import duty like any other textiles from other non-preferential trade partners.

107
main objectives are to safeguard damages to health, animal and plant life have
become disguised trade barriers. SPS standards have affected agricultural
exports including meat products not only of Botswana but also for most ACP
countries. EU SPS measures require that for any exporter to export to the EU
member states, he or she must be certified and for one to be certified he or she
must meet some ‘standards’ set by EU bodies. In the case of meat products,
SPS requires that the abattoirs must be certified; the animals to be slaughtered,
e.g. cattle, should be traced to their origin, i.e. from which farm, area or region
within any country they originated. Meeting these requirements is costly and
cumbersome and this has resulted in less meat products being exported to
some developed trade partners, especially in the EU.
iii. Animal diseases
FAO (2005) reports that Botswana’s meat and meat export products have been
limited due to a plethora of diseases, chief among them being the foot and
mouth28
. With the outbreak of foot and mouth disease, all meat exports are
abruptly brought to a halt until health officials are fully satisfied that the
disease has come under control or been eradicated. Owing to the lengthy
procedure involved in arriving at the conclusion that the diseases has been
brought under control, the country ended up exporting less that its potential
meat products in the years where such disease has occurred.
iv. Unrecorded informal trade
Another possible cause of unrealized export trade potential is the fact that
informal trade exports figures were not recorded. A case in point, as an
illustration, is the fact that more than 80% of Zimbabweans29 have been
28 Other listed diseases are (i) African swine fever, (ii) Avian Influenza, (iii) Bluetongue, (iv) Bovine spongiform encephalopathy (BSE), (v) Contagious bovine pleuropneumonia (CBPP), (iv) lumpy skin disease (vii) Newcastle diseases, (viii) Rinderpest, (ix) sheep and goat pox and (x) Rift valley fever 29 Zimbabwe is just an illustration given that Botswana’s textiles, and meat and meat products to this partner country have exceed their export potential.

108
importing their groceries from their neighbouring countries including
Botswana (South Africa, Zambia and Mozambique) for nearly a decade. Given
that these imports were mostly done in small amounts or informally, e.g.
groceries of around US$150 per month per individual, both Botswana customs
and Zimbabwean customs were not officially recording these ‘small figures’.
However, if these small figures are aggregated, they run into millions of US
dollars. Thus, the existence of untapped trade potential may be as a result of
the fact that informal trade figures were not recorded, resulting in the actual
recorded trade figures being less than the predicted potential figures.
v. Inadequate international marketing
Effective trade, especially with international consumers is underpinned by
rigorous marketing of the products on offer. Botswana’s National Export
Strategy (NES) (Republic of Botswana, 2008) alludes to the fact that the
country’s exports have not been vigorous marketed at international fora.
Whilst it may be difficult to single out the effect of marketing on a country’s
exports, the fact remains that marketing contributes positively towards
exports, especially given the continued growth in competition from other
countries in most products offered on the international market by Botswana.
vi. Relative low quality
Salm et al. (2004) alludes to the fact that relatively low quality, especially in
the textiles sector, has contributed towards reduced exports of Botswana’s
exports from this sector. In particular, the study noted that although the RoO
for yarn under the AGOA have been enhanced, the sector has not adequately
taken advantage of that gesture by ensuring that it procures the better quality
fabric required by regional garment manufacturers producing for the USA
market. As a result, relatively low quality fabric has been in manufacturing
resulting in relatively low quality garments which faced fierce competition on
the international market on quality terms.

109
7.6 Conclusions
This chapter presented the countries in which Botswana has unrealized trade potential
in the diamond, textile, and meat and meat products export sectors. The reported
results indicate that Israel, South Africa and Switzerland are export destinations for
which there is still untapped export potential for Botswana’s diamond, and as such,
the country should increase its diamond export to these countries. Countries such as
Canada, Denmark, Ghana and Mozambique, among others have unrealized export
markets for textile products from Botswana while Italy, Mauritius, Namibia and
Norway are the export destination in which Botswana should increase its export of
meat and meat products as these countries have untapped market potential for meat
and meat products.
7.7 Policy recommendations for utilizing unrealized trade potential
The ultimate objective of investigating whether a country has unrealized export
potential with its trading partners is to help the country to initiate relevant trade and
promotional policies, among others, so as to try and export more to those destination
countries with untapped markets. This section therefore presents some of the policy
options that Botswana can consider so as to try and expand its sectoral exports to
relevant export destination partners which have unexhausted markets for the country’s
sectoral exports. In the presence of existing export potential, the following are some
of the policy recommendations:
1. Analyze export barriers
Botswana policy analysts need to do an investigation of the factors that hinder
the country’s sectoral export to countries with untapped export potential. Such
an investigation will help to identify hindrances to export of sectoral products
to these countries. With that information policy markers will be in a better
position to design relevant policies to capitalize on those unrealized export
markets and export more.

110
2. Increase export promotion activities
Effective trade, especially with international consumers is underpinned by
rigorous marketing of products on offer. Botswana’s National Export Strategy
(NES) (Republic of Botswana, 2008) alludes to the fact that the country’s
exports have not been vigorous marketed at international fora. The country
should therefore increase trade promotional activities of its foreign services
and consulates, especially in countries where there is untapped export
potential. These consulate offices abroad can provide more information on
how one can import from Botswana as well as what products can be imported.
If possible, the country can put new consulate offices in a trade partner
country where there were no such services before. Presence of new consulate
services which also provides trade information, among other services, may
encourage imports from Botswana. According to Rose (2005), ceteris paribus,
“each additional consulate placed abroad is associated with a rise of bilateral
exports of between 6% and 10%”.
3. Negotiate for better trade preferences
Given that Botswana is still in the process of negotiating a number of free
trade arrangements, for instance with EU countries and also with WTO
member countries, the country can try to ensure that it gets the most in terms
of liberal trade preferences and better market access for its sectoral exports,
especially with countries from these two groups with which it has untapped
sectoral trade potential.
4. Seek technical assistance to meet NTBs
The country needs to work closely and in collaboration with its developed
trade partners, especially the EU, with the aim of getting technical assistance
in meeting some of the SPS and RoO requirements. Meeting and satisfaction
of these measures will positively enhance the country’s sectoral exports to the

111
EU trade partners, hence exhausting any currently existing untapped potential
within these markets.
5. Enhance diseases monitoring mechanisms
The success of Botswana’s meat and meat products, among other agricultural
products, is underpinned by the country’s ability to eradicate perennial
diseases such as the foot and mouth. Whilst the country is highly endowed
with a larger head of cattle, failure to control diseases means the country will
not be able to maximize its exports from this sector. Thus, the country should
consider enhancing disease monitoring mechanisms to ensure that should there
be an outbreak of any animal disease; the country will be able to swiftly put it
under control or totally eradicate it.
6. Improve product quality
It is important to note that importers (and hence consumers) do not simply
consider price when importing any product, but also consider other issues,
among them being the quality of the product. Most importers, especially from
the developed world, are particular about the quality of the products they
purchase and they generally prefer products of high quality. Thus, Botswana
manufacturers can enhance the possibility of increasing its sectoral exports,
especially those from the textiles sector if they use high quality yarn and fabric
in their manufacturing processes.