chapter 5planningcommission.gov.in/plans/planrel/fiveyr/10th/volume1/v1_ch5.pdf · a subsequent...
TRANSCRIPT

141
(i) LABOUR FORCE AND EMPLOYMENTPROJECTIONS
5.1 The Approach Paper to the Tenth Plan,approved by the NDC in September 2001, prescribedprovision of gainful high-quality employment to theaddition to the labour force over the Tenth Planperiod. A subsequent assessment of unemploymentsituation in the base year of the Tenth Plan 2002showed that to clear the backlog of unemployment,35 million employment opportunities are requiredto be created. The Tenth Five Year Plan, however,aims at provision of gainful employment in excessof the addition to the labour force.
Recent Trends in Employment andUnemployment Situation
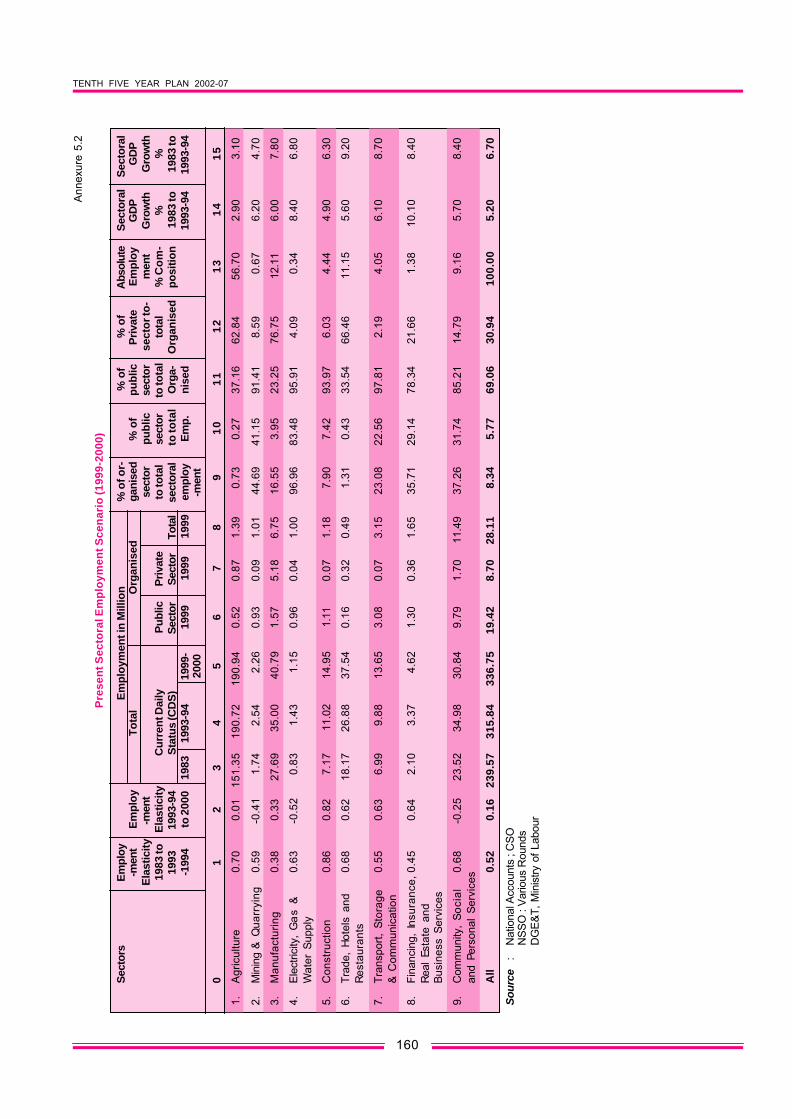
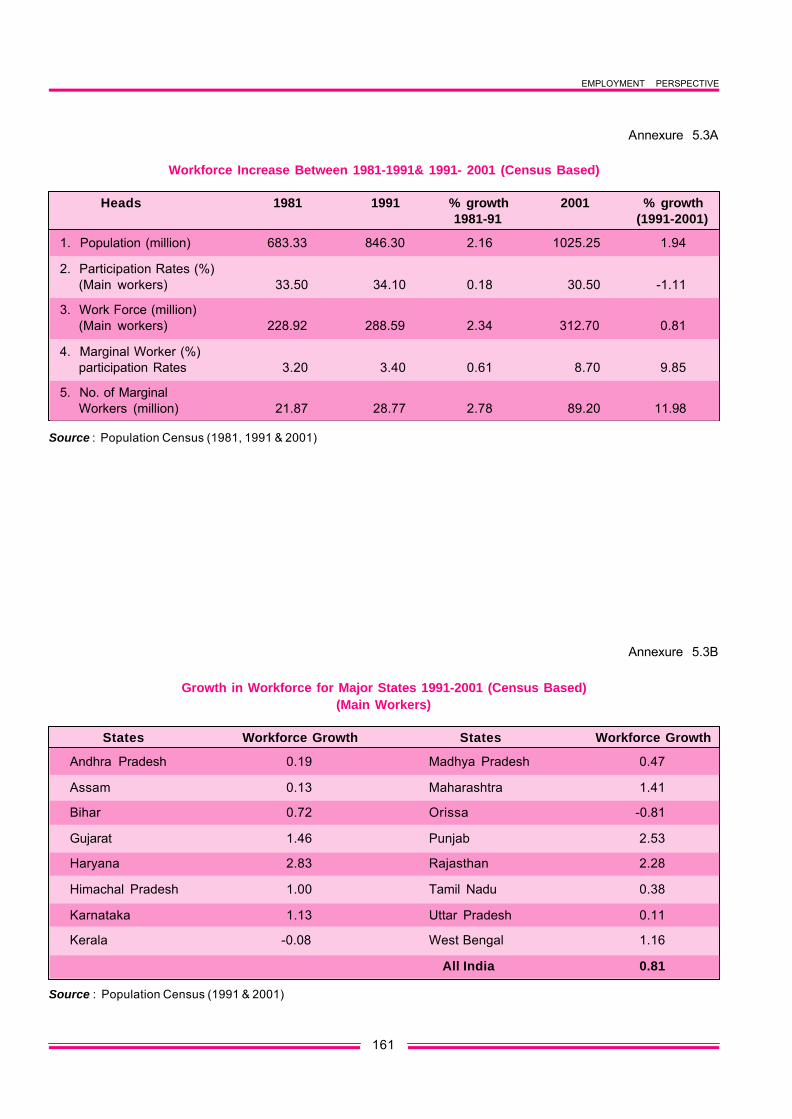
5.2 There was a slight decline in populationgrowth between the periods 1983-1993/94 and1993/94-1999/2000 from 2.0 per cent per annumto 1.9 per cent. Though growth of output in theeconomy accelerated between these two periods -from 5.2 per cent gross domestic product (GDP)growth to 6.7 per cent, the pace of employmentgrowth slowed down from 2.7 per cent to 1.07 percent as per National Sample Survey Organisation(NSSO) employment surveys (Annexures 5.1 &5.2). Slow-down in pace of employment growth, inthe nineteen nineties, is also borne out bydemographic census data - growth of main workersdecreased from 2.34 per cent to 0.81 (Annexure5.3). Similar trends in deceleration of employmentgrowth are revealed for specific segments ofemployment—growth of workers in establishmentcovered by economic census came down from 2.84per cent annum in 1980-1990 to 1.71 in 1990-1998(Annexure 5.4); employment in establishmentscovered by Employment Market Information Systemof Ministry of Labour grew at 1.20 per cent per
annum during 1983-1994 but decelerated to 0.53per cent during the next five years 1994-1999.However, the latter decline was mainly due to adecrease in employment in public sector establish-ments, whereas the private sector showed accelera-tion in the pace of growth from 0.45 per cent to1.87 per cent. (Annexure 5.5) Thus, the employmentintensity of the growth process of the Indianeconomy is coming down (Annexure 5.6).
5.3 The decrease in employment intensity ofoutput growth can be explained by either anincrease in capital intensity or increase in labourproductivity, releasing labour. Both happened partlyin this period. Incremental capital output ratio (ICOR)increased greatly and also capital substituted labour.Both suggest strategies to look for labour intensiveareas and technologies.
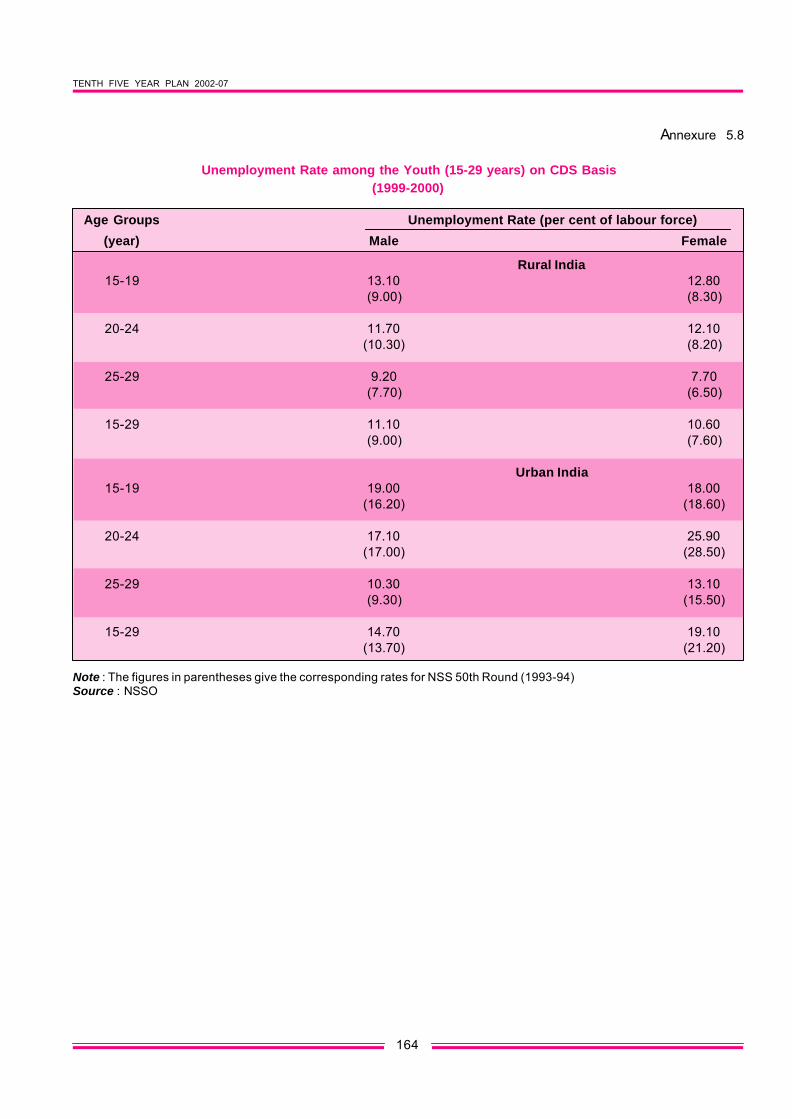
5.4 At micro level, the increase in productivityof labour should be reflected in higher growth ofreal wages. Some indicator of this trend is seenwhen the growth of real wages of rural casual maleworkers is seen during 1994-2000 compared to inthe preceding period 1983-1994 (Annexure 5.7).However, the rise in the real wages of casual labouronly cannot be a conclusive evidence either of anincrease in the real income or of tightening of labourmarket when the incidence of unemployment hasnot reduced, and has rather gone up. For example,unemployment rate reduced from 8.3 per cent oflabour force, measured on current daily status(CDS) basis, in 1983 to 5.99 per cent in 1993-94;however it rose to 7.32 per cent in 1999-2000.Further, youth unemployment has increasedbetween 1993-94 and 1999-2000: among ruralmales in 15-29 years age group from 9.0 per centto 11.1 per cent, and from 7.6 per cent to 10.6 percent among rural females (Annexure 5.8). In addi-tion, there are sharp variations in the unemployment
CHAPTER 5
EMPLOYMENT PERSPECTIVE

TENTH FIVE YEAR PLAN 2002-07
142
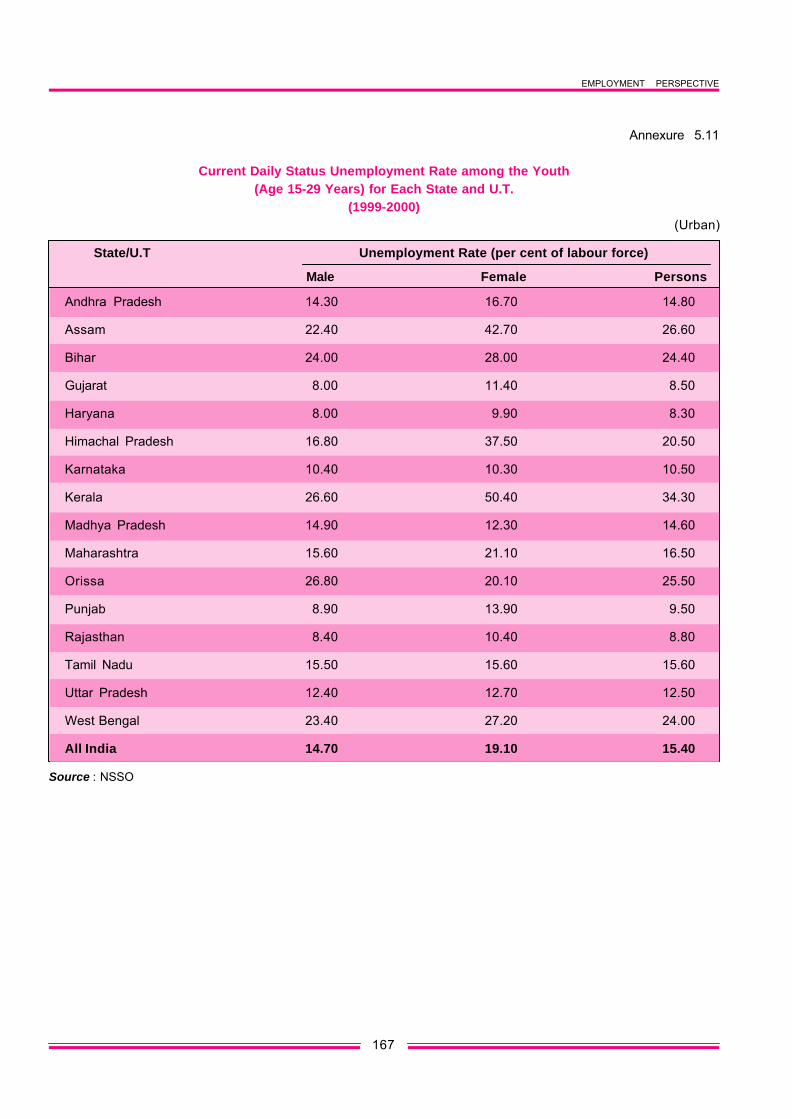
rate across States (Annexure 5.9). Against the allIndia average of 14.7 per cent unemploymentamong the urban male youth (15-29 years) in theyear 1999-2000, while Gujarat, Haryana, Rajasthanand Punjab have 8 to 9 per cent unemployment, itis much higher in Assam (22.4 per cent), WestBengal (23.4), Bihar (24.0) and Kerala (26.6).Moreover, the incidence of unemployment is muchhigher among the poor. In the lowest consumptionexpenditure class the unemployment rate is morethan twice the level compared to the highestexpenditure class (Annexure 5.12).
5.5 The growth of labour force deceleratedfrom 2.43 per cent to 1.31 per cent per annumbetween the periods 1983-1993/94 and 1993/94-1999/2000. However, the growth of population inthe working age group (15+) has continued toaccelerate despite the fall in growth of population,as the younger cohort grows older. The decline inthe growth of labour force, inspite of a higher growthof population in the working age group is becausea substantial part of those in the working age grouphave withdrawn from the labour force. While a partof the decline in labour force can be explained byan increase in the attendance at educationalinstitutions, it cannot be ruled out that some of thosein the working age group have withdrawn fromlabour force due to non-availability of work.
Population and Labour Force Projections
5.6 The changes in the age structure of popu-lation, given the present demographic transition ofthe Nation, are such as to lead to a much faster
growth of population in the working age group thanthe entire population, and this, given the differentparticipation rates in different age groups will leadto a faster growth of labour force as compared tothe working age population (Tables 5.1 and 5.2).
5.7 As noted earlier there was a substantialgap in the growth rates of working age populationand labour force in the period 1993/1994 - 1999/2000, leading to a sharp fall in the growth of labourforce to 1.31 per cent per annum from 2.43 per centduring the preceding period 1983 - 1993/94. ThePlanning Commission Special Group on Creationof 10 million Employment Opportunities a Year inTenth Plan noted that the causes underlying thissharp fall need to be investigated further. One viewis that withdrawal from labour force is to invest one’stime in acquiring education for better returns infuture, while the Special Group observes that thisfactor can only partially explain withdrawal fromlabour force, and suggests that lack of workopportunities can also lead to complete withdrawalfrom labour force. The decline in the rate of growthof labour force, however, is not expected to continueunabated in future. Hence the special Groupadopted the higher of the two alternative labour forcegrowth scenarios suggested by the Task Force onEmployment Opportunities. Accordingly, the Grouphas adopted a 1.8 per cent growth rate of labourforce in the Tenth Plan period (2002-07), i.e. a muchslower decline in the age-specific participation ratesin the period beyond (2007-12). Therefore, theprojections of labour force are made here on 1.8per cent growth (Table 5.3).
Table 5.1
Age Structure of Population
(age distribution in per cent; population in millions)
Age group 2001 2006 2011 2016
0 - 14 35.6 32.5 29.7 27.1
15 - 59 58.2 60.4 62.5 64.0
60 + 6.3 7.0 7.9 8.9
All age groups 100.0 100.0 100.0 100.0
Population 1,027.0 1,113.7 1,194.4 1,267.5
Source : Planning Commission

EMPLOYMENT PERSPECTIVE
143
Measurement of Employment andUnemployment
5.8 In the Ninth Plan, the calculations ofemployment and unemployment were based onUsual Principal and Subsidiary Status basis (UPSS).The Report of the Special Group has viewed thatcurrent daily status (CDS) is a better measure tocapture unemployment and underemployment, thanthe usual status, and therefore recommended theuse of CDS basis for estimation purpose.
5.9 The rationale for using CDS as measuringemployment and unemployment is the following.The Approach Paper to the Tenth Plan recommendscreation of gainful employment opportunities for theentire additions to labour force in the Tenth Planand beyond. Therefore, policies and programmesto fill the gap between requirement and availabilityof gainful employment opportunities are to beworked out. At any point of time, there is a largeunemployed and under-employed workforce i.e., nothaving any gainful employment, although by usingthe measurement on UPSS basis, several of themare declared employed. This results in over-estimation of the level of employment. To avoid this,largely, the Special Group suggested estimation ofthe extent of employment and unemployment onCDS basis.
5.10 According to the NSSO employment andunemployment survey report of 1999-2000 'Theusual status approach adopted for classification ofthe population is unable to capture the changes inthe activity pattern caused by seasonal fluctuations.But the estimate obtained by adopting the currentweekly or current daily status approaches areexpected to reflect the overall effect caused by theintermittent changes in the activity pattern duringthe year. The latter (CDS) reflects also the changes,
Table 5.2
Growth in Population and Labour Force (per cent per annum)
2002 - 2007 2007 - 2012 2012 - 2017
Population(All age groups) 1.63 1.41 1.20
Population(15 - 59 years) 2.41 2.08 1.70
Labour Force(1)(15 - 59 years) 2.42 2.15 1.78
Population(15 +) 2.57 2.26 1.93
Labour Force(1)(15 +) 2.51 2.25 1.92
Note :(1) Labour force projections here are on the basis of labour force participation rate for each quinquennial age group
remaining unchanged, i.e. the changes in labour force growth in relation to population are due to changes in the agecomposition of the population.
Source : Planning Commission .
Table 5.3Increase in Labour Force and Working
Age Population (million)
Basis of Scenario 2002-2007 2007-2012
Increase in Labour Force 35.29 40.02(Special Group)1
Increase in Working Age 55.25 55.82Population2 (15+)
Source : 1. Report of Planning Commission Special Groupon creation of 10 million Employment Oppor-tunities per year (2002)
2. Derived from Table 5.1

TENTH FIVE YEAR PLAN 2002-07
144
which take place even during the week. The estimateof the employed based on current daily status givesaverage daily picture of employment.' Therefore theSpecial Group regarded the CDS measurement asthe most appropriate measure to have an estimateof the gap i.e., jobs to be created on gainful basis, inorder to bring out recommenda-tions as to how theycan be filled up by changes in policies andprogramme.
5.11 The NSSO Report also provides estimatesof the likely under-employment that is hidden in thenumber of the employed category, calculated bythe UPSS approach when they are compared withCDS. The activity pattern of the usual employmentduring the days within the reference week isindicated by the distribution of their activity bycurrent daily status. The relevant results for ruraland urban India are presented in Table 5.4. It isobserved that the proportion of person days of theusually employed, utilised for work, is lower forfemales as compared to the males throughout theperiod 1987-88 to 1999-2000. During 1999-2000,this proportion was estimated at about 68 per centand 79 per cent for females in the rural and urbanIndia respectively, as against 90 per cent and 94per cent for males in rural and urban Indiarespectively. If the work is not available, largeportion of the females withdraw from the labour forcerather than report themselves as unemployed. Thedistribution obtained from the 1999-2000 survey ispresented in Table 5.4.
PROJECTIONS OF EMPLOYMENTOPPORTUNITIES
5.12 As noted earlier, the employment genera-ting capacity of output growth has been seen to bereduced in recent years (Annexure 5.6). Thebaseline scenario of growth of GDP is 6.5 per cent,as indicated in the Tenth Plan Approach Paper.Annexure 5.13 gives the employment perspectiveusing these estimates. This scenario shows that onthe 'business as usual basis' (i.e., with the presentemployment elasticity) the percentage ofunemployed will grow up to 11.0 at the end of theTenth Plan, giving a total unemployed labour forceof 45.56 million person years. This picture is notacceptable on any socio-economic or politicalground. Therefore, a much higher growth rate(8 per cent) is needed for the future along withpositive policies and programmes for changing thesectoral pattern and technology in favour of labour-intensive production, if unemployment is to betackled.
5.13 The estimates of employment andunemployment of the Tenth Plan's base year (2001-02) are given in Annexure 5.14. The estimates ofunemployed for the year 2001-02 have been givenaround 34.85 million person years (defined on CDSbasis) when the unemployment rate went up around9.21 per cent. It also provides the estimates ofaddition to labour force over the Tenth Plan periodas 35.29 million person years. Thus, over the Tenth
Table 5.4Per 1000 Distribution of Person-days of Usually Employed (principal and subsidiary
status workers taken together) by their Broad Current Daily Status
Current Rural Urbandaily status
Male Female Male Female
1999-00 1993-94 1987-88 1999-00 1993-94 1987-88 1999-00 1993-94 1987-88 1999-00 1993-941987-88
(1) (2) (3) (4) (5) (6) (7) (8) (9) (10 (11) (12) (13)
Employed 897 909 926 676 663 638 942 949 938 791 766 716
Unemployed 53 40 27 41 30 26 27 27 37 22 24 37
Not in LabourForce 51 51 47 283 306 336 31 25 25 187 210 247
All 1000 1000 1000 1000 1000 1000 1000 1000 1000 1000 1000 1000
Source : NSSO
EMPLOYMENT PERSPECTIVE
145
Plan, we have to deal with the problem of creatingjob opportunities against a potential job demand ofmore than 70.14 million person years (i.e., 34.85million base period unemployment and 35.29 millionnew labour entry net of exits). Against this pers-pective, the employment objective of the ApproachPaper to the Tenth Plan has to be addressed. TheApproach Paper recommends providing gainfulemployment opportunities to all the additions in thelabour force over the five year period, and reducingsignificantly the rate of unemployment over theTenth Plan, so that by the end of the Eleventh Plan,the unemployment rate will be near zero.
5.14 The Tenth Plan visualises a substantiallyhigher growth rate of 8 per cent per annum. Thebreak-up of the aggregate growth rate is given inAnnexure 5.15. Given this growth pattern andassuming the present sectoral employment elastici-ties, an estimate has been made of the level ofemployment and unemployment over the TenthPlan. Increased employment opportunities ofaround 29.67 million person years (i.e., an increasefrom the base figure of 343.36 million to 373.03million) will be created with the help of a 8 per centper annum growth over the next five-year period.This 'business as usual' scenario means, anemployment growth of 1.7 per cent per annum asagainst a labour force growth of 1.8 per cent perannum. The result: even with as high a growth as 8per cent, the objective of providing employmentopportunities to all additions to labour force will notbe achieved; an additional 5.62 million employmentopportunities will have to be created. This, addedto the base period stock unemployment of 34.85million, will give an unemployment rate of 9.79 percent at the end of the Tenth Plan, an increase from9.21 per cent at the base. This arises largely dueto the near jobless growth character in many sectorsof the economy especially in the organised sector,and a growing capital intensity in many of theorganised sectors and even in some of theunorganised sectors including some small scaleindustries. The unemployment rate at the end ofthe Tenth Plan can even go up by a minimum one-percentage point (adding four million moreunemployment) if the labour force growth increasesto 2.0 per cent per annum 2. The answer is,
therefore, to look for a development strategy, whichwill revamp the activities in those sectors where thecomparative advantage lies in a labour-intensivenature of production. But as the economy is nowoperating under the impact of globalisation, all careshould be taken in the reallocation of activitiesbetween sectors and sub-sectors, so that everysector can meet the open market competition. Togive a simple example, without the changes in theoverall growth rate of agriculture, the sub-sectorcompositions can be changed by changing thecropping patterns and resources allocated betweenfood and non-food, from less to more labourintensive sectors. Even this strategy may not alwaysneed additional investment resources. In fact, it isoften said that a change in favour of labour intensiveactivities is accompanied by saving of capital bysubstitution of capital by labour and knowledge/technology. Specific programmes and projects areto be identified and launched, keeping this goal inview. In this effort, extensive discussions withMinistries and sector specialists have beenundergone. At present, the awareness of the needfor employment generation is generally very poorwhile formulating the plan programmes/policies.This applies to most of the concerned Ministriesand authorities. As per the findings of the SpecialGroup on Employment Generation, agriculture andallied sector activities have a very large employmentgenerating poten-tiality. This is to be achieved notnecessarily by heavy additional investment, but byreallocation of funds and choice of appropriatetechnologies. But to be sustainable under thepresent globalised system, this should be supportedby appropriate policies to increase their productivityand competitiveness, which would make themviable.
5.15 Annexures 5.14 and 5.16 present thescenario of employment generation, seperately forthose emanating from growth per se without anychange in the existing employment elasticities, i.e.implicitly assuming a 'business-as-usual' scene(with no changes in intra-sectoral composition oflabour intensity of output) and for those withselective changes in policies and programmes infavour of more labour use. The sectoral estimatesof these are given in Annexure 5.18. As Annexure
2 Table 5.3

TENTH FIVE YEAR PLAN 2002-07
146
5.19 shows, the maximum addition to employmentgenerated from special programmes will come from(i) agriculture and allied activities, (ii) small andmedium enterprises, broad-based rural non-farmactivities and some of the social services sectorslike education and health. Besides, appropriatepolicy changes have been identified for the fastdevelopment of sectors of high labour intensity likeconstruction, tourism, communication and informa-tion technology and financial services. There aremany potential areas in the informal sectors, andespecially in the self-employment area, which canprovide high employment, and therefore should alsobe developed.
5.16 The summary Annexure 5.18 shows that,with suitable programmes and policy changes, thesame 8 per cent growth rate can generate anadditional 19.32 million person years of employmentopportunities over the Tenth Plan period, giving atotal of 50 million person years of employmentopportunities over the Tenth Plan. This recom-mended scenario will not only absorb all additionsto labour force generated over the Tenth Plan ingainful manner, but also reduce the level ofunemployment by nearly half and will eliminate itcompletely by the end of the Eleventh Plan. Thepercentage unemployed will go down from 9.21 percent to 5.11 per cent by the end of the Tenth Planand unemployment will be eliminated by the end ofthe Eleventh Plan. To summarise, nearly 20 millionperson years of employment opportunities have tobe created by selective innovative programmes andpolicies leading to a changed pattern of growth infavour of labour intensive sectors; the remaining30 million will come from the normal buoyancy ofgrowth as perceived over the recent past (1993-94to 1999-2000), giving a total of 50 million personyears over the Tenth Plan.
(ii) STRATEGIES AND POLICIES FOREMPLOYMENT GENERATION
5.17 As already noted, the Tenth Plan aims atprovision of gainful employment opportunities to theentire additions to labour force during the Tenth Planand beyond. This is an essential condition forimproving the quality of employment of an average
worker. For, if labour markets do not clear, nostrategy for improving the quality of employment islikely to succeed. In a large labour surplus situation,there may be employment of a high quality but onlyfor a select group. Hence, the first strategy toimprove the quality of employment is to increasethe aggregate demand for labour.
5.18 While a higher rate of economic growth isa necessary condition for increasing the demandfor labour, the pursuit of growth objective in isolationmay not be sufficient, at least in an immediateforeseeable future, to gainfully absorb the annualadditions to labour force. Therefore, in the short-term perspective of a Five Year Plan, growth willhave to be supplemented by increasing theemployment content of growth in order to fulfill theemployment objectives of Plan.
SECTORAL POLICY INITIATIVES FOR OPENINGUP NEW EMPLOYMENT OPPORTUNITES
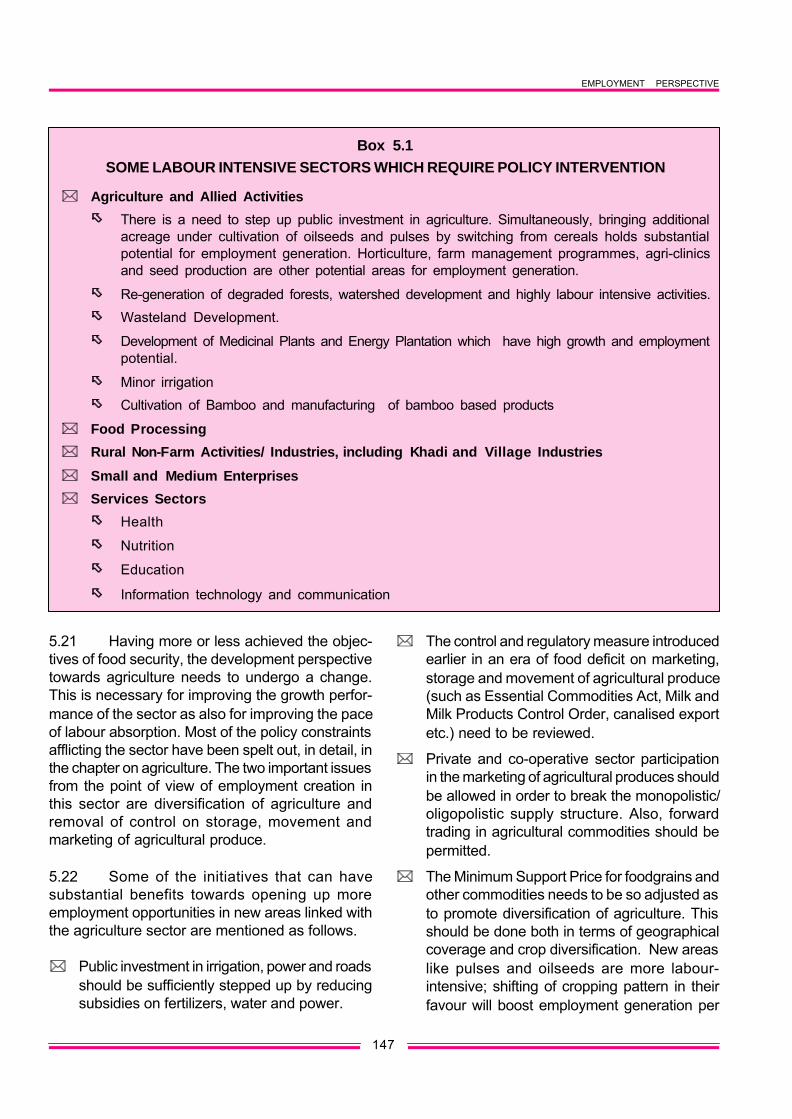
5.19 There are many labour intensive sectors,where employment-generating growth can berejuvenated if right kind of sectoral policies can beput in place. An indicative list of such sectors is givenin Box 5.1.
AGRICULTURE
5.20 The food security perspective guided thesectoral policies and related programmes inagriculture during the past three decades. Thisensured rich dividends in terms of agricultural outputand food prices. Employment was an incidentalobjective. Certain agricultural crops, mainly wheatand paddy, and the parts of the country where theseare produced, benefited immensely. Wages oflabour improved at such locations. However, growthof employment in agriculture decelerated to a verylow level in the nineties. Considering the consump-tion needs of our large population, agriculturalproduction and the linked processing, distribution,trade, financial and commercial activities still havea very large potential for (i) sustaining the demandfor labour and (ii) improving the quality of employ-ment. At the sub-sector level, however, manystructural changes in the pattern of growth of agricul-ture and its forward linked activities are required.
EMPLOYMENT PERSPECTIVE
147
5.21 Having more or less achieved the objec-tives of food security, the development perspectivetowards agriculture needs to undergo a change.This is necessary for improving the growth perfor-mance of the sector as also for improving the paceof labour absorption. Most of the policy constraintsafflicting the sector have been spelt out, in detail, inthe chapter on agriculture. The two important issuesfrom the point of view of employment creation inthis sector are diversification of agriculture andremoval of control on storage, movement andmarketing of agricultural produce.
5.22 Some of the initiatives that can havesubstantial benefits towards opening up moreemployment opportunities in new areas linked withthe agriculture sector are mentioned as follows.
** Public investment in irrigation, power and roadsshould be sufficiently stepped up by reducingsubsidies on fertilizers, water and power.
** The control and regulatory measure introducedearlier in an era of food deficit on marketing,storage and movement of agricultural produce(such as Essential Commodities Act, Milk andMilk Products Control Order, canalised exportetc.) need to be reviewed.
** Private and co-operative sector participationin the marketing of agricultural produces shouldbe allowed in order to break the monopolistic/oligopolistic supply structure. Also, forwardtrading in agricultural commodities should bepermitted.
** The Minimum Support Price for foodgrains andother commodities needs to be so adjusted asto promote diversification of agriculture. Thisshould be done both in terms of geographicalcoverage and crop diversification. New areaslike pulses and oilseeds are more labour-intensive; shifting of cropping pattern in theirfavour will boost employment generation per
Box 5.1SOME LABOUR INTENSIVE SECTORS WHICH REQUIRE POLICY INTERVENTION
** Agriculture and Allied Activities
õõ There is a need to step up public investment in agriculture. Simultaneously, bringing additionalacreage under cultivation of oilseeds and pulses by switching from cereals holds substantialpotential for employment generation. Horticulture, farm management programmes, agri-clinicsand seed production are other potential areas for employment generation.
õõ Re-generation of degraded forests, watershed development and highly labour intensive activities.
õõ Wasteland Development.
õõ Development of Medicinal Plants and Energy Plantation which have high growth and employmentpotential.
õõ Minor irrigation
õõ Cultivation of Bamboo and manufacturing of bamboo based products
** Food Processing
** Rural Non-Farm Activities/ Industries, including Khadi and Village Industries
** Small and Medium Enterprises
** Services Sectors
õõ Health
õõ Nutrition
õõ Education
õõ Information technology and communication
TENTH FIVE YEAR PLAN 2002-07
148
unit of output. A higher output of these crops isalso necessary to increase the weight of theseitems in the average food consumption basket,necessary for meeting the nutritionalrequirements
Agricultural Land Use and Liberalization ofLand Laws
5.23 To increase growth in agriculture, all poli-cies for better utilisation of land and water shouldbe pursued. For example, policies on utilisation ofall types of hitherto unutilized lands, especially thecultivable and afforestable lands owned by thegovernments need to be given priority.
5.24 A back-ended, beneficiary-orientedsubsidy scheme for reclamation of degraded landslike ravines, un-levelled lands, saline, sodic, alkalineand water-logged lands, has been contemplated bythe Ministry of Agriculture at the Centre.
5.25 Some incentive for computerising landrecords and lowering the stamp duties substantiallycan avoid pseudo legal and illegal conveyancesystems as well as litigation in rural areas.
5.26 Legalising the land leasing-in and leasing-out systems and promotion of contract farmingthrough standardised contract formats enforceableon both parties will help in increasing the size ofholdings and improving the viability of agri-units.
5.27 Minor irrigation and watershed develop-ment will increase the employment-generatingcapacity of agriculture.
5.28 The semi-arid and rain fed areas of theCentral regions, which have higher potential forincreasing productivity, would be the focus ofattention in the Tenth Plan. These measuresselected for the Tenth Plan can accelerate agricul-tural growth as well as trigger growth in othersectors, besides reducing poverty.
5.29 There are better social returns in promo-ting agro-forestry models in the rain fed or semi-arid regions, which contain most of India's marginal
lands. It is in this context that we need to have a bigincentive. Similarly, tree plantations on wastelands,belonging to the poor, need to be encouraged, andthe focus on farm forestry revived. The details ofthese policies are available in a Planning Commis-sion Task Force Report on Greening India.
Research and Extension
5.30 More labour intensive crops like pulsesand oilseeds should get the benefit of research andextension services.
5.31 An important component in agriculturaldiversification is animal husbandry, including dairy-ing and poultry which hold immense promise forincreasing not only rural livelihoods, but urban aswell. A proper development of this sector will requireattention not only to technology, processing andmarketing arrangements, but also to issues ofanimal welfare.
5.32 Greater attention should be given to rainwater harvesting and increasing the irrigationpotential through scientific watershed development.These are also highly employment-intensiveactivities. Water harvesting techniques should bewidely promoted through demonstration anddissemination of benefits. Panchayats should beactively involved in such efforts.
Women in Agriculture
5.33 The NSSO survey results show that thereis high female unemployment in the rural sector.Therefore, the Tenth Plan must also focus onprogrammes for increasing the work opportunitiesand productivity of female farmers. Increasingwomen's access to productive land by regularisingleasing and share cropping of uncultivated agricul-tural land by women's groups, encouraging collec-tive efforts in bringing wastelands under cultivation,and providing policy incentives to women in lowinput subsistence agriculture will have immediatebenefits in terms of the household's food securityand women's empowerment along with additionalemployment generation.

EMPLOYMENT PERSPECTIVE
149
Agricultural Reforms and Employment
5.34 Reforms initiated in 1991 had largelybypassed the agriculture sector. The purpose ofreforms was removal of poverty, and employment-generating growth was taken to be the principalstrategy for removal of poverty. In this process, therole of the agriculture sector is crucial. A few initialsteps have been taken now, but this process willrequire close involvement of State Governments,Local Governments, Panchayats and other localauthorities. Planning will need to play a proactiverole through appropriate programmes.
5.35 Hopefully, the renewed WTO negotiations,and the new round of negotiations on agriculture,will be able to increase our exports by curbing thetrade distorting agricultural subsidies on agriculture.And increase in agricultural exports shouldcontribute to employment generation because theyare labour using, and a more rapid growth of agricul-ture would increase the demand for labour in theagriculture sector.
5.36 If the reforms are implemented success-fully, employment in non-cereal crops, and withincereals, in the labour intensive pulses and oilseedcrops, should increase. Animal husbandry, fisheries,floriculture and horticulture, and extended areas ofagriculture, have very high employment potentialsbut their growth has comparatively gone down inthe 1990s. Agricultural reforms should give a boostto such activities, and benefits of such employmentgrowth are expected to be more equitably distributedacross regions.
FOOD PROCESSING
5.37 Food processing is an important employ-ment generating activity. While India is the secondlargest producer of fruits and vegetables in theworld, its food processing industry remains under-developed. The purpose of reforms in agricultureis to increase the income of farmers, and of thosewho are employed in agriculture. Given the verylarge proportion of our farm produces that perishes,any expansion of food processing activity shouldimprove the off take on commercial terms ofagricul-tural output.
5.38 The absence of an assured electricitysupply and poor road connectivity are two of themajor constraints in the development of the foodprocessing industry. In addition to addressing thebasic infrastructural needs of power supply and roadconnectivity, certain promotional measures, fiscalas well as creation of facilities specific to the sector,need to be taken simultaneously to impart dyna-mism to the sector.
5.39 The success of food processing industryis crucially linked to a continuous food chain startingfrom farming to food processing to marketing.Corporations or modern cooperative organisationsare needed to develop the chain. Some of thespecific issues requiring attention in order to developa culture of food processing are :
** While the agriculture sector has been exemp-ted from all taxes (like excise and income tax),the agricultural produces attract a number oflevies like infrastructure cess, market cess,sales tax, mandi tax, turnover tax, inter-statetransfer regulations, etc. At the point of conver-sion, i.e., value addition, excise, income taxand other taxes are levied. The packagingmaterial used is also subject to heavy taxation.All these taxes increase the cost of foodproducts and it becomes a food/commodity forthe rich, thereby reducing its demand.
** It is necessary to facilitate contract farming withits backward and forward linkages, especiallyin the hinterland of proposed food parks, to beset up in the Tenth Plan period. This wouldenable greater value addition and consolidationof operations.
** Equally important is to provide post-harvestinfrastructural facilities in the hinterland of thefood parks, such as harvesting equipment,sorting, grading, packing, pre-cooling, washingoperation, etc. Setting up of these facilitieswould improve the level of food processing,reduce post-harvest losses, contribute to valueaddition and generate new jobs in rural areas.
** For reducing the post-harvest losses, which areestimated at Rs.50,000 crore annually, it isnecessary to take urgent steps to set up
TENTH FIVE YEAR PLAN 2002-07
150
irradiation plants, cold storages based onvapour absorption technologies, pre-cooling,etc.
** To bring our food products at par with andconforming to international safety and qualitystandards, it would be necessary to set up anetwork of quality testing/certification labora-tories across the country.
** There is an urgent need to set up a retail chainfor distribution of standard and hygienic qualityfood products. This would help in creatingsustained demand for quality food productsfrom customers.
** Synergies between the food parks and theagriculture export zones is necessary so thatfacilities/provisions set up for one zone maybe considered for the others.
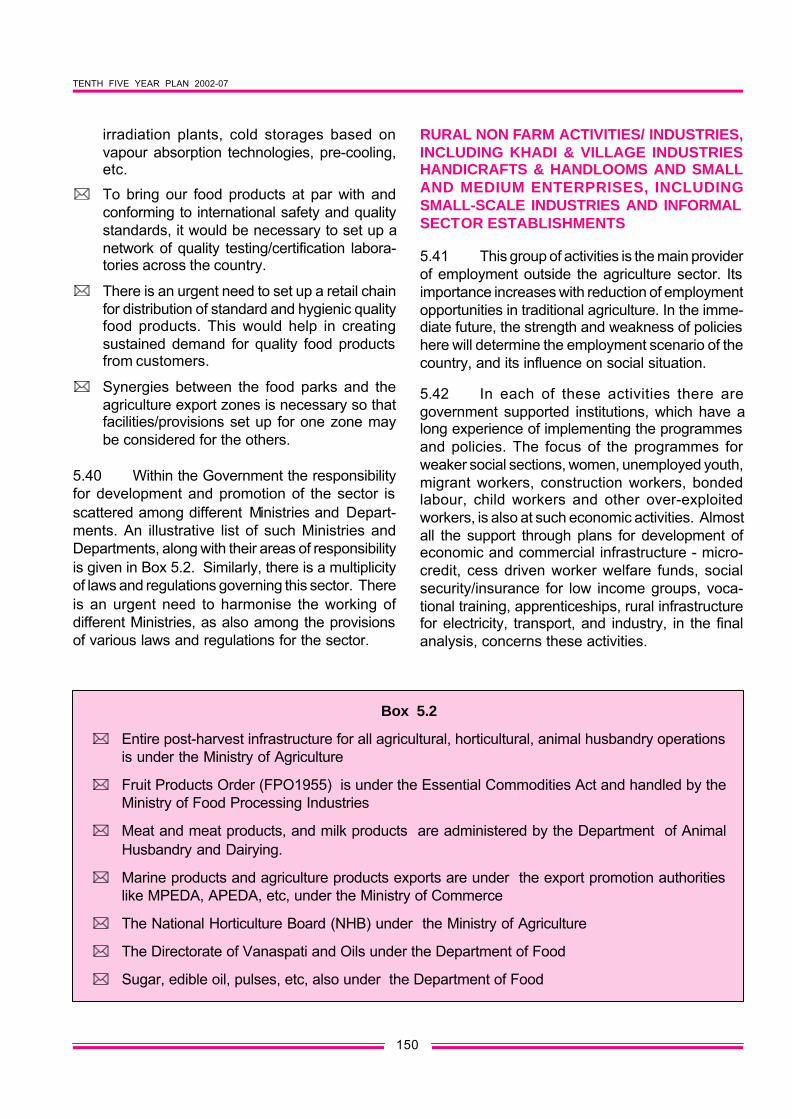
5.40 Within the Government the responsibilityfor development and promotion of the sector isscattered among different Ministries and Depart-ments. An illustrative list of such Ministries andDepartments, along with their areas of responsibilityis given in Box 5.2. Similarly, there is a multiplicityof laws and regulations governing this sector. Thereis an urgent need to harmonise the working ofdifferent Ministries, as also among the provisionsof various laws and regulations for the sector.
RURAL NON FARM ACTIVITIES/ INDUSTRIES,INCLUDING KHADI & VILLAGE INDUSTRIESHANDICRAFTS & HANDLOOMS AND SMALLAND MEDIUM ENTERPRISES, INCLUDINGSMALL-SCALE INDUSTRIES AND INFORMALSECTOR ESTABLISHMENTS
5.41 This group of activities is the main providerof employment outside the agriculture sector. Itsimportance increases with reduction of employmentopportunities in traditional agriculture. In the imme-diate future, the strength and weakness of policieshere will determine the employment scenario of thecountry, and its influence on social situation.
5.42 In each of these activities there aregovernment supported institutions, which have along experience of implementing the programmesand policies. The focus of the programmes forweaker social sections, women, unemployed youth,migrant workers, construction workers, bondedlabour, child workers and other over-exploitedworkers, is also at such economic activities. Almostall the support through plans for development ofeconomic and commercial infrastructure - micro-credit, cess driven worker welfare funds, socialsecurity/insurance for low income groups, voca-tional training, apprenticeships, rural infrastructurefor electricity, transport, and industry, in the finalanalysis, concerns these activities.
Box 5.2
** Entire post-harvest infrastructure for all agricultural, horticultural, animal husbandry operationsis under the Ministry of Agriculture
** Fruit Products Order (FPO1955) is under the Essential Commodities Act and handled by theMinistry of Food Processing Industries
** Meat and meat products, and milk products are administered by the Department of AnimalHusbandry and Dairying.
** Marine products and agriculture products exports are under the export promotion authoritieslike MPEDA, APEDA, etc, under the Ministry of Commerce
** The National Horticulture Board (NHB) under the Ministry of Agriculture
** The Directorate of Vanaspati and Oils under the Department of Food
** Sugar, edible oil, pulses, etc, also under the Department of Food

EMPLOYMENT PERSPECTIVE
151
5.43 A coherent approach to this group ofactivities can yield very large benefits in terms ofemployment and income of a majority of house-holds. There are many administrative structures thatreach these activities, but for want of a better term,all of them put together within the sweeping term'unorganised sector' , whereas what the term reallyimplies is all the non-incorporated establishments.
5.44 This sector or group is very large in termsof workforce, it responds to competition, and istherefore vibrant. These decentralised economicactivities, which are self-adjusting, contribute in nosmall measure to harmony and social stability inthe Indian polity.
5.45 In the following section further develop-ment of these economic activities is explored. Theemployment related services, and governanceissues pertaining to employment and workers of thiscategory are dealt with in the chapter 3.5 on LabourPolicy and Labour Welfare, in Volume II.
Rural Non-farm activities/industries, includingKhadi & Village Industries (KVI)
5.46 Principal planning initiatives on rural non-farm activities are taken through the Khadi andVillage Industries Commission (KVIC). The effortsneeded to further improve the effectiveness of KVICprogramme are:
** KVIC should focus at traditional artisan basedactivities because the present coverage is verysmall.
** Special initiatives by the KVIC for north easternregion, hilly and border areas.
** Involvement of Self Help Groups (SHGs) underKVI sector in order to widen the programme atthe grass root level.
** Planning process in KVIC should involve thebeneficiaries - State Khadi & Village IndustriesBoards, cooperative societies, etc.
** Cluster development approach should beadopted by KVIC so as to strengthenbackward and forward linkages.
** R&D ties should be established between theKVIC and the National Institute of Design,National Institute of Fashion Technology,Indian Institutes of Technology etc.
** An IT-based data bank of KVIC assisted unitsshould be created to facilitate research andinformation flow across KVIC establishmentsspread across the country.
** Policy support to village industries should beensured.
** A Ministry of Agro and Rural Industries asseparate from SSI has already been set up.
** The KVIC should play the role of a nodalagency for the whole village industry sector inthe country.
** The Khadi programme has social objectives,and the subsidies/concession should be consi-dered from this angle.
** Registration with the KVIC should enable a unitto avail of the same benefits as with the StateDirectorate of Industry.
** The KVIC should be given the status of anexport promotion council.
Small and Medium Enterprises
5.47 A number of high-level committees havesuggested that there should be uniform policy forall small and medium enterprises; it should notremain confined to the manufacturing sector alone,but should include all activities - trade, transport,and financial services.
5.48 Fiscal support is given to small industrybecause it is labour intensive and hence employ-ment generating. Therefore, the fiscal incentives(excise and income tax), preference in StateGovernment levies, sales taxes, excise and creditsupport, technology development and marketingsupport, should be linked with a criterion ofemployment generated.
5.49 A new 'cluster development approach'should be adopted to focus at locations, which havehigh employment intensity. There exists a number

TENTH FIVE YEAR PLAN 2002-07
152
of programmes for the benefit of small and microenterprises. These include:
** Credit for modernisation
** Credit guarantee for tiny units without collateral
** Market development assistance throughindustry associations
** Local infrastructure development throughindustry associations
** Testing laboratories for product quality
5.50 Besides these enterprise-specific progra-mmes, the general programmes aimed at thehouseholds are:
** Housing for low-income groups
** Micro-finance
** Skill Development
** Health care
5.51 If all these programmes could be focusedat a particular cluster, the returns in terms of betterproductivity, higher income of workers and a betterquality of job will be immense. In other words, ratherthan having multiple programmes, each having aspread over a large area, the Tenth Plan mayemphasize these micro development programmesat specific clusters.
Credit for Informal Sector - Micro Credit
5.52 A major problem in all developing count-ries is that the formal banking system is ill suited tomeeting the credit needs of the informal sector. Andyet this sector accounts for the bulk of the totalemployment generated. The banking system mustbe encouraged to reach out to the enterprises inthe informal sector through innovative means. Thisis effectively what is intended by the various targetsspecified for priority sector lending by commercialbanks. However, priority sector lending has createda culture of mechanical lending in public sectorbanks in which there is little effort at credit appraisalof lendings made to priority sectors. The Narasi-mham Committee suggestion of limiting priority
sector lending to a more precisely defined targetgroup was not accepted.
5.53 Banking practices and procedures needto be reviewed to enable banks to adopt a moreproactive approach to lending for economicallyviable activities in the informal sector. Thecooperative credit structure can play a major rolein extending credit to the informal sector but it hasbecome very weak in most States.
5.54 A great deal of informal sector activitiescan be more effectively serviced by non-bankfinancing intermediaries, which are perhaps betterable to handle such intermediations, charginginterest rates, which cover the high cost of managingan inherently more risky informal sector loan. Theyare also able to enforce claims on collateral. It isnecessary to review the regulatory constraints oncommercial banks, which may prevent them fromlending to such non-bank financial intermediariesfor on lending to finance informal sector activity.
5.55 Another important mechanism throughwhich banks can meet the credit needs of theinformal sector is the self help groups (SHGs), whichprovide micro credit for informal sector activities. Apilot project linking SHGs to banks was launched in1992. It was envisaged that NGOs could help buildup capacity among the poor to organize themselvesinto SHGs and approach the banks for financing.In 1992-93, a total of 255 SHGs were linked withbanks under this project. The number had expandedto 1,21,744 as on September 30, 2000. Theprogramme has provided credit to 1.9 million poorfamilies. More than 85 per cent of the SHGs areexclusively women's groups.
5.56 The experience thus far has been veryencouraging. Recovery rates of SHGs are very high(over 90 per cent) reflecting the impact of peerpressure in ensuring loan recovery. Impact studiesof micro credit extended by SHGs show verypositive outcomes in terms of the effectiveness ofthe loans reaching the poor and in improving theirincome levels 3 . An important aspect of theprogramme is that it envisages a process ofgraduation whereby families can begin informal
3 NABARD, Mumbai (2000); Micro Finance for Rural People An Impact Evaluation

EMPLOYMENT PERSPECTIVE
153
sector activities through micro credit extended bySHGs but can, in due course, access larger amountof loans directly from the banks.
5.57 The Reserve Bank of India has taken anumber of steps to encourage bank lending to SHGsas a part of mainstream banking activity. Creditextended by commercial banks to SHGs is treatedas part of priority sector lending in order to encour-age banks to engage in this type of activity. Bankshave also been given considerable flexibility todetermine procedures and design loan products forSHGs responding to local conditions. A microfinance development fund has also been establi-shed in NABARD to give training to SHGs members,partner NGOs, banks and government agencies,
provide start up funds to micro finance institutionsand meet their initial operating deficits, and meetthe cost of formation and nurturing of SHGs. Theprogramme of providing credit to SHGs, which hasmade a good start, is a potentially important mecha-nism for expanding credit to the informal sector andshould be greatly expanded in future.
SERVICES SECTORS
Health and Nutrition Services
5.58 Access to quality health services of thepopulation at large is one of the main indicators ofsocial development. The existing facilities in theareas of health and nutrition services are highly
Source : Planning Commission (2002); Report of Special Group on Targeting Ten MillionEmployment Opportunities per year.
Box 5.3MICRO FINANCE
The rural poor in the unorganised sector has yet not been able to come out of the clutches ofmoneylenders charging usurious interest rates. The credit needs of the rural poor are characterised bythe absence of any clear distinction between production and consumption purposes. The needs aresmall, but often arise at unpredictable times and are usually of an emergent nature. Meeting these creditneeds as and when they arise is crucial, if their dependence on unorganised credit agents is to bereduced. However, it is a fact that borrowing from informal agents is very convenient, though the termsare harsh. The credit needs of the rural poor are at present only partially met by the formal creditagencies and a majority of the rural poor continues to depend on the informal sources of credit.
A study conducted by Pricewaterhouse Coopers, a firm of Chartered Accountants, reveals thefollowing pattern of credit usage by the rural poor.
** 63 percent of total credit availed by the rural poor is used for consumption purposes.
** Only 37 percent of the total credit availed by the rural poor is for productive use.
** The overall share of organised sector in credit flow to the rural poor is around 16 per cent.
The study gave the following reasons for this distortion:
** Non-availability of credit for consumption needs from the organised sector.
** Very high transaction cost to the borrowers from the organised sector.
** Rigidity of terms and conditions for a loan from organised sector.
** Delay in sanction of loans by the organised sector.
** Very high rate of defaults under the Government Sponsored Programmes has led to reluctance onthe part of the banks to extend credit to rural poor.
Non-availability of credit from the organised sector, like commercial banks and developmental banks,limits the credit flows to the unorganised sector and accordingly limits the productivity improvement inthis sector.

TENTH FIVE YEAR PLAN 2002-07
154
inadequate, especially in rural areas. The implica-tions of poor health services or non-availability ofthese services at a reasonable cost can beeconomic as well. Data from NSSO indicate thatescalating cost of health services is one of thereasons for indebtedness not only among poor butalso among the middle-income group. There aresharp inter-state/inter-district variations in availabilityand utilisation of health care services. Considerableexpansion is needed to provide minimum level ofaccess to every citizen. Thus, in terms of the needfor services, this sector affords promise of immenseemployment opportunities. There is also a very largescope for more efficient use of the available infra-structure, which will enable increased use of healthservices, and associated demand for health andrelated workers.
5.59 During the Tenth Plan the effort would beto universalise access at least to primary health carefacility, not only in terms of creating physicalinfrastructure but also in terms of equipping eachhealth care centre with adequate medical and paramedical staff. The State will be required to play animportant role in providing these services at afford-able cost. However, within the Government sectorthere have been persistent gaps in manpower andinfrastructure especially at the primary health carelevel in remote, rural, tribal and urban slum areaswhere health care needs are greatest. Also, as it istoday, there exists a mismatch between personneland health infrastructure. Expansion of health facilityand its adequate manning as per the existing normswill create demand for educated and skilledmanpower for this sector.
5.60 The critical constraint of course is avail-ability of resources with the State Governments andlocal authorities. The initiatives at collection of usercharges in public services, and risk pooling throughinsurance should supplement the resources of theGovernment. New initiatives to improve the effici-ency of the public health delivery system will alsoaugment the resource base. Still, a large part ofthe health care is procured from private establish-ments. However, outside the government, thecapability to manage hospitals has remainedconfined to a few corporate groups.
5.61 On the other hand, the medical insuranceindustry has not evolved to a reasonable level ofprofessionalism, which can inspire confidenceamong the buyers of insurance. Insurance mecha-nisms, designed especially for the low-incomegroups, need to be developed. Introduction of healthcare support as a part of the social security insu-rance of workers in the unorganised sector will helpin reducing risk to the individual and also makeavailable resources for investment.
5.62 An associated issue is the need for crea-tion of facilities for training para medical staff
Education Services
5.63 Out of approximately 200 million childrenin the age group 6-14 years, only 120 million are inschools and net attendance in the primary level isonly 66 per cent of enrolment. To achieve educationfor all, the Sarva Shiksha Abhiyan has beenlaunched. The process of integrating our educa-tional system with the economic needs of the peopleand of the nation must begin at the primary schoolstage itself. Assertion of the dignity of labour andvocationalisation of curricula are essential to ensurethat a disjunction does not take place between theeducational system and the work place.
5.64 Universalising access to primary educa-tion and improvement of basic school infrastructurein the Tenth Plan would mean targeting the provisionof one teacher for every group of 40 children forprimary and upper primary schools, opening of aprimary/alternative schooling facility within one kmof every habitation, provision of free textbooks toall SC/ST children and girls at the primary and upperprimary school, management and repair of schoolbuildings through school management committees,provision of opportunities for non-formal andalternative education for out of school children inthe most backward areas and from un-reachedsegments of the population in response to localneeds and demands articulated at the grass rootlevel.
5.65 Mere establishment of schools withouthiring teachers happens in many parts of the

EMPLOYMENT PERSPECTIVE
155
country, especially in rural areas. It is thereforeessential that control over schools and teachersbe transferred to local bodies which have a directinterest in teacher performance. States should beencouraged to implement the 73rd and 74thAmendments of the Constitution, which facilitate thetransfer of management of primary and upperprimary schools to panchayats/local bodies. Plan-ning, supervision and management of educationwould have to be through local bodies at district,block and village levels. Efforts should also be madefor social mobilisation of local communities for adultliteracy campaigns and for promotion of primaryeducation.
5.66 Laws, rules and procedures regardingfacilitation of educational institutions must bemodernised and simplified so that honest andsincere individuals and organisations can set upuniversities, colleges and schools. Controls on fees,teacher salaries, infrastructure, and staff strengthmust be replaced by a strong regulatory frame work.The regulatory system must also put the greatestemphasis on fraud detection and punishment whileletting normal individuals function more freely.
Vocational Training Services
5.67 There is a very large unmet need forimparting vocational training to the new entrants tolabour force as only about 5 per cent or so enterthe world of work with any kind of formal vocationaltraining. If the employers, the educational infra-structure and labour administration can join, this gapcan be filled.
5.68 Outturn from schools at 10+ stage has sofar been a small fraction of those in the 15 to17years age group. However, after the introduction ofcompulsory education in 6-14 years age group,which is the target in the Tenth Plan, the utilisationof youth in occupations appropriate for educatedpersons has to be considered. The educated youthcan take up better occupations than manual workor petty business. To bring them to the mainstreamof economic activities, imparting of some productionand professional skills is essential. The presentapproach is to put most of the youth through a higher
technical, medical or management educationsystem. Simultaneous with the incidence of risingunemployment among those with higher education,is also shortage of trained technicians, paramedics,accounts, insurance, legal and other commercialassistants. These requirements are met at presentby employing those who acquire the requisite skillsthrough 'hands-on' experience. And such oppor-tunities are restricted to those youth who somehowfind an entry point in a good establishment.
5.69 As part of education, vocationalisationschemes have been tried. But, these have notsucceeded because requisite equipments, andteachers, who have requisite work experience, arenot available. Moreover, as a part of school educa-tion, the vocational stream carries a lower priorityamong the students. The other approach has beenthe apprenticeship scheme, whereby educated ortrained youth can be placed in establishments.Establishments are required to pay a stipend totrainees. However, the number of seats in this hasremained rather small. Further promotion of voca-tional training as a part of entrepreneurial activitycan provide employment opportunities
Information Technology
5.70 The potential contribution of informationtechnology to employment generation is both directand indirect. The indirect impact of IT is far greaterthan the direct impact. In the USA, it is estimatedthat for every direct job created in the IT industry,three to four jobs are created by indirect ones. Thisdoes not include the non-IT jobs created by thegrowth of other sectors of the economy under thestimulus of information technology.
5.71 It is assessed that IT will contribute toapproximately 0.2 million jobs per year and aroundone million at the end of the Tenth Plan as additionaldirect employment.
5.72 The real employment potential of Informa-tion and Communication Technology (ICT) will berealised when such services support thecommunity, social and personal services requiredby the Indian masses. This is the issue of digital

TENTH FIVE YEAR PLAN 2002-07
156
divide, on which adequate policy attention has notso far been focussed in India. Many efforts havebeen made at at the use of ICT in education, health,nutrition, housing, real estate, banking, insuranceand other personal services, However, not all ofthem have been designed with the perspective ofa low budget consumer. The cost of research ontechnology keeps the cost high. The real purposeof planning for ICT, which is to narrow and eliminatethe digital divide, will be defeated if the issue is notconsidered in its proper perspective.
Tourism; Domestic and International
5.73 Development of tourism needs to be takenup on priority basis as India has large untappedtourism potential, which can be successfully harnes-sed for the benefit of development of areas, thathave remained underdeveloped despite beingpotential destinations of tourist attractions. Theemployment impact of development of touristdestinations can be substantial as the activity in itselfis labour intensive and also has extensive forwardand backward economic linkages.
5.74 The focus during the Tenth plan would beto encourage public-private partnership in develop-ment of tourist centres in which the governmentwould be the active facilitator and catalyst, with theultimate goal of creating world-class infrastructureand innovative products.
Housing, Real Estate Development andConstruction
5.75 The real estate development and cons-truction are linked activities and are employmentintensive too. Unfortunately, development andgrowth of housing and the real estate sector hasbeen severely constrained by outdated laws andpolices governing land development and rent controlwhich have pushed the market underground andspawned a host of undesirable practices.
5.76 The construction activities are very muchinfluenced by the real estate developments. Therecent repeal of the Land Ceiling Act, likely to befollowed by the States, to free land market will
largely boost the real estate activities. The proposedrepeal of the Rent Control Act will further encouragethe growth of this sector. In a package proposed inthe Tenth Plan to give incentives to the cities andStates for urban sector development, there hasbeen a proposal for recommending selectivefreedom to convert rural land for urban use,reduction of stamp duty on transfer of property andlaws facilitating private development of township -all of which will increase the real estate growth, andthereby generate increased demand forconstruction.
5.77 It is noticed that in the organised andmechanised segment, there has been a very lowemployment elasticity and, at this point of time, verylittle contribution to the employment generation inthis sector, whereas in the unorganised segmentemployment elasticity is very high. Butunfortunately, their wage rates are very low becauseof low productivity in this segment along with, heavyexploitation of labour by the employers in theabsence of proper legislative safeguards.
5.78 Both the large mechanised activities andthe small and medium ones have their own respec-tive roles and will survive alongside. In the area ofbridges, major irrigation and dam construction, high-rise buildings etc., the large mechanised cons-truction activities will be unavoidable. But at thesame time, in the areas like rural road building, lowcost housing, minor irrigation etc., the smallconstruction units with minimum improvement inmechanisation can serve the purpose and fulfill theneed for generating more jobs.
Road Transport and Road Construction
5.79 Transport and allied activities provideemployment to around 15 million persons. Thelargest share in this is of those engaged in transportof freight and passengers by road. It has potentialfor three to four million additional employmentopportunities during the Tenth Plan period. Withthe completion of various stretches of the NationalHighways Development Project, the traffic flows,and thereby the employment opportunities, canexpand much more than this projection.
EMPLOYMENT PERSPECTIVE
157
5.80 The activity is highly decentralised andwork conditions are strenuous; it carries a high risk.Since the administration of this activity is with theState transport authorities, the conditions ofemploy-ment do not get any significant attention.There are however sufficient resources generatedin transport activity. Just like construction workers,the welfare measures for transport workers needattention.
Distributive and Retail Trade
5.81 The Group of activities 'trade, hotels,and restaurants' is estimated to provideemployment opportunities to around 41 millionpersons. The importance of trade in providingan outlet to newly emerging industries -processed food products, milk and milk products,khadi and village industries products, etc., hasbeen noted earlier. The large organisationsproducing consumer products and consumerdurables have established their own retail chains- as for example KVIC, National DairyDevelopment Board (NDDB), shoe industry etc.But product-specific stores have a large shareof overhead expenditure. Other large corporatefirms, which deal in group of personal toiletry,edible oil, food products, and automobiles etc.,have evolved direct arrangements with retailtrade, bypassing the wholesale trade.
5.82 Given the large employment potential,there has been a keen discussion on policiesconcerning distributive and retail trade. A better-
organised retail trade can open up a large numberof gainful employment opportunities to youth,either as self-employed or as shop managers,supervisors, and assistants. So far the organisedretail trade establishments have remainedconfined to public sector-government ownedsocieties, bazaars, and emporia. But many ofthese failed as direct financial support orpurchase price preference from Governmentreduced. The private corporate sector shouldbe encouraged to set up retail chains in smalland medium towns and metros. Requisitechanges in laws concerning rents, land use,property acquisition, and bank finance policiesmay be made so that the prime retailing activitydoes not remain confined to the property owners(also the local governments), which keeps theentry cost at exorbitant levels. In the process,the gainful and productive employment to thosewho work in shops suffers since the fixed costuses up the bulk of the resources of the newventures.
(iii) CREATION OF ADDITIONALEMPLOYMENT OPPORTUNITIES BYTAKING UP LABOUR INTENSIVEACTIVITIES
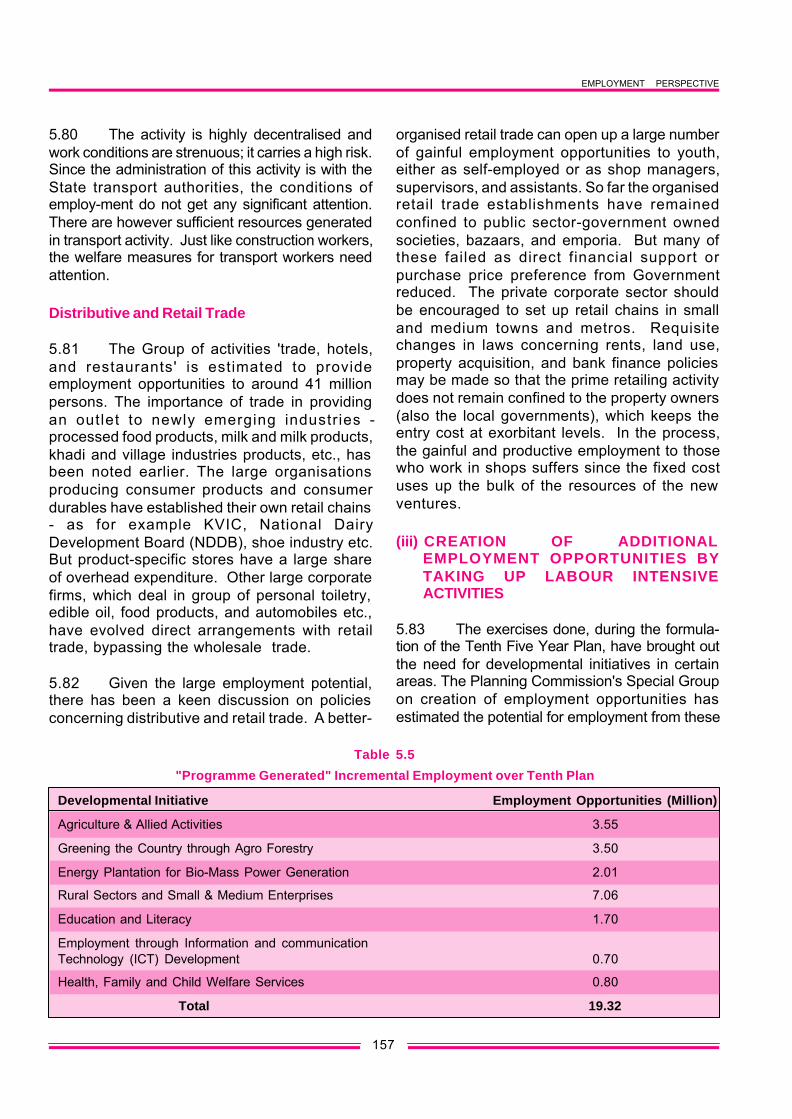
5.83 The exercises done, during the formula-tion of the Tenth Five Year Plan, have brought outthe need for developmental initiatives in certainareas. The Planning Commission's Special Groupon creation of employment opportunities hasestimated the potential for employment from these
Table 5.5
"Programme Generated" Incremental Employment over Tenth Plan
Developmental Initiative Employment Opportunities (Million)
Agriculture & Allied Activities 3.55
Greening the Country through Agro Forestry 3.50
Energy Plantation for Bio-Mass Power Generation 2.01
Rural Sectors and Small & Medium Enterprises 7.06
Education and Literacy 1.70
Employment through Information and communicationTechnology (ICT) Development 0.70
Health, Family and Child Welfare Services 0.80
Total 19.32

TENTH FIVE YEAR PLAN 2002-07
158
(Table 5.5).5.84 These projections have been made inconsultation with the concerned sectoral ministries.The details at the sub-sector level are given inAnnexure 5.19.
5.85 In the agriculture sector, the switching ofacreage from cereals to oilseeds and pulsesincreases the requirement for labour. The NationalWatershed Development Project for rain-fed areascreates direct employment through activities relatingto conservation and development of land and waterresources such as bunding, check dams, waterharvesting structures, nurseries, etc. The on-farmwater management is a new programme, for theeastern States, comprising installation of shallowtube wells and pump-sets, low lift irrigation,installation of diesel pump-sets and construction ofdug wells. The area under horticulture would beincreased. Agri-clinics will provide the services oftrained agricultural graduates for the purposes ofseed certification, seed production and distribution.Skilled manpower would also be required formaintenance and operation of farm machineryincluding tractors.
5.86 Ten million hectares of degraded forest isproposed to be re-generated during the Tenth Plan.India is one of the eight identified global centres forplant diversity. Projects can be taken up in medicinalplants to produce a whole range of therapeutics,food supplements, cosmetics, toiletries and nutra-ceuticals, and veterinary medicine. Substitution oftimber by bamboo is a viable alternative, though itrequires development of bamboo culture.
5.87 Production of bio-mass for energyincludes cultivation of trees, such as Casuarina,equistifolia, and bush crops such as prosopis, juli-flora, and plantation of Casuarina trees on marginalwastelands. Such plantations can support 10 to 12MW power plants. Production of bio-fuel-ethanolfrom sugarcane plantations is also suggested.
5.88 In the rural sectors, Pradhan Mantri GramSarak Yojana (PMGSY), Sampoorna GraminRozgar Yojana (SGRY), Swarnajayanti Gram Swa-rozgar Yojana (SGSY) are expected to create incre-mental employment opportunities to the extent of2.86 million. The rural employment generationprogramme of KVIC, PMRY and new initiatives atdevelopment of clusters of small and medium enter-prises are expected to create additional 4.2 millionemployment opportunities during the Tenth Plan.
5.89 Expansion of elementary education,training of teachers and manpower requirement atresource centres will create 1.7 million additionalwork employment opportunities during the TenthPlan period. Development of Information andCommunication Technology and Health and ChildCare services will enable creation of an additional1.5 million employment opportunities.
5.90 These initiatives are required for specificdevelopmental needs and, apart from two (SGRYand SGSY), these are not in the category of specialemployment programmes. The details are indicatedin the respective chapters.
5.91 The sectoral policy initiatives have beendiscussed in the earlier sections to stimulate growthof output of these sectors. On the basis of employ-ment trends observed in the past, the growth ofthese sectors, corresponding to 8 per cent GDPgrowth target of the Tenth Plan should enable acreation of 30 million additional employment oppor-tunities. But this would mean an increase in thenumber of unemployed persons. Unemploymentrate will increase from 9.2 per cent to 9.8 per centin 2002. (Annexure 5.14) The creation of additionalemployment opportunities by taking up labour inten-sive activities is therefore required to reduce theincidence of unemployment to 5.1 per cent. Prioritywill have to be given in implementing the projectsin the developmental initiatives identified above

EMPLOYMENT PERSPECTIVE
159
Annexure 5.1
Past and Present Macro Scenario on Employment and Unemployment on CDS Basis
(Person years)
(Million) Growth per annum (%)
1983 1993-94 1999-2000 1983 to 1993-94 1993-94 to 1999-2000
ALL INDIA
Population 718.20 894.01 1003.97 2.00 1.95
Labour Force 261.33 335.97 363.33 2.43 1.31
Workforce 239.57 315.84 336.75 2.70 1.07
Unemployment Rate (%) (8.3) (5.99) (7.32)
No. of Unemployed 21.76 20.13 26.58 -0.08 4.74
RURAL
Population 546.61 658.83 727.50 1.79 1.67
Labour Force 204.18 255.38 270.39 2.15 0.96
Workforce 187.92 241.04 250.89 2.40 0.67
Unemployment Rate (%) (7.96) (5.61) (7.21)
No. of unemployed 16.26 14.34 19.50 -1.19 5.26
URBAN
Population 171.59 234.98 276.47 3.04 2.74
Labour Force 57.15 80.60 92.95 3.33 2.40
Workforce 51.64 74.80 85.84 3.59 2.32
Unemployment Rate (%) (9.64) (7.19) (7.65)
No. of Unemployed 5.51 5.80 7.11 0.49 3.45
Note : All estimates are on CDS (Current Daily Status basis)Figures in brackets denote percentage
Source : NSSO & Population Census
TENTH FIVE YEAR PLAN 2002-07
160
Ann
exur
e 5.
2
Pre
sen
t Sec
tora
l Em
plo
ymen
t Sce
nar
io (1
999-
2000
)
Sec
tors
Em
ploy
Em
plo
ymen
t in
Mill
ion
% o
f or-
% o
f%
of
Abs
olut
eS
ecto
ral
Sec
tora
l-m
ent
Em
ploy
To
tal
Org
anis
edga
nise
d%
of
pu
blic
Pri
vate
Em
ploy
GD
PG
DP
Ela
stic
ity-m
ent
sect
orp
ub
licse
ctor
sect
or t
o-
men
tG
row
thG
row
th19
83 to
Ela
stic
ityC
urr
ent D
aily
Pub
licP
riva
teto
tota
lse
ctor
to to
tal
tota
l%
Co
m-
%%
1993
1993
-94
Sta
tus
(CD
S)
Sec
tor
Sec
tor
Tota
lse
ctor
al to
tota
lO
rga-
Org
anis
edp
osi
tion
1983
to19
83 to
-199
4to
200
019
8319
93-9
419
99-
1999
1999
1999
empl
oyE
mp.
nise
d19
93-9
419
93-9
420
00-m
ent
01
23
45
67
89
10
11
12
13
14
15
1.A
gric
ultu
re0.
700.
0115
1.35
190.
7219
0.94
0.52
0.87
1.39
0.73
0.27
37.1
662
.84
56.7
02.
903.
10
2.M
inin
g &
Qua
rryi
ng0.
59-0
.41
1.74
2.54
2.26
0.93
0.09
1.01
44.6
941
.15
91.4
18.
590.
676.
204.
70
3.M
anuf
actu
ring
0.38
0.33
27.6
935
.00
40.7
91.
575.
186.
7516
.55
3.95
23.2
576
.75
12.1
16.
007.
80
4.E
lect
ricity
, G
as
&0.
63-0
.52
0.83
1.43
1.15
0.96
0.04
1.00
96.9
683
.48
95.9
14.
090.
348.
406.
80W
ater
Sup
ply
5.C
onst
ruct
ion
0.86
0.82
7.17
11.0
214
.95
1.11
0.07
1.18
7.90
7.42
93.9
76.
034.
444.
906.
30
6.Tr
ade,
Hot
els
and
0.68
0.62
18.1
726
.88
37.5
40.
160.
320.
491.
310.
4333
.54
66.4
611
.15
5.60
9.20
Res
taur
ants
7.Tr
ansp
ort,
Sto
rage
0.55
0.63
6.99
9.88
13.6
53.
080.
073.
1523
.08
22.5
697
.81
2.19
4.05
6.10
8.70
& C
omm
unic
atio
n
8.Fi
nanc
ing,
Ins
uran
ce,0
.45
0.64
2.10
3.37
4.62
1.30
0.36
1.65
35.7
129
.14
78.3
421
.66
1.38
10.1
08.
40R
eal
Esta
te a
ndB
usin
ess
Ser
vice
s
9.C
omm
unity
, S
ocia
l0.
68-0
.25
23.5
234
.98
30.8
49.
791.
7011
.49
37.2
631
.74
85.2
114
.79
9.16
5.70
8.40
and
Pers
onal
Ser
vice
s
All
0.52
0.16
239.
5731
5.84
336.
7519
.42
8.70
28.1
18.
345.
7769
.06
30.9
410
0.00
5.20
6.70
Sou
rce
:N
atio
nal A
ccou
nts
; CS
ON
SS
O :
Var
ious
Rou
nds
DG
E&
T, M
inis
try o
f Lab
our
EMPLOYMENT PERSPECTIVE
161
Annexure 5.3B
Growth in Workforce for Major States 1991-2001 (Census Based)(Main Workers)
States Workforce Growth States Workforce Growth
Andhra Pradesh 0.19 Madhya Pradesh 0.47
Assam 0.13 Maharashtra 1.41
Bihar 0.72 Orissa -0.81
Gujarat 1.46 Punjab 2.53
Haryana 2.83 Rajasthan 2.28
Himachal Pradesh 1.00 Tamil Nadu 0.38
Karnataka 1.13 Uttar Pradesh 0.11
Kerala -0.08 West Bengal 1.16
All India 0.81
Source : Population Census (1991 & 2001)
Annexure 5.3A
Workforce Increase Between 1981-1991& 1991- 2001 (Census Based)
Heads 1981 1991 % growth 2001 % growth1981-91 (1991-2001)
1. Population (million) 683.33 846.30 2.16 1025.25 1.94
2. Participation Rates (%)(Main workers) 33.50 34.10 0.18 30.50 -1.11
3. Work Force (million)(Main workers) 228.92 288.59 2.34 312.70 0.81
4. Marginal Worker (%)participation Rates 3.20 3.40 0.61 8.70 9.85
5. No. of MarginalWorkers (million) 21.87 28.77 2.78 89.20 11.98
Source : Population Census (1981, 1991 & 2001)

TENTH FIVE YEAR PLAN 2002-07
162
Annexure 5.4
Growth of Workers - Economic Census
1980 1990 1998
Rural*
Workers (million) 24.20 32.20 38.10
Growth Rate (%) 2.88 2.15
Urban
Workers (million) 29.00 38.20 42.50
Growth Rate (%) 2.81 1.34
Combined
Workers (million) 53.20 70.40 80.60
Growth Rate (%) 2.84 1.71
Note : * The Rural Sector in Economic Census excludes farm sector and plantationSource : Economic Census
Annexure 5.5
Total Employment and Organised Sector Employment Growth rate (per cent p.a.)
Heads 1983 to1993-94 1993-94 to1999-2000
Total Population 2.00 1.95
Total Labour Force 2.43 1.31
Total Employment 2.70 1.07
Organised Sector Employment* 1.20 0.53
Public Sector 1.52 (-) 0.03
Private Sector 0.45 1.87
Note : * Organised Sector Employment growth rates correspond to the periods31.3.1983 to 31.3.1994 and 31.3.1994 to 31.3.1999
Source : DGE&T, Ministry of labour

EMPLOYMENT PERSPECTIVE
163
Annexure 5.7
Growth of Average Daily Wage Earnings in Rural India (at 1993-94 prices)
(per cent per annum)
Rural Male Rural Female
1987-88 to 1993-94 to 1987-88 to 1993-94 to1993-94 1999-00 1993-94 1999-00
Public Works 1.55 3.83 1.90 5.04
Casual Labour In Agriculture 1.36 2.80 2.34 2.94
Casual Labour In Non Agriculture 1.33 3.70 1.32 5.07
Casual Labour In All Activities 0.77 3.59 1.95 3.19
Source : NSSO
Annexure 5.6
Sectoral Employment Elasticities on CDS Basis
Employment Elasticity
1983 1983 1993-94Sectors to to to
1987-88 1993-94 1999-2000
Agriculture 0.87 0.70 0.01
Minings and Quarrying 1.25 0.59 -0.41
Manufacturing 0.59 0.38 0.33
Electricity, Gas and Water Supply 0.30 0.63 -0.52
Construction 2.81 0.86 0.82
Trade, Hotels and Restaurent 0.87 0.68 0.62
Transport, Storage and Communication 0.47 0.55 0.63
Financing, Insurance, Real Estate and Business Services 0.49 0.45 0.64
Community, Social and Personal Services 0.52 0.68 -0.25
ALL 0.68 0.52 0.16
Note : Elasticity may change after adjustment of workers of Repair servicesSource : NSSO (For estimating employment growth rates) and NAS (for estimating GDP growth rates)
TENTH FIVE YEAR PLAN 2002-07
164
Annexure 5.8
Unemployment Rate among the Youth (15-29 years) on CDS Basis(1999-2000)
Age Groups Unemployment Rate (per cent of labour force)
(year) Male Female
Rural India15-19 13.10 12.80
(9.00) (8.30)
20-24 11.70 12.10(10.30) (8.20)
25-29 9.20 7.70(7.70) (6.50)
15-29 11.10 10.60(9.00) (7.60)
Urban India15-19 19.00 18.00
(16.20) (18.60)
20-24 17.10 25.90(17.00) (28.50)
25-29 10.30 13.10(9.30) (15.50)
15-29 14.70 19.10(13.70) (21.20)
Note : The figures in parentheses give the corresponding rates for NSS 50th Round (1993-94)Source : NSSO

EMPLOYMENT PERSPECTIVE
165
Annexure 5.9
Current Daily Status Unemployment Rates for Each State and U.T.(1999-2000)
Unemployment Rate (per cent of labour force)
States Rural Urban
Male Female Persons Male Female Persons
1 2 3 4 5 6 7
Andhra Pradesh 8.10 8.10 8.10 7.20 8.90 7.60
Assam 6.40 12.50 7.40 9.90 21.90 11.90
Bihar 7.20 6.20 7.00 8.70 13.50 9.30
Gujarat 5.10 4.20 4.80 4.00 5.40 4.20
Haryana 5.30 1.80 4.70 4.50 4.90 4.50
Himachal Pradesh 3.40 9.00 2.40 7.00 11.90 7.80
Karnatakka 4.40 4.00 4.30 5.30 5.90 5.40
Kerala 20.00 26.10 21.70 15.50 28.20 19.10
Madhya Pradesh 4.00 3.50 3.80 7.20 5.70 7.00
Maharashtra 6.30 6.90 6.50 7.70 10.00 8.10
Orissa 7.60 5.60 7.10 9.80 8.20 9.50
Punjab 4.20 1.70 3.70 4.80 5.30 4.90
Rajasthan 3.30 1.90 2.80 4.70 3.50 4.50
Tamil Nadu 14.30 12.30 13.50 9.00 8.60 8.90
Uttar Pradesh 4.00 2.10 3.60 6.30 5.00 6.20
West Bengal 15.20 25.10 17.00 10.00 13.90 10.60
All India 7.20 7.00 7.20 7.30 9.40 7.70
Source : NSSO

TENTH FIVE YEAR PLAN 2002-07
166
Annexure 5.10
Current Daily Status Unemployment Rate among the Youth(Age 15-29) for Each State and U.T.
(1999-2000)(Rural)
State/U.T Unemployment Rate (per cent of labour force)
Male Female Persons
Andhra Pradesh 10.80 8.70 9.90
Assam 12.30 24.90 14.60
Bihar 11.50 8.80 11.00
Gujarat 6.80 6.40 6.70
Haryana 9.00 2.40 8.10
Himachal Pradesh 8.10 2.80 6.10
Karnatakka 6.00 5.60 5.80
Kerala 32.30 45.80 36.30
Madhya Pradesh 5.40 4.00 4.90
Maharashtra 11.30 8.90 10.40
Orissa 12.60 8.40 11.30
Punjab 8.00 3.60 7.00
Rajasthan 5.00 3.30 4.40
Tamil Nadu 19.70 15.30 18.10
Uttar Pradesh 6.80 2.00 6.10
West Bengal 23.00 39.10 26.60
All India 11.10 10.60 11.00
Source : NSSO
EMPLOYMENT PERSPECTIVE
167
Annexure 5.11
Current Daily Status Unemployment Rate among the Youth(Age 15-29 Years) for Each State and U.T.
(1999-2000)(Urban)
State/U.T Unemployment Rate (per cent of labour force)
Male Female Persons
Andhra Pradesh 14.30 16.70 14.80
Assam 22.40 42.70 26.60
Bihar 24.00 28.00 24.40
Gujarat 8.00 11.40 8.50
Haryana 8.00 9.90 8.30
Himachal Pradesh 16.80 37.50 20.50
Karnataka 10.40 10.30 10.50
Kerala 26.60 50.40 34.30
Madhya Pradesh 14.90 12.30 14.60
Maharashtra 15.60 21.10 16.50
Orissa 26.80 20.10 25.50
Punjab 8.90 13.90 9.50
Rajasthan 8.40 10.40 8.80
Tamil Nadu 15.50 15.60 15.60
Uttar Pradesh 12.40 12.70 12.50
West Bengal 23.40 27.20 24.00
All India 14.70 19.10 15.40
Source : NSSO

TENTH FIVE YEAR PLAN 2002-07
168
Annexure 5.12
Unemployment Rates by Household Monthly Per Capita Expenditure Class(1999-2000)
Monthly Per Capita Expenditure Unemployment Rate (CDS)Class (Rs.) per cent of labour force
Rural Urban Rural Urban
0-225 0-300 11.31 9.61
225-255 300-350 9.62 9.67
255-300 350-425 8.12 8.20
300-340 425-500 7.46 9.20
340-380 500-575 6.56 9.20
380-420 575-665 6.18 8.63
420-570 665-775 6.48 8.19
470-525 775-915 6.14 7.18
525-615 915-1120 5.60 6.65
615-775 1120-1500 6.06 5.68
775-950 1500-1925 5.57 4.67
950 & above 1925 & above 5.25 4.10
All All 7.21 7.65
Source : NSSO Survey, 55th Round (1999-00)

EMPLOYMENT PERSPECTIVE
169
Annexure 5.13A
Low Growth Scenario (6.5% Growth over 10th Plan Period).Projection of Employment Opportunities on CDS basis
Items Unit 1999-2000 2001-2002 2006-2007
Labour Force (1.8% per Million 363.33 378.21 413.50annum growth)
Employment Million 336.75 343.36 367.44
No. of unemployed Million 26.58 34.85 45.56
Unemployment rate Percentage 7.32 9.21 11.00
Annexure 5.13B
Low Growth Scenario with Recommended Programmes& Policy Changes on CDS basis
Items Unit 1999-2000 2001-2002 2006-2007
Labour Force Million 363.33 378.21 413.50
Employment Million 336.75 343.36 375.00
No. of unemployed Million 26.58 34.85 38.50
Unemployment rate Percentage 7.32 9.21 9.30
Note : CDS : Current Daily Status

TENTH FIVE YEAR PLAN 2002-07
170
Annexure 5.14
Employment Scenario from 8% Growth per annum and Extrapolated Industrial Structure
(Based on Actual Elasticity (1994-2000) -CDS & 1.8% p.a. Growth in L.F.)
Employment GrowthUnit 1999- 2001$$ 2002$$ 2007 2012 over 10th plan
2000$ per annum
Labour Force(1.8% p.a. Growth) million 363.33 371.52 378.21 413.50 451.53 1.8%
Employment ** # million 336.75 340.82 343.36 373.03 403.52 1.7%
(Unemployment Rate) (%) 7.32 8.26 9.21 9.79 10.63
No. of Unemployed million 26.58 30.70 34.85 40.47 48.01 3.0%
Note : ** Based on 8% Growth in GDP during 2002-07# Current Daily status basis$ 1999-2000 figures related to NSS 55th (July, 1999-June, 2000) Rd.
$$ Based on 5.2% GDP Growth during 2000-01 and 2001-02Source : Planning Commission

EMPLOYMENT PERSPECTIVE
171
Ann
exur
e 5
.15
Em
plo
ymen
t O
pp
ort
un
itie
s S
ecto
r-w
ise
ove
r th
e T
enth
Pla
n*
(per
cen
t pe
r an
num
)
GDP
Gr.
GDP
Gr.
Hig
hP
roje
cted
CD
SC
DS
Proj
ecte
d Em
ploy
men
t#R
ate
of G
row
th in
Em
ploy
men
t (%
)S
ecto
rs20
00-0
120
01-0
2G
row
thEl
astic
ity*
Emp.
Emp.
Em
pl.
Em
pl.
Em
pl.
1993
-94
1999
-200
020
0120
02(%
)(%
)8%
2000
-02
&(1
993-
94)
(199
9-00
)20
00-0
120
01-0
220
002-
07to
toto
toQ
ES
GA
ES
GS
G20
02-0
7(1
.1.1
994)
(1.1
.200
0)(1
.4.2
001)
(1.4
.200
2)(1
.4.2
007)
1999
-200
020
00-0
120
0220
07
1.
Agr
icul
ture
-0.2
00.
205.
703.
404.
200.
0119
0.72
190.
9419
0.95
191.
0119
1.42
0.02
0.00
.03
0.04
2. M
inin
gs a
nd q
uarr
ying
3.30
3.70
1.40
1.10
4.70
-0.4
12.
542.
262.
222.
212.
01-1
.91
-1.5
2-0
.46
-1.9
3
3.
Man
ufac
turin
g6.
705.
603.
302.
6010
.00
0.33
35.0
040
.79
41.7
342
.09
49.5
12.
581.
850.
853.
30
4. E
lect
ricity
, G
as a
nd6.
204.
705.
203.
708.
30-0
.52
1.43
1.15
1.11
1.09
0.88
-3.5
5-2
.44
-1.9
2-4
.32
Wat
er S
uppl
y
5. C
onst
uctio
n6.
805.
502.
902.
808.
300.
8211
.02
14.9
515
.80
16.1
622
.46
5.21
4.51
2.30
6.81
6. T
rade
, hot
els
and
3.80
6.90
6.30
5.80
8.00
0.62
26.8
837
.54
39.5
640
.99
52.2
25.
724.
283.
624.
96re
stau
rant
7. T
rans
port
, Sto
rage
&8.
206.
905.
8010
.30
0.63
9.88
13.6
514
.39
14.9
220
.43
5.53
4.35
3.67
6.49
Com
mun
icat
ion
8. F
inan
cing
, Ins
uran
ce,
2.90
9.10
7.50
11.1
010
.00
0.64
3.37
4.62
4.96
5.32
7.25
5.40
5.82
7.11
6.40
Rea
l Est
ate
and
Bus
ines
sS
ervi
ces
9. C
omm
unity
, Soc
ial &
6.00
7.80
6.00
7.00
7.60
-0.2
534
.98
30.8
430
.09
29.5
726
.86
-2.0
8-1
.95
-1.7
4-1
.90
Per
sona
l Ser
vice
s
All
Sec
tors
4.00
5.20
5.40
5.20
8.00
0.21
315.
8433
6.75
340.
8234
3.36
373.
031.
070.
970.
751.
67
#R
OG
in e
mpl
oym
ent h
as b
een
proj
ecte
d by
taki
ng in
to a
ccou
nt o
bser
ved
sect
oral
ela
stic
ities
bas
ed o
n C
DS
Em
ploy
men
t dur
ing
1994
-200
0 an
d se
ctor
al g
row
th in
GD
P a
t 5.2
% fo
r20
00-0
1 an
d 20
01-0
2, &
8%
dur
ing
2002
-07
*O
bser
ved
Ela
stic
ity d
urin
g 19
94-2
000
base
d on
CD
SQ
E =
Qui
ck e
stim
ates
AE
= A
dvan
ce e
stim
ates
S.G
= S
peci
al G
roup
Est
imat
esN
ote
:
1.P
roje
cted
em
ploy
men
t is
base
d on
sec
tora
l em
ploy
men
t ela
stic
ities
and
sec
tora
l gro
wth
in G
DP
2.P
roje
ctio
ns m
ay n
ot b
e ad
just
ed fo
r Rep
air S
ervi
ces
beca
use
of 3
-dig
it da
ta o
n w
orke
rs d
istri
butio
nS
ourc
e :
Pla
nnin
g C
omm
issi
on
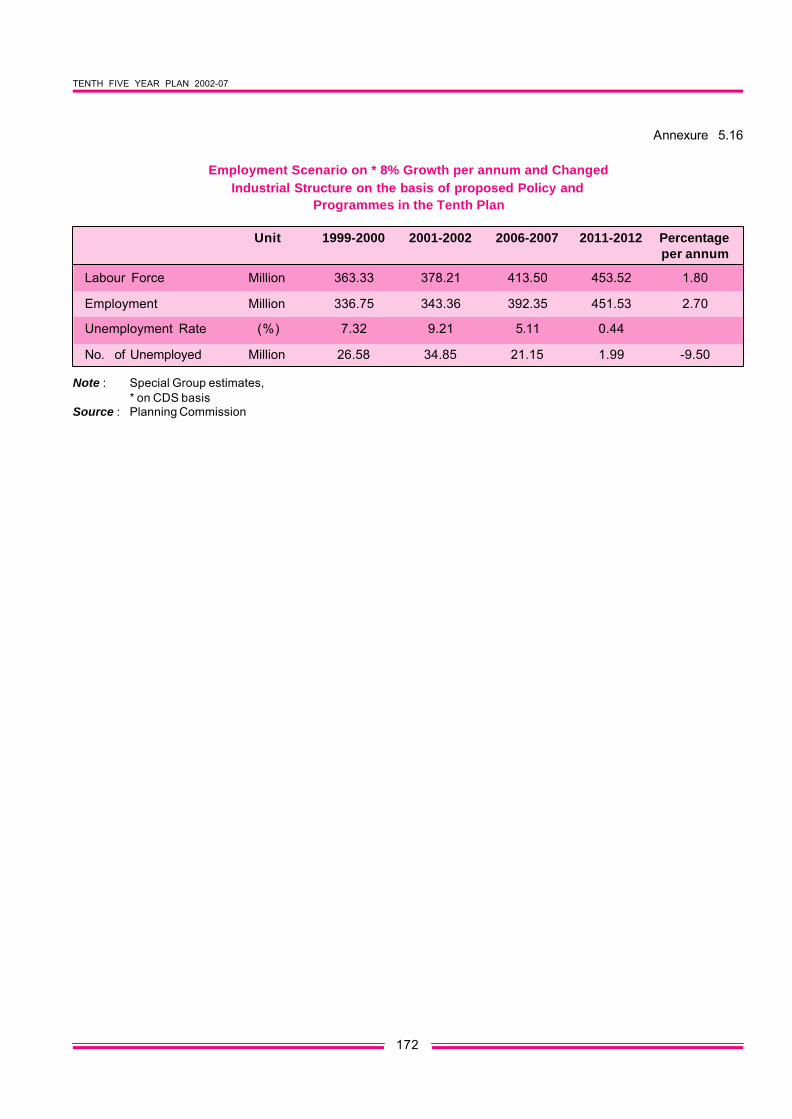
TENTH FIVE YEAR PLAN 2002-07
172
Annexure 5.16
Employment Scenario on * 8% Growth per annum and ChangedIndustrial Structure on the basis of proposed Policy and
Programmes in the Tenth Plan
Unit 1999-2000 2001-2002 2006-2007 2011-2012 Percentageper annum
Labour Force Million 363.33 378.21 413.50 453.52 1.80
Employment Million 336.75 343.36 392.35 451.53 2.70
Unemployment Rate (%) 7.32 9.21 5.11 0.44
No. of Unemployed Million 26.58 34.85 21.15 1.99 -9.50
Note : Special Group estimates,* on CDS basis
Source : Planning Commission

EMPLOYMENT PERSPECTIVE
173
Annexure 5.17
Implicit Movement in Labour Productivity (output per labour)
(Per cent per annum)
1983 to 1993-94 to Projected
1993-94 1999-2000 2001-2002 2006-2007
(A) Based on 1994-2000 Elasticities
GDP (growth) 5.20 6.70 5.20 8.00
Work Force 2.70 1.07 0.98 1.67
Employment Elasticities 0.54 0.16 0.19 0.21
Labour Productivity 2.30 5.60 4.20 6.20
(B) Based on 1994-2000 Elasticities with changes in policies and programmes
Workforce 2.70 1.07 0.98 2.70
Employment Elasticities 0.54 0.16 0.19 0.34*
Labour Productivity 2.30 5.60 4.20 5.20
Note : *Implicit employment elasticity including employment on special programmesSource :Planning Commission

TENTH FIVE YEAR PLAN 2002-07
174
Annexure 5.18
Estimates of Generation of Sectoral Employment Opportunities over the Tenth Plan
Increased Employment Opportunities OverSectoral Base Tenth Plan (million)
Sectors GDP Employment on Programme TotalGrowth (CDS) Estimated and Total Employment
(%) (million) Employment Policy Incremental 200710th Plan 2001-2002 Elasticities Based**
Agriculture & Allied 4.20 191.01 0.41 9.06 9.47 200.48(Including Rural activity)* 4.20 (55.63) (51.09)
Mining & Quarrying 4.70 2.21 -0.20 -0.20 2.01(0.64) (0.51)
Manufacturing & SSI 10.00 42.09 7.42 4.20 11.62 53.71Pradhan Mantri Rozgar (12.26) (13.70)Yojana (PMRY) and RuralEmployment GenerationProgramme (REGP)
Electricity, Gas & Water Supply 8.30 1.09 -0.21 -0.21 0.88(0.32) (0.22)
Constructions 8.30 16.16 6.30 6.30 22.46(4.71) (5.72)
Trade, Hotel & Restaurant 8.00 40.99 11.23 11.23 52.22(11.94) (13.28)
Transport, Storage & 10.30 14.92 5.51 5.51 20.43Communications (4.35) (5.21)
Financial Institutions, 10.00 5.32 1.93 1.93 7.25Real Estate & Business Services (1.55) (1.84)
Community Services, 7.60 29.57 -2.71 3.20 0.49 30.06Social & Personal Services (8.61) (7.64)
Sampoorna Gramin 1.29 2.09 2.09Rozgar Yojana (SGRY)
Swaranjayanti GramSwarojgar Yojana (SGSY) 0.80
Pradhan Mantri GramSadak Yojana (PMGSY) 0.77 0.77 0.77
Aggregate 8.00 343.36 29.67 19.32 48.99 392.35
Note : Brackets denote percentage composition to total.** Detailed breakup is given in Annexure 5.19.
Estimates on person years basis.Source :Planning Commission

EMPLOYMENT PERSPECTIVE
175
Annexure 5.19
"Programme-Generated" Incremental Employment, Over the 10th plan
(million person years)
(a) Agriculture & Allied
1. Diversion to oilseeds and pulses: 0.35
2. National Watershed Development Project for Rainfed Areas (NWDPRA) 0.50
3. Horticulture 1.20
4. On Farm Management 1.25
5. Agriculture Clinics and Seed production 0.15
6. Training and employment of tractor drivers 0.10
------------- > 3.55
(b) Greening the country through Agro Forestry
1. Joint Forest Management (JFM) 1.50
2. Development of medicinal plants 0.50
3. Bamboo Development 1.50
------------- > 3.50
(c ) Energy Plantation for Biomass power Generation
1. Energy Plantation Prosopis and Casuarina 1.22
2. Ethanol (Biofuel from sugarcane plantation) 0.79
------------- > 2.01
(d) Rural Sectors and SMEs
Prime Minister's Rojgar Yojana (PMRY-SSI) 1.65
Cluster Development 0.55
Rural Employment Generation Programme (REGP-KVIC) 2.00
Sampoorna Gramin Rojgar Yojana (SGRY) 1.29
Pradhan Mantri Gram Sadak Yojana (PMGSY) 0.77
Swarnajayanti Gram Swarojgar Yojana (SGSY) 0.80
------------- > 7.06
(e) Education and Literacy
1. Education 1.53
2. Mid day meals 0.06
3. DIET, BRC, CRC, Engineering Staff SPO, DPO 0.09
------------- > 1.70
Employment through ICT Development 0.70
Health, Family and Child Welfare 0.80
GRAND TOTAL 19.32
Source : Report of the Special Group
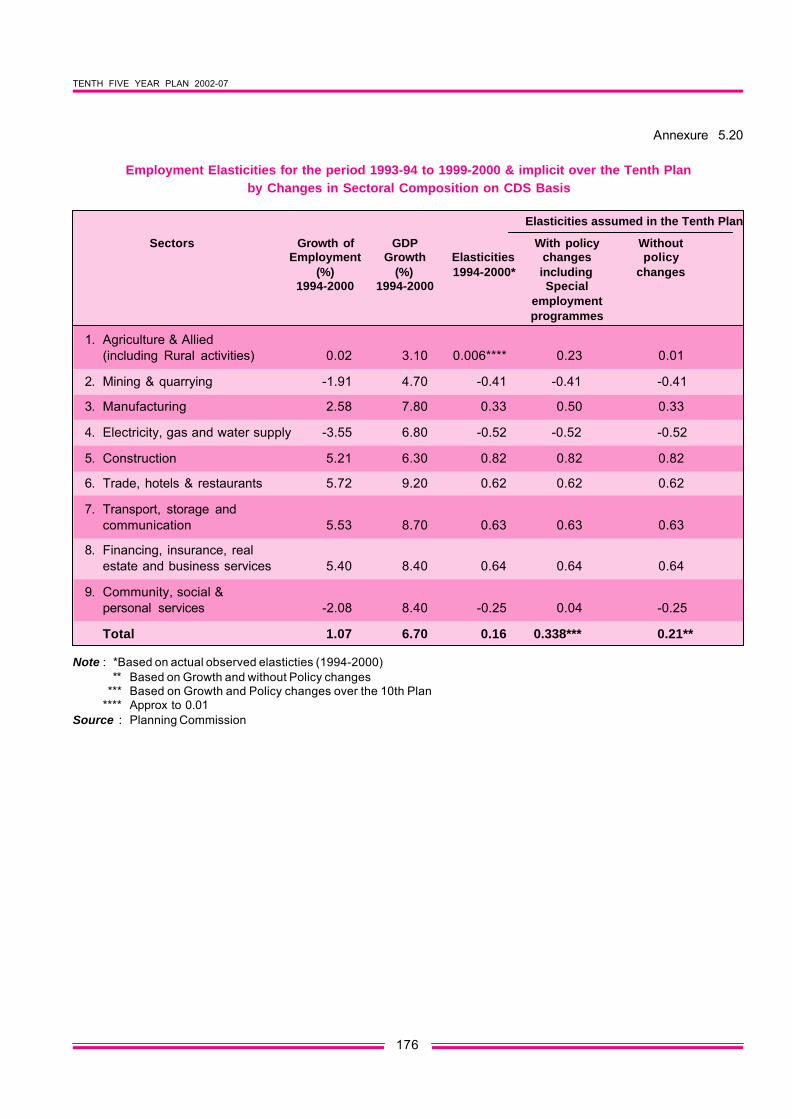
TENTH FIVE YEAR PLAN 2002-07
176
Annexure 5.20
Employment Elasticities for the period 1993-94 to 1999-2000 & implicit over the Tenth Planby Changes in Sectoral Composition on CDS Basis
Elasticities assumed in the Tenth Plan
Sectors Growth of GDP With policy WithoutEmployment Growth Elasticities changes policy
(%) (%) 1994-2000* including changes1994-2000 1994-2000 Special
employmentprogrammes
1. Agriculture & Allied(including Rural activities) 0.02 3.10 0.006**** 0.23 0.01
2. Mining & quarrying -1.91 4.70 -0.41 -0.41 -0.41
3. Manufacturing 2.58 7.80 0.33 0.50 0.33
4. Electricity, gas and water supply -3.55 6.80 -0.52 -0.52 -0.52
5. Construction 5.21 6.30 0.82 0.82 0.82
6. Trade, hotels & restaurants 5.72 9.20 0.62 0.62 0.62
7. Transport, storage andcommunication 5.53 8.70 0.63 0.63 0.63
8. Financing, insurance, realestate and business services 5.40 8.40 0.64 0.64 0.64
9. Community, social &personal services -2.08 8.40 -0.25 0.04 -0.25
Total 1.07 6.70 0.16 0.338*** 0.21**
Note : *Based on actual observed elasticties (1994-2000)** Based on Growth and without Policy changes
*** Based on Growth and Policy changes over the 10th Plan**** Approx to 0.01
Source : Planning Commission