chapter three basic cost management concepts blocher−stout−cokins−chen: cost management: a ......
TRANSCRIPT

Blocher−Stout−Cokins−Chen: Cost Management: A Strategic Emphasis, Fourth Edition
I. Introduction to Cost Management
3. Basic Cost Management Concepts
© The McGraw−Hill Companies, 2008
PART
IIN
TRO
DU
CTIO
N T
O C
OST
MAN
AGEM
ENT
C H A P T E R T H R E E
Basic Cost Management ConceptsAfter studying this chapter, you should be able to . . .
Understand the strategic role of basic cost management concepts
Explain the cost driver concepts at the activity, volume, structural, and executional levels
Explain the cost concepts used in product and service costing
Demonstrate how costs fl ow through the accounts
Prepare an income statement for both a manufacturing fi rm and a merchandising fi rm
Explain the cost concepts related to the use of cost information in planning and decision making
Explain the cost concepts related to the use of cost information for management and operational control
As we will see in this chapter, irrespective of their competitive strategy, successful fi rms findthat they need to apply cost management effectively and, in doing so, to understand the key concepts and terms of cost management. We begin with an example firm that illustrates the importance of understanding the complexity of a firm’s operations—the number and diversity of its products, production processes and locations, distribution networks, types of custom-ers, and so on. Complexity on any of these dimensions will have consequences for costs, and the management accountant has developed the necessary vocabulary to identify and describe these effects.
A good example of a firm that deals effectively with complexity is Proctor & Gamble (P&G), one of the world’s leading consumer products companies, maker of such well-known products as Tide detergent and Crest toothpaste. P&G has achieved success through prod-uct excellence and continuous improvement. One key area of continuous improvement is the firm’s emphasis on cost reduction through product and process simplification. To accomplish this, P&G uses a concept that we study in this chapter: the influence of product and process complexity on overall costs. In the early 1990s, P&G had as many as 50 different varieties of some of its brands, including different size containers, flavors, and so on. In addition to variety, the number of trade promotions, discounts, rebates, and coupons that affected P&G’s net price were complex. The high complexity in products and pricing increased manufacturing costs, inventory holding costs, selling and distribution costs, customer service costs, administrative and accounting costs, and other operating costs. Over a period of five years, P&G reduced its product variety by one-half, and its profits surged. At the same time, P&G improved its supply chain—the process of managing its suppliers—to reduce supply chain cost and to improve product quality and product innovation.
The importance of product simplification to P&G is also reflected by its recent strategic decision not to complete a merger with the drug makers American Home Products Corp. and Warner-Lambert Co. At first glance, the marriage of these three powerful firms might seem to offer a good way to achieve market dominance and economies of scale. On second thought, however, would P&G’s capabilities in developing and marketing consumer brands such as Tide detergent be a competitive advantage in developing and marketing drugs? The technologies and expertise from product development to product marketing and distribution are quite dif-ferent. Moreover, P&G has established an enviable reputation as a consumer-goods company, but it does not have a reputation as a health-focused company (as, for example, does Johnson
1.
2.
3.
4.
5.
6.
7.
LEARNING OBJECTIVE 1 Understand the strategic role of basic cost management concepts.
LEARNING OBJECTIVE 1 Understand the strategic role of basic cost management concepts.

Blocher−Stout−Cokins−Chen: Cost Management: A Strategic Emphasis, Fourth Edition
I. Introduction to Cost Management
3. Basic Cost Management Concepts
© The McGraw−Hill Companies, 2008
Chapter 3 Basic Cost Management Concepts 55
& Johnson). The firm is not likely to maintain a dual image. In fact, a successful strategy normally requires a single focused image in the marketplace, and the merger would dilute and confuse P&G’s already excellent reputation as a consumer-products company. Again, simpli-city and clarity of strategy produce winners.
This chapter explains the strategic role of the key cost concepts used throughout the text. Of the four groups of key concepts, the first group consists of the basic concepts and rela-tionships among cost objects and cost drivers (e.g., complexity as a cost driver and P&G’s products as the cost objects). Each of the remaining three groups includes concepts related to the three management functions: product and service costing, planning and decision making, and management and operational control. The concepts related to strategic management are covered in Chapters 1 and 2 .
A critical first step in achieving a competitive advantage is to identify the key costs and cost drivers in the firm or organization.
A firm incurs a cost when it uses a resource for some purpose. For example, a company producing kitchen appliances has costs of materials (such as sheet metal and bolts for the enclosure), costs of manufacturing labor, and other costs. Often costs are assigned into mean-ingful groups called cost pools . Individual costs can be grouped in many different ways, and therefore a cost pool can be defined in many different ways, including by type of cost (labor costs in one pool, material costs in another), by source (department 1, department 2, and so on), or by responsibility (manager 1, manager 2, and so on). For example, an assembly depart-ment or a product engineering department might be treated as a cost pool.
A cost driver is any factor that has the effect of changing the level of total cost. For a firm that competes on the basis of cost leadership, management of the key cost drivers is essential. For example, to achieve its low-cost leadership in manufacturing, P&G carefully watches the design and manufacturing factors that drive the costs of its products. It makes design im-provements when necessary, and the manufacturing plants are designed and automated for the highest efficiency in using materials, labor, and equipment. For firms that are not cost leaders, the management of cost drivers may not be so critical, but attention to the key cost drivers contributes directly to the firm’s success. For example, because an important cost driver for retailers is loss and damage to merchandise, most of them establish careful procedures for handling, displaying, and storing their merchandise.
A cost object is any product, service, customer, activity, or organizational unit to which costs are assigned for some management purpose. Products, services, and customers are gen-erally cost objects; manufacturing departments are considered either cost pools or cost ob-jects, depending on whether management’s main focus is on the costs for the products or for the manufacturing departments. The concept of cost objects is a broad concept. It also includes groups of products, services, departments, and customers; suppliers; telephone ser-vice providers; and so on. Any item to which costs can be traced and that has a key role in management strategy can be considered a cost object.
Cost Assignment and Cost Allocation: Direct and Indirect Costs Cost assignment is the process of assigning costs to cost pools or from cost pools to cost ob-jects. A direct cost can be conveniently and economically traced directly to a cost pool or a cost object. For example, the cost of materials required for a particular product is a direct cost because it can be traced directly to the product. 1
The materials cost is accumulated in cost pools (manufacturing departments) and then is traced to each product manufactured, which is the cost object. Similarly, an airline’s cost of preparing a passenger’s meal is a direct cost that can be traced to each passenger (the cost object). For a direct cost, the cost driver is the number of units of that object, for example, the number of cartons of Tide produced by P&G, or the number of passengers on Flight 617 for
LEARNING OBJECTIVE 2 Explain the cost driver concepts at the activity, volume, structural, and executional levels.
LEARNING OBJECTIVE 2 Explain the cost driver concepts at the activity, volume, structural, and executional levels.
A cost is incurred when a resource is used for some purpose.
A cost is incurred when a resource is used for some purpose.
Cost pools are the meaningful groups into which costs are often collected.
Cost pools are the meaningful groups into which costs are often collected.
A cost driver is any factor that causes a change in the cost of an activity.
A cost driver is any factor that causes a change in the cost of an activity.
A cost object is any product, service, customer, activity, or organizational unit to which costs are assigned for some management purpose.
A cost object is any product, service, customer, activity, or organizational unit to which costs are assigned for some management purpose.
Cost assignment is the process of assigning costs to cost pools or from cost pools to cost objects.
Cost assignment is the process of assigning costs to cost pools or from cost pools to cost objects.
A direct cost can be conveniently and economically traced directly to a cost pool or a cost object.
A direct cost can be conveniently and economically traced directly to a cost pool or a cost object.
Cost Drivers, Cost Pools, and Cost Objects
1 We use the expression traced directly to the product to mean that it is economically feasible to identify a direct relationship between the cost and the product, as for example, each dishwasher requires a motor, which can be directly traced to that dishwasher.
Blocher−Stout−Cokins−Chen: Cost Management: A Strategic Emphasis, Fourth Edition
I. Introduction to Cost Management
3. Basic Cost Management Concepts
© The McGraw−Hill Companies, 2008
56 Part One Introduction to Cost Management
Delta Airlines. Total direct cost increases directly in proportion to the number of cartons or passengers.
In contrast, there is no convenient or economical way to trace an indirect cost from the cost to the cost pool or from the cost pool to the cost object. The cost of supervising manufacturing employees and the cost of handling materials are good examples of costs that generally cannot be traced to individual products and therefore are considered indirect costs. Similarly, the cost of fueling an aircraft is an indirect cost when the cost object is the individual airline customer since the aircraft’s use of fuel cannot be traced directly to that customer. In contrast, if the cost object for the airline is the flight, the cost of fuel is a direct cost that can be traced directly to the aircraft’s use of fuel for that flight.
Since indirect costs cannot be traced to the cost pool or cost object, the assignment for indirect costs is made by using cost drivers. For example, if the cost driver for materials hand-ling cost is the number of parts, the total cost of materials handling can be assigned to each product on the basis of its total number of parts relative to the total number of parts in all other products. The result is that costs are assigned to the cost pool or cost object that caused the cost in a manner that is fairly representative of the way the cost is incurred. For example, a product with a large number of parts should bear a larger portion of the cost of materials handling than a product with fewer parts. Similarly, a department with a large number of employees should bear a large portion of the cost of supervision provided for all departments.
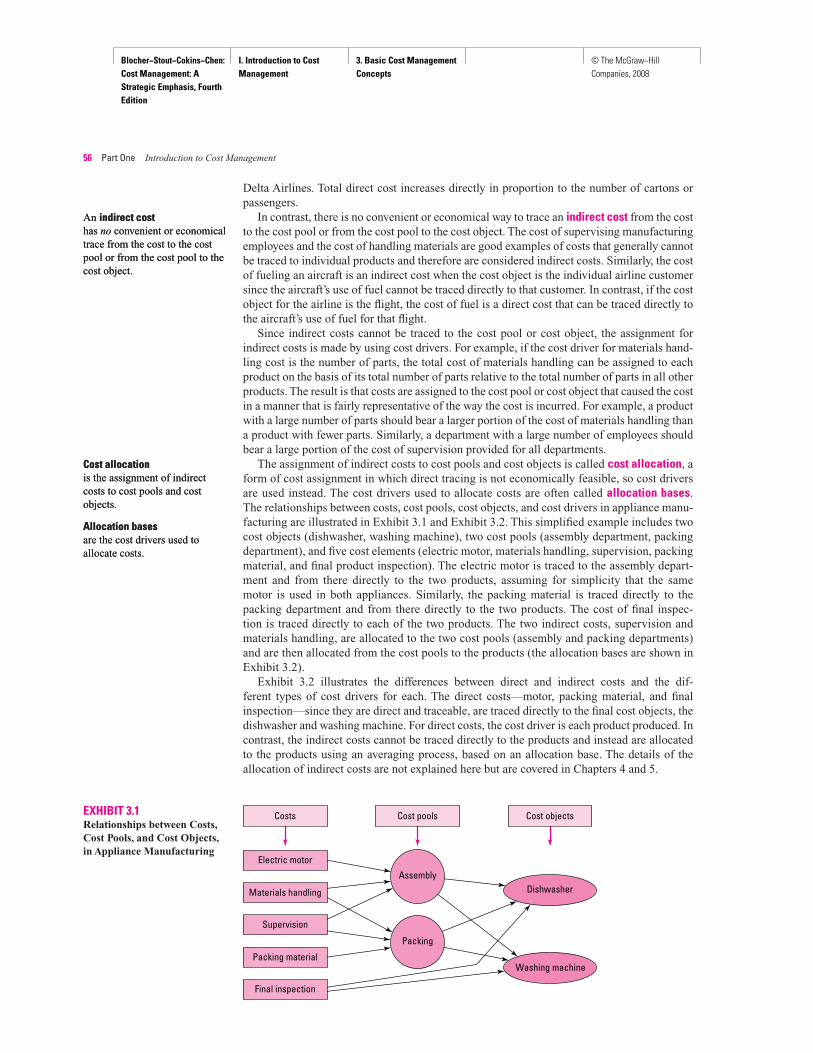
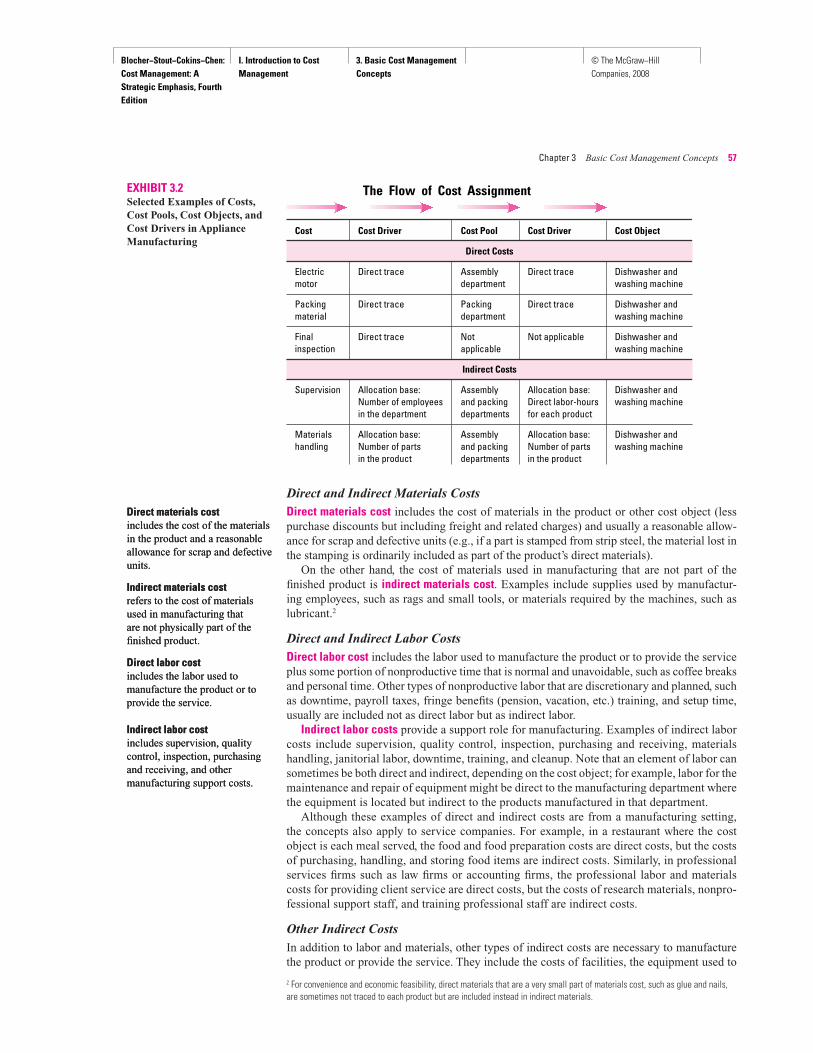
The assignment of indirect costs to cost pools and cost objects is called cost allocation , a form of cost assignment in which direct tracing is not economically feasible, so cost drivers are used instead. The cost drivers used to allocate costs are often called allocation bases .The relationships between costs, cost pools, cost objects, and cost drivers in appliance manu-facturing are illustrated in Exhibit 3.1 and Exhibit 3.2 . This simplified example includes two cost objects (dishwasher, washing machine), two cost pools (assembly department, packing department), and five cost elements (electric motor, materials handling, supervision, packing material, and final product inspection). The electric motor is traced to the assembly depart-ment and from there directly to the two products, assuming for simplicity that the same motor is used in both appliances. Similarly, the packing material is traced directly to the packing department and from there directly to the two products. The cost of final inspec-tion is traced directly to each of the two products. The two indirect costs, supervision and materials handling, are allocated to the two cost pools (assembly and packing departments) and are then allocated from the cost pools to the products (the allocation bases are shown in Exhibit 3.2 ).
Exhibit 3.2 illustrates the differences between direct and indirect costs and the dif-ferent types of cost drivers for each. The direct costs—motor, packing material, and finalinspection—since they are direct and traceable, are traced directly to the final cost objects, the dishwasher and washing machine. For direct costs, the cost driver is each product produced. In contrast, the indirect costs cannot be traced directly to the products and instead are allocated to the products using an averaging process, based on an allocation base. The details of the allocation of indirect costs are not explained here but are covered in Chapters 4 and 5.
An indirect cost has no convenient or economical trace from the cost to the cost pool or from the cost pool to the cost object.
An indirect cost has no convenient or economical trace from the cost to the cost pool or from the cost pool to the cost object.
Cost allocation is the assignment of indirect costs to cost pools and cost objects.
Cost allocation is the assignment of indirect costs to cost pools and cost objects.
Allocation bases are the cost drivers used to allocate costs.
Allocation bases are the cost drivers used to allocate costs.
EXHIBIT 3.1Relationships between Costs, Cost Pools, and Cost Objects, in Appliance Manufacturing
Cost pools
Assembly
Packing
Cost objectsCosts
Electric motor
Materials handling
Packing material
Supervision
Final inspection
Dishwasher
Washing machine
Blocher−Stout−Cokins−Chen: Cost Management: A Strategic Emphasis, Fourth Edition
I. Introduction to Cost Management
3. Basic Cost Management Concepts
© The McGraw−Hill Companies, 2008
Chapter 3 Basic Cost Management Concepts 57
Direct and Indirect Materials Costs
Direct materials cost includes the cost of materials in the product or other cost object (less purchase discounts but including freight and related charges) and usually a reasonable allow-ance for scrap and defective units (e.g., if a part is stamped from strip steel, the material lost in the stamping is ordinarily included as part of the product’s direct materials).
On the other hand, the cost of materials used in manufacturing that are not part of the finished product is indirect materials cost . Examples include supplies used by manufactur-ing employees, such as rags and small tools, or materials required by the machines, such as lubricant.2
Direct and Indirect Labor Costs
Direct labor cost includes the labor used to manufacture the product or to provide the service plus some portion of nonproductive time that is normal and unavoidable, such as coffee breaks and personal time. Other types of nonproductive labor that are discretionary and planned, such as downtime, payroll taxes, fringe benefits (pension, vacation, etc.) training, and setup time, usually are included not as direct labor but as indirect labor.
Indirect labor costs provide a support role for manufacturing. Examples of indirect labor costs include supervision, quality control, inspection, purchasing and receiving, materials handling, janitorial labor, downtime, training, and cleanup. Note that an element of labor can sometimes be both direct and indirect, depending on the cost object; for example, labor for the maintenance and repair of equipment might be direct to the manufacturing department where the equipment is located but indirect to the products manufactured in that department.
Although these examples of direct and indirect costs are from a manufacturing setting, the concepts also apply to service companies. For example, in a restaurant where the cost object is each meal served, the food and food preparation costs are direct costs, but the costs of purchasing, handling, and storing food items are indirect costs. Similarly, in professional services firms such as law firms or accounting firms, the professional labor and materials costs for providing client service are direct costs, but the costs of research materials, nonpro-fessional support staff, and training professional staff are indirect costs.
Other Indirect Costs
In addition to labor and materials, other types of indirect costs are necessary to manufacture the product or provide the service. They include the costs of facilities, the equipment used to
Direct materials cost includes the cost of the materials in the product and a reasonable allowance for scrap and defective units.
Direct materials cost includes the cost of the materials in the product and a reasonable allowance for scrap and defective units.
Indirect materials cost refers to the cost of materials used in manufacturing that are not physically part of the finished product.
Indirect materials cost refers to the cost of materials used in manufacturing that are not physically part of the finished product.
Direct labor cost includes the labor used to manufacture the product or to provide the service.
Direct labor cost includes the labor used to manufacture the product or to provide the service.
Indirect labor cost includes supervision, quality control, inspection, purchasing and receiving, and other manufacturing support costs.
Indirect labor cost includes supervision, quality control, inspection, purchasing and receiving, and other manufacturing support costs.
EXHIBIT 3.2Selected Examples of Costs, Cost Pools, Cost Objects, and Cost Drivers in Appliance Manufacturing
Cost
Electricmotor
Packingmaterial
Finalinspection
Supervision
Materialshandling
Direct Costs
Indirect Costs
Cost Pool
Assemblydepartment
Packingdepartment
Notapplicable
Assemblyand packingdepartments
Assemblyand packingdepartments
Cost Driver
Direct trace
Direct trace
Not applicable
Allocation base:Direct labor-hoursfor each product
Allocation base:Number of partsin the product
Cost Object
Dishwasher andwashing machine
Dishwasher andwashing machine
Dishwasher andwashing machine
Dishwasher andwashing machine
Dishwasher andwashing machine
Cost Driver
Direct trace
Direct trace
Direct trace
Allocation base:Number of employeesin the department
Allocation base:Number of partsin the product
The Flow of Cost Assignment
2 For convenience and economic feasibility, direct materials that are a very small part of materials cost, such as glue and nails,are sometimes not traced to each product but are included instead in indirect materials.
Blocher−Stout−Cokins−Chen: Cost Management: A Strategic Emphasis, Fourth Edition
I. Introduction to Cost Management
3. Basic Cost Management Concepts
© The McGraw−Hill Companies, 2008
58 Part One Introduction to Cost Management
manufacture the product or provide the service, and any other support equipment, such as that used for materials handling.
All indirect costs—for indirect materials, indirect labor, and other indirect items—are com-monly combined into a cost pool called overhead . In a manufacturing firm, it is called factoryoverhead.
The three types of costs—direct materials, direct labor, and overhead—are sometimes combined for simplicity and convenience. Direct materials and direct labor are sometimes considered together and called prime costs . Similarly, direct labor and overhead are often combined into a single amount called conversion cost . The labor component of total manufac-turing costs for many firms that have highly automated operations is relatively low, and these firms often choose to place their strategic focus on materials and facilities/overhead costs by combining labor costs with overhead.
Cost Drivers and Cost Behavior Cost drivers provide two important roles for the management accountant: (1) enabling the assignment of costs to cost objects, as we saw in the above discussion and in Exhibits 3.1 and 3.2 , and (2) explaining cost behavior, how total costs change as the cost driver changes. Generally, the increase in a cost driver will cause an increase in total cost. Occasionally, the relationship is inverse; for example, assume the cost driver is temperature, then in the colder times of the year, increases in this cost driver will decrease total heating cost. Cost drivers can be used to provide both the cost assignment and cost behavior roles at the same time. In the remainder of this section, we focus on the cost behavior role of cost drivers.
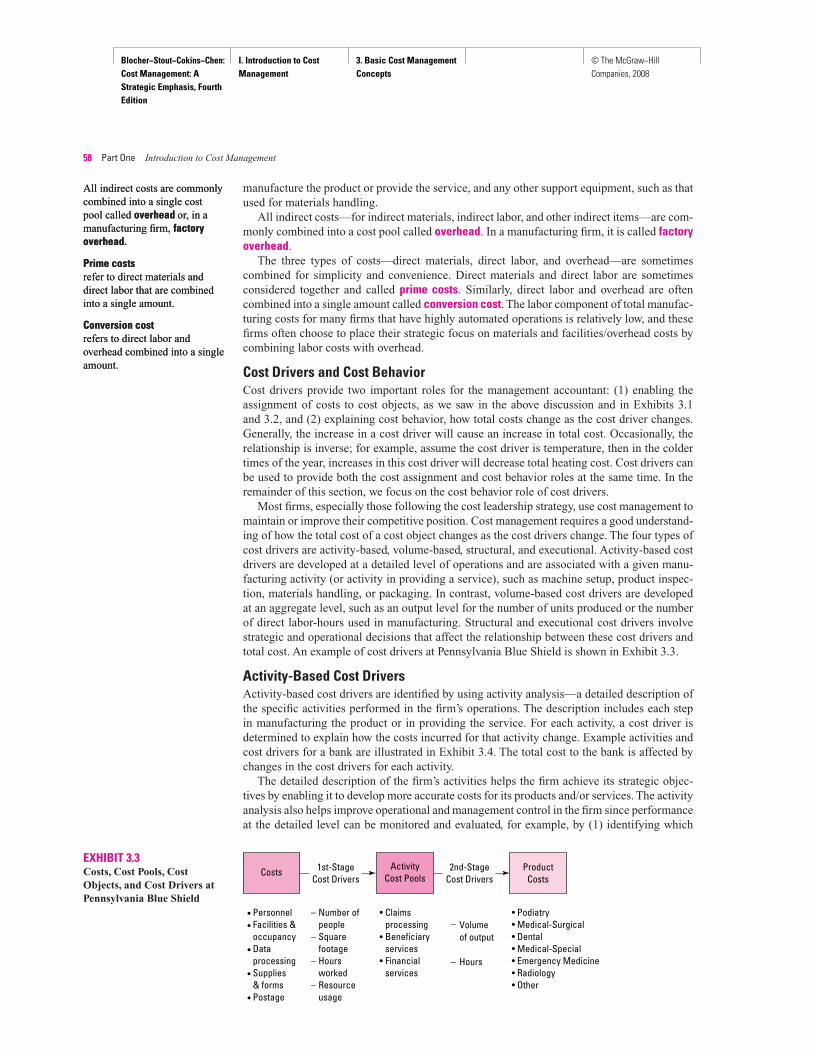
Most firms, especially those following the cost leadership strategy, use cost management to maintain or improve their competitive position. Cost management requires a good understand-ing of how the total cost of a cost object changes as the cost drivers change. The four types of cost drivers are activity-based, volume-based, structural, and executional. Activity-based cost drivers are developed at a detailed level of operations and are associated with a given manu-facturing activity (or activity in providing a service), such as machine setup, product inspec-tion, materials handling, or packaging. In contrast, volume-based cost drivers are developed at an aggregate level, such as an output level for the number of units produced or the number of direct labor-hours used in manufacturing. Structural and executional cost drivers involve strategic and operational decisions that affect the relationship between these cost drivers and total cost. An example of cost drivers at Pennsylvania Blue Shield is shown in Exhibit 3.3 .
Activity-Based Cost Drivers Activity-based cost drivers are identified by using activity analysis—a detailed description of the specific activities performed in the firm’s operations. The description includes each step in manufacturing the product or in providing the service. For each activity, a cost driver is determined to explain how the costs incurred for that activity change. Example activities and cost drivers for a bank are illustrated in Exhibit 3.4 . The total cost to the bank is affected by changes in the cost drivers for each activity.
The detailed description of the firm’s activities helps the firm achieve its strategic objec-tives by enabling it to develop more accurate costs for its products and/or services. The activity analysis also helps improve operational and management control in the firm since performance at the detailed level can be monitored and evaluated, for example, by (1) identifying which
All indirect costs are commonly combined into a single cost pool called overhead or, in a manufacturing fi rm, factoryoverhead .
All indirect costs are commonly combined into a single cost pool called overhead or, in a manufacturing fi rm, factoryoverhead .
Prime costs refer to direct materials and direct labor that are combined into a single amount.
Conversion cost refers to direct labor and overhead combined into a single amount.
Prime costs refer to direct materials and direct labor that are combined into a single amount.
Conversion cost refers to direct labor and overhead combined into a single amount.
CostsActivity
Cost PoolsProduct
Costs2nd-Stage
Cost Drivers1st-Stage
Cost Drivers
• Podiatry• Medical-Surgical• Dental• Medical-Special• Emergency Medicine• Radiology• Other
PersonnelFacilities & occupancyDataprocessingSupplies& formsPostage
••
•
•
•
Number ofpeopleSquarefootageHoursworkedResourceusage
–
–
–
–
Volumeof output
Hours
–
–
ClaimsprocessingBeneficiaryservicesFinancialservices
•
•
•
EXHIBIT 3.3Costs, Cost Pools, Cost Objects, and Cost Drivers at Pennsylvania Blue Shield

Blocher−Stout−Cokins−Chen: Cost Management: A Strategic Emphasis, Fourth Edition
I. Introduction to Cost Management
3. Basic Cost Management Concepts
© The McGraw−Hill Companies, 2008
Chapter 3 Basic Cost Management Concepts 59
activities are contributing value to the customer and which are not and (2) focusing attention on those activities that are most costly or that differ from expectations. Activity-based costing and activity-based management are explained in Chapter 5.
Volume-Based Cost Drivers Many types of costs are volume-based, that is, the cost driver is the amount produced or quan-tity of service provided. Management accountants commonly call this volume, or volume of output, or simply output. Good examples of volume-based costs are direct materials cost and direct labor cost—these costs increase with each unit of the volume of output. Note that the three cost drivers—the output of complete units, the quantity (in pounds, etc.) of direct ma-terials, and the hours of direct labor—are all volume-based cost drivers and are proportional to each other.
The total of a volume-based cost increases at the rate of increase in volume, and over short ranges of output, the relationship is approximately linear. Over a very broad range of output, say, from output of zero up to plant capacity and beyond, the relationship between volume of output and cost tends to be nonlinear. As illustrated in Exhibit 3.5 , at low values for the cost driver, costs increase at a decreasing rate, due in part to factors such as more efficient use of resources and higher productivity through learning. The pattern of increasing costs at a decreasing rate is often referred to as increasing marginal productivity, which means that the inputs are used more productively or more efficiently as manufacturing output increases.
At higher levels of the cost driver, costs begin to increase at an increasing rate, due in part to inefficiency associated with operating nearer the limit of capacity; the less efficient resources are now being used, overtime may be required, and so on. This cost behavior in the higherlevels of the cost driver is said to satisfy the law of diminishing marginal productivity .
The nonlinear cost relationships depicted in Exhibit 3.5 present some difficulties in estimating costs and in calculating total costs since linear, algebraic relationships cannot be used. Fortunately, we are often interested in only a relatively small range of activity for the cost driver. For example, we might know in a certain instance that the volume-based cost driver will fall somewhere between 3,500 and 3,600 units of product output. We observe that within this range, the total cost curve is approximately linear. The range of the cost driver in which the actual value of the cost driver is expected to fall and for which the relationship to total cost is assumed to be approximately linear is called the relevant range .
The relevant range is the range of the cost driver in which the actual value of the cost driver is expected to fall and for which the relationship to total cost is assumed to be approximately linear.
The relevant range is the range of the cost driver in which the actual value of the cost driver is expected to fall and for which the relationship to total cost is assumed to be approximately linear.
Activity Cost Drivers
Provide ATM service Number of ATM transactions; number of customersProvide cashier service Number of customersOpen and close customer accounts Number of accounts opened or closedAdvise customers on banking services Number of customersPrepare applications for new loans Number of loan applications preparedProcess loan applications Number of loan applications processedPrepare approved loans and disburse funds Number of loans approvedMail customer statements Number of accounts by customer type and size
EXHIBIT 3.4Bank Activities and Cost Drivers
Tota
l Cos
t
Volume of Output
CapacityLimit
EXHIBIT 3.5Total Cost over a Wide Range of Output
Blocher−Stout−Cokins−Chen: Cost Management: A Strategic Emphasis, Fourth Edition
I. Introduction to Cost Management
3. Basic Cost Management Concepts
© The McGraw−Hill Companies, 2008
60 Part One Introduction to Cost Management
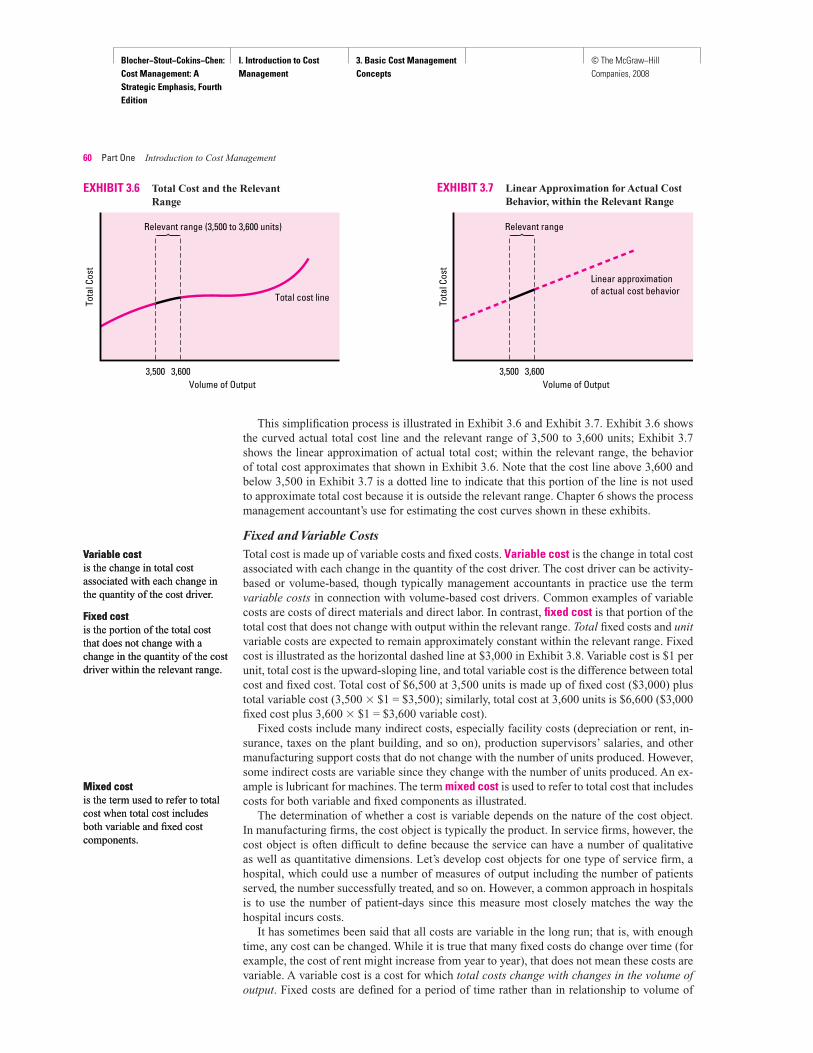
This simplification process is illustrated in Exhibit 3.6 and Exhibit 3.7 . Exhibit 3.6 shows the curved actual total cost line and the relevant range of 3,500 to 3,600 units; Exhibit 3.7 shows the linear approximation of actual total cost; within the relevant range, the behavior of total cost approximates that shown in Exhibit 3.6 . Note that the cost line above 3,600 and below 3,500 in Exhibit 3.7 is a dotted line to indicate that this portion of the line is not used to approximate total cost because it is outside the relevant range. Chapter 6 shows the process management accountant’s use for estimating the cost curves shown in these exhibits.
Fixed and Variable Costs
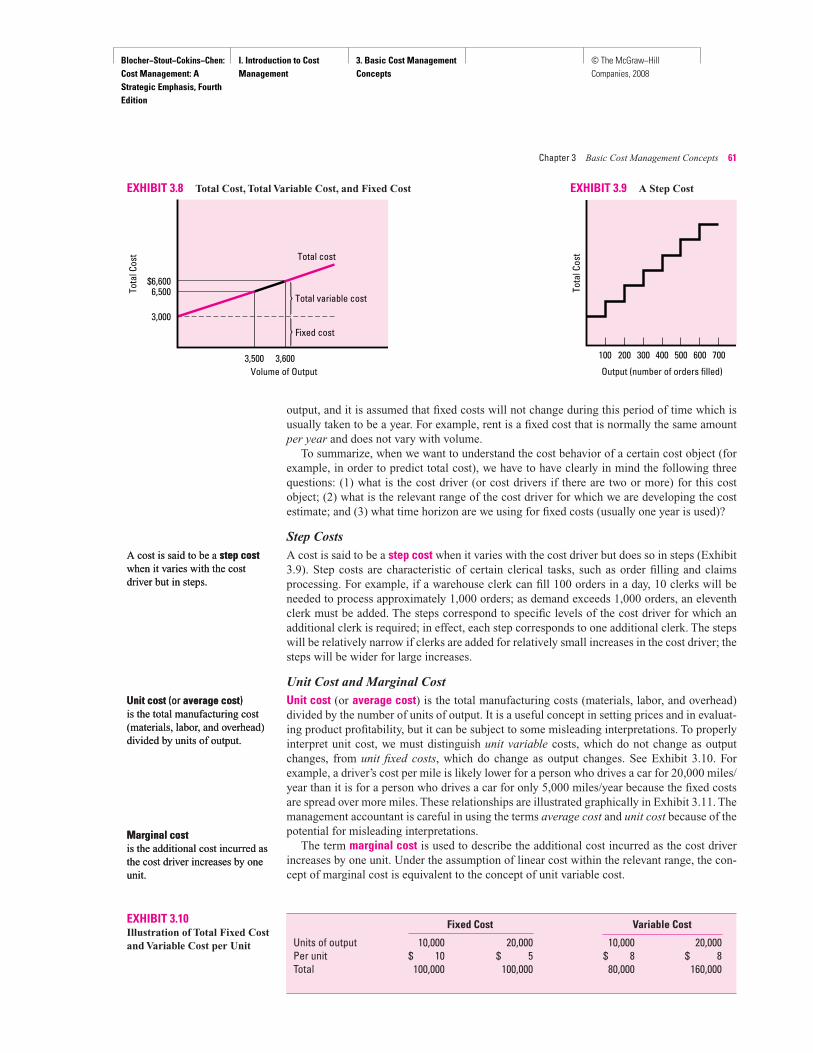
Total cost is made up of variable costs and fixed costs. Variable cost is the change in total cost associated with each change in the quantity of the cost driver. The cost driver can be activity-based or volume-based, though typically management accountants in practice use the term variable costs in connection with volume-based cost drivers. Common examples of variable costs are costs of direct materials and direct labor. In contrast, fixed cost is that portion of the total cost that does not change with output within the relevant range. Total fixed costs and unitvariable costs are expected to remain approximately constant within the relevant range. Fixed cost is illustrated as the horizontal dashed line at $3,000 in Exhibit 3.8 . Variable cost is $1 per unit, total cost is the upward-sloping line, and total variable cost is the difference between total cost and fixed cost. Total cost of $6,500 at 3,500 units is made up of fixed cost ($3,000) plus total variable cost (3,500 � $1 = $3,500); similarly, total cost at 3,600 units is $6,600 ($3,000 fixed cost plus 3,600 � $1 = $3,600 variable cost).
Fixed costs include many indirect costs, especially facility costs (depreciation or rent, in-surance, taxes on the plant building, and so on), production supervisors’ salaries, and other manufacturing support costs that do not change with the number of units produced. However, some indirect costs are variable since they change with the number of units produced. An ex-ample is lubricant for machines. The term mixed cost is used to refer to total cost that includes costs for both variable and fixed components as illustrated.
The determination of whether a cost is variable depends on the nature of the cost object. In manufacturing firms, the cost object is typically the product. In service firms, however, the cost object is often difficult to define because the service can have a number of qualitative as well as quantitative dimensions. Let’s develop cost objects for one type of service fi rm, a hospital, which could use a number of measures of output including the number of patients served, the number successfully treated, and so on. However, a common approach in hospitals is to use the number of patient-days since this measure most closely matches the way the hospital incurs costs.
It has sometimes been said that all costs are variable in the long run; that is, with enough time, any cost can be changed. While it is true that many fixed costs do change over time (for example, the cost of rent might increase from year to year), that does not mean these costs are variable. A variable cost is a cost for which total costs change with changes in the volume of output. Fixed costs are defined for a period of time rather than in relationship to volume of
Variable cost is the change in total cost associated with each change in the quantity of the cost driver.
Variable cost is the change in total cost associated with each change in the quantity of the cost driver.
Fixed cost is the portion of the total cost that does not change with a change in the quantity of the cost driver within the relevant range.
Fixed cost is the portion of the total cost that does not change with a change in the quantity of the cost driver within the relevant range.
Mixed cost is the term used to refer to total cost when total cost includes both variable and fixed cost components.
Mixed cost is the term used to refer to total cost when total cost includes both variable and fixed cost components.
Tota
l Cos
t
3,500 3,600Volume of Output
Relevant range (3,500 to 3,600 units)
Total cost line
EXHIBIT 3.6 Total Cost and the Relevant Range
Tota
l Cos
t
3,500 3,600Volume of Output
Relevant range
Linear approximationof actual cost behavior
EXHIBIT 3.7 Linear Approximation for Actual Cost Behavior, within the Relevant Range
Blocher−Stout−Cokins−Chen: Cost Management: A Strategic Emphasis, Fourth Edition
I. Introduction to Cost Management
3. Basic Cost Management Concepts
© The McGraw−Hill Companies, 2008
Chapter 3 Basic Cost Management Concepts 61
output, and it is assumed that fixed costs will not change during this period of time which is usually taken to be a year. For example, rent is a fixed cost that is normally the same amount per year and does not vary with volume.
To summarize, when we want to understand the cost behavior of a certain cost object (for example, in order to predict total cost), we have to have clearly in mind the following three questions: (1) what is the cost driver (or cost drivers if there are two or more) for this cost object; (2) what is the relevant range of the cost driver for which we are developing the cost estimate; and (3) what time horizon are we using for fixed costs (usually one year is used)?
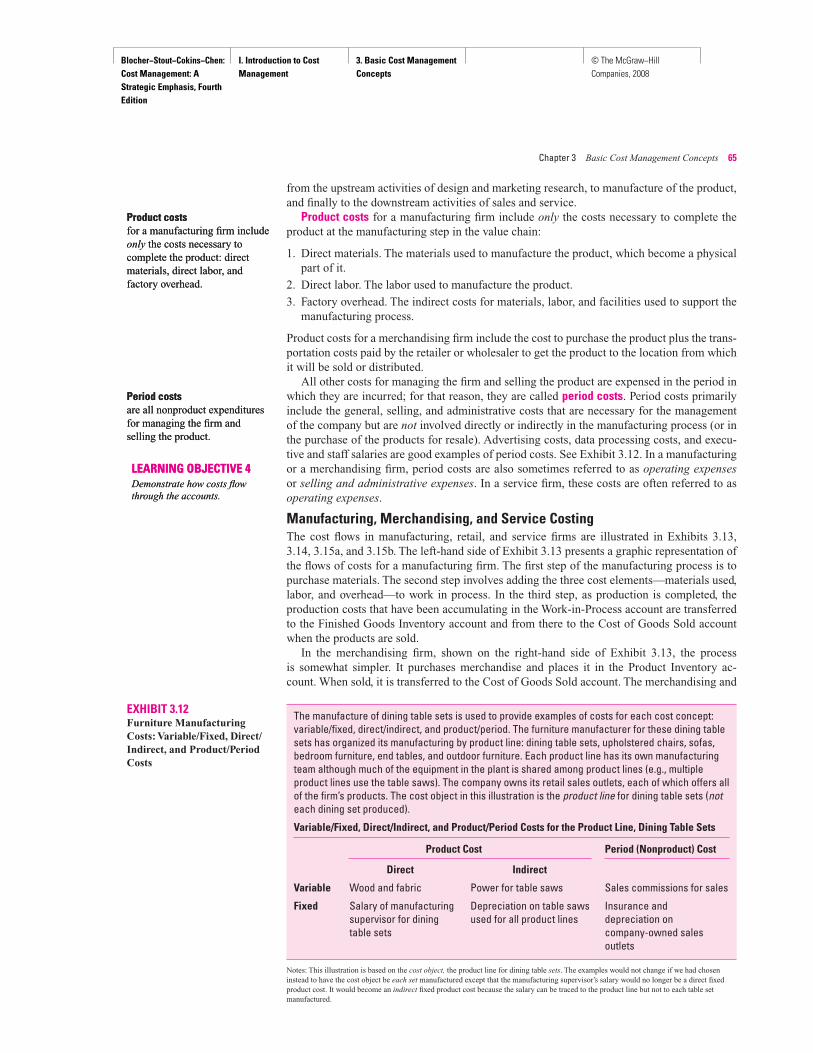
Step Costs
A cost is said to be a step cost when it varies with the cost driver but does so in steps ( Exhibit 3.9 ). Step costs are characteristic of certain clerical tasks, such as order filling and claims processing. For example, if a warehouse clerk can fill 100 orders in a day, 10 clerks will be needed to process approximately 1,000 orders; as demand exceeds 1,000 orders, an eleventh clerk must be added. The steps correspond to specific levels of the cost driver for which an additional clerk is required; in effect, each step corresponds to one additional clerk. The steps will be relatively narrow if clerks are added for relatively small increases in the cost driver; the steps will be wider for large increases.
Unit Cost and Marginal Cost
Unit cost (or average cost) is the total manufacturing costs (materials, labor, and overhead) divided by the number of units of output. It is a useful concept in setting prices and in evaluat-ing product profitability, but it can be subject to some misleading interpretations. To properly interpret unit cost, we must distinguish unit variable costs, which do not change as output changes, from unit fixed costs, which do change as output changes. See Exhibit 3.10 . For example, a driver’s cost per mile is likely lower for a person who drives a car for 20,000 miles/year than it is for a person who drives a car for only 5,000 miles/year because the fixed costs are spread over more miles. These relationships are illustrated graphically in Exhibit 3.11 . The management accountant is careful in using the terms average cost and unit cost because of the potential for misleading interpretations.
The term marginal cost is used to describe the additional cost incurred as the cost driver increases by one unit. Under the assumption of linear cost within the relevant range, the con-cept of marginal cost is equivalent to the concept of unit variable cost.
A cost is said to be a step cost when it varies with the cost driver but in steps.
A cost is said to be a step cost when it varies with the cost driver but in steps.
Unit cost (or average cost)is the total manufacturing cost (materials, labor, and overhead) divided by units of output.
Unit cost (or average cost)is the total manufacturing cost (materials, labor, and overhead) divided by units of output.
Marginal cost is the additional cost incurred as the cost driver increases by one unit.
Marginal cost is the additional cost incurred as the cost driver increases by one unit.
Total cost
Total variable cost
Fixed cost
$6,6006,500
3,000
Tota
l Cos
t
3,500 3,600Volume of Output
EXHIBIT 3.8 Total Cost, Total Variable Cost, and Fixed Cost
Tota
l Cos
t
Output (number of orders filled)
100 200 300 400 500 600 700
EXHIBIT 3.9 A Step Cost
EXHIBIT 3.10 Illustration of Total Fixed Cost and Variable Cost per Unit
Fixed Cost Variable Cost
Units of output 10,000 20,000 10,000 20,000Per unit $ 10 $ 5 $ 8 $ 8Total 100,000 100,000 80,000 160,000

Blocher−Stout−Cokins−Chen: Cost Management: A Strategic Emphasis, Fourth Edition
I. Introduction to Cost Management
3. Basic Cost Management Concepts
© The McGraw−Hill Companies, 2008
Capacity vs. Usage of Costs
It is important to distinguish between costs that provide capacity for operations (e.g., plant building and equipment) and costs that are consumed during operations (e.g., direct materials and labor). The former are fixed costs, while the latter are variable costs. In practice, the man-agement accountant uses care in making the distinctions because sometimes capacity-type costs are treated as variable costs. For example, compare the cost of two types of direct labor employees who work in the assembly of a product: one is a salaried worker who is paid by the month and another a worker paid by the hour. The former is a capacity (fixed) cost, while the latter is a variable cost. While both workers might be considered direct labor because they work in product assembly, if volume of output falls and the salaried worker is idle, the total cost of labor does not change, while the total cost of labor would fall for a wage worker who has fewer hours. On the other hand, effective managers try to schedule production and labor carefully by using part-time help and by other means, so that no workers are idle; then, all assembly work can be considered a direct and variable cost. When idle time is present, some management accountants measure the cost of the unused capacity. Note that the cost of unused capacity would potentially apply to many types of fixed costs.
EXHIBIT 3.11Average Variable Cost per Unit and Average Fixed Cost per Unit
Volume of Output
10,000
5
10
20,000
Aver
age
Cost
Average Variable Cost per Unit
AverageFixed Cost per Unit
REAL-WORLD FOCUS Is It Fixed or Variable: Lincoln Electric and TV Celebrities
CROSS-TRAINING AT LINCOLN ELECTRIC COMPANYTo retain skilled employees instead of letting them go when demand falls, Lincoln Electric trains employees for other tasks in the company. The Cleveland-based manufacturer of welding and cutting parts has integrated the approach in all its operations, so that it can guarantee employment for all employees who have been with the company for three or more years. This policy has worked for 60 years! The effect of the policy on cost is that labor expense, while fixed in total ex-penditure, is in reality a variable expense. Labor is flexible and can be moved from job to job or plant to plant as demand dictates; that is, labor cost at the plant level fluctuates with demand at each plant, while total labor cost at the fi rm stays fi xed.
Other companies such as Nestle and Apex Precision Technology accomplish the same goal of keeping their employees as demand fluctuates by using part-time arrangements with the employees. Thus, instead of incurring a fixed cost for labor, the company’s total labor costs are flexible and vary with demand, as part-time labor is added when needed.
TV CELEBRITY PAY BASED ON COST-PER-VIEWER?TV celebrities such as David Letterman, Conan O’Brien, and Paula Zahn negotiate for multimillion dollar salaries based on their viewer drawing ability. These salaries are of course fixed in amount. While Letterman is the clear leader with $16 million per year, to O’Brien’s $8 million, and Zahn’s $2 million, they all have approximately the same amount of pay per viewer. The cost per viewer is $3.68, $3.14, and $3.70 for Letterman, O’Brien, and Zahn, respectively. Are these sala-ries fixed or variable? It would appear that the number of viewers is a key driver in the salary negotiations each year for these celebri-ties. From this perspective, these salaries might be viewed as vari-able costs. If the networks’ advertising revenues are also based on number of viewers, then treating celebrities this way makes sense. It also might be used to explain why certain celebrities have higher or lower per-viewer rates, due presumably to different revenue rates for the shows; advertisers might be willing to pay more for a certain type of viewer.
Source: Clare Ansberry, “In the Workplace, Jobs Morph to Suit Rapid Pace of Change,” The Wall Street Journal, March 22, 2002, p. 1; Lisa De Moraes, “Conan the Cost: NBC’s Thrifty Numbers Game,” The Washington Post,February 8, 2002, p. C7.

Blocher−Stout−Cokins−Chen: Cost Management: A Strategic Emphasis, Fourth Edition
I. Introduction to Cost Management
3. Basic Cost Management Concepts
© The McGraw−Hill Companies, 2008
Chapter 3 Basic Cost Management Concepts 63
Structural and Executional Cost Drivers Structural and executional cost drivers are used to facilitate strategic and operational decision making. Structural cost drivers are strategic in nature because they involve plans and deci-sions that have long-term effects. Issues such as the following should be considered:
1. Scale. How much should be invested? How large should the firm become? Larger fi rmshave lower overall costs as a result of economies of scale. For example, a retail firm such as Wal-Mart or Target must determine how many new stores to open in a given year to achieve its strategic objectives and compete effectively as a retailer.
2. Experience. How much prior experience does the firm have in its current and planned products and services? The more experience, the lower the development, manufacturing, and distribution costs are likely to be. For example, a manufacturer such as Hewlett-Packard uses existing manufacturing methods as much as possible for new products to reduce the time and cost necessary for workers to become proficient at manufacturing the new product. Addition-ally, health-care management firms such as Hospital Corporation of America (HCA) use their knowledge of experience-related cost drivers to reduce the time and cost necessary to improve the profitability of newly acquired hospitals.
3. Technology. What process technologies are used in designing, manufacturing, and dis-tributing the product or service? New technologies can reduce these costs significantly. For example, manufacturers such as Procter & Gamble use computer technology to monitor the quantities of its products that its customers (typically, large retailers) have on hand so that it can promptly restock these products as needed. Technological innovation at Intel has lowered the cost of computing dramatically by improving the capability of microprocessors used in personal computers. While the capability of the microprocessors has increased exponentially, their manufacturing costs per unit have not changed significantly. This example of Moore’s law describes the costs of digital technology falling (by one-half) every 18 to 24 months.
4. Complexity. What is the firm’s level of complexity? How many different products does the firm have? As noted in the opening discussion of Procter & Gamble, firms with many products have higher costs of scheduling and managing the production process, as well as the upstream costs of product development and the downstream costs of distribution and service. These firms often use activity-based costing to better identify the costs and therefore the prof-itability of their different products, suppliers, and customers.
Strategic analyses using structural cost drivers help the firm improve its competitive po-sition. These analyses include value-chain analysis and activity-based management. Value-chain analysis can help the firm assess the long-term consequences of its current or planned commitment to a structural cost driver. For example, the growth in size and capability of parts manufacturers for automakers should cause the automakers to reassess whether they should outsource the manufacture of certain parts.
Executional cost drivers are factors the firm can manage in short-term, operational deci-sion making to reduce costs. They include the following:
1. Workforce involvement. Are the employees dedicated to continual improvement and quality? This workforce commitment will lower costs. Firms with strong employee relation-ships, such as Federal Express, can reduce operating costs significantly.
2. Design of the production process. Can the layout of equipment and processes and the scheduling of production be improved? Speeding up the flow of product through the firm can reduce costs. Innovators in manufacturing technology, such as Motorola and Allen-Bradley, can reduce manufacturing costs significantly.
3. Supplier relationships. Can the cost, quality, or delivery of materials and purchased parts be improved to reduce overall costs? Wal-Mart and Toyota, among other firms, maintain a low-cost advantage partially by agreements with their suppliers that they will provide prod-ucts or parts that meet the companies’ explicit requirements as to their quality, timeliness of delivery, and other features.
Plant managers study executional cost drivers to find ways to reduce costs. Such studies are done as a part of operational control, which is covered in Part Four.
Structural cost drivers are strategic in nature and involve plans and decisions that have a long-term effect with regard to issues such as scale, experience, technology, and complexity.
Structural cost drivers are strategic in nature and involve plans and decisions that have a long-term effect with regard to issues such as scale, experience, technology, and complexity.
Executional cost drivers are factors the firm can manage in the short term to reduce costs, such as workforce involvement, design of the production process, and supplier relationships.
Executional cost drivers are factors the firm can manage in the short term to reduce costs, such as workforce involvement, design of the production process, and supplier relationships.

Blocher−Stout−Cokins−Chen: Cost Management: A Strategic Emphasis, Fourth Edition
I. Introduction to Cost Management
3. Basic Cost Management Concepts
© The McGraw−Hill Companies, 2008
Accurate information about the cost of products and services is important in each manage-ment function: strategic management, planning and decision making, management and opera-tional control, and financial statement preparation. The cost accounting systems that provide this information are explained in this section.
Cost Accounting for Products and Services Cost accounting systems for the firms that manufacture products and for the merchandising firms that resell those products differ significantly. Merchandising firms include both retailers, which sell the final product to the consumer, and wholesalers, which distribute the product to retailers. Service firms often have little or no inventory, so their costing systems are relatively simple.
Product Costs and Period Costs Product inventory for both manufacturing and merchandising firms is treated as an asset on their balance sheets. As long as the inventory has market value, it is considered an asset until the inventory is sold; then the cost of the inventory is transferred to the income statement as cost of goods sold . This sequence is the value chain of product costs for a manufacturing fi rm,
LEARNING OBJECTIVE 3 Explain the cost concepts used in product and service costing.
LEARNING OBJECTIVE 3 Explain the cost concepts used in product and service costing.
Cost of goods sold is the cost of the product transferred to the income statement when inventory is sold.
Cost of goods sold is the cost of the product transferred to the income statement when inventory is sold.
Cost Concepts for Product and Service Costing
Cost Management in Action Cost Per Bushel of Soybeans: U.S. and Brazil
The following data is provided by the U.S. Department of Agriculture (USDA) regarding the cost of soybean production in the U.S. Heartland (Minnesota, Iowa, South Dakota, Indiana, and Illinois and parts of Ohio,
Missouri, Nebraska, and Kentucky) and the Mato Grosso region in west-ern Brazil. The data is used to analyze the cost competitiveness of soy-bean production in the United States and Brazil.
Required:What can you learn from the information above about the cost com-petitiveness of the U.S. and Brazil in soybean production?Critically evaluate the cost information.
1.
2.
Source: Data from U.S. Department of Agriculture (USDA), Economic Research Service
Cost per Acre and per Bushel of Soybeans
U.S. Heartland Brazil’s Mato Grosso
Variable costs (per acre)Seed $ 19.77 $ 11.23Fertilizers 8.22 44.95Chemicals 27.31 39.97Machinery 20.19 18.22Labor 1.29 5.58Other 1.81 12.11
Total variable costs $ 78.59 $132.06
Fixed costs (per acre)Equipment depreciation $ 47.99 $ 8.97Land costs (rental rate) 87.96 5.84Taxes, insurance 6.97 .55Farm overhead 13.40 14.65
Total fi xed costs $156.32 $ 30.01
Total production cost (per acre) $234.91 $162.07
Total cost per bushelAverage yield per acre 46 41.65Variable costs $ 1.71 $ 3.17Fixed costs 3.40 .72
Total costs per bushel $ 5.11 $ 3.89
Blocher−Stout−Cokins−Chen: Cost Management: A Strategic Emphasis, Fourth Edition
I. Introduction to Cost Management
3. Basic Cost Management Concepts
© The McGraw−Hill Companies, 2008
Chapter 3 Basic Cost Management Concepts 65
from the upstream activities of design and marketing research, to manufacture of the product, and finally to the downstream activities of sales and service.
Product costs for a manufacturing firm include only the costs necessary to complete the product at the manufacturing step in the value chain:
Direct materials. The materials used to manufacture the product, which become a physical part of it.
Direct labor. The labor used to manufacture the product.
Factory overhead. The indirect costs for materials, labor, and facilities used to support the manufacturing process.
Product costs for a merchandising firm include the cost to purchase the product plus the trans-portation costs paid by the retailer or wholesaler to get the product to the location from which it will be sold or distributed.
All other costs for managing the firm and selling the product are expensed in the period in which they are incurred; for that reason, they are called period costs. Period costs primarily include the general, selling, and administrative costs that are necessary for the management of the company but are not involved directly or indirectly in the manufacturing process (or in the purchase of the products for resale). Advertising costs, data processing costs, and execu-tive and staff salaries are good examples of period costs. See Exhibit 3.12 . In a manufacturing or a merchandising firm, period costs are also sometimes referred to as operating expenses or selling and administrative expenses. In a service firm, these costs are often referred to as operating expenses .
Manufacturing, Merchandising, and Service Costing The cost flows in manufacturing, retail, and service firms are illustrated in Exhibits 3.13 , 3.14 , 3.15a , and 3.15b . The left-hand side of Exhibit 3.13 presents a graphic representation of the flows of costs for a manufacturing firm. The first step of the manufacturing process is to purchase materials. The second step involves adding the three cost elements—materials used, labor, and overhead—to work in process. In the third step, as production is completed, the production costs that have been accumulating in the Work-in-Process account are transferred to the Finished Goods Inventory account and from there to the Cost of Goods Sold account when the products are sold.
In the merchandising firm, shown on the right-hand side of Exhibit 3.13 , the process is somewhat simpler. It purchases merchandise and places it in the Product Inventory ac-count. When sold, it is transferred to the Cost of Goods Sold account. The merchandising and
1.
2.
3.
Product costs for a manufacturing firm include only the costs necessary to complete the product: direct materials, direct labor, and factory overhead.
Product costs for a manufacturing firm include only the costs necessary to complete the product: direct materials, direct labor, and factory overhead.
Period costs are all nonproduct expenditures for managing the firm and selling the product.
Period costs are all nonproduct expenditures for managing the firm and selling the product.
LEARNING OBJECTIVE 4 Demonstrate how costs fl ow through the accounts.
LEARNING OBJECTIVE 4 Demonstrate how costs fl ow through the accounts.
EXHIBIT 3.12 Furniture Manufacturing Costs: Variable/Fixed, Direct/Indirect, and Product/Period Costs
Notes: This illustration is based on the cost object, the product line for dining table sets. The examples would not change if we had chosen instead to have the cost object be each set manufactured except that the manufacturing supervisor’s salary would no longer be a direct fi xedproduct cost. It would become an indirect fixed product cost because the salary can be traced to the product line but not to each table set manufactured.
The manufacture of dining table sets is used to provide examples of costs for each cost concept: variable/fi xed, direct/indirect, and product/period. The furniture manufacturer for these dining table sets has organized its manufacturing by product line: dining table sets, upholstered chairs, sofas, bedroom furniture, end tables, and outdoor furniture. Each product line has its own manufacturing team although much of the equipment in the plant is shared among product lines (e.g., multiple product lines use the table saws). The company owns its retail sales outlets, each of which offers all of the fi rm’s products. The cost object in this illustration is the product line for dining table sets (noteach dining set produced).
Variable/Fixed, Direct/Indirect, and Product/Period Costs for the Product Line, Dining Table Sets
Product Cost Period (Nonproduct) Cost
Direct Indirect
Variable Wood and fabric Power for table saws Sales commissions for sales
Fixed Salary of manufacturing Depreciation on table saws Insurance and supervisor for dining used for all product lines depreciation on table sets company-owned sales
outlets

Blocher−Stout−Cokins−Chen: Cost Management: A Strategic Emphasis, Fourth Edition
I. Introduction to Cost Management
3. Basic Cost Management Concepts
© The McGraw−Hill Companies, 2008
66 Part One Introduction to Cost Management
manufacturing firms in Exhibit 3.13 are shown side by side to emphasize the difference: The merchandising firm purchases inventory but the manufacturing firm manufactures inventory using materials, labor, and overhead.
Manufacturing firms use three inventory accounts: (1) Materials Inventory , where the cost of the supply of materials used in the manufacturing process is kept; (2) Work-in-ProcessInventory, which contains all costs put into the manufacture of products that are started but not complete at the financial statement date; and (3) Finished Goods Inventory , which holds the costof goods that are ready for sale. Each account has its own beginning and ending balances.
An inventory formula relates the inventory accounts, as follows:
Beginning inventory + Cost added = Cost transferred out + Ending Inventory
The terms cost added and cost transferred out have different meanings, depending on which inventory account is being considered:
Inventory Account Cost Added Cost Transferred Out
Materials Inventory Purchases of materials Cost of materials used in production Work-in-Process Inventory 1. Cost of materials used Cost of goods manufactured, for
2. Labor cost products completed this period 3. Overhead cost
Finished Goods Inventory Costs of goods manufactured Cost of goods sold
The inventory formula is a useful concept to show how materials, labor, and overhead costs flow into Work-in-Process Inventory, then into Finished Goods Inventory, and finally into Cost of Goods Sold. Exhibit 3.14 illustrates the effects of the cost flows on the accounts involved when the manufacturing firm converts materials into finished products and then sells them and when the merchandising firm sells merchandise inventory.
Materials Inventory is the cost of the supply of materials used in the manufacturing process or to provide the service.
Materials Inventory is the cost of the supply of materials used in the manufacturing process or to provide the service.
Finished Goods Inventory is the cost of goods that are ready for sale.
Finished Goods Inventory is the cost of goods that are ready for sale.
Work-in-Process Inventory contains all costs put into the manufacture of products that are started but not complete at the financial statement date.
Work-in-Process Inventory contains all costs put into the manufacture of products that are started but not complete at the financial statement date.
EXHIBIT 3.13Cost Flows in Manufacturing and Merchandising Firms
Manufacturing Company
Materials Purchases
Materials Used
Work-in-ProcessInventory
Cost of GoodsManufactured
Finished GoodsInventory
Cost of Goods Sold
Merchandising Company
Merchandise Purchases
Product Inventory
Cost of Goods Sold
Labor Overhead
Materials Inventory
Key: Beginning Inventory Ending Inventory
FirstStep
SecondStep
ThirdStep
Blocher−Stout−Cokins−Chen: Cost Management: A Strategic Emphasis, Fourth Edition
I. Introduction to Cost Management
3. Basic Cost Management Concepts
© The McGraw−Hill Companies, 2008
Chapter 3 Basic Cost Management Concepts 67
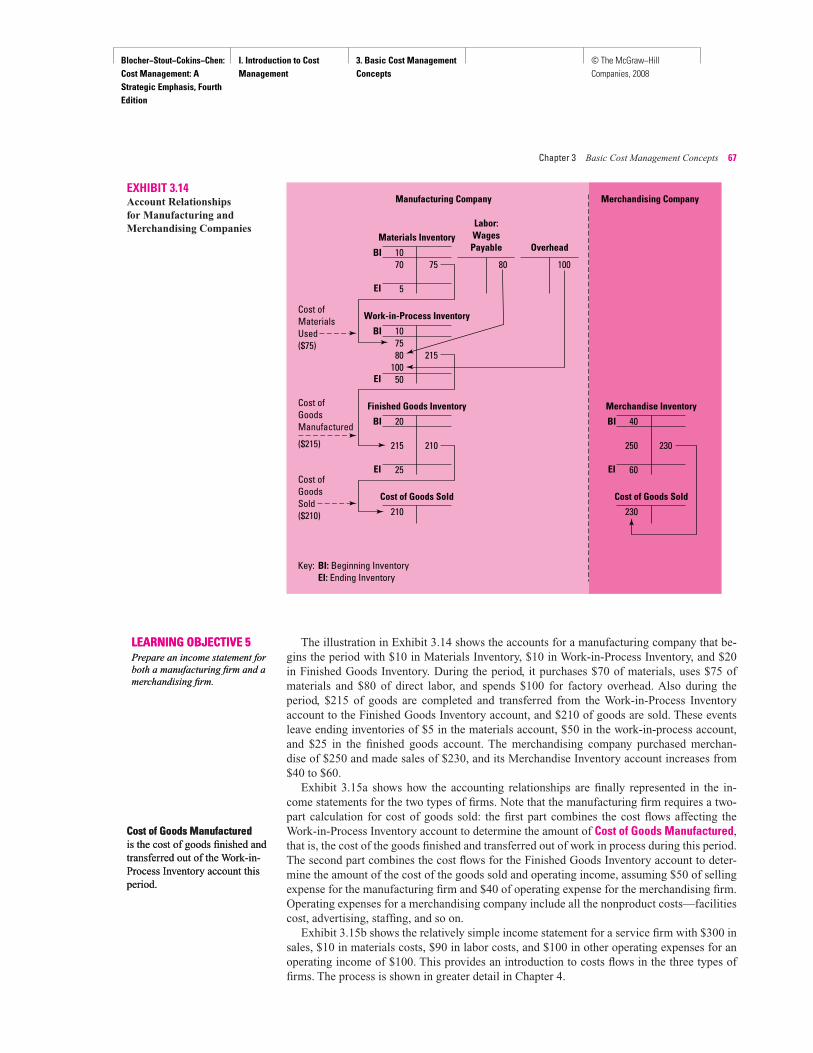
The illustration in Exhibit 3.14 shows the accounts for a manufacturing company that be-gins the period with $10 in Materials Inventory, $10 in Work-in-Process Inventory, and $20 in Finished Goods Inventory. During the period, it purchases $70 of materials, uses $75 of materials and $80 of direct labor, and spends $100 for factory overhead. Also during the period, $215 of goods are completed and transferred from the Work-in-Process Inventory account to the Finished Goods Inventory account, and $210 of goods are sold. These events leave ending inventories of $5 in the materials account, $50 in the work-in-process account, and $25 in the finished goods account. The merchandising company purchased merchan-dise of $250 and made sales of $230, and its Merchandise Inventory account increases from $40 to $60.
Exhibit 3.15a shows how the accounting relationships are finally represented in the in-come statements for the two types of firms. Note that the manufacturing firm requires a two-part calculation for cost of goods sold: the first part combines the cost flows affecting the Work-in-Process Inventory account to determine the amount of Cost of Goods Manufactured ,that is, the cost of the goods finished and transferred out of work in process during this period. The second part combines the cost flows for the Finished Goods Inventory account to deter-mine the amount of the cost of the goods sold and operating income, assuming $50 of selling expense for the manufacturing firm and $40 of operating expense for the merchandising fi rm.Operating expenses for a merchandising company include all the nonproduct costs—facilities cost, advertising, staffing, and so on.
Exhibit 3.15b shows the relatively simple income statement for a service firm with $300 in sales, $10 in materials costs, $90 in labor costs, and $100 in other operating expenses for an operating income of $100. This provides an introduction to costs flows in the three types of firms. The process is shown in greater detail in Chapter 4.
LEARNING OBJECTIVE 5 Prepare an income statement for both a manufacturing fi rm and a merchandising fi rm.
LEARNING OBJECTIVE 5 Prepare an income statement for both a manufacturing fi rm and a merchandising fi rm.
Cost of Goods Manufactured is the cost of goods finished and transferred out of the Work-in-Process Inventory account this period.
Cost of Goods Manufactured is the cost of goods finished and transferred out of the Work-in-Process Inventory account this period.
EXHIBIT 3.14Account Relationships for Manufacturing and Merchandising Companies
Manufacturing Company Merchandising Company
Materials InventoryLabor:Wages
Payable OverheadBI 1070
5
75 80 100
EI
Work-in-Process Inventory
BI 107580
10050
215
EI
Finished Goods Inventory
BI 20
215
25
210
EI
Cost of Goods Sold
210
Merchandise Inventory
BI 40
250
60
230
EI
Cost of Goods Sold
230
Cost ofMaterialsUsed($75)
Cost ofGoodsManufactured
($215)
Cost ofGoodsSold($210)
Key: BI: Beginning InventoryEI: Ending Inventory

Blocher−Stout−Cokins−Chen: Cost Management: A Strategic Emphasis, Fourth Edition
I. Introduction to Cost Management
3. Basic Cost Management Concepts
© The McGraw−Hill Companies, 2008
68 Part One Introduction to Cost Management
To facilitate management decision making and planning, the management accountant provides relevant, timely, and accurate information at a reasonable cost. Relevance is the most critical of the decision-making concepts; timeliness, accuracy, and cost are unimportant if the infor-mation is irrelevant.
Relevant Cost The concept of relevant cost arises when the decision maker must choose between two or more options. To determine which option is best, the decision maker must determine which option
LEARNING OBJECTIVE 6 Explain the cost concepts related to the use of cost information in planning and decision making.
LEARNING OBJECTIVE 6 Explain the cost concepts related to the use of cost information in planning and decision making.
Cost Concepts for Planning and Decision Making
EXHIBIT 3.15a Income Statements for Manufacturing and Merchandising Firms
MANUFACTURING, Inc.Statement of Cost of Goods Manufactured
For the Year Ended December 31, 2007
Direct MaterialsBeginning Inventory $ 10Purchases 70Direct Materials Available $ 80Ending Direct Materials Inventory 5
Direct Materials Used $ 75Direct Labor 80Factory Overhead 100
Total Manufacturing Cost $255
Add: Beginning Work-in-Process Inventory 10Total Manufacturing Cost to Account for 265Less: Ending Work-in-Process Inventory 50Cost of Goods Manufactured $215
MANUFACTURING, Inc.Income Statement
For the Year Ended December 31, 2007
Sales $300Cost of Goods Sold
Beginning Finished Goods Inventory $ 20Cost of Goods Manufactured 215Cost of Goods Available for Sale 235Ending Finished Goods Inventory 25 210
Gross Margin 90
Selling and Administrative expenses 50Operating Income $ 40
(No need for a Cost of Goods Manufactured Statement for Merchandising Inc.)
MERCHANDISING, Inc.Income Statement
For the Year Ended December 31, 2007
Sales $300Cost of Goods Sold
Beginning Finished Goods Inventory $ 40Purchases 250Cost of Goods Available for Sale $290Ending Finished Goods Inventory 60 230
Gross Margin $ 70
Operating expenses 40Operating Income $ 30
EXHIBIT 3.15bIncome Statement for a Service Firm
SERVICE, Inc.Income Statement
For the Year Ended December 31, 2007
Revenues $300Operating Expenses
Materials $ 10Labor 90Other Operating Expenses 100 200
Operating Income $100

Blocher−Stout−Cokins−Chen: Cost Management: A Strategic Emphasis, Fourth Edition
I. Introduction to Cost Management
3. Basic Cost Management Concepts
© The McGraw−Hill Companies, 2008
Chapter 3 Basic Cost Management Concepts 69
offers the highest benefit, usually in dollars. Thus, the decision maker needs information on relevant costs. A relevant cost has two properties: (1) it differs for each decision option and(2) it will be incurred in the future. If a cost is the same for each option, including it in the decision only wastes time and increases the possibility for simple errors. Costs that have already been incurred or committed are irrelevant because there is no longer any discretion about them.
Opportunity Cost
Opportunity cost is the benefit lost when choosing one option precludes receiving the benefitsfrom an alternative option. For example, if a sales manager chooses to forgo an order from a new customer to ensure that a current customer’s order is filled on time, the potential profitfrom the lost order is the manager’s opportunity cost for this decision. Ensuring the loyalty of an existing customer has a difficult-to-quantify but significant long-term value, but the short-term loss of the new order, while quantifiable, is not so important.
Sunk Cost
Sunk costs are costs that have been incurred or committed in the past and are therefore irrele-vant for decision making because the decision maker no longer has discretion over them. For example, if a company purchased a new machine without warranty that failed the next day, the purchase price is irrelevant for the present decision to replace or to repair the machine. Only future costs are relevant, and the purchase price of the recently acquired machine has no effect on future costs.
An important additional issue related to sunk costs must be considered. There is apparently an inherent bias for decision makers to include sunk costs as relevant to the analysis. Research has shown that decision makers are more willing to invest money to “recover” sunk costs than to invest the money to earn the same net return. Other studies show that decision makers tend to escalate commitments to sunk costs. The practical implication of these findings is that the management accountants must be particularly careful to develop information for decision makers that separates sunk costs from differential future costs.
Attributes of Cost Information for Decision Making
Accuracy
The experienced decision maker does not use accounting information without considering the potential for inaccuracy. Inaccurate data can mislead, resulting in potentially costly mistakes. A primary way to ensure accurate data for decision making is to design and monitor an effective system of internal accounting controls. The system of internal accounting controls is a set of policies and procedures that restrict and guide activities in the processing of financial data with the objective to prevent or detect errors and fraudulent acts. The emphasis on effective internal controls has increased significantly in recent years in response to new Securities and Exchange Commission (SEC) requirements imposed by the Sarbanes-Oxley Act of 2002 (see Chapter 1 ).
Timeliness
Cost management information must be available to the decision maker in a timely manner to facilitate effective decision making. The cost of delay can be significant in many decisions, such as in filling rush orders that may be lost if the necessary information is not timely. The cost of identifying quality defects early in a manufacturing process can be far less than the cost of materials and labor wasted until the defect is detected later in the process.
Cost and Value of Cost Information
Thinking of cost management information as having a certain cost and value emphasizes that the management accountant is an information specialist, very much like other financial pro-fessionals, such as tax advisers, financial planners, and consultants. The management account-ant provides an information service that has both a preparation cost and a value to the user. The preparation costs for cost management information should be controlled as should any other service provided within the firm. These preparation costs are likely influenced by the desired accuracy, timeliness, and level of aggregation; when increased accuracy, timeliness, and detail are desired, the preparation costs are higher.
A relevant cost has two properties: (1) it differs for each decision option and (2) it will be incurred in the future .
A relevant cost has two properties: (1) it differs for each decision option and (2) it will be incurred in the future .
Opportunity cost is the benefit lost when choosing one option precludes receiving the benefits from an alternative option.
Opportunity cost is the benefit lost when choosing one option precludes receiving the benefits from an alternative option.
Sunk costs are costs that have been incurred or committed in the past and are therefore irrelevant.
Sunk costs are costs that have been incurred or committed in the past and are therefore irrelevant.
The system of internalaccounting controls is a set of policies and procedures that restrict and guide activities in the processing of financial data with the objective to prevent or detect errors and fraudulent acts.
The system of internalaccounting controls is a set of policies and procedures that restrict and guide activities in the processing of financial data with the objective to prevent or detect errors and fraudulent acts.
Blocher−Stout−Cokins−Chen: Cost Management: A Strategic Emphasis, Fourth Edition
I. Introduction to Cost Management
3. Basic Cost Management Concepts
© The McGraw−Hill Companies, 2008
70 Part One Introduction to Cost Management
Cost Concepts for Management and Operational Control
A crucial role for cost management information is to provide a basis for motivating and re-warding managers’ and employees’ efforts and effectiveness. Key cost concepts applicable for this management function include controllability and risk preferences.
ControllabilityA cost is said to be controllable if the manager or employee has discretion in choosing to incur it or can significantly influence its amount within a given, usually short, period of time. For example, the shop supervisor ordinarily cannot control rent expense and insurance on the plant facility nor would the division manager ordinarily have discretion over the amount of corporate-level administrative costs. In contrast, employees typically have control over the labor and materials used in their work area. Costs such as advertising and maintenance ordi-narily are within the scope of the product or division manager’s control.
There are two views of the importance of controllability in the context of employee and manager motivation. One view holds that the manager or employee should be responsible only for the costs that he or she controls. This view is consistent with the argument that to hold managers responsible for changes in costs beyond their control is unfair and unmotivating. The second view is that many “uncontrollable” costs, such as corporate-level administrative costs, are in fact controllable by all managers taken as a whole ; thus, to include these costs on the managers’ costs reports sends a clear message that the firm benefits when managers manage these costs properly.
LEARNING OBJECTIVE 7 Explain the cost concepts related to the use of cost information for management and operational control.
LEARNING OBJECTIVE 7 Explain the cost concepts related to the use of cost information for management and operational control.
A cost is said to be controllable if the manager or employee has discretion in choosing to incur it or can significantly influence its amount within a given, usually short, period of time.
A cost is said to be controllable if the manager or employee has discretion in choosing to incur it or can significantly influence its amount within a given, usually short, period of time.
Summary There are several important concepts for the management accountant, which Chapter 3 presents in four groups: (1) cost objects, cost drivers, and cost pools, (2) product and service costing for the preparation of financial statements, (3) planning and decision making, and (4) operational and management control. Group 1 includes concepts that are important in all management functions, while groups 2, 3, and 4 are three of the four management functions. Concepts for the fourth management function, strategic management, are covered in Chapters 1 and 2 .
The first group of concepts includes the four types of cost drivers: activity-based, volume-based, structural, and executional. Activity-based cost drivers are at the detail level of operations: equipment setup, materials handling, and clerical or other tasks. In contrast, volume-based cost drivers are at the aggregate level: usually the number of units produced. Structural cost drivers involve plans and decisions having long-term effects; executional cost drivers have short-term decision frames. The most important volume-based concepts are varia-ble costs, which change according to a change in the level of output, and fixed costs, whichdo not. Direct costs are defined as costs that can be traced directly to a cost object in contrast to indirect costs, which cannot.
The important concepts in product costing are product costs, which are the costs of direct materials, direct labor, and indirect manufacturing (called overhead) required for the product and production process. Nonproduct costs (also called period costs) are the selling, adminis-trative, and other costs not involved in manufacturing. The inventory formula is used to deter-mine the cost of materials used in production, the cost of goods manufactured, and the cost of goods sold for a given period.
The most important concept in planning and decision making is relevant cost—a cost that differs for each option and will occur in the future. When considering options, the manage-ment accountant considers relevant costs. All past costs (also called sunk costs) are irrelevant because they will not change regardless of the option chosen.
The key concept in management and operational control is controllability. Distinguishing controllable costs from other costs is important because evaluation, even in part, on the basis of costs a manager cannot control can be negatively motivating.

Blocher−Stout−Cokins−Chen: Cost Management: A Strategic Emphasis, Fourth Edition
I. Introduction to Cost Management
3. Basic Cost Management Concepts
© The McGraw−Hill Companies, 2008
Chapter 3 Basic Cost Management Concepts 71
Cost per Bushel of Soybeans: U.S. and Brazil The data is taken from an October 2001 Report of the Economic Research Service of the U.S. Department of Agriculture, based on 1998–1999 data. The report can be viewed at the following Web site: http://www.ers.usda.gov/Briefing/SoybeansOilcrops/pdf/SBProdExpCompOCS2001.pdf
1. What can you learn from this information about the cost competitiveness of the United States and Brazil in soybean production?
Of particular value here is that the report distinguishes variable and fixed costs, which is not com-mon in reports of this type. The distinction gives the reader an opportunity to better understand how cost production costs behave in the two countries. A wide number of observations are possible. In particular, we see the relatively high cost of land and equipment in the United States, partly balanced by relatively high labor and fertilizer and chemical costs in Brazil. Is the high labor cost a result of a substitution of labor for equipment or does it represent poorly trained or supervised workers? Similarly, does the high cost of chemicals and fertilizer in Brazil indicate that U.S. farmers have superior land use practices, or are the fertilizers and chemicals more expensive in Brazil for other reasons?
While the figures clearly show that Brazil has a total cost advantage over the United States in the production of soybeans, other nonproduction, downstream costs are likely to be higher in Brazil—trans-portation (including fuel costs), marketing, and sales—because of its more remote location from world markets. Also, the United States has a cost advantage in variable costs, showing clearly the importance of the cost of land and farm equipment in the United States.
Since the significance of the data is for understanding international competitiveness in global soybean production, it is also important to note that the above analysis does not include data on fluctuations in currency exchange rates, import restrictions, government subsidies, taxes, and other factors that are critical in global trade. Some of the strongest controversies among the World Trade Organization (WTO) countries at this time are the restrictions and subsidies involved in agricultural trade.
2. Critically evaluate the cost information. A number of potential questions arise about the way the data is collected and presented. Here are
some ideas to start with. First, what about the size of the farm: should this affect the fixed cost-per-acre calculations, since fixed costs are driven in part by the number of acres farmed but also by the fact that certain pieces of equipment are necessary for a farm of any size. Farm equipment might be more of a step cost than a fixed cost. If this is the case, the relatively low equipment cost per acre might simply be due to the fact that farm sizes are larger in Brazil. Are the fixed costs computed annually or monthly? And if land can be rented by the acre, is it not a variable cost?
allocation bases , 56average cost , 61controllable cost , 70conversion cost , 58cost , 55cost allocation , 56cost assignment , 55cost driver , 55cost object , 55cost of goods manufactured , 67cost of goods sold , 64cost pools , 55direct cost , 55
direct labor cost , 57direct materials cost , 57executional cost drivers , 63factory overhead , 58 finished goods inventory , 66 fixed cost , 60indirect cost , 56indirect labor cost , 57indirect materials cost , 57internal accounting controls , 69marginal cost , 61materials inventory , 66mixed cost , 60
opportunity cost , 69overhead , 58period costs , 65prime costs , 58product costs , 65relevant cost , 69relevant range , 59step cost , 61structural cost drivers , 63sunk costs , 69unit cost , 61variable cost , 60work-in-process inventory , 66
Key Terms
Comments on Cost Management in
Action
Self-Study Problem (For solution, please turn to the end of the chapter.)
The following data pertain to Spartan Products Company:
Sales revenue $1,000,000Direct materials inventory, Jan. 1, 2007 20,000Direct labor—Wages 350,000Depreciation expense—Plant and equipment 80,000Indirect labor—Wages 5,000Heat, light, and power—Plant 12,000Supervisor’s salary—Plant 40,000
(Continued)
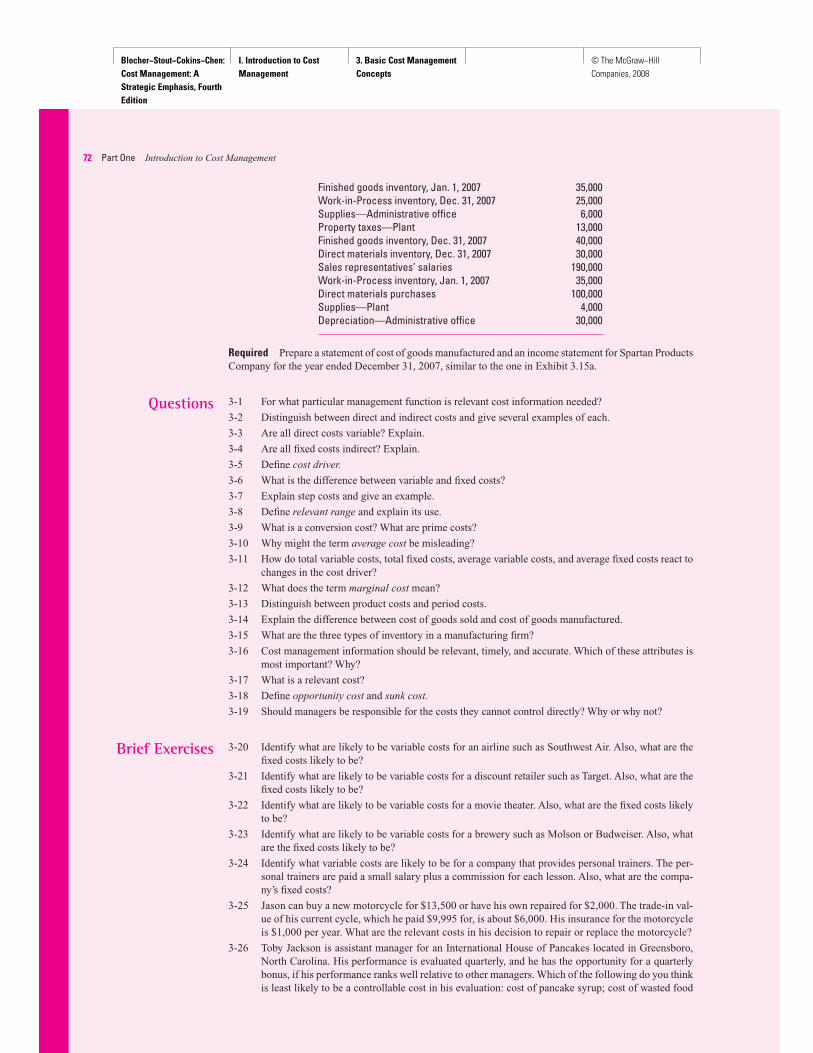
Blocher−Stout−Cokins−Chen: Cost Management: A Strategic Emphasis, Fourth Edition
I. Introduction to Cost Management
3. Basic Cost Management Concepts
© The McGraw−Hill Companies, 2008
72 Part One Introduction to Cost Management
Required Prepare a statement of cost of goods manufactured and an income statement for Spartan Products Company for the year ended December 31, 2007, similar to the one in Exhibit 3.15a .
Questions 3-1 For what particular management function is relevant cost information needed?
3-2 Distinguish between direct and indirect costs and give several examples of each.
3-3 Are all direct costs variable? Explain.
3-4 Are all fixed costs indirect? Explain.
3-5 Define cost driver.
3-6 What is the difference between variable and fixed costs?
3-7 Explain step costs and give an example.
3-8 Define relevant range and explain its use.
3-9 What is a conversion cost? What are prime costs?
3-10 Why might the term average cost be misleading?
3-11 How do total variable costs, total fixed costs, average variable costs, and average fixed costs react to changes in the cost driver?
3-12 What does the term marginal cost mean?
3-13 Distinguish between product costs and period costs.
3-14 Explain the difference between cost of goods sold and cost of goods manufactured.
3-15 What are the three types of inventory in a manufacturing fi rm?
3-16 Cost management information should be relevant, timely, and accurate. Which of these attributes is most important? Why?
3-17 What is a relevant cost?
3-18 Define opportunity cost and sunk cost .
3-19 Should managers be responsible for the costs they cannot control directly? Why or why not?
Brief Exercises 3-20 Identify what are likely to be variable costs for an airline such as Southwest Air. Also, what are the fixed costs likely to be?
3-21 Identify what are likely to be variable costs for a discount retailer such as Target. Also, what are the fixed costs likely to be?
3-22 Identify what are likely to be variable costs for a movie theater. Also, what are the fixed costs likely to be?
3-23 Identify what are likely to be variable costs for a brewery such as Molson or Budweiser. Also, what are the fixed costs likely to be?
3-24 Identify what variable costs are likely to be for a company that provides personal trainers. The per-sonal trainers are paid a small salary plus a commission for each lesson. Also, what are the compa-ny’s fixed costs?
3-25 Jason can buy a new motorcycle for $13,500 or have his own repaired for $2,000. The trade-in val-ue of his current cycle, which he paid $9,995 for, is about $6,000. His insurance for the motorcycle is $1,000 per year. What are the relevant costs in his decision to repair or replace the motorcycle?
3-26 Toby Jackson is assistant manager for an International House of Pancakes located in Greensboro, North Carolina. His performance is evaluated quarterly, and he has the opportunity for a quarterly bonus, if his performance ranks well relative to other managers. Which of the following do you think is least likely to be a controllable cost in his evaluation: cost of pancake syrup; cost of wasted food
Finished goods inventory, Jan. 1, 2007 35,000Work-in-Process inventory, Dec. 31, 2007 25,000Supplies—Administrative offi ce 6,000Property taxes—Plant 13,000Finished goods inventory, Dec. 31, 2007 40,000Direct materials inventory, Dec. 31, 2007 30,000Sales representatives’ salaries 190,000Work-in-Process inventory, Jan. 1, 2007 35,000Direct materials purchases 100,000Supplies—Plant 4,000Depreciation—Administrative offi ce 30,000

Blocher−Stout−Cokins−Chen: Cost Management: A Strategic Emphasis, Fourth Edition
I. Introduction to Cost Management
3. Basic Cost Management Concepts
© The McGraw−Hill Companies, 2008
Chapter 3 Basic Cost Management Concepts 73
items due to spoilage, overstocking, or errors in customers’ orders; cost of heat and lights for the restaurant; cost of cleaning supplies; or cost of waitresses/waiters?
3-27 Clay Armstrong misses a week of work and pay because of a family emergency. Is the lost pay best called a relevant cost, opportunity cost, or controllable cost?
3-28 If a merchandising company has a beginning finished goods inventory of $400,000 and a finishedgoods ending inventory of $200,000, and the company purchased $1,600,000 of inventory during the month, what is the company’s cost of goods sold?
3-29 The Walden Manufacturing Corp. has interest expense of $4,000, factory supplies of $1,000, indi-rect labor of $6,000, direct materials of $16,000, advertising expense of $2,500, office expense of $14,000, and direct labor of $20,000. What is the total period cost?
3-30 Kristin Dawson has a great idea to start a new business, but as a student, decides to focus on her studies. Is the loss of the potential profit from the new business best described as a controllable cost, a relevant cost, or an opportunity cost?
Exercises 3-31 Classifi cation of Costs The following costs were taken from the accounting records of the Barn-well Manufacturing Company:
1. State income taxes
2. Insurance on the manufacturing facilities
3. Supplies used in manufacturing
4. Wages for employees in the assembly department
5. Wages for employees who deliver the product
6. Interest on notes payable
7. Materials used in the production process
8. Rent for the sales outlet in Sacramento
9. Electricity for manufacturing equipment
10. Depreciation expense on delivery trucks
11. Wages for the sales staff
12. Factory supervisors’ salaries
13. Company president’s salary
14. Advertising expense
Required Classify each item as either a product cost or a period cost. Classify all product costs as direct or indirect, assuming that the cost object is each unit of product manufactured.
3-32 Classifi cation of Costs Following is a list of costs from Oakland Company, a furniture manufacturer:
1. Wood used in chairs
2. Salaries of inspectors
3. Lubricant used in machinery
4. Factory rent
5. Wages of assembly workers
6. Factory workers’ compensation insurance
7. Sandpaper
8. Fabric used for upholstery
9. Property taxes on manufacturing plant
10. Depreciation on machinery
Required Classify each cost as direct or indirect assuming that the cost object is each item manufactured. Also indicate whether each cost is a variable or fixed cost.
3-33 Classifi cation of Costs The following is a list of costs from the accounting records of Sunshine Pool Management, Inc. Each of Sunshine’s 77 customers owns a pool. Sunshine maintains each customer’s pool by providing supplies, cleaning, and repairs.
1. Lifesaving supplies
2. Salaries of Sunshine’s managers
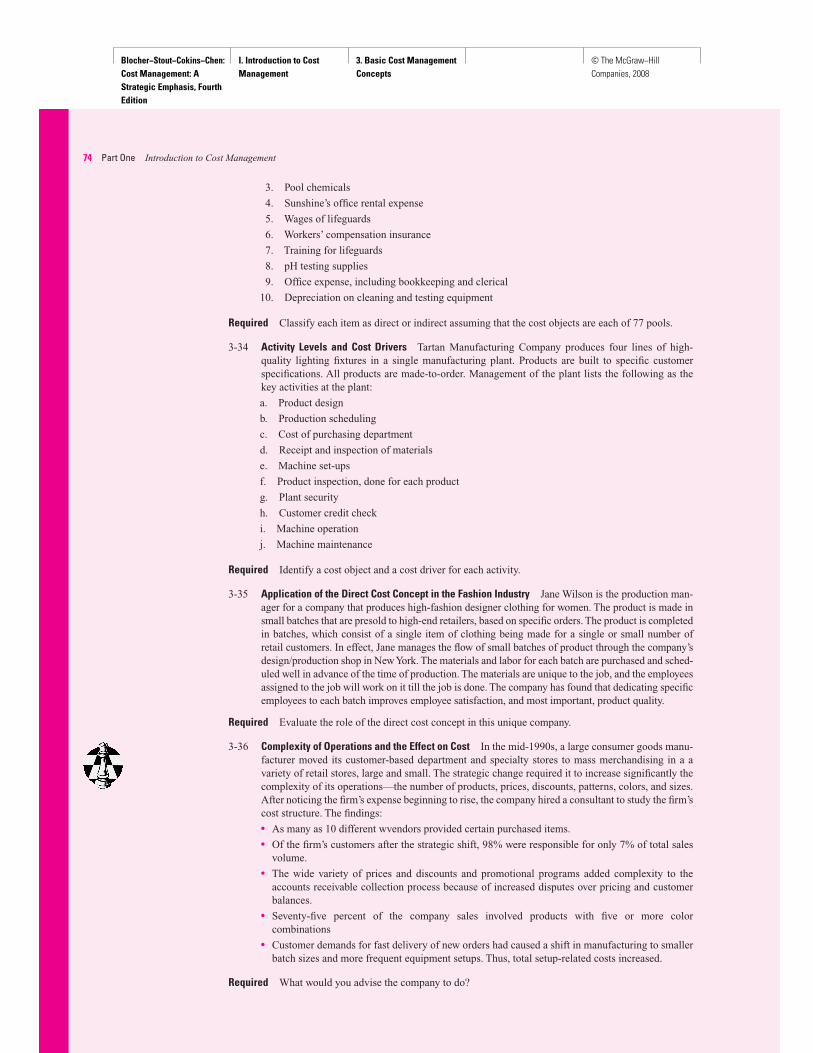
Blocher−Stout−Cokins−Chen: Cost Management: A Strategic Emphasis, Fourth Edition
I. Introduction to Cost Management
3. Basic Cost Management Concepts
© The McGraw−Hill Companies, 2008
74 Part One Introduction to Cost Management
3. Pool chemicals
4. Sunshine’s office rental expense
5. Wages of lifeguards
6. Workers’ compensation insurance
7. Training for lifeguards
8. pH testing supplies
9. Office expense, including bookkeeping and clerical
10. Depreciation on cleaning and testing equipment
Required Classify each item as direct or indirect assuming that the cost objects are each of 77 pools.
3-34 Activity Levels and Cost Drivers Tartan Manufacturing Company produces four lines of high-quality lighting fixtures in a single manufacturing plant. Products are built to specific customer specifications. All products are made-to-order. Management of the plant lists the following as the key activities at the plant:
a. Product design
b. Production scheduling
c. Cost of purchasing department
d. Receipt and inspection of materials
e. Machine set-ups
f. Product inspection, done for each product
g. Plant security
h. Customer credit check
i. Machine operation
j. Machine maintenance
Required Identify a cost object and a cost driver for each activity.
3-35 Application of the Direct Cost Concept in the Fashion Industry Jane Wilson is the production man-ager for a company that produces high-fashion designer clothing for women. The product is made in small batches that are presold to high-end retailers, based on specific orders. The product is completed in batches, which consist of a single item of clothing being made for a single or small number of retail customers. In effect, Jane manages the flow of small batches of product through the company’s design/production shop in New York. The materials and labor for each batch are purchased and sched-uled well in advance of the time of production. The materials are unique to the job, and the employees assigned to the job will work on it till the job is done. The company has found that dedicating specificemployees to each batch improves employee satisfaction, and most important, product quality.
Required Evaluate the role of the direct cost concept in this unique company.
3-36 Complexity of Operations and the Effect on Cost In the mid-1990s, a large consumer goods manu-facturer moved its customer-based department and specialty stores to mass merchandising in a a variety of retail stores, large and small. The strategic change required it to increase significantly the complexity of its operations—the number of products, prices, discounts, patterns, colors, and sizes. After noticing the firm’s expense beginning to rise, the company hired a consultant to study the firm’s cost structure. The findings:
• As many as 10 different wvendors provided certain purchased items.
• Of the firm’s customers after the strategic shift, 98% were responsible for only 7% of total sales volume.
• The wide variety of prices and discounts and promotional programs added complexity to the accounts receivable collection process because of increased disputes over pricing and customer balances.
• Seventy-five percent of the company sales involved products with five or more color combinations
• Customer demands for fast delivery of new orders had caused a shift in manufacturing to smaller batch sizes and more frequent equipment setups. Thus, total setup-related costs increased.
Required What would you advise the company to do?
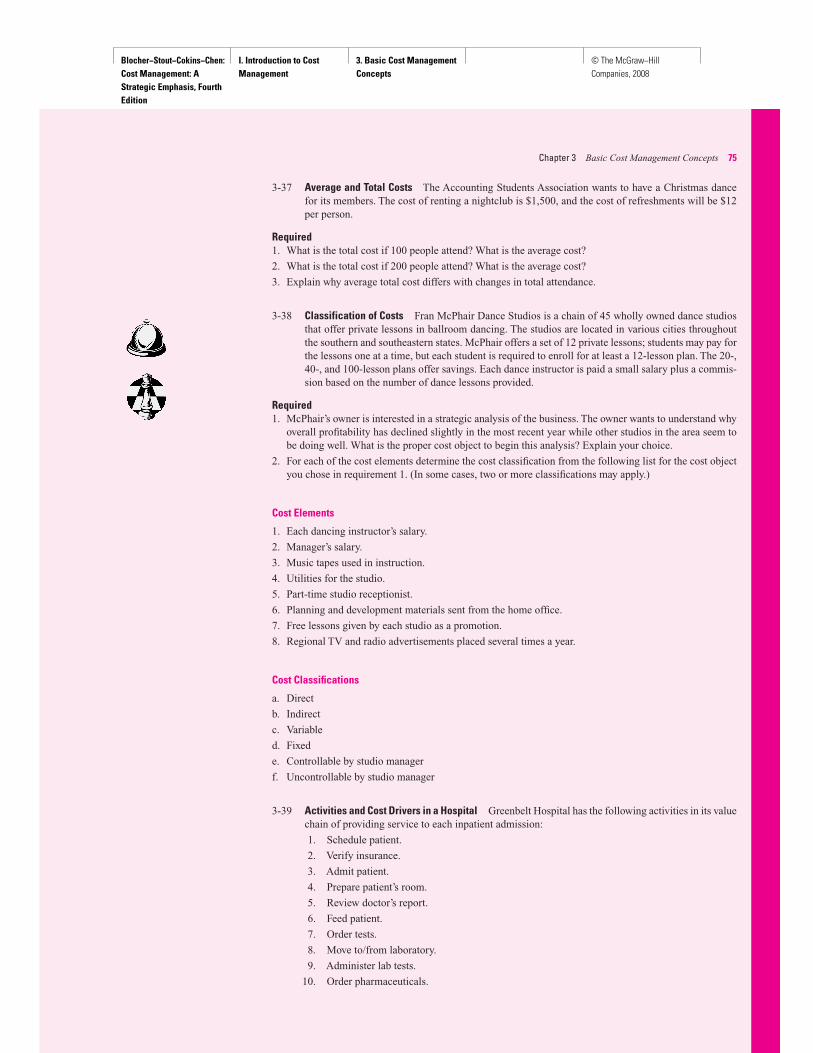
Blocher−Stout−Cokins−Chen: Cost Management: A Strategic Emphasis, Fourth Edition
I. Introduction to Cost Management
3. Basic Cost Management Concepts
© The McGraw−Hill Companies, 2008
Chapter 3 Basic Cost Management Concepts 75
3-37 Average and Total Costs The Accounting Students Association wants to have a Christmas dance for its members. The cost of renting a nightclub is $1,500, and the cost of refreshments will be $12 per person.
Required1. What is the total cost if 100 people attend? What is the average cost?
2. What is the total cost if 200 people attend? What is the average cost?
3. Explain why average total cost differs with changes in total attendance.
3-38 Classification of Costs Fran McPhair Dance Studios is a chain of 45 wholly owned dance studios that offer private lessons in ballroom dancing. The studios are located in various cities throughout the southern and southeastern states. McPhair offers a set of 12 private lessons; students may pay for the lessons one at a time, but each student is required to enroll for at least a 12-lesson plan. The 20-, 40-, and 100-lesson plans offer savings. Each dance instructor is paid a small salary plus a commis-sion based on the number of dance lessons provided.
Required1. McPhair’s owner is interested in a strategic analysis of the business. The owner wants to understand why
overall profitability has declined slightly in the most recent year while other studios in the area seem to be doing well. What is the proper cost object to begin this analysis? Explain your choice.
2. For each of the cost elements determine the cost classification from the following list for the cost object you chose in requirement 1. (In some cases, two or more classifications may apply.)
Cost Elements
1. Each dancing instructor’s salary.
2. Manager’s salary.
3. Music tapes used in instruction.
4. Utilities for the studio.
5. Part-time studio receptionist.
6. Planning and development materials sent from the home office.
7. Free lessons given by each studio as a promotion.
8. Regional TV and radio advertisements placed several times a year.
Cost Classifi cations
a. Direct
b. Indirect
c. Variable
d. Fixed
e. Controllable by studio manager
f. Uncontrollable by studio manager
3-39 Activities and Cost Drivers in a Hospital Greenbelt Hospital has the following activities in its value chain of providing service to each inpatient admission:
1. Schedule patient.
2. Verify insurance.
3. Admit patient.
4. Prepare patient’s room.
5. Review doctor’s report.
6. Feed patient.
7. Order tests.
8. Move to/from laboratory.
9. Administer lab tests.
10. Order pharmaceuticals.
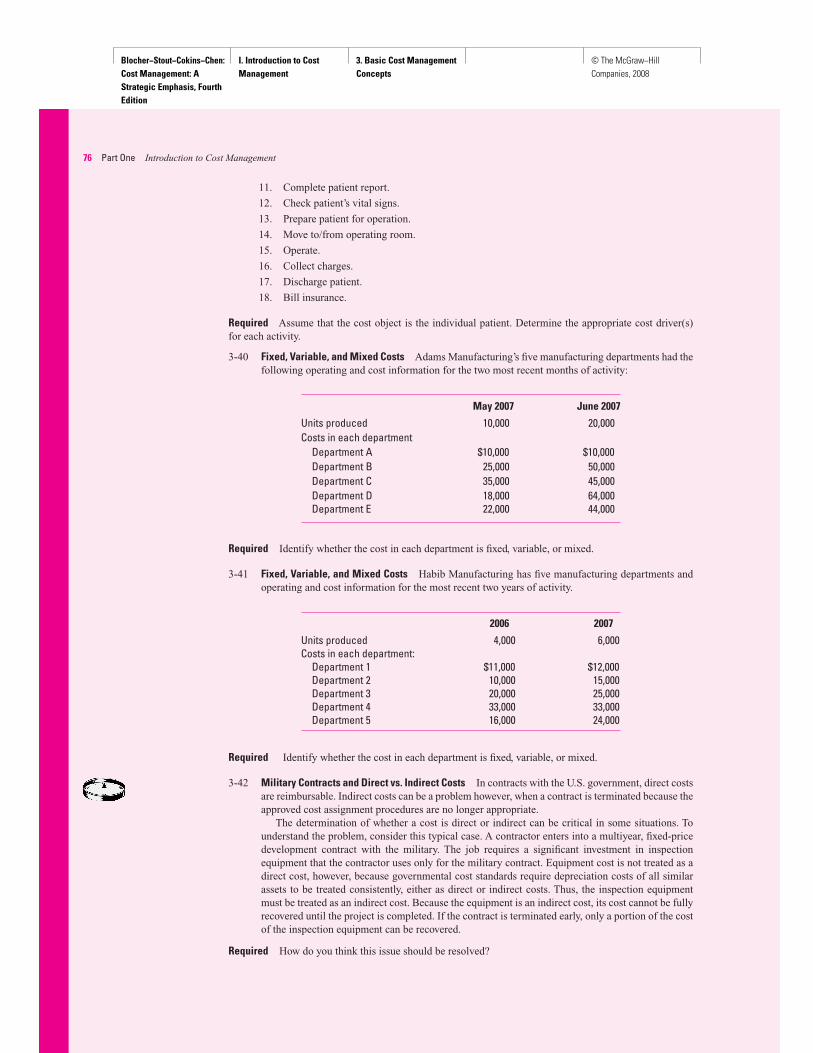
Blocher−Stout−Cokins−Chen: Cost Management: A Strategic Emphasis, Fourth Edition
I. Introduction to Cost Management
3. Basic Cost Management Concepts
© The McGraw−Hill Companies, 2008
76 Part One Introduction to Cost Management
11. Complete patient report.
12. Check patient’s vital signs.
13. Prepare patient for operation.
14. Move to/from operating room.
15. Operate.
16. Collect charges.
17. Discharge patient.
18. Bill insurance.
Required Assume that the cost object is the individual patient. Determine the appropriate cost driver(s) for each activity.
3-40 Fixed, Variable, and Mixed Costs Adams Manufacturing’s five manufacturing departments had the following operating and cost information for the two most recent months of activity:
May 2007 June 2007
Units produced 10,000 20,000 Costs in each department
Department A $10,000 $10,000 Department B 25,000 50,000 Department C 35,000 45,000 Department D 18,000 64,000 Department E 22,000 44,000
Required Identify whether the cost in each department is fixed, variable, or mixed.
3-41 Fixed, Variable, and Mixed Costs Habib Manufacturing has five manufacturing departments and operating and cost information for the most recent two years of activity.
2006 2007
Units produced 4,000 6,000 Costs in each department:
Department 1 $11,000 $12,000 Department 2 10,000 15,000 Department 3 20,000 25,000 Department 4 33,000 33,000 Department 5 16,000 24,000
Required Identify whether the cost in each department is fixed, variable, or mixed.
3-42 Military Contracts and Direct vs. Indirect Costs In contracts with the U.S. government, direct costs are reimbursable. Indirect costs can be a problem however, when a contract is terminated because the approved cost assignment procedures are no longer appropriate.
The determination of whether a cost is direct or indirect can be critical in some situations. To understand the problem, consider this typical case. A contractor enters into a multiyear, fixed-pricedevelopment contract with the military. The job requires a significant investment in inspection equipment that the contractor uses only for the military contract. Equipment cost is not treated as a direct cost, however, because governmental cost standards require depreciation costs of all similar assets to be treated consistently, either as direct or indirect costs. Thus, the inspection equipment must be treated as an indirect cost. Because the equipment is an indirect cost, its cost cannot be fully recovered until the project is completed. If the contract is terminated early, only a portion of the cost of the inspection equipment can be recovered.
Required How do you think this issue should be resolved?
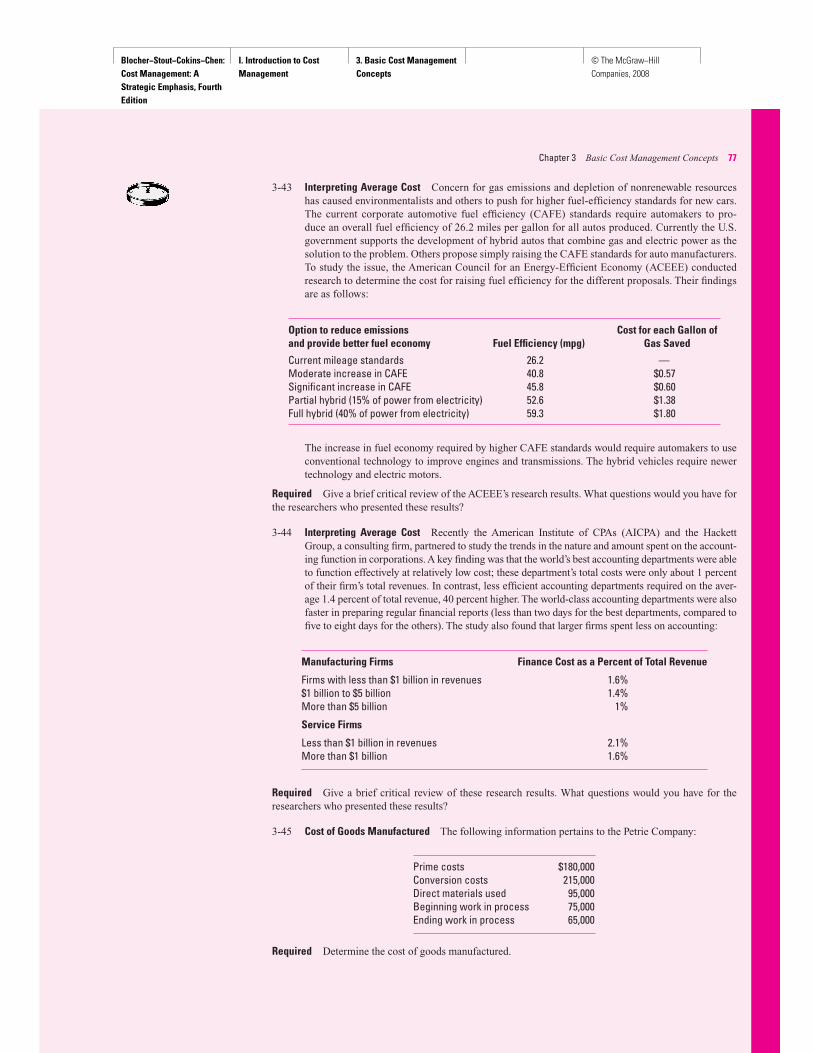
Blocher−Stout−Cokins−Chen: Cost Management: A Strategic Emphasis, Fourth Edition
I. Introduction to Cost Management
3. Basic Cost Management Concepts
© The McGraw−Hill Companies, 2008
Chapter 3 Basic Cost Management Concepts 77
3-43 Interpreting Average Cost Concern for gas emissions and depletion of nonrenewable resources has caused environmentalists and others to push for higher fuel-efficiency standards for new cars. The current corporate automotive fuel efficiency (CAFE) standards require automakers to pro-duce an overall fuel efficiency of 26.2 miles per gallon for all autos produced. Currently the U.S. government supports the development of hybrid autos that combine gas and electric power as the solution to the problem. Others propose simply raising the CAFE standards for auto manufacturers. To study the issue, the American Council for an Energy-Efficient Economy (ACEEE) conducted research to determine the cost for raising fuel efficiency for the different proposals. Their findings are as follows:
Option to reduce emissions Cost for each Gallon of and provide better fuel economy Fuel Effi ciency (mpg) Gas Saved
Current mileage standards 26.2 — Moderate increase in CAFE 40.8 $0.57 Signifi cant increase in CAFE 45.8 $0.60 Partial hybrid (15% of power from electricity) 52.6 $1.38 Full hybrid (40% of power from electricity) 59.3 $1.80
The increase in fuel economy required by higher CAFE standards would require automakers to use conventional technology to improve engines and transmissions. The hybrid vehicles require newer technology and electric motors.
Required Give a brief critical review of the ACEEE’s research results. What questions would you have for the researchers who presented these results?
3-44 Interpreting Average Cost Recently the American Institute of CPAs (AICPA) and the Hackett Group, a consulting firm, partnered to study the trends in the nature and amount spent on the account-ing function in corporations. A key finding was that the world’s best accounting departments were able to function effectively at relatively low cost; these department’s total costs were only about 1 percent of their firm’s total revenues. In contrast, less efficient accounting departments required on the aver-age 1.4 percent of total revenue, 40 percent higher. The world-class accounting departments were also faster in preparing regular financial reports (less than two days for the best departments, compared to five to eight days for the others). The study also found that larger firms spent less on accounting:
Manufacturing Firms Finance Cost as a Percent of Total Revenue
Firms with less than $1 billion in revenues 1.6% $1 billion to $5 billion 1.4% More than $5 billion 1%
Service Firms
Less than $1 billion in revenues 2.1% More than $1 billion 1.6%
Required Give a brief critical review of these research results. What questions would you have for the researchers who presented these results?
3-45 Cost of Goods Manufactured The following information pertains to the Petrie Company:
Prime costs $180,000 Conversion costs 215,000 Direct materials used 95,000 Beginning work in process 75,000 Ending work in process 65,000
Required Determine the cost of goods manufactured.

Blocher−Stout−Cokins−Chen: Cost Management: A Strategic Emphasis, Fourth Edition
I. Introduction to Cost Management
3. Basic Cost Management Concepts
© The McGraw−Hill Companies, 2008
78 Part One Introduction to Cost Management
3-46 Product Costs and Period Costs Galletas Americanas is a cookie company in Guadalajara, Mexico, that produces and sells high-quality American-style cookies. The owner wants to identify the vari-ous costs incurred each year to be able to plan and control the business costs. Galletas Americanas’s costs are the following (in thousands of pesos):
Utilities for the bakery 1,600 Paper used in packaging product 70 Salaries and wages in the bakery 15,000 Cookie ingredients 27,000 Bakery labor and fringe benefi ts 1,000 Administrative costs 800 Bakery equipment maintenance 600 Depreciation of bakery plant and equipment 1,500 Uniforms 300 Insurance for the bakery 600 Rent for administrative offi ces 13,200 Advertising 1,500 Boxes, bags, and cups used in the bakery 700 Manager’s salary 10,000 Overtime premiums 2,000 Idle time 400
Required1. What is the total amount of product and period costs?
2. Assume that Galletas is planning to expand its business into the United States and Canada, initially tar-geting the United States. This expansion will not require additional baking facilities, but labor and mate-rials costs will increase, and advertising costs and packaging costs will increase substantially. Also, U.S. authorities will require certain documentation and inspections that will be an added cost for Galletas.
a. Which of the additional costs are product costs?
b. Which costs are relevant for the decision whether to expand into the United States?
3-47 Executional Cost Drivers, Internet Retailer Assume that you are a consultant for a start-up Internet retailer, Bikes.com, which provides a variety of bicycle parts and accessories in a convenient and ef-fective customer service approach. The firm operates from an office building and nearby warehouse located in Danville, Virginia. Currently, the firm has 10 permanent administrative staff, 6 customer service representatives who respond to customer inquiries, and 12 employees who pick, pack, and ship customer orders. All orders are placed over the firm’s Web site. An 800 telephone number is available for customer service. The firm’s sales increased at about 20 percent per year in the last two years, a decline from the 50 percent rate in its first three years of operation. Management is con-cerned that the decline will delay the firm’s first expected profit, which had been projected to occur in the next two years. The firm is privately held and has been financed with a combination of bank loans, personal investments of top managers, and venture capital funding.
Required What specific executional cost drivers are important in this business? How should the firm usethem to improve its sales rate?
3-48 Structural Cost Drivers Case A. Food Fare is a small chain of restaurants that has developed a loyal customer base by
providing fast-food items with more choices (e.g., how the hamburger should be cooked; self-serve toppings) and a more comfortable atmosphere. The menu has a small number of popular items, in-cluding several different hamburgers, grilled chicken sandwiches, and salads. Recently, to broaden its appeal, Food Fare added barbecue, seafood, and steak to its menu.
Case B. Gilman Heating and Air Conditioning, Inc., provides a broad range of services to com-mercial and residential customers, including installation and repair of several different brands of heating and air conditioning systems. Gilman has a fleet of 28 trucks, each operated by one or more service technicians, depending on the size of a job. A recurrent problem for Gilman has been coor-dinating the service teams during the day to determine the status of a job and the need for parts not kept in the service vehicle as well as to identify which team to send on emergency calls. Gilman’s service area is spread over an urban/rural area of approximately 20 square miles. The company has developed cost and price sheets so that the service technicians accurately and consistently price the service work they perform.
Problems

Blocher−Stout−Cokins−Chen: Cost Management: A Strategic Emphasis, Fourth Edition
I. Introduction to Cost Management
3. Basic Cost Management Concepts
© The McGraw−Hill Companies, 2008
Chapter 3 Basic Cost Management Concepts 79
Required For each case, identify the important structural cost drivers for the company and the related strategic issues that it should address to be competitive.
3-49 Cost of Goods Manufactured and Sold Benvanides Company produces women’s clothing. During 2007, the company incurred the following costs:
Factory rent $425,000 Direct labor 325,000 Utilities—Factory 75,000 Purchases of direct materials 465,000 Indirect materials 70,000 Indirect labor 35,000
Inventories for the year were as follows:
January 1 December 31
Direct materials $ 30,000 $50,000 Work in process 40,000 85,000 Finished goods 115,000 95,000
Required1. Prepare a statement of cost of goods manufactured.
2. Calculate cost of goods sold.
3-50 Cost of Goods Manufactured The following data pertain to Duvernoy Company for the year ended December 31, 2008:
December 31, 2006 December 31, 2007
Purchases of direct materials $60,000Direct labor 45,000Indirect labor 25,000Factory insurance 12,000Depreciation—Factory 80,000Repairs and maintenance—Factory 15,000Marketing expenses 66,000General and administrative expenses 55,000Direct materials inventory $20,000 35,000Work-in-process inventory 33,000 35,000Finished goods inventory 23,000 20,000
Sales in 2007 were $500,000.
Required Prepare a schedule of cost of goods manufactured and an income statement for 2007 for Duver-noy Company similar to those in Exhibit 3.15a .
3-51 Cost of Goods Manufactured, Income Statement Consider the following information for House-hold Furnishings, Inc. for the year ended December 31, 2007:
Depreciation expense—Administrative offi ce $ 33,000Depreciation expense—Plant and equipment 88,000Direct labor—Wages 487,000Direct materials inventory, Dec. 31, 2007 25,000Direct materials inventory, Jan. 1, 2007 18,000Direct materials purchases 155,000Finished goods inventory, Dec. 31, 2007 38,000Finished goods inventory, Jan. 1, 2007 15,000Heat, light, & power—Plant 44,000
(Continued)

Blocher−Stout−Cokins−Chen: Cost Management: A Strategic Emphasis, Fourth Edition
I. Introduction to Cost Management
3. Basic Cost Management Concepts
© The McGraw−Hill Companies, 2008
80 Part One Introduction to Cost Management
Required Prepare a statement of cost of goods manufactured and an income statement for Household Furnishings for the year ended December 31, 2007, similar to the one in Exhibit 3.15a .
3-52 Cost of Goods Manufactured; Income Statement Consider the following information for Blue Water Equipment, Inc., a manufacturer of sailboat rigging, blocks, and cordage.
Advertising expenses $ 16,000 Depreciation expense—admin. offi ce 73,000 Depreciation expense—plant 197,000 Depreciation expense—delivery trucks 34,000 Direct materials inventory, beginning 33,000 Direct materials inventory, ending 28,000 Direct materials purchases 190,000 Direct labor 345,000 Indirect labor 128,000 Finished goods inventory, beginning 66,000 Finished goods inventory, ending 43,000 Insurance on plant 44,000 Heat and light for plant 23,000 Repairs on plant building 34,000 Supervisor’s salary—plant 85,000 Supplies—plant 21,000 Supplies—administrative offi ce 42,000 Work-in-process inventory, beginning 14,000 Work-in-process inventory, ending 11,000 Sales representatives’ salaries 216,000 Sales revenue 1,675,000
Required Prepare a statement of cost of goods manufactured and an income statement for Blue Water Equipment, Inc. for the year ended December 31, 2007.
3-53 Cost of Goods Manufactured, Calculating Unknowns The following information was taken from the accounting records of Blazek Manufacturing Company. Unfortunately, some of the data were destroyed by a computer malfunction.
Case A Case B
Sales $100,000 $ ? Finished goods inventory, Jan. 1, 2007 15,000 8,000 Finished goods inventory, Dec. 31, 2007 16,000 ? Cost of goods sold ? 43,000 Gross margin 25,000 3,000 Selling and administrative expenses ? 1,000 Operating income 10,000 2,000 Work in process, Jan. 1, 2007 ? 14,000 Direct material used 18,000 8,000 Direct labor 15,000 9,000 Factory overhead 20,000 ? Total manufacturing costs ? 35,000 Work in process, Dec. 31, 2007 7,000 ? Cost of goods manufactured ? 45,000
Required Calculate the unknowns indicated by question marks.
Indirect labor 25,000Property taxes—Plant 34,000Sales representatives’ salaries 145,000Sales revenue 1,500,000Factory Supervisor’s salary 66,000Supplies—Administrative offi ce 16,000Supplies—Plant 29,000Work-in-Process inventory, Dec. 31, 2007 9,000Work-in-Process inventory, Jan. 1, 2007 23,000

Blocher−Stout−Cokins−Chen: Cost Management: A Strategic Emphasis, Fourth Edition
I. Introduction to Cost Management
3. Basic Cost Management Concepts
© The McGraw−Hill Companies, 2008
Chapter 3 Basic Cost Management Concepts 81
3-54 Cost of Goods Manufactured, Income Statement Norton Industries, a manufacturer of cable for the heavy construction industry, closes its books and prepares financial statements at the end of each month. The statement of cost of goods sold for April 2007 follows:
NORTON INDUSTRIESStatement of Cost of Goods Sold
For the Month Ended April 30, 2007($000 omitted)
Inventory of fi nished goods, March 31 $ 50Cost of goods manufactured 790Cost of goods available for sale $840Less inventory of fi nished goods, April 30 247Cost of goods sold $593
Additional Information • Of the utilities, 80 percent relates to manufacturing the cable; the remaining 20 percent relates to the
sales and administrative functions.
• All rent is for the office building.
• Property taxes are assessed on the manufacturing plant.
• Of the insurance, 60 percent is related to manufacturing the cable; the remaining 40 percent is related to the sales and administrative functions.
• Depreciation expense includes the following:
Manufacturing plant $20,000Manufacturing equipment 30,000Offi ce equipment 4,000
$54,000
• The company manufactured 7,825 tons of cable during May 2007.
• The inventory balances at May 31, 2007, follow:
• Direct materials inventory $23,000
• Work-in-process inventory $220,000
• Finished goods inventory $175,000
NORTON INDUSTRIESPreclosing Account Balances
May 31, 2007($000 omitted)
Cash and marketable securities $ 54Accounts and notes receivable 210Direct materials inventory (4/30/07) 28Work-in-process inventory (4/30/07) 150Finished goods inventory (4/30/07) 247Property, plant, and equipment (net) 1,140Accounts, notes, and taxes payable 70Bonds payable 600Paid-in capital 100Retained earnings 930Sales 1,488Sales discounts 20Other revenue 2
(Continued)

Blocher−Stout−Cokins−Chen: Cost Management: A Strategic Emphasis, Fourth Edition
I. Introduction to Cost Management
3. Basic Cost Management Concepts
© The McGraw−Hill Companies, 2008
82 Part One Introduction to Cost Management
Solution to Self-Study Problem
Purchases of direct materials 510Direct labor 260Indirect factory labor 90Offi ce salaries 122Sales salaries 42Utilities 135Rent 9Property tax 60Insurance 20Depreciation 54Interest expense 6Freight-in for materials purchases 15
Required Based on Exhibit 3.15, prepare the following:
1. Statement of cost of goods manufactured for Norton Industries for May 2007.
2. Income statement for Norton Industries for May 2007.
(CMA Adapted)
SPARTAN PRODUCTS COMPANYStatement of Cost of Goods Manufactured
For the Year Ended December 31, 2007
Direct materialsDirect materials inventory, Jan. 1, 2007 $ 20,000Purchases of direct materials 100,000Total direct materials available $120,000Direct materials inventory, Dec. 31, 2007 30,000
Direct materials used $ 90,000Direct labor 350,000Factory overhead
Heat, light, and power—Plant 12,000Supplies—Plant 4,000Property taxes—Plant 13,000Depreciation expense—Plant and equipment 80,000Indirect labor 5,000Supervisor’s salary—Plant 40,000
Total factory overhead 154,000Total manufacturing costs $594,000Add: Beginning work-in-process inventory, Jan. 1, 2007 35,000Total manufacturing costs to account for $629,000Less: Ending work-in-process, Dec. 31, 2007 25,000
Cost of goods manufactured $604,000
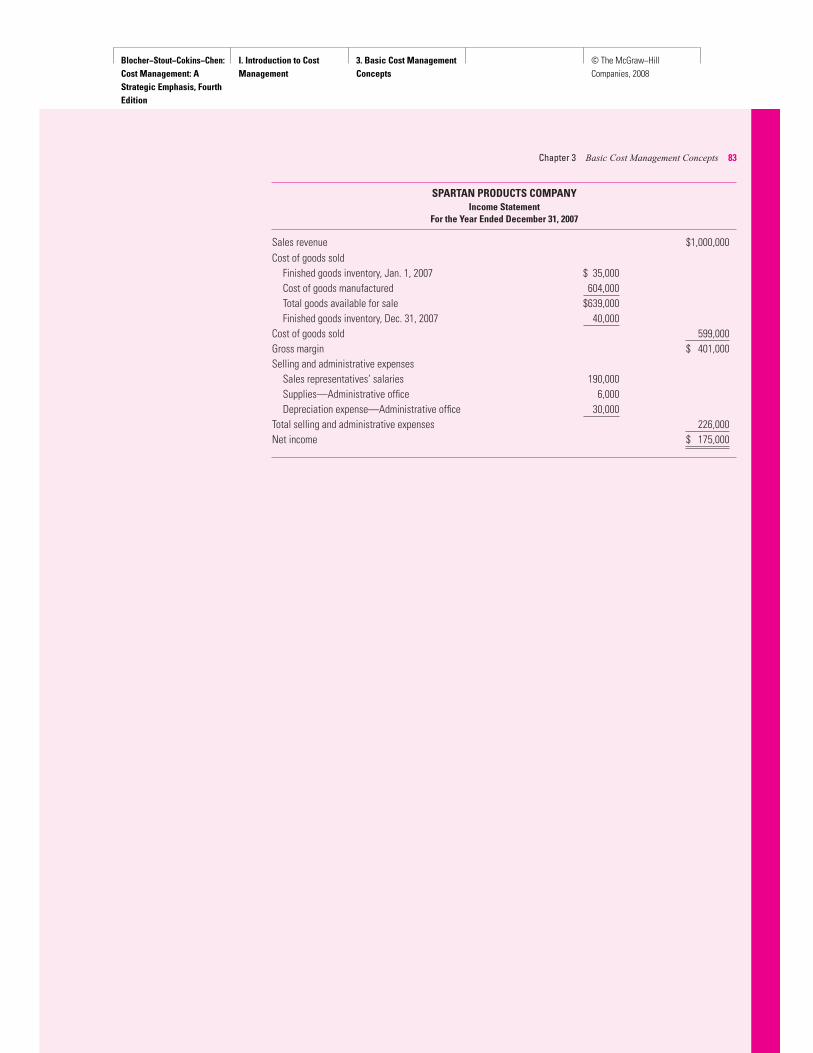
Blocher−Stout−Cokins−Chen: Cost Management: A Strategic Emphasis, Fourth Edition
I. Introduction to Cost Management
3. Basic Cost Management Concepts
© The McGraw−Hill Companies, 2008
Chapter 3 Basic Cost Management Concepts 83
SPARTAN PRODUCTS COMPANYIncome Statement
For the Year Ended December 31, 2007
Sales revenue $1,000,000Cost of goods sold
Finished goods inventory, Jan. 1, 2007 $ 35,000Cost of goods manufactured 604,000Total goods available for sale $639,000Finished goods inventory, Dec. 31, 2007 40,000
Cost of goods sold 599,000Gross margin $ 401,000Selling and administrative expenses
Sales representatives’ salaries 190,000Supplies—Administrative offi ce 6,000Depreciation expense—Administrative offi ce 30,000
Total selling and administrative expenses 226,000Net income $ 175,000