chapter three - caltech computing
TRANSCRIPT

Chapter ThreeExamples
... Don’t apply any model until you understand the simplifying assumptions on which it isbased, and you can test their validity. Catch phrase: use only as directed. Don’t limit yourselfto a single model: More than one model may be useful for understanding different aspects ofthe same phenomenon. Catch phrase: legalize polygamy.”
Saul Golomb, “Mathematical Models—Uses and Limitations,” 1970 [Gol70].
In this chapter we present a collection of examples spanningmany differentfields of science and engineering. These examples will be used throughout thetext and in exercises to illustrate different concepts. First-time readers may wish tofocus on only a few examples with which they have had the most prior experience orinsight to understand the concepts of state, input, output and dynamics in a familiarsetting.
3.1 Cruise Control
The cruise control system of a car is a common feedback system encountered ineveryday life. The system attempts to maintain a constant velocity in the presenceof disturbances primarily caused by changes in the slope of aroad. The controllercompensates for these unknowns by measuring the speed of thecar and adjustingthe throttle appropriately.
To model the system we start with the block diagram in Figure 3.1. Let v bethe speed of the car andvr the desired (reference) speed. The controller, whichtypically is of the proportional-integral (PI) type described briefly in Chapter 1,receives the signalsv andvr and generates a control signalu that is sent to anactuator that controls the throttle position. The throttle in turn controls the torqueT delivered by the engine, which is transmitted through the gears and the wheels,generating a forceF that moves the car. There are disturbance forcesFd due tovariations in the slope of the road, the rolling resistance and aerodynamic forces.The cruise controller also has a human–machine interface that allows the driverto set and modify the desired speed. There are also functions that disconnect thecruise control when the brake is touched.
The system has many individual components—actuator, engine, transmission,wheels and car body—and a detailed model can be very complicated. In spite ofthis, the model required to design the cruise controller canbe quite simple.
To develop a mathematical model we start with a force balancefor the car body.Let v be the speed of the car,m the total mass (including passengers),F the forcegenerated by the contact of the wheels with the road, andFd the disturbance force

66 CHAPTER 3. EXAMPLES
Gears &
Actuator
vr
Controller
BodyThrottle &
Engine
Fd
v
cancelresume/accelset/decelon/off
Driver
Interface
T F
u
Wheels
Figure 3.1: Block diagram of a cruise control system for an automobile. The throttle-controlled engine generates a torqueT that is transmitted to the ground through the gearboxand wheels. Combined with the external forces from the environment, such as aerodynamicdrag and gravitational forces on hills, the net force causes the car to move. The velocityof the carv is measured by a control system that adjusts the throttle through an actuationmechanism. A driver interface allows the system to be turned on and off and the referencespeedvr to be established.
due to gravity, friction and aerodynamic drag. The equation of motion of the car issimply
mdv
dt= F − Fd. (3.1)
The forceF is generated by the engine, whose torque is proportional to the rateof fuel injection, which is itself proportional to a controlsignal 0≤ u ≤ 1 thatcontrols the throttle position. The torque also depends on engine speedω. A simplerepresentation of the torque at full throttle is given by thetorque curve
T(ω) = Tm
(
1 − β
(
ω
ωm− 1
)2)
, (3.2)
where the maximum torqueTm is obtained at engine speedωm. Typical parametersare Tm = 190 Nm,ωm = 420 rad/s (about 4000 RPM) andβ = 0.4. Let n bethe gear ratio andr the wheel radius. The engine speed is related to the velocitythrough the expression
ω =n
rv =: αnv,
and the driving force can be written as
F =nu
rT(ω) = αnuT(αnv).
Typical values ofαn for gears 1 through 5 areα1 = 40,α2 = 25,α3 = 16,α4 = 12andα5 = 10. The inverse ofαn has a physical interpretation as theeffective wheelradius. Figure 3.2 shows the torque as a function of engine speed and vehicle speed.The figure shows that the effect of the gear is to “flatten” the torque curve so thatan almost full torque can be obtained almost over the whole speed range.
The disturbance forceFd has three major components:Fg, the forces due to

3.1. CRUISE CONTROL 67
0 200 400 600100
120
140
160
180
200
Angular velocity ω [rad/s]
Tor
que T
[Nm
]
0 20 40 60100
120
140
160
180
200
n=1 n=2 n=3 n=4
n=5
Velocity v [m/s]
Tor
que T
[Nm
]
Figure 3.2: Torque curves for typical car engine. The graph on the left shows thetorquegenerated by the engine as a function of the angular velocity of the engine,while the curveon the right shows torque as a function of car speed for different gears.
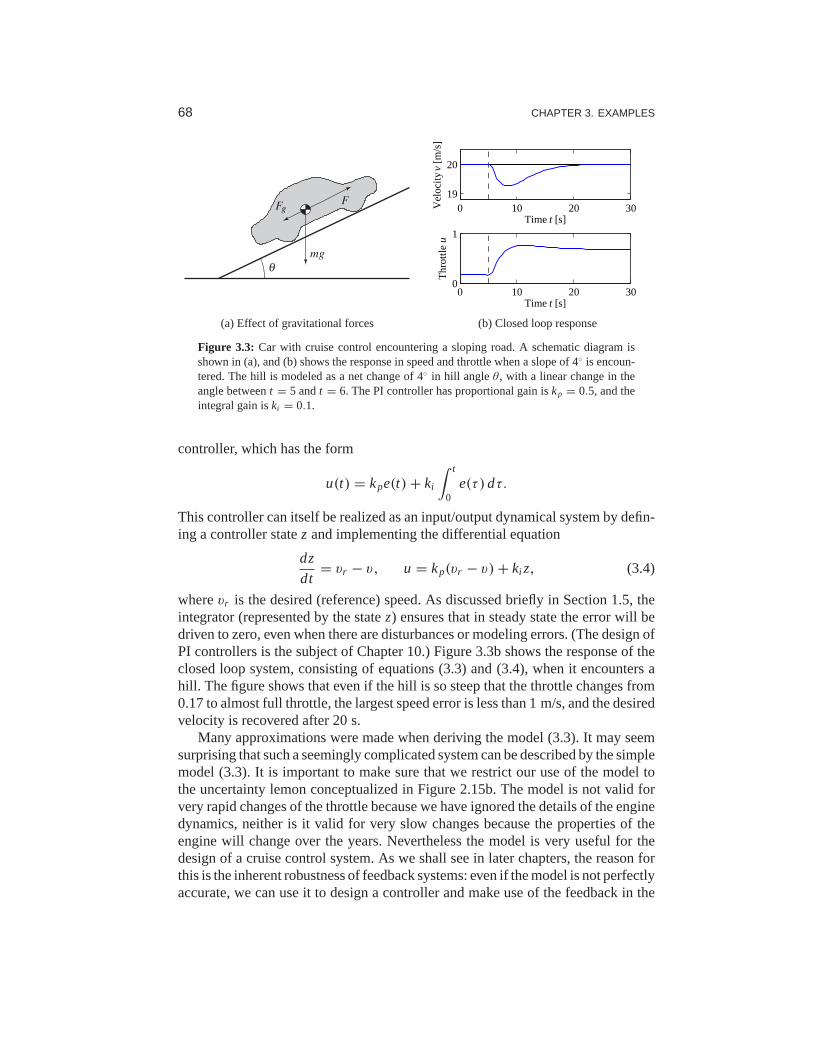
gravity; Fr , the forces due to rolling friction; andFa, the aerodynamic drag. Lettingthe slope of the road beθ , gravity gives the forceFg = mgsinθ , as illustrated inFigure 3.3a, whereg = 9.8 m/s2 is the gravitational constant. A simple model ofrolling friction is
Fr = mgCr sgn(v),
whereCr is the coefficient of rolling friction and sgn(v) is the sign ofv (±1) orzero if v = 0. A typical value for the coefficient of rolling friction isCr = 0.01.Finally, the aerodynamic drag is proportional to the square of the speed:
Fa =1
2ρCd Av2,
whereρ is the density of air,Cd is the shape-dependent aerodynamic drag coefficientandA is the frontal area of the car. Typical parameters areρ = 1.3 kg/m3,Cd = 0.32andA = 2.4 m2.
Summarizing, we find that the car can be modeled by
mdv
dt= αnuT(αnv) − mgCr sgn(v) −
1
2ρCd Av2 − mgsinθ, (3.3)
where the functionT is given by equation (3.2). The model (3.3) is a dynamicalsystem of first order. The state is the car velocityv, which is also the output. Theinput is the signalu that controls the throttle position, and the disturbance istheforceFd, which depends on the slope of the road. The system is nonlinear becauseof the torque curve, the gravity term and the nonlinear character of rolling frictionand aerodynamic drag. There can also be variations in the parameters; e.g., the massof the car depends on the number of passengers and the load being carried in thecar.
We add to this model a feedback controller that attempts to regulate the speedof the car in the presence of disturbances. We shall use a proportional-integral
68 CHAPTER 3. EXAMPLES
gF
mg
F
θ
(a) Effect of gravitational forces
0 10 20 3019
20
Time t [s]
Vel
ocity
v [m
/s]
0 10 20 300
1
Time t [s]
Thr
ottle
u
(b) Closed loop response
Figure 3.3: Car with cruise control encountering a sloping road. A schematic diagramisshown in (a), and (b) shows the response in speed and throttle when a slope of 4◦ is encoun-tered. The hill is modeled as a net change of 4◦ in hill angleθ , with a linear change in theangle betweent = 5 andt = 6. The PI controller has proportional gain iskp = 0.5, and theintegral gain iski = 0.1.
controller, which has the form
u(t) = kpe(t) + ki
∫ t
0e(τ ) dτ.
This controller can itself be realized as an input/output dynamical system by defin-ing a controller statez and implementing the differential equation
dz
dt= vr − v, u = kp(vr − v) + ki z, (3.4)
wherevr is the desired (reference) speed. As discussed briefly in Section 1.5, theintegrator (represented by the statez) ensures that in steady state the error will bedriven to zero, even when there are disturbances or modelingerrors. (The design ofPI controllers is the subject of Chapter 10.) Figure 3.3b showsthe response of theclosed loop system, consisting of equations (3.3) and (3.4), when it encounters ahill. The figure shows that even if the hill is so steep that the throttle changes from0.17 to almost full throttle, the largest speed error is lessthan 1 m/s, and the desiredvelocity is recovered after 20 s.
Many approximations were made when deriving the model (3.3). It may seemsurprising that such a seemingly complicated system can be described by the simplemodel (3.3). It is important to make sure that we restrict ouruse of the model tothe uncertainty lemon conceptualized in Figure 2.15b. The model is not valid forvery rapid changes of the throttle because we have ignored the details of the enginedynamics, neither is it valid for very slow changes because the properties of theengine will change over the years. Nevertheless the model isvery useful for thedesign of a cruise control system. As we shall see in later chapters, the reason forthis is the inherent robustness of feedback systems: even ifthe model is not perfectlyaccurate, we can use it to design a controller and make use of the feedback in the

3.2. BICYCLE DYNAMICS 69
cancel
StandbyOff
Cruise
Hold
on
off
off
off
set
brake resume
Figure 3.4: Finite state machine for cruise control system. The figure on the left showssome typical buttons used to control the system. The controller can be in one of four modes,corresponding to the nodes in the diagram on the right. Transition between the modes iscontrolled by pressing one of the five buttons on the cruise control interface: on, off, set,resume or cancel.
controller to manage the uncertainty in the system.The cruise control system also has a human–machine interfacethat allows the
driver to communicate with the system. There are many different ways to implementthis system; one version is illustrated in Figure 3.4. The system has four buttons:on-off, set/decelerate, resume/accelerate and cancel. Theoperation of the systemis governed by a finite state machine that controls the modes ofthe PI controllerand the reference generator. Implementation of controllers and reference generatorswill be discussed more fully in Chapter 10.
The use of control in automotive systems goes well beyond the simple cruisecontrol system described here. Applications include emissions control, tractioncontrol, power control (especially in hybrid vehicles) andadaptive cruise control.Many automotive applications are discussed in detail in thebook by Kiencke andNielsen [KN00] and in the survey papers by Powers et al. [BP96, PN00].
3.2 Bicycle Dynamics
The bicycle is an interesting dynamical system with the feature that one of its keyproperties is due to a feedback mechanism that is created by the design of the frontfork. A detailed model of a bicycle is complex because the system has many degreesof freedom and the geometry is complicated. However, a greatdeal of insight canbe obtained from simple models.
To derive the equations of motion we assume that the bicycle rolls on the hor-izontal xy plane. Introduce a coordinate system that is fixed to the bicycle withthe ξ -axis through the contact points of the wheels with the ground, theη-axishorizontal and theζ -axis vertical, as shown in Figure 3.5. Letv0 be the velocity ofthe bicycle at the rear wheel,b the wheel base,ϕ the tilt angle andδ the steeringangle. The coordinate system rotates around the pointO with the angular veloc-ity ω = v0δ/b, and an observer fixed to the bicycle experiences forces due tothemotion of the coordinate system.
The tilting motion of the bicycle is similar to an inverted pendulum, as shown in

70 CHAPTER 3. EXAMPLES
ξ
η
ab
δ
O
C1 C2
(a) top view
η
ζ
h
ϕ
(b) rear view
λ
h
C1 C2
P1 P2 P3
(c) side view
Figure 3.5: Schematic views of a bicycle. The steering angle isδ, and the roll angle isϕ. Thecenter of mass has heighth and distancea from a vertical through the contact pointP1 of therear wheel. The wheel base isb, and the trail isc.
the rear view in Figure 3.5b. To model the tilt, consider the rigid body obtained whenthe wheels, the rider and the front fork assembly are fixed to the bicycle frame. Letm be the total mass of the system,J the moment of inertia of this body with respectto theξ -axis andD the product of inertia with respect to theξζ axes. Furthermore,let theξ andζ coordinates of the center of mass with respect to the rear wheelcontact point,P1, bea andh, respectively. We haveJ ≈ mh2 andD = mah. Thetorques acting on the system are due to gravity and centripetal action. Assumingthat the steering angleδ is small, the equation of motion becomes
Jd2ϕ
dt2−
Dv0
b
dδ
dt= mghsinϕ +
mv20h
bδ. (3.5)
The termmghsinϕ is the torque generated by gravity. The terms containingδ andits derivative are the torques generated by steering, with the term(Dv0/b) dδ/dtdue to inertial forces and the term(mv2
0h/b) δ due to centripetal forces.The steering angle is influenced by the torque the rider appliesto the handle
bar. Because of the tilt of the steering axis and the shape of the front fork, thecontact point of the front wheel with the roadP2 is behind the axis of rotation of thefront wheel assembly, as shown in Figure 3.5c. The distancec between the contactpoint of the front wheelP2 and the projection of the axis of rotation of the frontfork assemblyP3 is called thetrail . The steering properties of a bicycle dependcritically on the trail. A large trail increases stability but makes the steering lessagile.
A consequence of the design of the front fork is that the steering angleδ isinfluenced both by steering torqueT and by the tilt of the frameϕ. This meansthat a bicycle with a front fork is afeedback systemas illustrated by the blockdiagram in Figure 3.6. The steering angleδ influences the tilt angleϕ, and thetilt angle influences the steering angle, giving rise to the circular causality that ischaracteristic of reasoning about feedback. For a front fork with a positive trail, the

3.3. OPERATIONAL AMPLIFIER CIRCUITS 71
ϕFrontFork
Tδ
Frame
Figure 3.6: Block diagram of a bicycle with a front fork. The steering torque applied tothehandlebars isT , the roll angle isϕ and the steering angle isδ. Notice that the front forkcreates a feedback from the roll angleϕ to the steering angleδ that under certain conditionscan stabilize the system.
bicycle will steer into the lean, creating a centrifugal force that attempts to diminishthe lean. Under certain conditions, the feedback can actually stabilize the bicycle.A crude empirical model is obtained by assuming that the block B can be modeledas the static system
δ = k1T − k2ϕ. (3.6)
This model neglects the dynamics of the front fork, the tire–road interaction andthe fact that the parameters depend on the velocity. A more accurate model, calledtheWhipple model, is obtained using the rigid-body dynamics of the front forkandthe frame. Assuming small angles, this model becomes
M
ϕ
δ
+ Cv0
ϕ
δ
+ (K0 + K2v
20)
ϕ
δ
=
0T
, (3.7)
where the elements of the 2×2 matricesM , C, K0 andK2 depend on the geometryand the mass distribution of the bicycle. Note that this has aform somewhat similarto that of the spring–mass system introduced in Chapter 2 andthe balance system inExample 2.1. Even this more complex model is inaccurate because the interactionbetween the tire and the road is neglected; taking this into account requires twoadditional state variables. Again, the uncertainty lemon in Figure 2.15b provides aframework for understanding the validity of the model underthese assumptions.
Interesting presentations on the development of the bicycle are given in thebooks by D. Wilson [Wil04] and Herlihy [Her04]. The model (3.7) was presentedin a paper by Whipple in 1899 [Whi99]. More details on bicyclemodeling are givenin the paper [ÅKL05], which has many references.
3.3 Operational Amplifier Circuits
An operational amplifier (op amp) is a modern implementation of Black’s feedbackamplifier. It is a universal component that is widely used for instrumentation, con-trol and communication. It is also a key element in analog computing. Schematicdiagrams of the operational amplifier are shown in Figure 3.7. The amplifier has oneinverting input (v−), one noninverting input (v+) and one output (vout). There arealso connections for the supply voltages,e− ande+, and a zero adjustment (offsetnull). A simple model is obtained by assuming that the input currentsi− andi+ are

72 CHAPTER 3. EXAMPLES
e−
NC
e+output
offset null
offset null
inverting input
non-inv. input
(a) Chip pinout
voutv−
v+e−
e+i+
i−
(b) Full schematic
−
v+
v− vout
+
(c) Simple view
Figure 3.7: An operational amplifier and two schematic diagrams. (a) The amplifier pinconnections on an integrated circuit chip. (b) A schematic with all connections. (c) Only thesignal connections.
zero and that the output is given by the static relation
vout = sat(vmin,vmax)
(
k(v+ − v−))
, (3.8)
where sat denotes the saturation function
sat(a,b)(x) =
a if x < a
x if a ≤ x ≤ b
b if x > b.
(3.9)
We assume that the gaink is large, in the range of 106–108, and the voltagesvmin
andvmax satisfye− ≤ vmin < vmax ≤ e+
and hence are in the range of the supply voltages. More accurate models are obtainedby replacing the saturation function with a smooth functionas shown in Figure 3.8.For small input signals the amplifier characteristic (3.8) islinear:
vout = k(v+ − v−) =: −kv. (3.10)
Since the open loop gaink is very large, the range of input signals where the systemis linear is very small.
vmin
vout
v+ − v−
vmax
Figure 3.8: Input/output characteristics of an operational amplifier. The differential input isgiven byv+ − v−. The output voltage is a linear function of the input in a small range around0, with saturation atvmin andvmax. In the linear regime the op amp has high gain.

3.3. OPERATIONAL AMPLIFIER CIRCUITS 73
v −
+v1
v2
R1 R2
i0
replacements
(a) Amplifier circuit
v2R1
R1 + R2
e vR2
R1
v1−k6
(b) Block diagram
Figure 3.9: Stable amplifier using an op amp. The circuit (a) uses negative feedback aroundan operational amplifier and has a corresponding block diagram (b). The resistorsR1 andR2
determine the gain of the amplifier.
A simple amplifier is obtained by arranging feedback around the basic opera-tional amplifier as shown in Figure 3.9a. To model the feedback amplifier in thelinear range, we assume that the currenti0 = i− + i+ is zero and that the gain ofthe amplifier is so large that the voltagev = v− − v+ is also zero. It follows fromOhm’s law that the currents through resistorsR1 andR2 are given by
v1
R1= −
v2
R2,
and hence the closed loop gain of the amplifier is
v2
v1= −kcl, where kcl =
R2
R1. (3.11)
A more accurate model is obtained by continuing to neglect the currenti0 butassuming that the voltagev is small but not negligible. The current balance is then
v1 − v
R1=
v − v2
R2. (3.12)
Assuming that the amplifier operates in the linear range and using equation (3.10),the gain of the closed loop system becomes
kcl = −v2
v1=
R2
R1
k R1
R1 + R2 + k R1(3.13)
If the open loop gaink of the operational amplifier is large, the closed loop gainkcl is the same as in the simple model given by equation (3.11). Notice that theclosed loop gain depends only on the passive components and that variations inkhave only a marginal effect on the closed loop gain. For example if k = 106 andR2/R1 = 100, a variation ofk by 100% gives only a variation of 0.01% in the closedloop gain. The drastic reduction in sensitivity is a nice illustration of how feedbackcan be used to make precise systems from uncertain components. In this particularcase, feedback is used to trade high gain and low robustness for low gain and highrobustness. Equation (3.13) was the formula that inspired Black when he inventedthe feedback amplifier [Bla34] (see the quote at the beginningof Chapter 12).
It is instructive to develop a block diagram for the feedbackamplifier in Fig-ure 3.9a. To do this we will represent the pure amplifier with inputv and outputv2

74 CHAPTER 3. EXAMPLES
v −
+v1
v2
R1 R C2
i0
Figure 3.10: Circuit diagram of a PI controller obtained by feedback around an operationalamplifier. The capacitorC is used to store charge and represents the integral of the input.
as one block. To complete the block diagram, we must describehowv depends onv1 andv2. Solving equation (3.12) forv gives
v =R2
R1 + R2v1 +
R1
R1 + R2v2 =
R1
R1 + R2
(R2
R1v1 + v2
)
,
and we obtain the block diagram shown in Figure 3.9b. The diagram clearly showsthat the system has feedback and that the gain fromv2 to v is R1/(R1 + R2), whichcan also be read from the circuit diagram in Figure 3.9a. If theloop is stable andthe gain of the amplifier is large, it follows that the errore is small, and we find thatv2 = −(R2/R1)v1. Notice that the resistorR1 appears in two blocks in the blockdiagram. This situation is typical in electrical circuits, and it is one reason whyblock diagrams are not always well suited for some types of physical modeling.
The simple model of the amplifier given by equation (3.10) provides qualitativeinsight, but it neglects the fact that the amplifier is a dynamical system. A morerealistic model is
dvout
dt= −avout − bv. (3.14)
The parameterb that has dimensions of frequency and is called thegain-bandwidthproductof the amplifier. Whether a more complicated model is used depends onthe questions to be answered and the required size of the uncertainty lemon. Themodel (3.14) is still not valid for very high or very low frequencies since driftcauses deviations at low frequencies and there are additional dynamics that appearat frequencies close tob. The model is also not valid for large signals—an upperlimit is given by the voltage of the power supply, typically in the range of 5–10 V—neither is it valid for very low signals because of electrical noise. These effects canbe added, if needed, but increase the complexity of the analysis.
The operational amplifier is very versatile, and many different systems can bebuilt by combining it with resistors and capacitors. In fact, any linear system canbe implemented by combining operational amplifiers with resistors and capacitors.Exercise 21 shows how a second-order oscillator is implemented, and Figure 3.10shows the circuit diagram for an analog proportional-integral controller. To developa simple model for the circuit we assume that the currenti0 is zero and that the openloop gaink is so large that the input voltagev is negligible. The currenti throughthe capacitor isi = Cdvc/dt, wherevc is the voltage across the capacitor. Since
3.4. COMPUTING SYSTEMS AND NETWORKS 75
the same current goes through the resistorR1, we get
i =v1
R1= C
dvc
dt,
which implies that
vc(t) =1
C
∫
i (t) dt =1
R1C
∫ t
0v1(τ )dτ.
The output voltage is thus given by
v2(t) = −R2i − vc = −R2
R1v1(t) −
1
R1C
∫ t
0v1(τ )dτ,
which is the input/output relation for a PI controller.
The development of operational amplifiers was pioneered by Philbrick [Lun05,Phi48], and their usage is described in many textbooks (e.g.,[CD75]). Good infor-mation is also available from suppliers [Jun02, Man02].
3.4 Computing Systems and Networks
The application of feedback to computing systems follows thesame principles asthe control of physical systems, but the types of measurements and control inputsthat can be used are somewhat different. Measurements (sensors) are typicallyrelated to resource utilization in the computing system or network and can includequantities such as the processor load, memory usage or network bandwidth. Controlvariables (actuators) typically involve setting limits onthe resources available to aprocess. This might be done by controlling the amount of memory, disk space ortime that a process can consume, turning on or off processing, delaying availabilityof a resource or rejecting incoming requests to a server process. Process modelingfor networked computing systems is also challenging, and empirical models basedon measurements are often used when a first-principles model is not available.
Web Server Control
Web servers respond to requests from the Internet and provide information in theform of web pages. Modern web servers start multiple processes to respond torequests, with each process assigned to a single source until no further requests arereceived from that source for a predefined period of time. Processes that are idlebecome part of a pool that can be used to respond to new requests. To provide afast response to web requests, it is important that the web server processes do notoverload the server’s computational capabilities or exhaust its memory. Since otherprocesses may be running on the server, the amount of available processing powerand memory is uncertain, and feedback can be used to provide good performancein the presence of this uncertainty.

76 CHAPTER 3. EXAMPLES
Idle
Busy
Client Servers
dataoutgoing
queueaccept
requestsincoming
−1
Wait
Memory usage
KeepAlive
MaxClients
Processor load
Control
Ref
−1
Figure 3.11: Feedback control of a web server. Connection requests arrive on an input queue,where they are sent to a server process. A finite state machine keeps track of the state of theindividual server processes and responds to requests. A control algorithm can modify theserver’s operation by controlling parameters that affect its behavior,such as the maximumnumber of requests that can be serviced at a single time (MaxClients) or the amount oftime that a connection can remain idle before it is dropped (KeepAlive).
Figure 3.11 illustrates the use of feedback to modulate the operation of anApache web server. The web server operates by placing incoming connection re-quests on a queue and then starting a subprocess to handle requests for each acceptedconnection. This subprocess responds to requests from a given connection as theycome in, alternating between aBusy state and aWait state. (Keeping the sub-process active between requests is known as thepersistenceof the connection andprovides a substantial reduction in latency to requests formultiple pieces of infor-mation from a single site.) If no requests are received for a sufficiently long periodof time, controlled by theKeepAlive parameter, then the connection is droppedand the subprocess enters anIdle state, where it can be assigned another connec-tion. A maximum ofMaxClients simultaneous requests will be served, with theremainder remaining on the incoming request queue.
The parameters that control the server represent a trade-offbetween perfor-mance (how quickly requests receive a response) and resource usage (the amountof processing power and memory used by the server). Increasing theMaxClientsparameter allows connection requests to be pulled off of thequeue more quicklybut increases the amount of processing power and memory usage that is required.Increasing theKeepAlive timeout means that individual connections can remainidle for a longer period of time, which decreases the processing load on the machinebut increases the size of the queue (and hence the amount of time required for a userto initiate a connection). Successful operation of a busy server requires a properchoice of these parameters, often based on trial and error.
To model the dynamics of this system in more detail, we createa discrete-timemodel with states given by the average processor loadxcpu and the percentagememory usagexmem. The inputs to the system are taken as the maximum numberof clientsumc and the keep-alive timeuka. If we assume a linear model around the

3.4. COMPUTING SYSTEMS AND NETWORKS 77
equilibrium point, the dynamics can be written as
xcpu[k + 1]xmem[k + 1]
=
A11 A12
A21 A22
xcpu[k]xmem[k]
+
B11 B12
B21 B22
uka[k]umc[k]
, (3.15)
where the coefficients of theAandB matrices can be determined based on empiricalmeasurements or detailed modeling of the web server’s processing and memoryusage. Using system identification, Diao et al. [DGH+02, HDPT04] identified thelinearized dynamics as
A =
0.54 −0.11−0.026 0.63
, B =
−85 4.4−2.5 2.8
× 10−4,
where the system was linearized about the equilibrium point
xcpu = 0.58, uka = 11 s, xmem = 0.55, umc = 600.
This model shows the basic characteristics that were described above. Lookingfirst at theB matrix, we see that increasing theKeepAlive timeout (first columnof the B matrix) decreases both the processor usage and the memory usage sincethere is more persistence in connections and hence the server spends a longer timewaiting for a connection to close rather than taking on a new active connection. TheMaxClientsconnection increases both the processing and memory requirements.Note that the largest effect on the processor load is theKeepAlive timeout.The A matrix tells us how the processor and memory usage evolve in aregion ofthe state space near the equilibrium point. The diagonal terms describe how theindividual resources return to equilibrium after a transient increase or decrease.The off-diagonal terms show that there is coupling between the two resources, sothat a change in one could cause a later change in the other.
Although this model is very simple, we will see in later examples that it canbe used to modify the parameters controlling the server in real time and providerobustness with respect to uncertainties in the load on the machine. Similar types ofmechanisms have been used for other types of servers. It is important to rememberthe assumptions on the model and their role in determining when the model is valid.In particular, since we have chosen to use average quantities over a given sampletime, the model will not provide an accurate representationfor high-frequencyphenomena.
Congestion Control
The Internet was created to obtain a large, highly decentralized, efficient and ex-pandable communication system. The system consists of a large number of inter-connected gateways. A message is split into several packetswhich are transmittedover different paths in the network, and the packages are rejoined to recover themessage at the receiver. An acknowledgment (“ack”) messageis sent back to thesender when a packet is received. The operation of the system is governed by asimple but powerful decentralized control structure that has evolved over time.

78 CHAPTER 3. EXAMPLES
Sources
Sou
rces
Router RouterLink
Receiver
ack
Link
Link
(a) Block diagram
10−2
100
102
104
0
0.2
0.4
0.6
0.8
1
1/(2ρ2N2) (log scale)
ρb e
(b) Operating point
Figure 3.12: Internet congestion control. (a) Source computers send information torouters,which forward the information to other routers that eventually connect to the receiving com-puter. When a packet is received, an acknowledgment packet is sent back through the routers(not shown). The routers buffer information received from the sources and send the dataacross the outgoing link. (b) The equilibrium buffer sizebe for a set ofN identical computerssending packets through a single router with drop probabilityρ.
The system has two control mechanisms calledprotocols: the TransmissionControl Protocol (TCP) for end-to-end network communication and the InternetProtocol (IP) for routing packets and for host-to-gateway or gateway-to-gatewaycommunication. The current protocols evolved after some spectacular congestioncollapses occurred in the mid 1980s, when throughput unexpectedly could drop bya factor of 1000 [Jac95]. The control mechanism in TCP is based on conservingthe number of packets in the loop from the sender to the receiver and back to thesender. The sending rate is increased exponentially when there is no congestion,and it is dropped to a low level when there is congestion.
To derive an overall model for congestion control, we model three separateelements of the system: the rate at which packets are sent by individual sources(computers), the dynamics of the queues in the links (routers) and the admissioncontrol mechanism for the queues. Figure 3.12a is a block diagram of the system.
The current source control mechanism on the Internet is a protocol knownas TCP/Reno [LPD02]. This protocol operates by sending packets toa receiverand waiting to receive an acknowledgment from the receiver that the packet hasarrived. If no acknowledgment is sent within a certain timeout period, the packetis retransmitted. To avoid waiting for the acknowledgment before sending the nextpacket, Reno transmits multiple packets up to a fixedwindow around the latestpacket that has been acknowledged. If the window length is chosen properly, packetsat the beginning of the window will be acknowledged before the source transmitspackets at the end of the window, allowing the computer to continuously streampackets at a high rate.
To determine the size of the window to use, TCP/Reno uses a feedback mech-anism in which (roughly speaking) the window size is increased by 1 every time apacket is acknowledged and the window size is cut in half whenpackets are lost.This mechanism allows a dynamic adjustment of the window sizein which each

3.4. COMPUTING SYSTEMS AND NETWORKS 79
computer acts in a greedy fashion as long as packets are beingdelivered but backsoff quickly when congestion occurs.
A model for the behavior of the source can be developed by describing thedynamics of the window size. Suppose we haveN computers and letwi be thecurrent window size (measured in number of packets) for thei th computer. Letqi represent the end-to-end probability that a packet will be dropped someplacebetween the source and the receiver. We can model the dynamics of the windowsize by the differential equation
dwi
dt= (1 − qi )
r i (t − τi )
wi+ qi (−
wi
2r i (t − τi )), r i =
wi
τi, (3.16)
whereτi is the end-to-end transmission time for a packet to reach is destination andthe acknowledgment to be sent back andr i is the resulting rate at which packetsare cleared from the list of packets that have been received.The first term in thedynamics represents the increase in window size when a packet is received, and thesecond term represents the decrease in window size when a packet is lost. Noticethatr i is evaluated at timet −τi , representing the time required to receive additionalacknowledgments.
The link dynamics are controlled by the dynamics of the routerqueue and theadmission control mechanism for the queue. Assume that we have L links in thenetwork and usel to index the individual links. We model the queue in terms of thecurrent number of packets in the router’s bufferbl and assume that the router cancontain a maximum ofbl ,max packets and transmits packets at a ratecl , equal to thecapacity of the link. The buffer dynamics can then be written as
dbl
dt= sl − cl , sl =
∑
{i : l∈L i }
r i (t − τf
li ), (3.17)
whereL i is the set of links that are being used by sourcei , τ fli is the time it takes a
packet from sourcei to reach linkl andsl is the total rate at which packets arriveat link l .
The admission control mechanism determines whether a given packet is ac-cepted by a router. Since our model is based on the average quantities in the networkand not the individual packets, one simple model is to assumethat the probabilitythat a packet is dropped depends on how full the buffer is:pl = ml (bl , bmax). Forsimplicity, we will assume for now thatpl = ρl bl (see Exercise 22 for a moredetailed model). The probability that a packet is dropped at agiven link can be usedto determine the end-to-end probability that a packet is lost in transmission:
qi = 1 −∏
l∈L i
(1 − pl ) ≈∑
l∈L i
pl (t − τ bli ), (3.18)
whereτ bli is the backward delay from linkl to sourcei and the approximation is
valid as long as the individual drop probabilities are small. We use the backwarddelay since this represents the time required for the acknowledgment packet to bereceived by the source.

80 CHAPTER 3. EXAMPLES
Together, equations (3.16), (3.17) and (3.18) represent a model of congestioncontrol dynamics. We can obtain substantial insight by considering a special casein which we haveN identical sources and 1 link. In addition, we assume for themoment that the forward and backward time delays can be ignored, in which casethe dynamics can be reduced to the form
dwi
dt=
1
τ−
ρc(2 + w2i )
2,
db
dt=
N∑
i =1
wi
τ− c, τ =
b
c, (3.19)
wherewi ∈ R, i = 1, . . . , N, are the window sizes for the sources of data,b ∈ R isthe current buffer size of the router,ρ controls the rate at which packets are droppedandc is the capacity of the link connecting the router to the computers. The variableτ represents the amount of time required for a packet to be processed by a router,based on the size of the buffer and the capacity of the link. Substitutingτ into theequations, we write the state space dynamics as
dwi
dt=
c
b− ρc
(
1 +w2
i
2
)
,db
dt=
N∑
i =1
cwi
b− c. (3.20)
More sophisticated models can be found in [HMTG00, LPD02].The nominal operating point for the system can be found by settingwi = b = 0:
0 =c
b− ρc
(
1 +w2
i
2
)
, 0 =
N∑
i =1
cwi
b− c.
Exploiting the fact that all of the source dynamics are identical, it follows that allof thewi should be the same, and it can be shown that there is a unique equilibriumsatisfying the equations
wi,e =be
N=
cτe
N,
1
2ρ2N2(ρbe)
3 + (ρbe) − 1 = 0. (3.21)
The solution for the second equation is a bit messy but can easily be determined nu-merically. A plot of its solution as a function of 1/(2ρ2N2) is shown in Figure 3.12b.We also note that at equilibrium we have the following additional equalities:
τe =be
c=
Nwe
c, qe = N pe = Nρbe, re =
we
τe. (3.22)
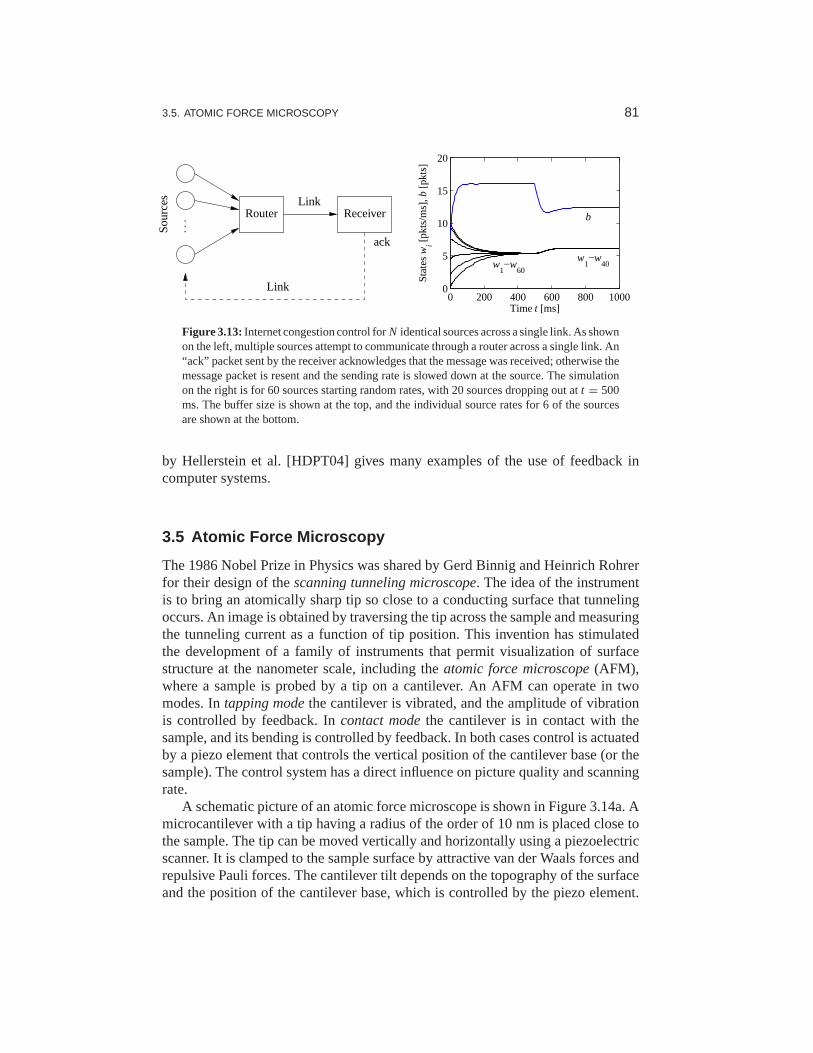
Figure 3.13 shows a simulation of 60 sources communicating across a singlelink, with 20 sources dropping out att = 500 ms and the remaining sources in-creasing their rates (window sizes) to compensate. Note that the buffer size andwindow sizes automatically adjust to match the capacity of the link.
A comprehensive treatment of computer networks is given in the textbook byTannenbaum [Tan96]. A good presentation of the ideas behindthe control prin-ciples for the Internet is given by one of its designers, Van Jacobson, in [Jac95].F. Kelly [Kel85] presents an early effort on the analysis of the system. The book
3.5. ATOMIC FORCE MICROSCOPY 81
Router
Sou
rces
...
Link
Link
ack
Receiver
0 200 400 600 800 10000
5
10
15
20
Time t [ms]
Sta
tes w
i [pkt
s/m
s], b
[pkt
s]
b
w1−w
60
w1−w
40
Figure 3.13: Internet congestion control forN identical sources across a single link. As shownon the left, multiple sources attempt to communicate through a router acrossa single link. An“ack” packet sent by the receiver acknowledges that the message was received; otherwise themessage packet is resent and the sending rate is slowed down at the source. The simulationon the right is for 60 sources starting random rates, with 20 sources dropping out att = 500ms. The buffer size is shown at the top, and the individual source ratesfor 6 of the sourcesare shown at the bottom.
by Hellerstein et al. [HDPT04] gives many examples of the use offeedback incomputer systems.
3.5 Atomic Force Microscopy
The 1986 Nobel Prize in Physics was shared by Gerd Binnig and Heinrich Rohrerfor their design of thescanning tunneling microscope. The idea of the instrumentis to bring an atomically sharp tip so close to a conducting surface that tunnelingoccurs. An image is obtained by traversing the tip across thesample and measuringthe tunneling current as a function of tip position. This invention has stimulatedthe development of a family of instruments that permit visualization of surfacestructure at the nanometer scale, including theatomic force microscope(AFM),where a sample is probed by a tip on a cantilever. An AFM can operate in twomodes. Intapping modethe cantilever is vibrated, and the amplitude of vibrationis controlled by feedback. Incontact modethe cantilever is in contact with thesample, and its bending is controlled by feedback. In both cases control is actuatedby a piezo element that controls the vertical position of thecantilever base (or thesample). The control system has a direct influence on picture quality and scanningrate.
A schematic picture of an atomic force microscope is shown inFigure 3.14a. Amicrocantilever with a tip having a radius of the order of 10 nm is placed close tothe sample. The tip can be moved vertically and horizontally using a piezoelectricscanner. It is clamped to the sample surface by attractive van der Waals forces andrepulsive Pauli forces. The cantilever tilt depends on the topography of the surfaceand the position of the cantilever base, which is controlledby the piezo element.

82 CHAPTER 3. EXAMPLES
Amplifier Amplifier
Sample
Cantilever
x,y z
LaserPhotodiode
Controller
Piezodrive
Deflection reference
Sweepgenerator
(a) Schematic diagram (b) AFM image of DNA
Figure 3.14: Atomic force microscope. (a) A schematic diagram of an atomic force micro-scope, consisting of a piezo drive that scans the sample under the AFM tip. A laser reflects offof the cantilever and is used to measure the detection of the tip through a feedback controller.(b) An AFM image of strands of DNA. (Image courtesy Veeco Instruments.)
The tilt is measured by sensing the deflection of the laser beam using a photodiode.The signal from the photodiode is amplified and sent to a controller that drivesthe amplifier for the vertical position of the cantilever. By controlling the piezoelement so that the deflection of the cantilever is constant, the signal driving thevertical deflection of the piezo element is a measure of the atomic forces betweenthe cantilever tip and the atoms of the sample. An image of thesurface is obtainedby scanning the cantilever along the sample. The resolution makes it possible tosee the structure of the sample on the atomic scale, as illustrated in Figure 3.14b,which shows an AFM image of DNA.
The horizontal motion of an AFM is typically modeled as a spring–mass systemwith low damping. The vertical motion is more complicated. Tomodel the system,we start with the block diagram shown in Figure 3.15. Signals that are easily acces-sible are the input voltageu to the power amplifier that drives the piezo element,the voltagev applied to the piezo element and the output voltagey of the signal
v
Cantilever
ComputerDA
u AD
ϕ
y
z
Deflection reference
amplifierSignal
photodiodeLaser &
Sample topography
amplifierPower
elementPiezo
Figure 3.15: Block diagram of the system for vertical positioning of the cantilever for anatomic force microscope in contact mode. The control system attempts to keep the can-tilever deflection equal to its reference value. Cantilever deflection is measured, amplifiedand converted to a digital signal, then compared with its reference value. Acorrecting signal isgenerated by the computer, converted to analog form, amplified and sent to the piezo element.
3.5. ATOMIC FORCE MICROSCOPY 83
u
y
Vp
(a) Step response
Piezo crystal
z1 z2
m1
m2
(b) Mechanical model
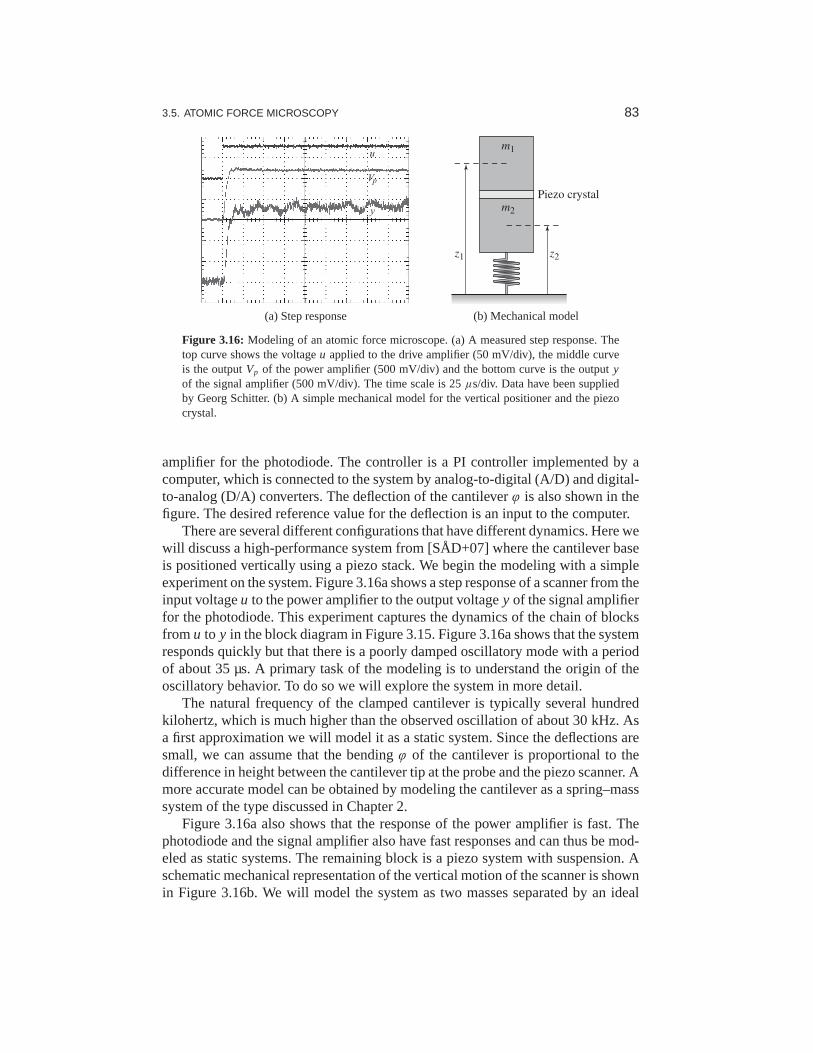
Figure 3.16: Modeling of an atomic force microscope. (a) A measured step response. Thetop curve shows the voltageu applied to the drive amplifier (50 mV/div), the middle curveis the outputVp of the power amplifier (500 mV/div) and the bottom curve is the outputyof the signal amplifier (500 mV/div). The time scale is 25µs/div. Data have been suppliedby Georg Schitter. (b) A simple mechanical model for the vertical positioner and the piezocrystal.
amplifier for the photodiode. The controller is a PI controller implemented by acomputer, which is connected to the system by analog-to-digital (A/D) and digital-to-analog (D/A) converters. The deflection of the cantileverϕ is also shown in thefigure. The desired reference value for the deflection is an inputto the computer.
There are several different configurations that have different dynamics. Here wewill discuss a high-performance system from [SÅD+07] where the cantilever baseis positioned vertically using a piezo stack. We begin the modeling with a simpleexperiment on the system. Figure 3.16a shows a step response of a scanner from theinput voltageu to the power amplifier to the output voltagey of the signal amplifierfor the photodiode. This experiment captures the dynamics ofthe chain of blocksfrom u to y in the block diagram in Figure 3.15. Figure 3.16a shows that thesystemresponds quickly but that there is a poorly damped oscillatory mode with a periodof about 35 µs. A primary task of the modeling is to understandthe origin of theoscillatory behavior. To do so we will explore the system in more detail.
The natural frequency of the clamped cantilever is typicallyseveral hundredkilohertz, which is much higher than the observed oscillation of about 30 kHz. Asa first approximation we will model it as a static system. Since the deflections aresmall, we can assume that the bendingϕ of the cantilever is proportional to thedifference in height between the cantilever tip at the probeand the piezo scanner. Amore accurate model can be obtained by modeling the cantilever as a spring–masssystem of the type discussed in Chapter 2.
Figure 3.16a also shows that the response of the power amplifieris fast. Thephotodiode and the signal amplifier also have fast responses and can thus be mod-eled as static systems. The remaining block is a piezo system with suspension. Aschematic mechanical representation of the vertical motion of the scanner is shownin Figure 3.16b. We will model the system as two masses separated by an ideal
84 CHAPTER 3. EXAMPLES
piezo element. The massm1 is half of the piezo system, and the massm2 is theother half of the piezo system plus the mass of the support.
A simple model is obtained by assuming that the piezo crystalgenerates a forceF between the masses and that there is a dampingc in the spring. Let the positionsof the center of the masses bez1 andz2. A momentum balance gives the followingmodel for the system:
m1d2z1
dt2= F, m2
d2z2
dt2= −c2
dz2
dt− k2z2 − F.
Let the elongation of the piezo elementl = z1 − z2 be the control variable andthe heightz1 of the cantilever base be the output. Eliminating the variable F inequations (3.23) and substitutingz1 − l for z2 gives the model
(m1 + m2)d2z1
dt2+ c2
dz1
dt+ k2z1 = m2 f racd2ldt2 + c2
dl
dt+ k2l . (3.23)
Summarizing, we find that a simple model of the system is obtained by modelingthe piezo by (3.23) and all the other blocks by static models.Introducing the linearequationsl = k3u andy = k4z1, we now have a complete model relating the outputy to the control signalu. A more accurate model can be obtained by introducing thedynamics of the cantilever and the power amplifier. As in the previous examples,the concept of the uncertainty lemon in Figure 2.15b providesa framework fordescribing the uncertainty: the model will be accurate up tothe frequencies of thefastest modeled modes and over a range of motion in which linearized stiffnessmodels can be used.
The experimental results in Figure 3.16a can be explained qualitatively as fol-lows. When a voltage is applied to the piezo, it expands byl0, the massm1 movesup and the massm2 moves down instantaneously. The system settles after a poorlydamped oscillation.
It is highly desirable to design a control system for the vertical motion so that itresponds quickly with little oscillation. The instrument designer has several choices:to accept the oscillation and have a slow response time, to design a control systemthat can damp the oscillations or to redesign the mechanics to give resonances ofhigher frequency. The last two alternatives give a faster response and faster imaging.
Since the dynamic behavior of the system changes with the properties of thesample, it is necessary to tune the feedback loop. In simple systems this is currentlydone manually by adjusting parameters of a PI controller. There are interestingpossibilities for making AFM systems easier to use by introducing automatic tuningand adaptation.
The book by Sarid [Sar91] gives a broad coverage of atomic force microscopes.The interaction of atoms close to surfaces is fundamental to solid state physics, seeKittel [Kit95]. The model discussed in this section is based on Schitter [Sch01].

3.6. DRUG ADMINISTRATION 85
Chemicalinactivation“fixation”
etc.Subcutis
etc.
Blood circulation
Tissue boundaries
Dose N0
k1 k4 k2 k3
k5
Figure 3.17: Abstraction used to compartmentalize the body for the purpose of describingdrug distribution (based on Teorell [Teo37]). The body is abstracted by a number of com-partments with perfect mixing, and the complex transport processes are approximated byassuming that the flow is proportional to the concentration differences in the compartments.The constantski parameterize the rates of flow between different compartments.
3.6 Drug Administration
The phrase “Take two pills three times a day” is a recommendation with which weare all familiar. Behind this recommendation is a solution of an open loop controlproblem. The key issue is to make sure that the concentration of a medicine ina part of the body is sufficiently high to be effective but not sohigh that it willcause undesirable side effects. The control action is quantized,take two pills, andsampled,every 8 hours. The prescriptions are based on simple models captured inempirical tables, and the dose is based on the age and weight of the patient.
Drug administration is a control problem. To solve it we mustunderstand howa drug spreads in the body after it is administered. This topic, calledpharmacoki-netics, is now a discipline of its own, and the models used are calledcompartmentmodels. They go back to the 1920s when Widmark modeled the propagation of alco-hol in the body [WT24]. Compartment models are now important for the screeningof all drugs used by humans. The schematic diagram in Figure 3.17 illustrates theidea of a compartment model. The body is viewed as a number of compartmentslike blood plasma, kidney, liver and tissues that are separated by membranes. It isassumed that there is perfect mixing so that the drug concentration is constant ineach compartment. The complex transport processes are approximated by assumingthat the flow rates between the compartments are proportionalto the concentrationdifferences in the compartments.
To describe the effect of a drug it is necessary to know both its concentrationand how it influences the body. The relation between concentration c and its effecte is typically nonlinear. A simple model is
e =c0
c0 + cemax. (3.24)
The effect is linear for low concentrations, and it saturatesat high concentrations.The relation can also be dynamic, and it is then calledpharmacodynamics.

86 CHAPTER 3. EXAMPLES
Compartment Models
The simplest dynamic model for drug administration is obtained by assuming thatthe drug is evenly distributed in a single compartment afterit has been administeredand that the drug is removed at a rate proportional to the concentration. The com-partments behave like stirred tanks with perfect mixing. Letc be the concentration,V the volume andq the outflow rate. Converting the description of the system intodifferential equations gives the model
Vdc
dt= −qc, c ≥ 0. (3.25)
This equation has the solutionc(t) = c0e−qt/V = c0e−kt, which shows that theconcentration decays exponentially with the time constantT = V/q after an injec-tion. The input is introduced implicitly as an initial condition in the model (3.25).More generally, the way the input enters the model depends onhow the drug isadministered. For example, the input can be represented as amass flow into thecompartment where the drug is injected. A pill that is dissolved can also be inter-preted as an input in terms of a mass flow rate.
The model (3.25) is called a aone-compartment modelor asingle-pool model.The parameterq/V is called the elimination rate constant. This simple model isoften used to model the concentration in the blood plasma. Bymeasuring the con-centration at a few times, the initial concentration can be obtained by extrapolation.If the total amount of injected substance is known, the volume V can then be de-termined asV = m/c0; this volume is called theapparent volume of distribution.This volume is larger than the real volume if the concentration in the plasma islower than in other parts of the body. The model (3.25) is very simple, and thereare large individual variations in the parameters. The parametersV andq are oftennormalized by dividing by the weight of the person. Typical parameters for aspirinareV = 0.2 L/kg andq = 0.01(L/h)/kg. These numbers can be compared witha blood volume of 0.07 L/kg, a plasma volume of 0.05 L/kg, an intracellular fluidvolume of 0.4 L/kg and an outflow of 0.0015 L/ min /kg.
The simple one-compartment model captures the gross behavior of drug distri-bution, but it is based on many simplifications. Improved models can be obtained byconsidering the body as composed of several compartments. Examples of such sys-tems are shown in Figure 3.18, where the compartments are represented as circlesand the flows by arrows.
Modeling will be illustrated using the two-compartment model in Figure 3.18a.We assume that there is perfect mixing in each compartment and that the transportbetween the compartments is driven by concentration differences. We further as-sume that a drug with concentrationc0 is injected in compartment 1 at a volumeflow rate ofu and that the concentration in compartment 2 is the output. Letc1 andc2 be the concentrations of the drug in the compartments and letV1 andV2 be the

3.6. DRUG ADMINISTRATION 87
k2
V1
k0
b0
u
V2
k1
(a) Two compartment model
u1
V4V6
k64
k46
V1V3
k31
k13
V5
k54
k45
u4
V2
k21
k12
k03
k06 k05
k02
b4
b1
(b) Thyroid hormone model
Figure 3.18: Schematic diagrams of compartment models. (a) A simple two-compartmentmodel. Each compartment is labeled by its volume, and arrows indicate the flow of chemicalinto, out of and between compartments. (b) A system with six compartmentsused to studythe metabolism of thyroid hormone [God83]. The notationki j denotes the transport fromcompartmentj to compartmenti .
volumes of the compartments. The mass balances for the compartments are
V1dc1
dt= q(c2 − c1) − q0c1 + c0u, c1 ≥ 0,
V2dc2
dt= q(c1 − c2), c2 ≥ 0,
y = c2.
(3.26)
Introducing the variablesk0 = q0/V1, k1 = q/V1, k2 = q/V2 andb0 = c0/V1 andusing matrix notation, the model can be written as
dc
dt=
−k0 − k1 k1
k2 −k2
c +
b0
0
u, y =
0 1
x. (3.27)
Comparing this model with its graphical representation in Figure 3.18a, we findthat the mathematical representation (3.27) can be writtenby inspection.
It should also be emphasized that simple compartment modelssuch as the one inequation (3.27) have a limited range of validity. Low-frequency limits exist becausethe human body changes with time, and since the compartment model uses averageconcentrations, they will not accurately represent rapid changes. There are alsononlinear effects that influence transportation between thecompartments.
Compartment models are widely used in medicine, engineering and environ-mental science. An interesting property of these systems isthat variables like con-centration and mass are always positive. An essential difficulty in compartmentmodeling is deciding how to divide a complex system into compartments. Com-partment models can also be nonlinear, as illustrated in thenext section.

88 CHAPTER 3. EXAMPLES
Liver
Largeintestine
Stomach
Pancreas
Smallintestine
(a) Relevant body organs
InsulinPancreas
Liver Tissue
Stomach Tissue
Glucose
Glucosein blood
(b) Schematic diagram
0 50 100 1500
200
400
Glu
cose
[mg/
dl]
0 50 100 1500
50
100
Time t [min]
Insu
lin [µ
U/m
l]
(c) Intravenous injection
Figure 3.19: Insulin–glucose dynamics. (a) Sketch of body parts involved in the control ofglucose. (b) Schematic diagram of the system. (c) Responses of insulinand glucose whenglucose in injected intravenously. From [PB86].
Insulin–glucose Dynamics
It is essential that the blood glucose concentration in the body is kept within anarrow range (0.7–1.1 g/L). Glucose concentration is influenced by many factorslike food intake, digestion and exercise. A schematic picture of the relevant partsof the body is shown in Figures 3.19a and b.
There is a sophisticated mechanism that regulates glucose concentration. Glu-cose concentration is maintained by the pancreas, which secretes the hormonesinsulin and glucagon. Glucagon is released into the bloodstream when the glucoselevel is low. It acts on cells in the liver that release glucose. Insulin is secreted whenthe glucose level is high, and the glucose level is lowered bycausing the liver andother cells to take up more glucose. In diseases like juvenile diabetes the pancreasis unable to produce insulin and the patient must inject insulin into the body tomaintain a proper glucose level.
The mechanisms that regulate glucose and insulin are complicated; dynamicswith time scales that range from seconds to hours have been observed. Models ofdifferent complexity have been developed. The models are typically tested with datafrom experiments where glucose is injected intravenously and insulin and glucoseconcentrations are measured at regular time intervals.
A relatively simple model called theminimal modelwas developed by Bergmanand coworkers [Ber89]. This models uses two compartments, one representing theconcentration of glucose in the bloodstream and the other representing the concen-tration of insulin in the interstitial fluid. Insulin in the bloodstream is considered aninput. The reaction of glucose to insulin can be modeled by theequations
dx1
dt= −(p1 + x2)x1 + p1ge,
dx2
dt= −p2x2 + p3(u − ie), (3.28)

3.7. POPULATION DYNAMICS 89
wherege andie represent the equilibrium values of glucose and insulin,x1 is theconcentration of glucose andx2 is proportional to the concentration of interstitialinsulin. Notice the presence of the termx2x1 in the first equation. Also noticethat the model does not capture the complete feedback loop because it does notdescribe how the pancreas reacts to the glucose. Figure 3.19cshows a fit of themodel to a test on a normal person where glucose was injected intravenously attime t = 0. The glucose concentration rises rapidly, and the pancreasrespondswith a rapid spikelike injection of insulin. The glucose and insulin levels thengradually approach the equilibrium values.
Models of the type in equation (3.28) and more complicated models having manycompartments have been developed and fitted to experimental data. A difficulty inmodeling is that there are significant variations in model parameters over time andfor different patients. For example, the parameterp1 in equation (3.28) has beenreported to vary with an order of magnitude for healthy individuals. The modelshave been used for diagnosis and to develop schemes for the treatment of personswith diseases. Attempts to develop a fully automatic artificial pancreas have beenhampered by the lack of reliable sensors.
The papers by Widmark and Tandberg [WT24] and Teorell [Teo37] are classicsin pharmacokinetics, which is now an established discipline with many textbooks[Dos68, Jac72, GP82]. Because of its medical importance, pharmacokinetics isnow an essential component of drug development. The book by Riggs [Rig63] is agood source for the modeling of physiological systems, and amore mathematicaltreatment is given in [KS01]. Compartment models are discussed in [God83]. Theproblem of determining rate coefficients from experimental data is discussed in[BÅ70] and [God83]. There are many publications on the insulin–glucose model.The minimal model is discussed in [CT84, Ber89] and more recentreferences are[MLK06, FCF+06].
3.7 Population Dynamics
Population growth is a complex dynamic process that involvesthe interaction of oneor more species with their environment and the larger ecosystem. The dynamics ofpopulation groups are interesting and important in many different areas of social andenvironmental policy. There are examples where new species have been introducedinto new habitats, sometimes with disastrous results. Therehave also been attemptsto control population growth both through incentives and through legislation. Inthis section we describe some of the models that can be used tounderstand howpopulations evolve with time and as a function of their environments.
Logistic Growth Model
Let x be the population of a species at timet . A simple model is to assume that thebirth rates and mortality rates are proportional to the total population. This gives

90 CHAPTER 3. EXAMPLES
the linear model
dx
dt= bx − dx = (b − d)x = r x, x ≥ 0, (3.29)
where birth rateb and mortality rated are parameters. The model gives an expo-nential increase ifb > d or an exponential decrease ifb < d. A more realisticmodel is to assume that the birth rate decreases when the population is large. Thefollowing modification of the model (3.29) has this property:
dx
dt= r x(1 −
x
k), x ≥ 0, (3.30)
wherek is thecarrying capacityof the environment. The model (3.30) is called thelogistic growth model.
Predator–Prey Models
A more sophisticated model of population dynamics includesthe effects of compet-ing populations, where one species may feed on another. This situation, referred toas thepredator–prey problem, was introduced in Example 2.3, where we developeda discrete-time model that captured some of the features of historical records oflynx and hare populations.
In this section, we replace the difference equation model used there with a moresophisticated differential equation model. LetH(t) represent the number of hares(prey) and letL(t) represent the number of lynxes (predator). The dynamics of thesystem are modeled as
d H
dt= r H
(
1 −H
k
)
−aH L
c + H, H ≥ 0,
dL
dt= b
aH L
c + H− dL, L ≥ 0.
(3.31)
In the first equation,r represents the growth rate of the hares,k represents themaximum population of the hares (in the absence of lynxes),a represents theinteraction term that describes how the hares are diminished as a function of thelynx population andc controls the prey consumption rate for low hare population.In the second equation,b represents the growth coefficient of the lynxes anddrepresents the mortality rate of the lynxes. Note that the hare dynamics include aterm that resembles the logistic growth model (3.30).
Of particular interest are the values at which the population values remain con-stant, calledequilibrium points. The equilibrium points for this system can bedetermined by setting the right-hand side of the above equations to zero. LettingHe andLe represent the equilibrium state, from the second equation we have
Le = 0 or H∗e =
cd
ab− d. (3.32)
Substituting this into the first equation, we have that forLe = 0 eitherHe = 0 or

EXERCISES 91
0 10 20 30 40 50 60 700
20
40
60
80
100
Time t [years]
Pop
ulat
ion
HareLynx
0 50 1000
20
40
60
80
100
Hares
Lynx
es
Figure 3.20: Simulation of the predator–prey system. The figure on the left shows a simulationof the two populations as a function of time. The figure on the right shows thepopulationsplotted against each other, starting from different values of the population. The oscillation seenin both figures is an example of alimit cycle. The parameter values used for the simulationsarea = 3.2, b = 0.6, c = 50,d = 0.56,k = 125 andr = 1.6.
He = k. For Le 6= 0, we obtain
L∗e =
r He(c + He)
aHe
(
1 −He
k
)
=bcr(abk− cd − dk)
(ab− d)2k. (3.33)
Thus, we have three possible equilibrium pointsxe = (Le, He):
xe =
00
, xe =
k0
, xe =
H∗e
L∗e
,
whereH∗e andL∗
e are given in equations (3.32) and (3.33). Note that the equilib-rium populations may be negative for some parameter values,corresponding to anonachievable equilibrium point.
Figure 3.20 shows a simulation of the dynamics starting from aset of popu-lation values near the nonzero equilibrium values. We see that for this choice ofparameters, the simulation predicts an oscillatory population count for each species,reminiscent of the data shown in Figure 2.6.
Volume I of the two-volume set by J. D. Murray [Mur04] give a broad coverageof population dynamics.
Exercises
17 (Cruise control) Consider the cruise control example described in Section 3.1.Build a simulation that re-creates the response to a hill shown in Figure 3.3b andshow the effects of increasing and decreasing the mass of thecar by 25%. Redesignthe controller (using trial and error is fine) so that it returns to within 1% of thedesired speed within 3 s of encountering the beginning of thehill.

92 CHAPTER 3. EXAMPLES
18 (Bicycle dynamics) Show that the dynamics of a bicycle frame given by equa-tion (3.5) can be approximated in state space form as
d
dt
x1
x2
=
0 1mgh/J 0
x1
x2
+
Dv0/(bJ)
mv20h/(bJ)
u,
y =
1 0
x,
where the inputu is the steering angleδ and the outputy is the tilt angleϕ. Whatdo the statesx1 andx2 represent?
19 (Bicycle steering) Combine the bicycle model given by equation (3.5) and themodel for steering kinematics in Example 2.8 to obtain a modelthat describes thepath of the center of mass of the bicycle.
20 (Operational amplifier circuit) Consider the op amp circuit shown below.
−
+v1 vo
v3
v2
RaR1
R2
C2
C1
Rb
Show that the dynamics can be written in state space form as
dx
dt=
−1
R1C1−
1
RaC10
Rb
Ra
1
R2C2−
1
R2C2
x +
1
R1C1
0
u, y =
0 1
x,
whereu = v1 andy = v3. (Hint: Usev2 andv3 as your state variables.)
21 (Operational amplifier oscillator) The op amp circuit shown below is an imple-mentation of an oscillator.
−
+
−
+
−
+ v1v3v2
R1R3R2
R4C2 C1
Show that the dynamics can be written in state space form as
dx
dt=
0R4
R1R3C1
−1
R2C20
x,
where the state variables represent the voltages across thecapacitorsx1 = v1 andx2 = v2.
EXERCISES 93
22 (Congestion control using RED [LPW+02]) A number of improvements canbe made to the model for Internet congestion control presented in Section 3.4.To ensure that the router’s buffer size remains positive, wecan modify the bufferdynamics to satisfy
dbl
dt=
{
sl − cl bl > 0
sat(0,∞)(sl − cl ) bl = 0.
In addition, we can model the drop probability of a packet based on how close weare to the buffer limits, a mechanism known as random early detection (RED):
pl = ml (al ) =
0 al (t) ≤ blowerl
ρl r i (t) − ρl blowerl blower
l < al (t) < bupperl
ηl r i (t) − (1 − 2bupperl ) bupper
l ≤ al (t) < 2bupperl
1 al (t) ≥ 2bupperl ,
dal
dt= −αl cl (al − bl ),
whereαl , bupperl , blower
l and pupperl are parameters for the RED protocol.
Using the model above, write a simulation for the system and find a set ofparameter values for which there is a stable equilibrium point and a set for whichthe system exhibits oscillatory solutions. The following sets of parameters shouldbe explored:
N = 20, 30, . . . , 60, blowerl = 40 pkts, ρl = 0.1,
c = 8, 9, . . . , 15 pkts/ms, bupperl = 540 pkts, αl = 10−4,
τ = 55, 60, . . . , 100 ms.
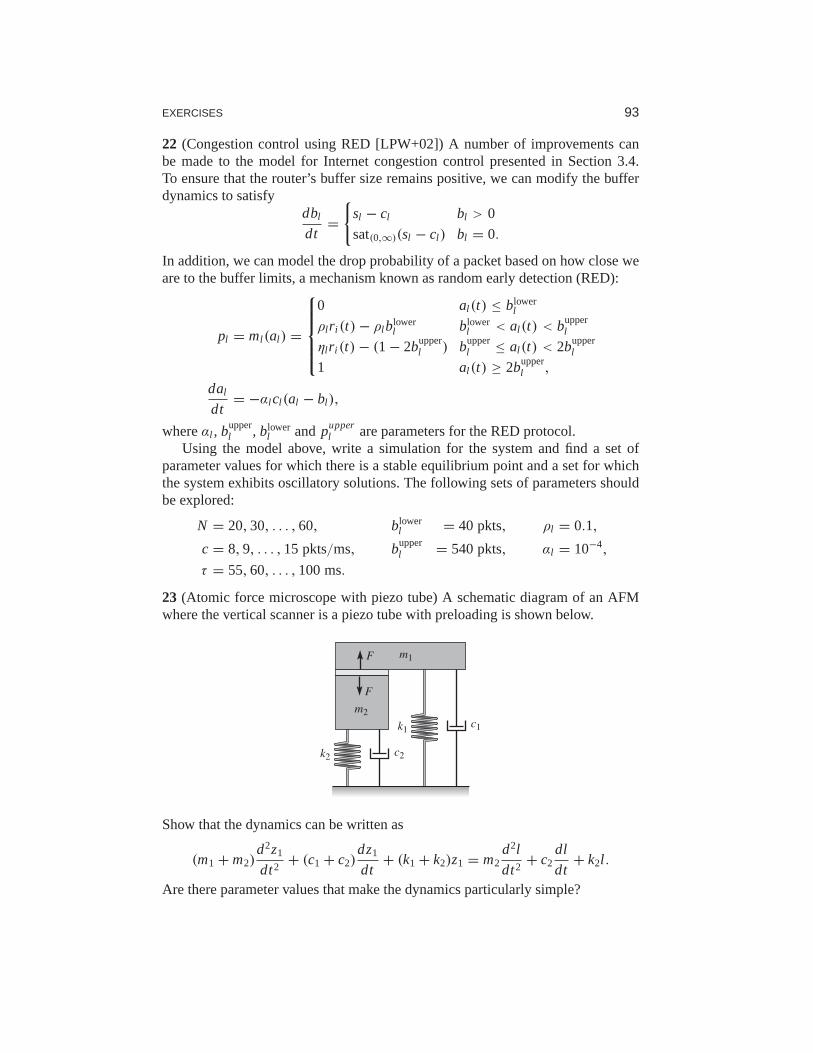
23 (Atomic force microscope with piezo tube) A schematic diagram of an AFMwhere the vertical scanner is a piezo tube with preloading isshown below.
m1
k1
m2
c1
k2 c2
F
F
Show that the dynamics can be written as
(m1 + m2)d2z1
dt2+ (c1 + c2)
dz1
dt+ (k1 + k2)z1 = m2
d2l
dt2+ c2
dl
dt+ k2l .
Are there parameter values that make the dynamics particularly simple?

94 CHAPTER 3. EXAMPLES
24 (Drug administration) The metabolism of alcohol in the body can be modeledby the nonlinear compartment model
Vbdcb
dt= q(cl − cb) + qi v , Vl
dcl
dt= q(cb − cl ) − qmax
cl
c0 + cl+ qgi ,
whereVb = 48 L andVl = 0.6 L are the apparent volumes of distribution ofbody water and liver water,cb andcl are the concentrations of alcohol in the com-partments,qi v andqgi are the injection rates for intravenous and gastrointestinalintake,q = 1.5 L/min is the total hepatic blood flow,qmax = 2.75 mmol/min andc0 = 0.1 mmol/L. Simulate the system and compute the concentrationin the bloodfor oral and intravenous doses of 12 g and 40 g of alcohol.
25 (Population dynamics) Consider the model for logistic growth given by equa-tion (3.30). Show that the maximum growth rate occurs when thesize of the pop-ulation is half of the steady-state value.
26 (Fisheries management) The dynamics of a commercial fishery canbe describedby the following simple model:
dx
dt= f (x) − h(x, u), y = bh(x, u) − cu
wherex is the total biomass,f (x) = r x(1− x/k) is the growth rate andh(x, u) =
axu is the harvesting rate. The outputy is the rate of revenue, and the parametersa,b andc are constants representing the price of fish and the cost of fishing. Show thatthere is an equilibrium where the steady-state biomass isxe = c/(ab). Comparewith the situation when the biomass is regulated to a constant value and find themaximum sustainable return in that case.