chapter twelve data processing, fundamental data analysis, and the statistical testing of...
TRANSCRIPT

Chapter Twelve
Data Processing, Fundamental Data Analysis, and the
Statistical Testing of Differences
Chapter Twelve
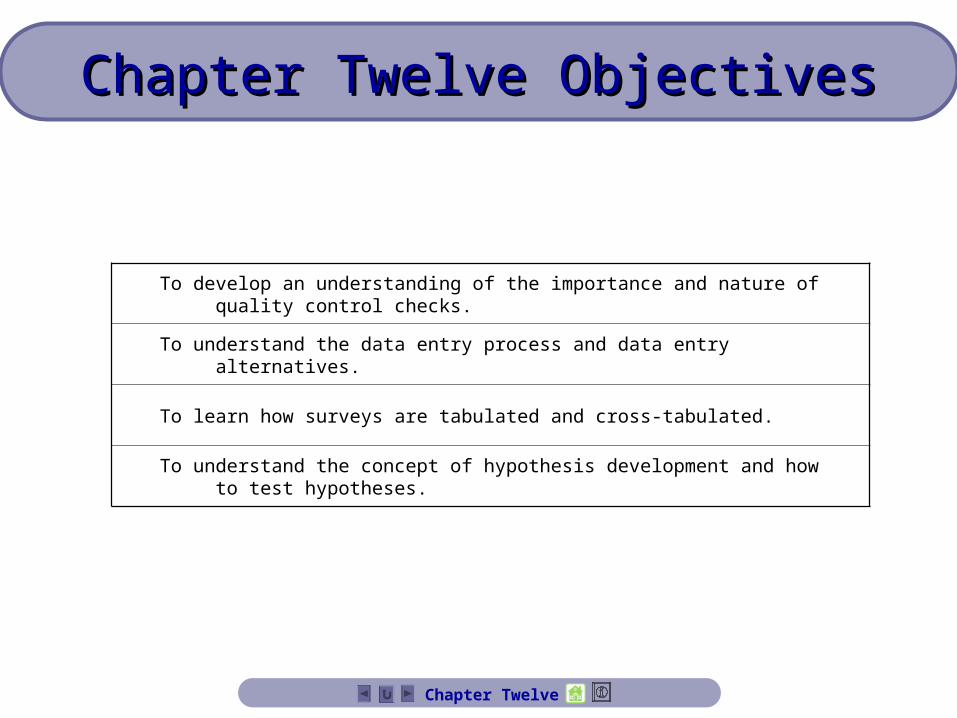
To develop an understanding of the importance and nature of quality control checks.
To understand the data entry process and data entry alternatives.
To learn how surveys are tabulated and cross-tabulated.
To understand the concept of hypothesis development and how to test hypotheses.
Chapter Twelve ObjectivesChapter Twelve Objectives
Chapter Twelve
Data Analysis Overview
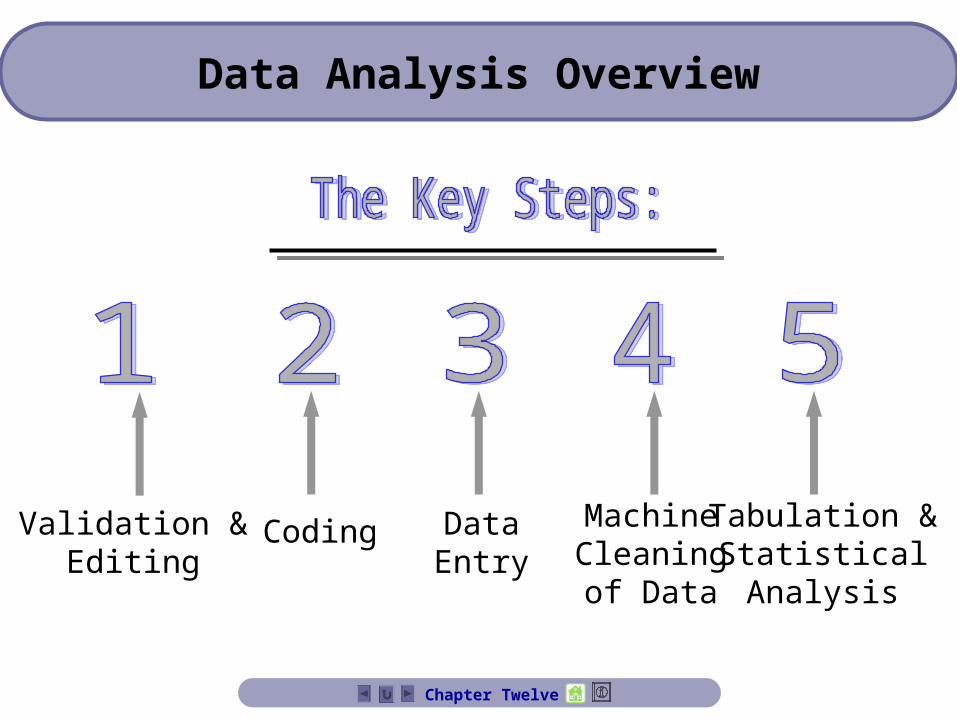
Validation &Editing
Coding MachineCleaningof Data
Tabulation &StatisticalAnalysis
DataEntry
Chapter Twelve
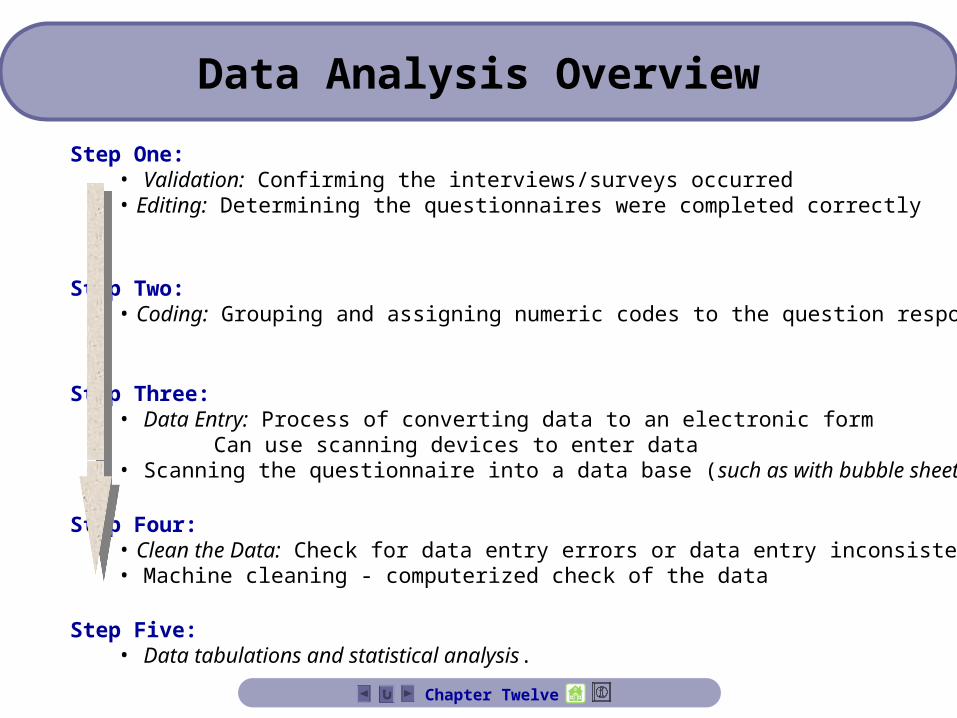
Step One:• Validation: Confirming the interviews/surveys occurred• Editing: Determining the questionnaires were completed correctly
Step Two:• Coding: Grouping and assigning numeric codes to the question responses.
Step Three:• Data Entry: Process of converting data to an electronic form
Can use scanning devices to enter data• Scanning the questionnaire into a data base (such as with bubble sheets)
Step Four:• Clean the Data: Check for data entry errors or data entry inconsistencies• Machine cleaning - computerized check of the data
Step Five:• Data tabulations and statistical analysis.
Data Analysis Overview
Chapter Twelve
Editing & Skip Patterns
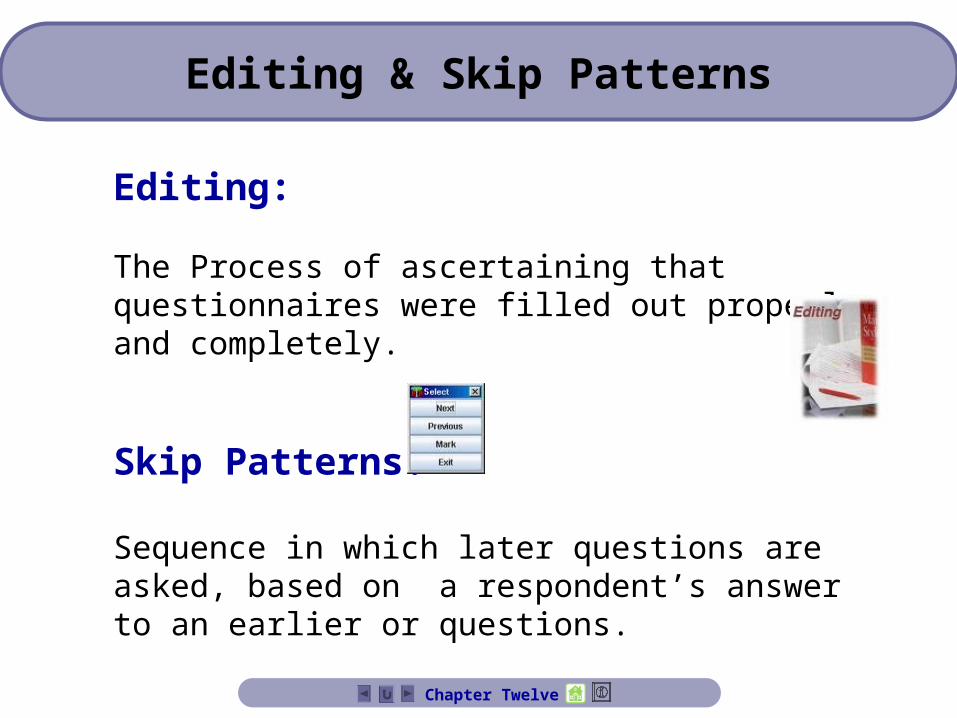
Editing:
The Process of ascertaining that questionnaires were filled out properly and completely.
Skip Patterns:
Sequence in which later questions are asked, based on a respondent’s answer to an earlier or questions.
Chapter Twelve
Coding
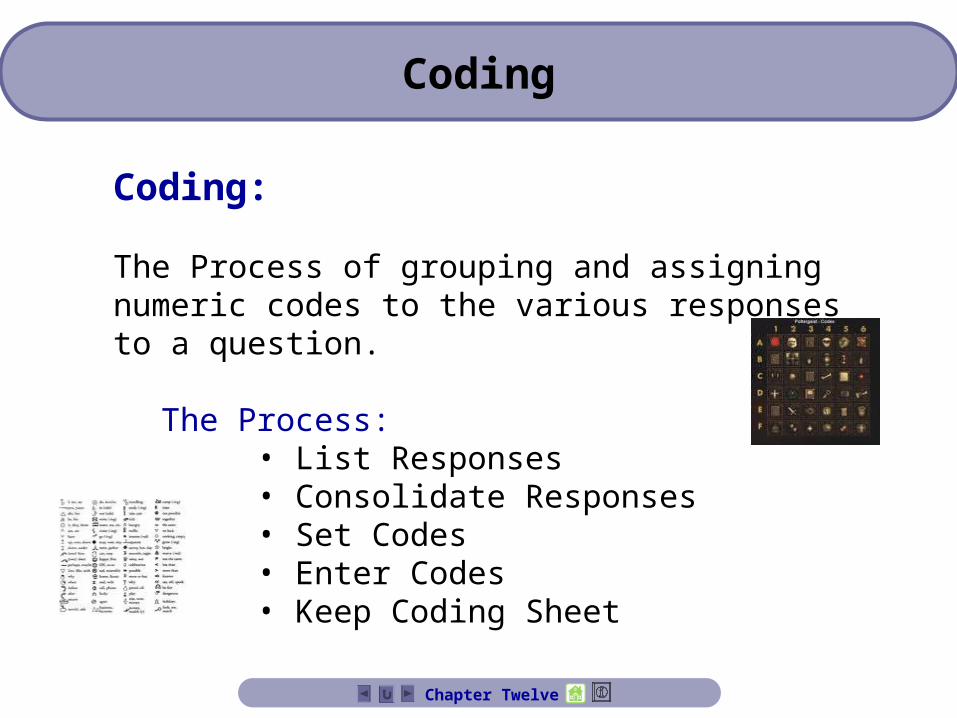
Coding:
The Process of grouping and assigning numeric codes to the various responses to a question.
The Process:• List Responses• Consolidate Responses• Set Codes• Enter Codes• Keep Coding Sheet
Chapter Twelve
Data Entry
Data Entry:
The Process of converting information to an electronic format.
Intelligent Data Entry:
A form of data entry in which the information being entered into the data entry device is checked for internal logic.
Chapter Twelve
Machine Cleaning of Data
Machine Cleaning of Data:
Final computer error check of data.
Error Checking Routines:
Computer programs that accept instructions from the user to check for logical errors in the data.
Marginal Report:
Computer-generated table of the frequencies of the responses to each question, used to monitor entry of valid codes and correct use of skip patterns.
Chapter Twelve

Examination of the responses to one question relative to the responses to one or more questions in a survey set.
Examination of the responses to one question relative to the responses to one or more questions in a survey set.
Race/Ethnicity (All)Are You a Veteran? YesYou Liked the Chamber's Services (All)
Count of Respondent GenderBusiness Category Female Male Grand TotalComputers/Technology 1 3 4Construction 1 1Manufacturing 5 5Other 3 2 5Professional 1 1Grand Total 9 7 16
Bi-variate cross-tabulation:• Cross tabulation two items - “Business Category” and “Gender”
Multi-variate cross-tabulation:• Additional filtering criteria - “Veteran Status” - Now filtering three items.
Are You a Veteran? (All)You Liked the Chamber's Services (All)Race/Ethnicity (All)
Count of Respondent GenderBusiness Category Female Male Grand TotalComputers/Technology 5 7 12Construction 2 4 6General Services 1 1Manufacturing 13 6 19No Response 1 4 5Other 15 11 26Professional 1 3 4Retail 4 4 8Wholesale 1 1 2#N/A 1 1Grand Total 42 42 84
Cross Tabulation Data
Chapter Twelve

One Way Frequency Tables
A table showing the number of respondents choosing each answer to a survey question.
A table showing the number of respondents choosing each answer to a survey question.
Did You Like the Movie?
43
7
0
2
4
6
8
Female
No
Yes
Grand Total
Did You Like the Movie?
43
7
0
2
4
6
8
Female
No
Yes
Grand Total
Graphic Representations of Data
Chapter Twelve
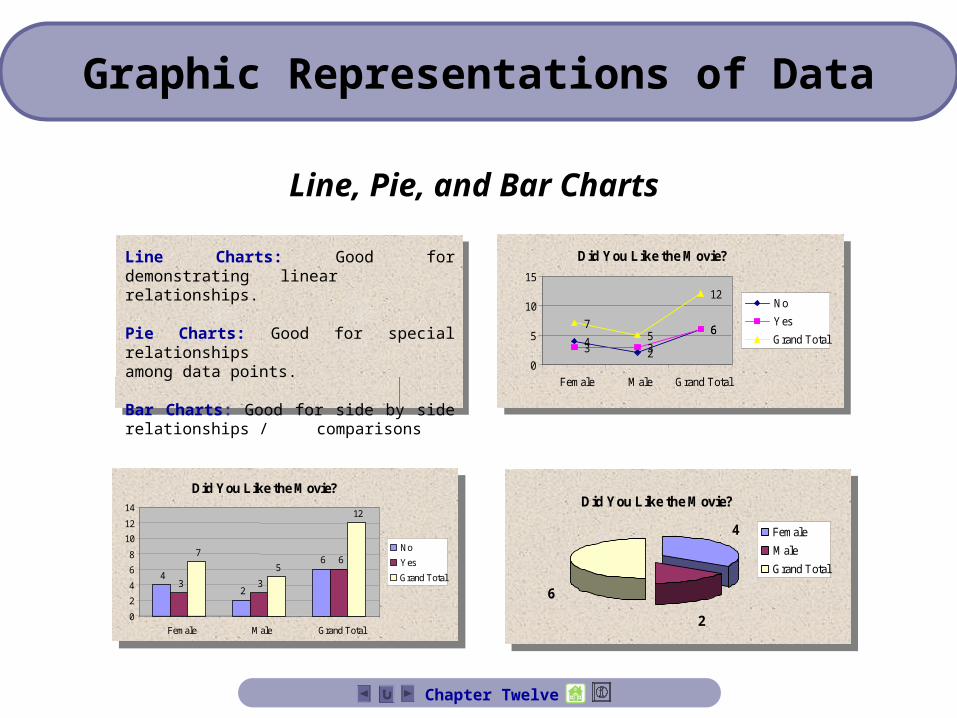
Line Charts: Good for demonstrating linear relationships.
Pie Charts: Good for special relationships among data points.
Bar Charts: Good for side by side relationships / comparisons
Did You Like the Movie?
4
2
6
3 3
67
5
12
0
2
4
6
8
10
12
14
Female Male Grand Total
No
Yes
Grand Total
Did You Like the Movie?
42
6
3 3
675
12
0
5
10
15
Female Male Grand Total
No
Yes
Grand Total
Did You Like the Movie?
4
2
6
Female
Male
Grand Total
Line, Pie, and Bar Charts
Graphic Representations of Data
Chapter Twelve
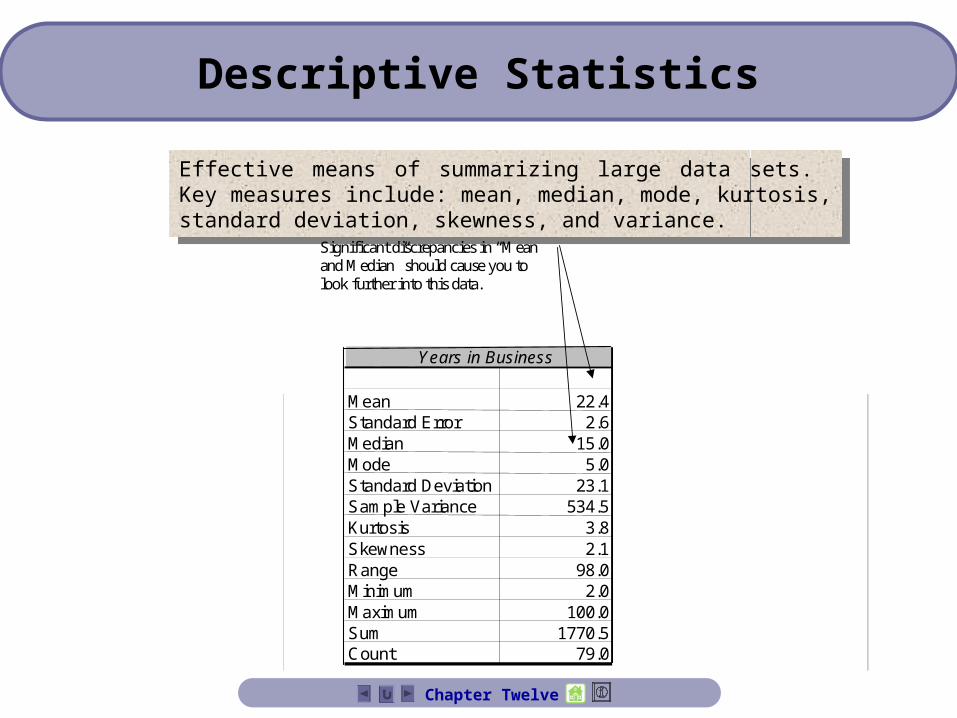
Effective means of summarizing large data sets. Key measures include: mean, median, mode, kurtosis, standard deviation, skewness, and variance.
Effective means of summarizing large data sets. Key measures include: mean, median, mode, kurtosis, standard deviation, skewness, and variance.
Years in Business
Mean 22.4Standard Error 2.6Median 15.0Mode 5.0Standard Deviation 23.1Sample Variance 534.5Kurtosis 3.8Skewness 2.1Range 98.0Minimum 2.0Maximum 100.0Sum 1770.5Count 79.0
Significant discrepancies in “Mean”and Median” should cause you tolook further into this data.
Descriptive Statistics
Chapter Twelve
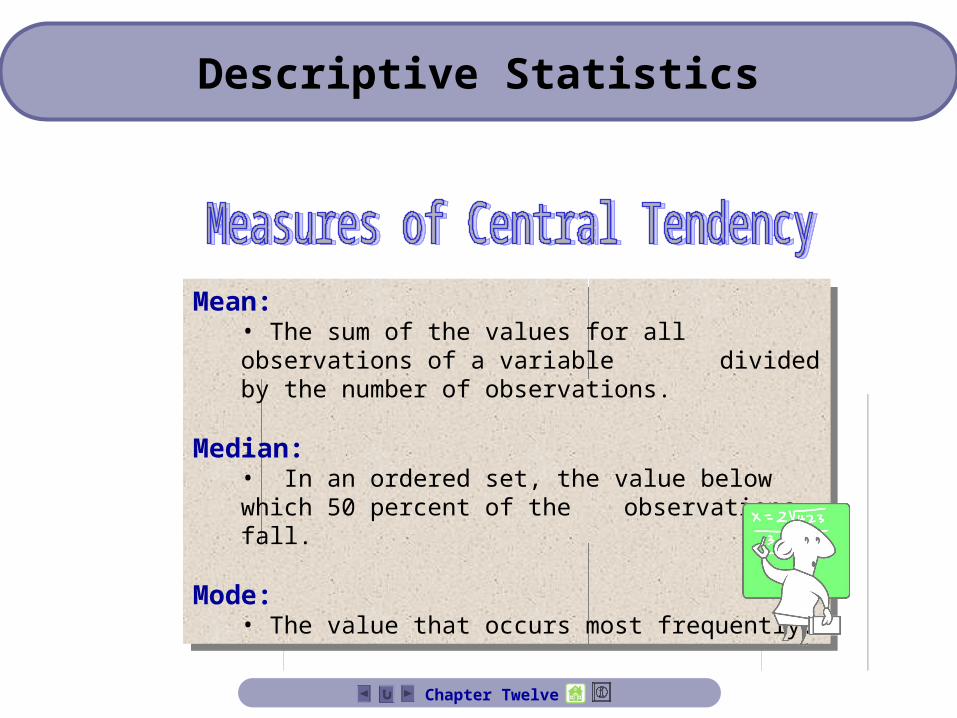
Mean:• The sum of the values for all observations of a variable divided by the number of observations.
Median:• In an ordered set, the value below which 50 percent of the
observations fall. Mode:
• The value that occurs most frequently.
Mean:• The sum of the values for all observations of a variable divided by the number of observations.
Median:• In an ordered set, the value below which 50 percent of the
observations fall. Mode:
• The value that occurs most frequently.
Descriptive Statistics
Chapter Twelve
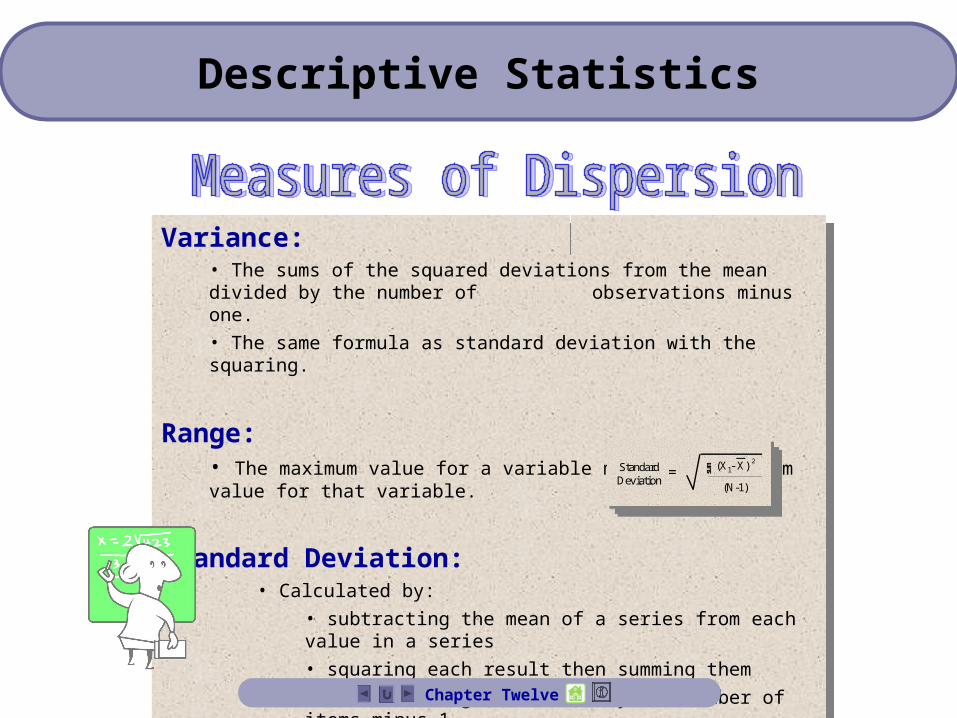
Variance:• The sums of the squared deviations from the mean divided by the number of
observations minus one.
• The same formula as standard deviation with the squaring.
Range:• The maximum value for a variable minus the minimum value for that variable.
Standard Deviation:• Calculated by:
• subtracting the mean of a series from each value in a series
• squaring each result then summing them
• then dividing the result by the number of items minus 1
• and finally taking the square root of this value
StandardDeviation
(N-1)
(X - X)12
= sumStandard
Deviation(N-1)
(X - X)12
= sum
Descriptive Statistics
Chapter Twelve
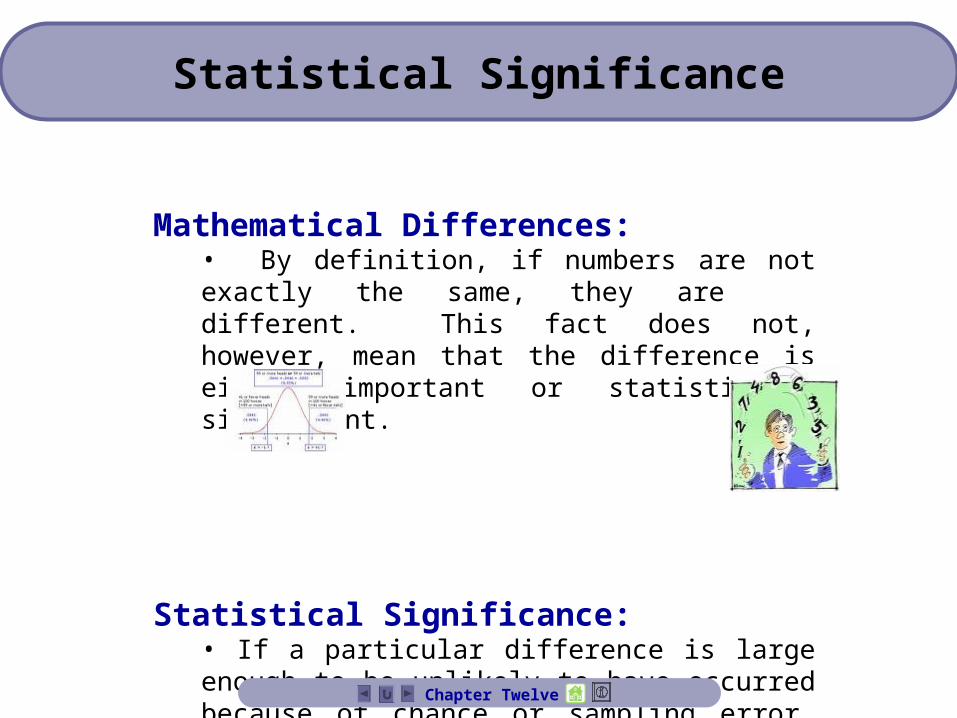
Mathematical Differences:• By definition, if numbers are not exactly the same, they are different. This fact does not, however, mean that the difference is either important or statistically significant.
Statistical Significance:• If a particular difference is large enough to be unlikely to have occurred because of chance or sampling error, then the difference is statistically significant.
Statistical Significance
Chapter Twelve

Managerial Important Differences:• One must be able to distinguish between mathematically differences and statistically significant differences in using the data analysis in managerial decision making.
Hypothesis:• An assumption, argument, or theory that a researcher or manager makes about some characteristics of the population under study.
Statistical Significance
Chapter Twelve

Step One: Stating the hypothesis • Null Hypothesis - status quo proven to be true.• Alternative Hypotheses - another alternative proven to the true.
Step Two: Choosing the appropriate test statistic• Test of means, test or proportions, ANOVA, etc.
Step Three: Developing a decision rule• Determine the significance level.• Need to determine whether to reject or fail to reject the null hypothesis.
Hypothesis Testing
Chapter Twelve

Step Four: Calculating the value of the test statistic• Use the appropriate formula to calculate the value of the statistic.
Step Five: Stating the conclusion• Stated from the perspective of the original research question.
Hypothesis Testing
Chapter Twelve

• Rejection of the null hypothesis when, in fact, it is true.
• Acceptance of the null hypothesis when, in fact, it is false.
Tests are either one or two-tailed. This decision depend on the nature of the situation and what the researcher is demonstrating.
One-Tailed:• “If you take the medicine, you will get better”
Two-Tailed:• “If you take the medicine, you will get either better or worse.”
Type I:
Type II:
Types of Errors in Hypothesis Testing
Chapter Twelve

Actual State of theNull Hypothesis
Fail to Reject Ho Reject Ho
Ho is true
Ho is false
Correct (1-) no error
Type II error ()
Type I error ()
Correct (1- ) no error
Issues With Type I and II Errors
Chapter Twelve

Independent Samples:• Samples in which measurement of a variable in one population
has no effect on measurement of the variable in the other.
Related Samples:• Samples in which measurement of a variable in one population
might influence measurement of the variable in the other.
Degrees of Freedom:• Is equal to the number of observations minus the number of assumptions or constraints necessary to calculate a statistic.
Commonly Used Statistical Hypothesis Tests
Chapter Twelve
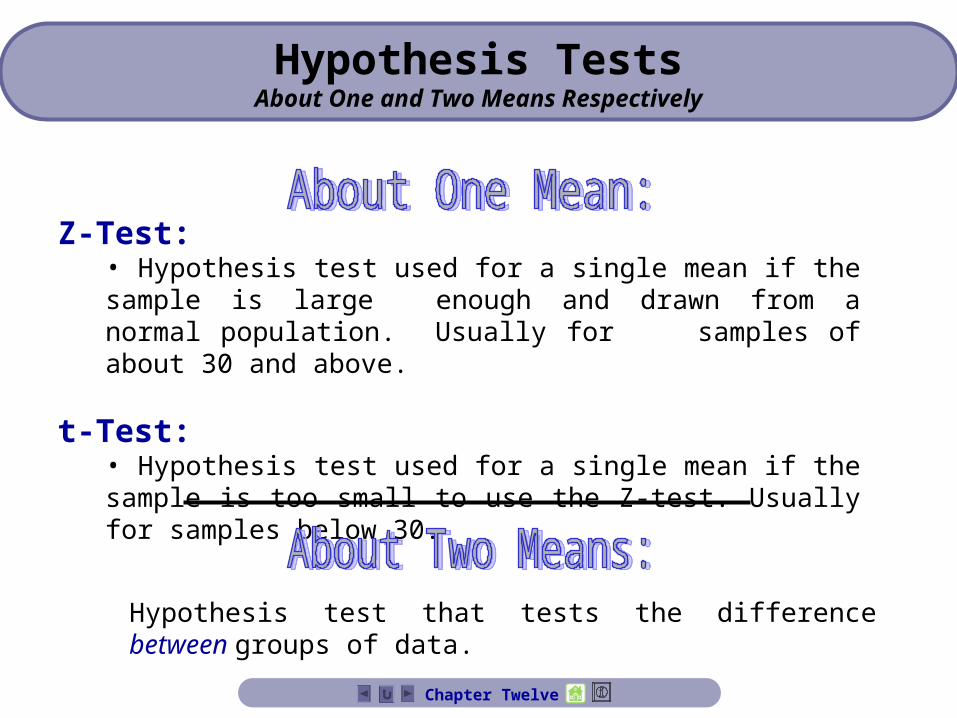
Z-Test:• Hypothesis test used for a single mean if the sample is large enough and drawn from a normal population. Usually for samples of about 30 and above.
t-Test:• Hypothesis test used for a single mean if the sample is too small to use the Z-test. Usually for samples below 30.
Hypothesis test that tests the difference between groups of data.
Hypothesis TestsAbout One and Two Means Respectively
Chapter Twelve
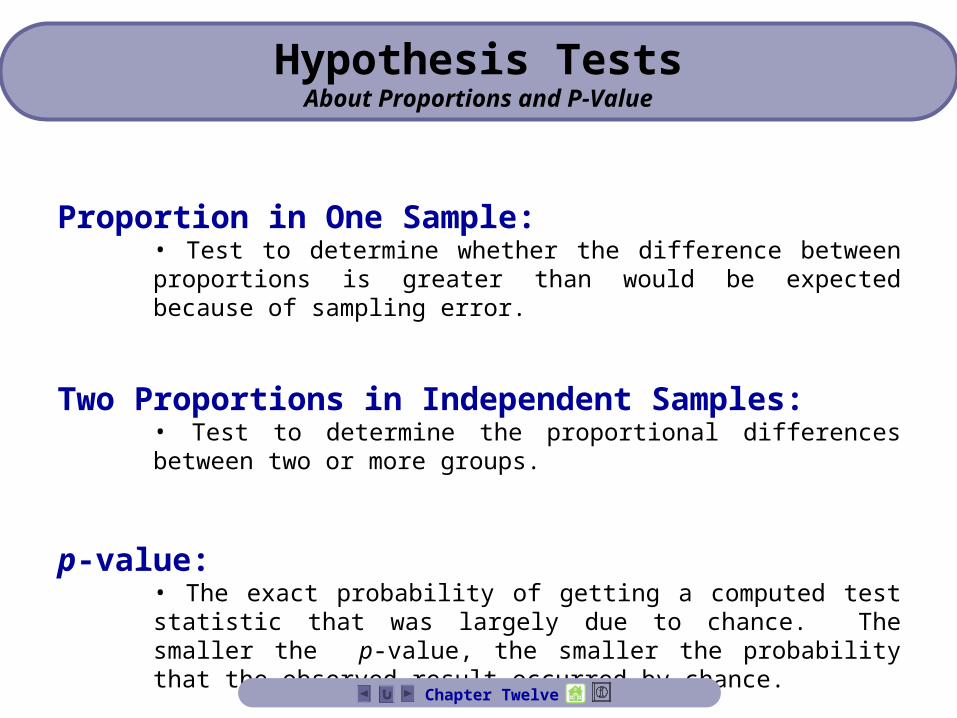
Proportion in One Sample:• Test to determine whether the difference between proportions is greater than would be expected because of sampling error.
Two Proportions in Independent Samples:• Test to determine the proportional differences between two or more groups.
p-value:• The exact probability of getting a computed test statistic that was largely due to chance. The smaller the p-value, the smaller the probability that the observed result occurred by chance.
Hypothesis TestsAbout Proportions and P-Value
Chapter Twelve
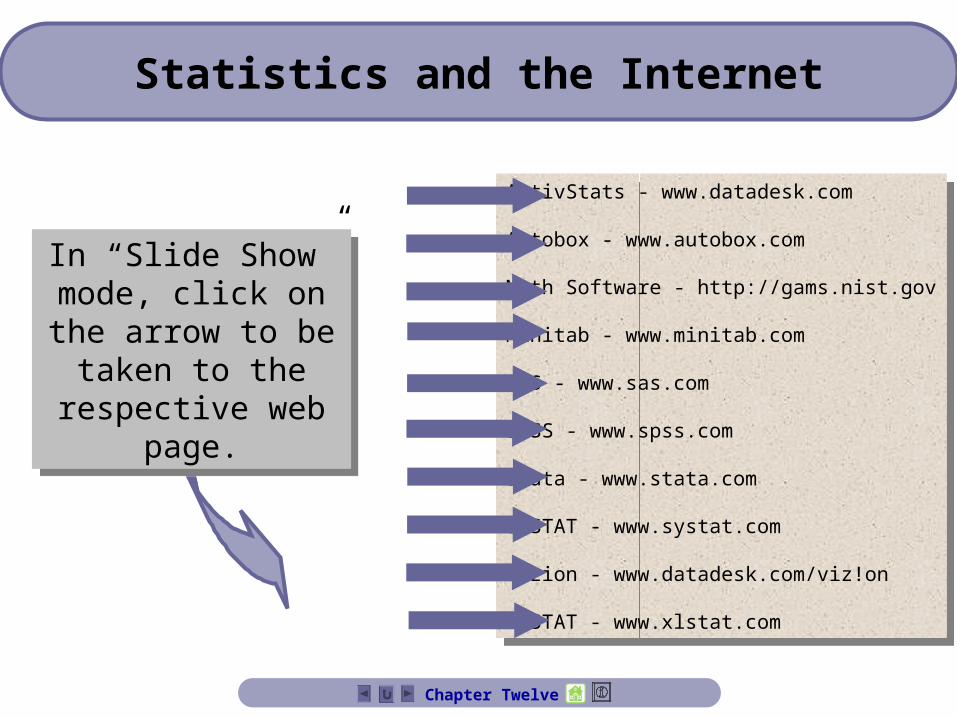
ActivStats - www.datadesk.com
Autobox - www.autobox.com
Math Software - http://gams.nist.gov
Minitab - www.minitab.com
SAS - www.sas.com
SPSS - www.spss.com
Stata - www.stata.com
SYSTAT - www.systat.com
Vizion - www.datadesk.com/viz!on
xISTAT - www.xlstat.com
ActivStats - www.datadesk.com
Autobox - www.autobox.com
Math Software - http://gams.nist.gov
Minitab - www.minitab.com
SAS - www.sas.com
SPSS - www.spss.com
Stata - www.stata.com
SYSTAT - www.systat.com
Vizion - www.datadesk.com/viz!on
xISTAT - www.xlstat.com
Statistics and the Internet
In “Slide Show” mode, click on the arrow to
be taken to the respective web page.
In “Slide Show” mode, click on the arrow to
be taken to the respective web page.
Chapter Twelve
Cross-tabulationData Analysis OverviewDescriptive StatisticsEditing, Coding, & Cleaning the DataHypothesis Testing - Common TypesHypothesis Testing - StepsMeasures of Central TendencyMeasures of DispersionStatistical Testing of DifferencesType I and Type II Errors
Index
Index