chapter v data analysis and...
TRANSCRIPT
130
CHAPTER – V
DATA ANALYSIS AND INTERPRETATION
5.1 INTRODUCTION
In this chapter an attempt has been made to identify the perception level of the
employees working in paper industry and their level of stress in the study area. For
this purpose, a field survey method was employed to collect the first-hand
information from 1052 sample respondents (TNPL-580 and SPB-472). The
respondents have been chosen randomly from the different sections of the selected
paper industries.
The data thus collected were arranged a simple tabular form. The level of
perception and their stress level of the selected respondents working in paper
industries was considered as a dependent variable. The Independent variables selected
for the study were Age, Sex, Educational qualification, Designation, Department,
Salary, Marital status, Number of dependents, Family system, Year of experience,
Working company and Working time.
The data were analyzed by using simple statistical tools like Percentage,
Average, Range, Standard Deviation, Two-way tables and Chi-Square test and Anova
test. In addition to these tests, Multiple Regression, Multi-Discriminant analysis and
Factor analysis were used appropriately. Henry Garrett Ranking Technique was also
used to find out the ranking position to know the different causes of stress among the
employees.

131
This chapter was divided into seven sections, for ease of analysis and
understanding. The seven sections of this chapter are as follows :
I. Chi-Square Test
II. Anova Test
III. Percentage Analysis
IV. Henry Garrett Ranking Technique
V. Multiple Regression Analysis
VI. Discriminant Function Analysis and
VII. Factor Analysis
5.2. LEVEL OF PERCEPTION AMONG EMPLOYEES
TOWARDS JOB AND THEIR LIFE : CHI-SQUARE TEST
The level of perception among the employees of paper industries was
measured based on their opinion on perception against their perception in job and in
their life. The respondents‘ opinion were measured based on scale and scoring
technique. Likerts‘ five points scaling was employed and the employees‘ level of
perception was classified as low (below 90 points), medium (90-110 points) and high
(111-140 points) based on mean (100) and standard deviation (10.1).

132
TABLE NO. 5.1
LEVEL OF PERCEPTION AMONG EMPLOYEES TOWARDS
JOB AND THEIR LIFE
S.
No.
Category No. of
Respondents
Percentage
(%)
1.
Low (below 90)
170
16.1
2.
Medium (90-110)
307
29.2
3.
High (111-140)
575
54.7
Total
1052
100.0
It is observed from the above table that 16.1 percent of the respondents were
expressed their level of perception at the low level. It is followed by 29.2 percent of
the respondents were expressed as medium level of perception and 54.7 percent of the
respondents were expressed their perception level as high. The two-way analysis was
prepared based on these three strata for data analysis and through this method chi-
square test was employed to test the relationship between the selected independent
variables and dependent variable.
133
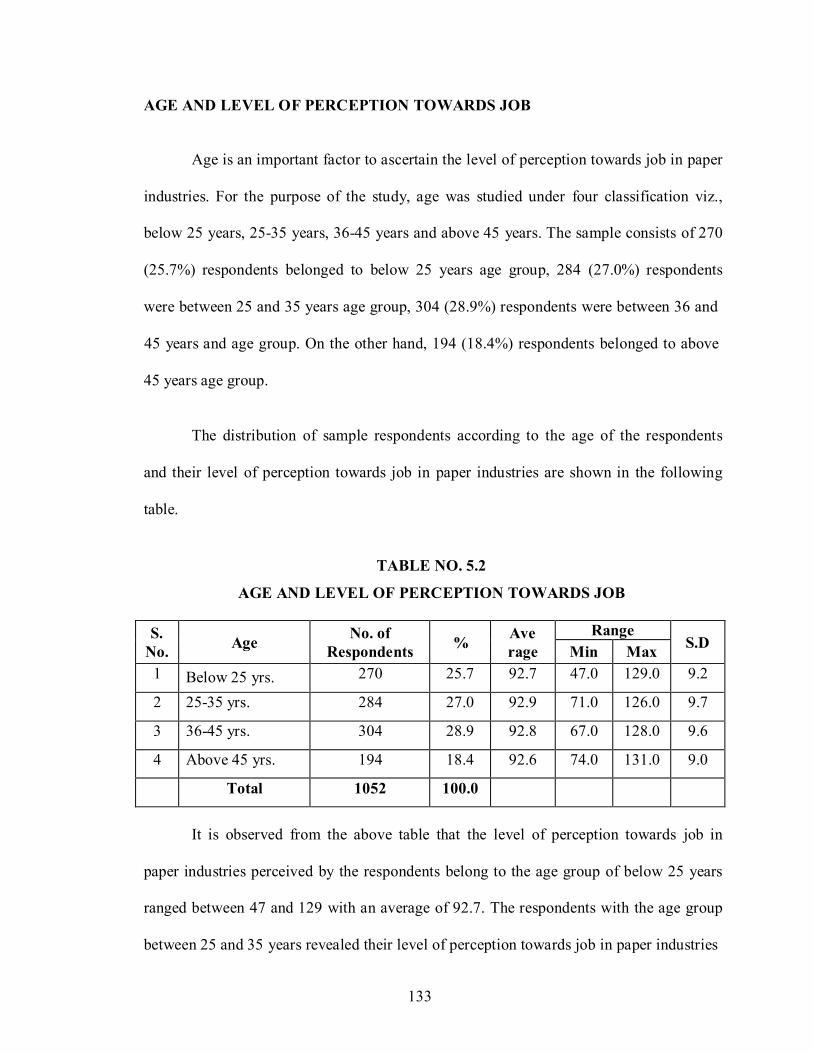
AGE AND LEVEL OF PERCEPTION TOWARDS JOB
Age is an important factor to ascertain the level of perception towards job in paper
industries. For the purpose of the study, age was studied under four classification viz.,
below 25 years, 25-35 years, 36-45 years and above 45 years. The sample consists of 270
(25.7%) respondents belonged to below 25 years age group, 284 (27.0%) respondents
were between 25 and 35 years age group, 304 (28.9%) respondents were between 36 and
45 years and age group. On the other hand, 194 (18.4%) respondents belonged to above
45 years age group.
The distribution of sample respondents according to the age of the respondents
and their level of perception towards job in paper industries are shown in the following
table.
TABLE NO. 5.2
AGE AND LEVEL OF PERCEPTION TOWARDS JOB
S.
No.
Age No. of
Respondents
% Ave
rage
Range
S.D Min Max
1 Below 25 yrs. 270 25.7 92.7 47.0 129.0 9.2
2 25-35 yrs. 284 27.0 92.9 71.0 126.0 9.7
3 36-45 yrs. 304 28.9 92.8 67.0 128.0 9.6
4 Above 45 yrs. 194 18.4 92.6 74.0 131.0 9.0
Total 1052 100.0
It is observed from the above table that the level of perception towards job in
paper industries perceived by the respondents belong to the age group of below 25 years
ranged between 47 and 129 with an average of 92.7. The respondents with the age group
between 25 and 35 years revealed their level of perception towards job in paper industries

134
ranged between 71 and 126 with an average of 92.9. The level of perception towards job
in paper industries perceived by the respondents between 36 and 45 years age group
ranged between 67 and 128 with an average of 92.8. Finally, the level of perception
towards job in paper industries perceived by the respondents of above 45 years age group
ranged between 74 and 131 with an average of 92.6. From the analysis, it is inferred that
the maximum level of perception was among the age group between 25 and 35 years
towards their job.
With a view to find the degree of association between age of the respondents and
the level of perception towards job in paper industries, a two-way table is prepared and
depicted in the following table.
TABLE NO. 5.3
AGE AND LEVEL OF PERCEPTION TOWARDS JOB
(TWO-WAY TABLE)
S.No.
Age Level of Perception towards job
Total Low Medium High
1
Below 25 yrs. 40
(14.8%) 74
(27.4%) 156
(57.8%)
270
2
25-35 yrs. 60
(21.1%) 68
(23.9%) 156
(54.9%)
284
3
36-45 yrs. 37
(12.2%) 106
(34.9%) 161
(53.0%)
304
4
Above 45 yrs. 33
(17.0%) 59
(30.4%) 102
(52.6%)
194
Total 170 307 575 1052
It is found from the above table that the percentage of high level of perception
towards job in paper industries was the highest (57.8) among the respondents of below 25
years age group and the same was the lowest (52.6) among the respondents of above 45
years group. The percentage of medium level of perception towards job in paper

135
industries was the highest (34.9) among the respondents between 36 and 45 years of age
group and the same was the lowest (23.9%) among the respondents between 25 and 35
years age group. The percentage of low level of perception towards job in paper
industries was the highest (21.1) among the respondents between 25 and 35 of age group
and the same was the lowest (12.2%) among the respondents between 36 and 45 years
age group.
In order to find the relationship between the age of the respondents and level of
perception towards job in paper industries, the following null hypothesis was framed and
tested with the help of Chi-square test and the result is shown in the following table.
H0 : There is no significant relationship between age of the respondents and
level of perception towards job in paper industries.
H1 : There is a significant relationship between age of the respondents and
level of perception towards job in paper industries.
TABLE NO. 5.4
AGE AND LEVEL OF PERCEPTION TOWARDS JOB
(CHI-SQUARE TEST)
Factor Calculated
2
Value
Table Value
D.F
Remarks
Age
14.947
12.592
6 Significant at 5%
level
It is evident from the above table that the calculated chi-square value is greater
than the table value and the result is significant at 5% level. Hence, the hypothesis, ―Age
of the respondents and the level of perception towards job in paper industries are not
associated‖ does not hold good. From the analysis, it is found that there is a close

136
relationship between the age of the respondents and their level of perception towards job
in paper industries.
GENDER AND LEVEL OF PERCEPTION TOWARDS JOB
Genderwise discrimination is not practiced much in India. However, the level of
perception differs according to masculine and feminine gender. For the purpose of this
study, gender has been classified into two strata viz., male and female. The sample
consists of 877 (83.4%) respondents belonging to male category and 175 (16.6%)
respondents belonging to female category.
The distribution of sample respondents according to the gender and their level of
perception towards job in paper industries are shown in the following table.
TABLE NO. 5.5
GENDER AND LEVEL OF PERCEPTION TOWARDS JOB
S.
No.
Gender No. of
Respondents
% Ave
rage
Range
S.D Min Max
1 Male 877 83.4 92.8 47.0 131.0 9.7
2 Female 175 16.6 92.4 75.0 123.0 8.1
Total 1052 100.0
It is inferred from the above table that the level of perception towards job in paper
industries by the male respondents ranged between 47 and 131 with an average of 92.8
and the level of perception of the female respondents ranged between 75 and 123 with an
average of 92.4. From the above analysis it concluded that the maximum level of
perception towards job in paper industries was perceived by the male respondents.

137
With a view to find the degree of association, gender of the respondents and their
level of perception towards job in paper industries, a two-way table was prepared and it is
shown in the following table.
TABLE NO. 5.6
GENDER AND LEVEL OF PERCEPTION TOWARDS JOB
(TWO-WAY TABLE)
S. No.
Gender Level of Perception towards job
Total Low Medium High
1
Male 133
(15.2%)
248
(28.3%)
496
(56.6%)
877
2
Female 37
(21.1%) 59
(33.7%) 79
(45.1%)
175
Total 170 307 575 1052
It is found from the above table that the percentage of high level of perception
towards job in paper industries was the highest (56.6) among the male respondents and
the same was the lowest (45.1) among the female respondents. The percentage of
medium level of perception towards job in paper industries was the highest (33.7) among
the female respondents and the same was the lowest (28.3) among the male respondents.
The percentage of low level of perception towards job in paper industries was the highest
(21.1) among the female respondents and the same was the lowest (15.2) among the male
respondents.
In order to find the relationship between the gender of the respondents and level
of perception towards job in paper industries, the following hypothesis was framed and
tested with the help of Chi-square test and the result is shown in the following table.
138
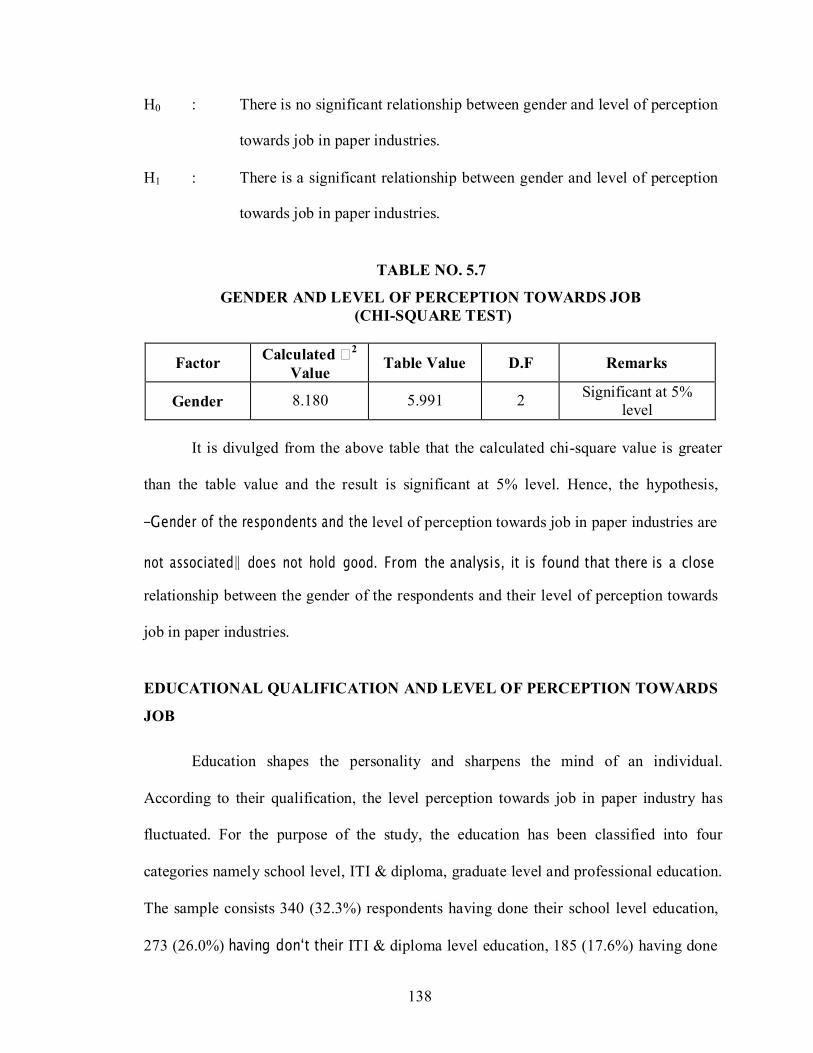
H0 : There is no significant relationship between gender and level of perception
towards job in paper industries.
H1 : There is a significant relationship between gender and level of perception
towards job in paper industries.
TABLE NO. 5.7
GENDER AND LEVEL OF PERCEPTION TOWARDS JOB
(CHI-SQUARE TEST)
Factor Calculated
2
Value
Table Value
D.F
Remarks
Gender
8.180
5.991
2 Significant at 5%
level
It is divulged from the above table that the calculated chi-square value is greater
than the table value and the result is significant at 5% level. Hence, the hypothesis,
―Gender of the respondents and the level of perception towards job in paper industries are
not associated‖ does not hold good. From the analysis, it is found that there is a close
relationship between the gender of the respondents and their level of perception towards
job in paper industries.
EDUCATIONAL QUALIFICATION AND LEVEL OF PERCEPTION TOWARDS
JOB
Education shapes the personality and sharpens the mind of an individual.
According to their qualification, the level perception towards job in paper industry has
fluctuated. For the purpose of the study, the education has been classified into four
categories namely school level, ITI & diploma, graduate level and professional education.
The sample consists 340 (32.3%) respondents having done their school level education,
273 (26.0%) having don‘t their ITI & diploma level education, 185 (17.6%) having done
139
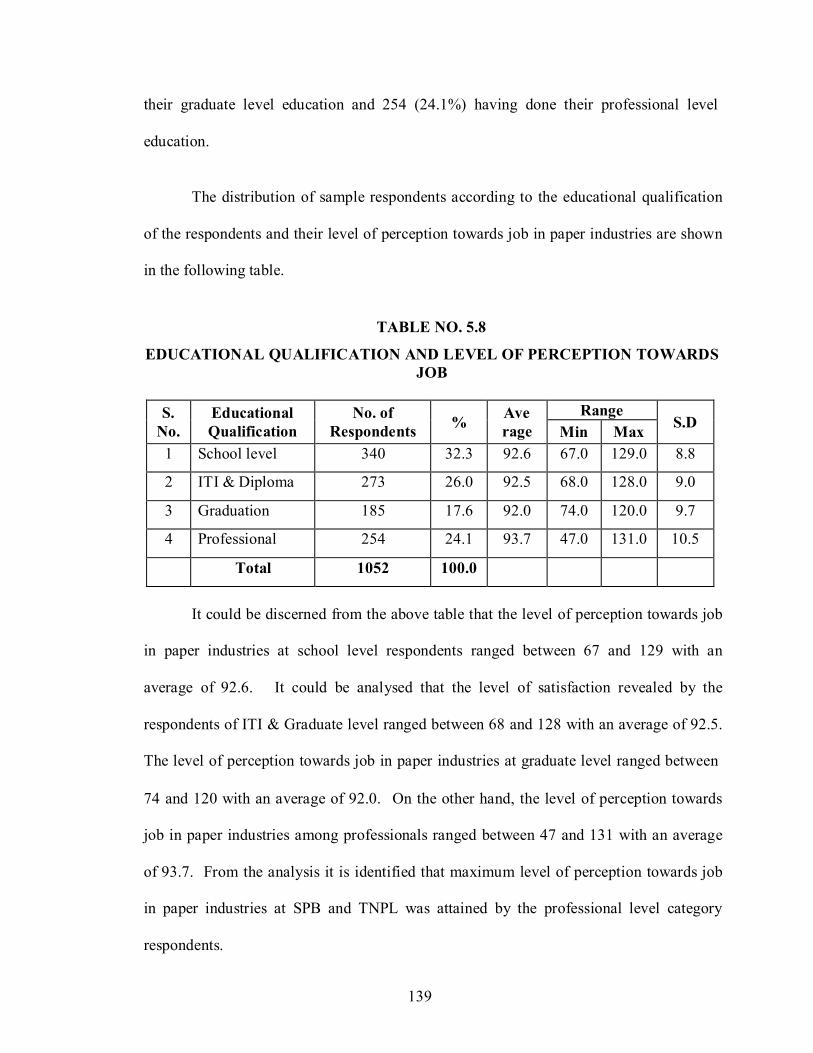
their graduate level education and 254 (24.1%) having done their professional level
education.
The distribution of sample respondents according to the educational qualification
of the respondents and their level of perception towards job in paper industries are shown
in the following table.
TABLE NO. 5.8
EDUCATIONAL QUALIFICATION AND LEVEL OF PERCEPTION TOWARDS
JOB
S.
No.
Educational
Qualification
No. of
Respondents
% Ave
rage
Range
S.D Min Max
1 School level 340 32.3 92.6 67.0 129.0 8.8
2 ITI & Diploma 273 26.0 92.5 68.0 128.0 9.0
3 Graduation 185 17.6 92.0 74.0 120.0 9.7
4 Professional 254 24.1 93.7 47.0 131.0 10.5
Total 1052 100.0
It could be discerned from the above table that the level of perception towards job
in paper industries at school level respondents ranged between 67 and 129 with an
average of 92.6. It could be analysed that the level of satisfaction revealed by the
respondents of ITI & Graduate level ranged between 68 and 128 with an average of 92.5.
The level of perception towards job in paper industries at graduate level ranged between
74 and 120 with an average of 92.0. On the other hand, the level of perception towards
job in paper industries among professionals ranged between 47 and 131 with an average
of 93.7. From the analysis it is identified that maximum level of perception towards job
in paper industries at SPB and TNPL was attained by the professional level category
respondents.
140
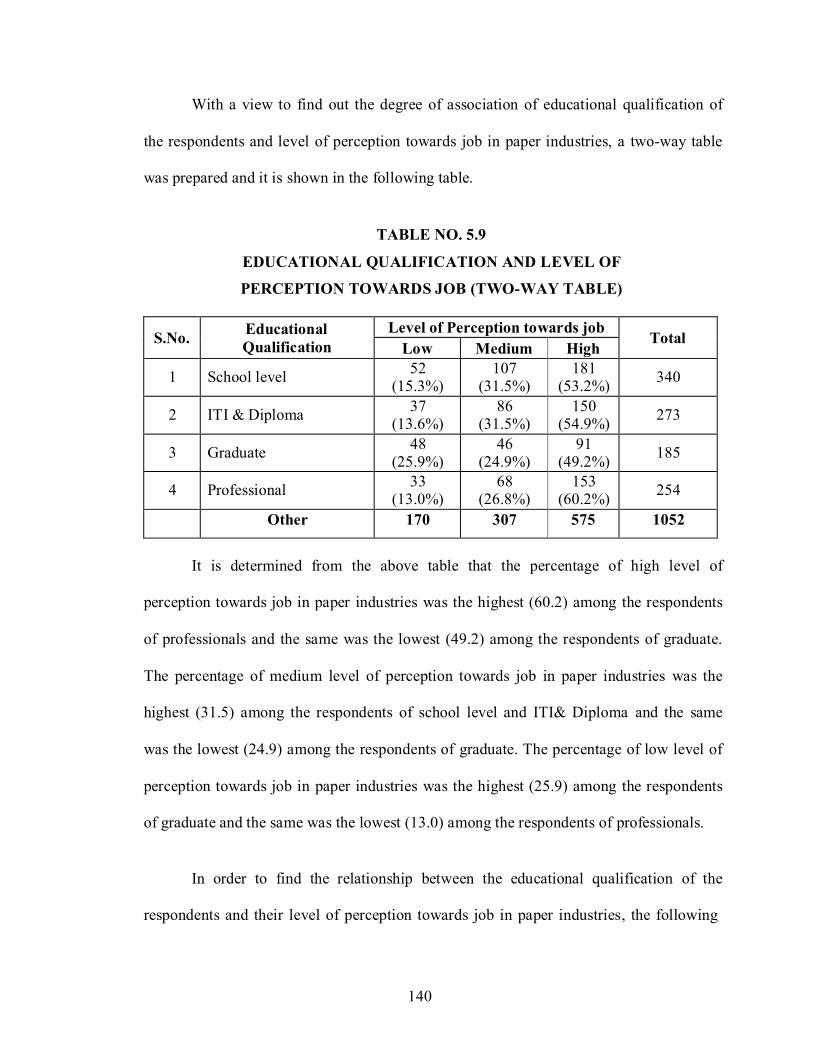
With a view to find out the degree of association of educational qualification of
the respondents and level of perception towards job in paper industries, a two-way table
was prepared and it is shown in the following table.
TABLE NO. 5.9
EDUCATIONAL QUALIFICATION AND LEVEL OF
PERCEPTION TOWARDS JOB (TWO-WAY TABLE)
S.No. Educational
Qualification
Level of Perception towards job
Total Low Medium High
1
School level 52
(15.3%) 107
(31.5%) 181
(53.2%)
340
2
ITI & Diploma 37
(13.6%) 86
(31.5%) 150
(54.9%)
273
3
Graduate 48
(25.9%) 46
(24.9%) 91
(49.2%)
185
4
Professional 33
(13.0%) 68
(26.8%) 153
(60.2%)
254
Other 170 307 575 1052
It is determined from the above table that the percentage of high level of
perception towards job in paper industries was the highest (60.2) among the respondents
of professionals and the same was the lowest (49.2) among the respondents of graduate.
The percentage of medium level of perception towards job in paper industries was the
highest (31.5) among the respondents of school level and ITI& Diploma and the same
was the lowest (24.9) among the respondents of graduate. The percentage of low level of
perception towards job in paper industries was the highest (25.9) among the respondents
of graduate and the same was the lowest (13.0) among the respondents of professionals.
In order to find the relationship between the educational qualification of the
respondents and their level of perception towards job in paper industries, the following

141
hypothesis was framed and tested with the help of Chi-square test and the result is shown
in the following table.
H0 : There is no significant relationship between educational qualification and
their level of perception towards job in paper industries.
H1 : There is a significant relationship between educational qualification and
their level of perception towards job in paper industries.
TABLE NO. 5.10
EDUCATIONAL QUALIFICATION AND LEVEL OF PERCEPTION TOWARDS
JOB (CHI-SQUARE TEST)
Factor Calculated
2
Value
Table Value
D.F
Remarks
Educational
Qualification
19.236
12.592
6 Significant at 5%
level
It is examined from the above table that the calculated chi-square value is greater
than the table value and the result is significant at 5% level. Hence, the hypothesis,
―Educational qualification of the respondents and the level of perception towards job in
paper industries are not associated‖ does not hold good. From the analysis, it is found that
there is a close relationship between the educational qualification of the respondents and
their level of perception towards job in paper industries.
142
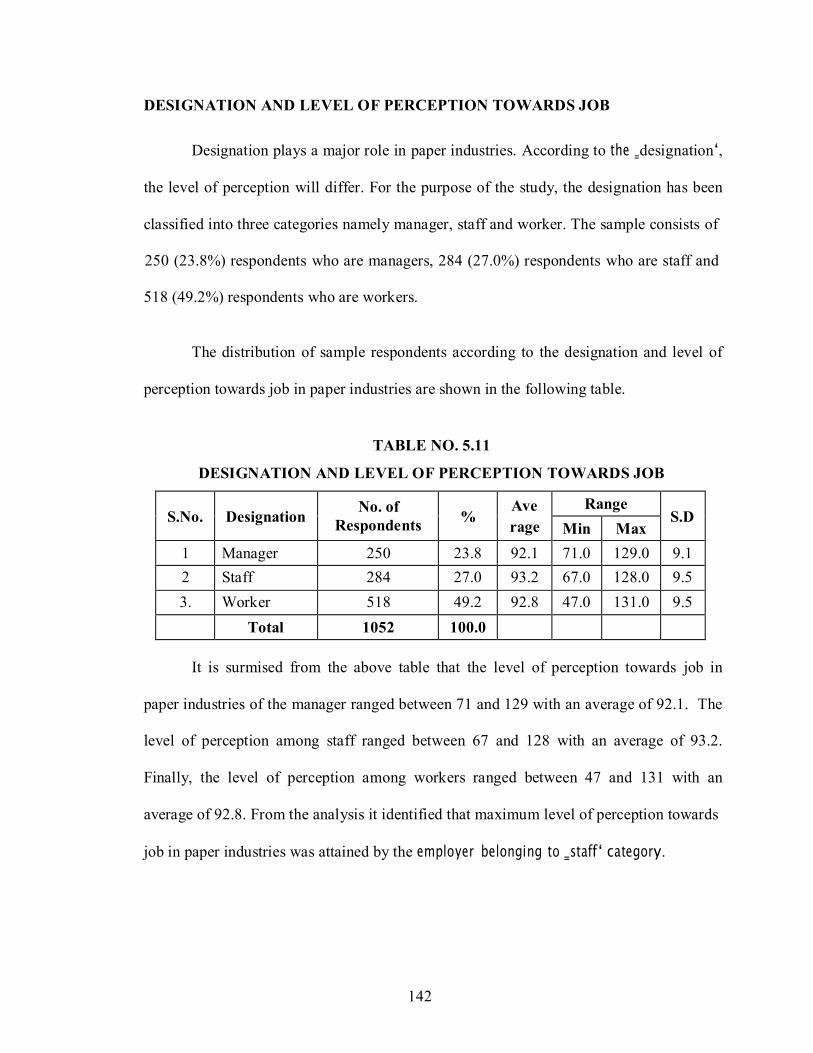
DESIGNATION AND LEVEL OF PERCEPTION TOWARDS JOB
Designation plays a major role in paper industries. According to the ‗designation‘,
the level of perception will differ. For the purpose of the study, the designation has been
classified into three categories namely manager, staff and worker. The sample consists of
250 (23.8%) respondents who are managers, 284 (27.0%) respondents who are staff and
518 (49.2%) respondents who are workers.
The distribution of sample respondents according to the designation and level of
perception towards job in paper industries are shown in the following table.
TABLE NO. 5.11
DESIGNATION AND LEVEL OF PERCEPTION TOWARDS JOB
S.No.
Designation No. of
Respondents
% Ave
rage
Range
S.D Min Max
1 Manager 250 23.8 92.1 71.0 129.0 9.1
2 Staff 284 27.0 93.2 67.0 128.0 9.5
3. Worker 518 49.2 92.8 47.0 131.0 9.5
Total 1052 100.0
It is surmised from the above table that the level of perception towards job in
paper industries of the manager ranged between 71 and 129 with an average of 92.1. The
level of perception among staff ranged between 67 and 128 with an average of 93.2.
Finally, the level of perception among workers ranged between 47 and 131 with an
average of 92.8. From the analysis it identified that maximum level of perception towards
job in paper industries was attained by the employer belonging to ‗staff‘ category.
143
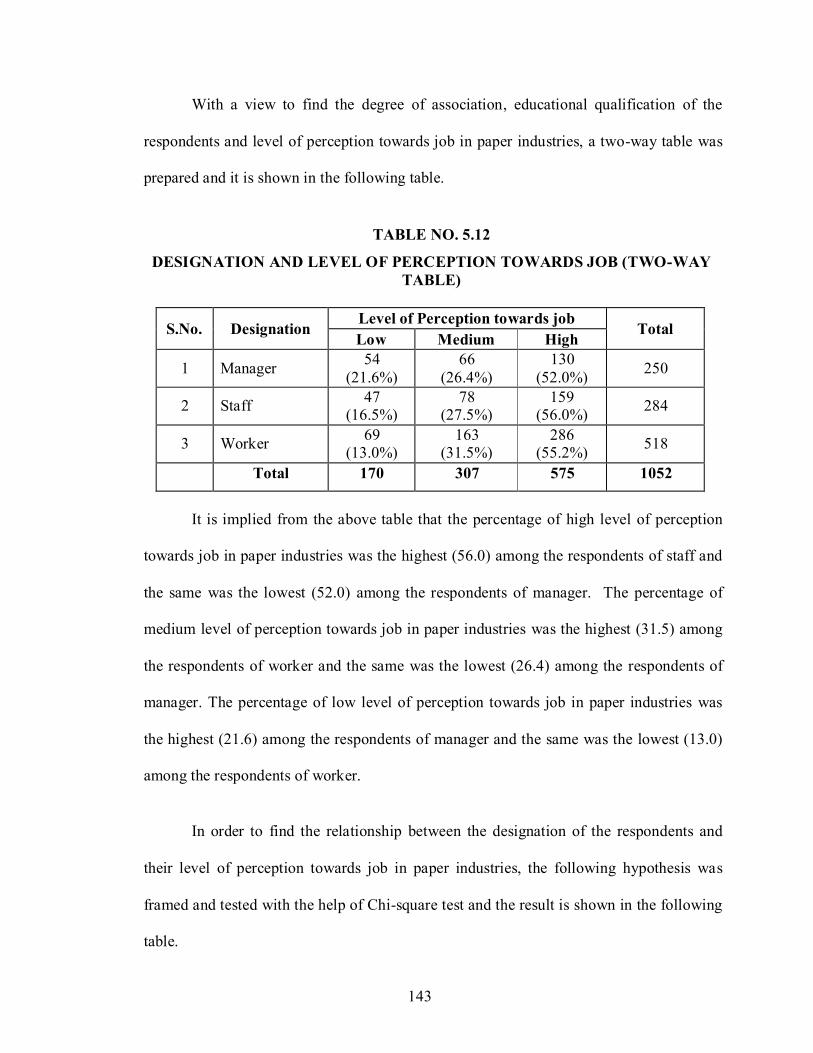
With a view to find the degree of association, educational qualification of the
respondents and level of perception towards job in paper industries, a two-way table was
prepared and it is shown in the following table.
TABLE NO. 5.12
DESIGNATION AND LEVEL OF PERCEPTION TOWARDS JOB (TWO-WAY
TABLE)
S.No.
Designation Level of Perception towards job
Total Low Medium High
1
Manager 54
(21.6%)
66
(26.4%)
130
(52.0%)
250
2
Staff 47
(16.5%) 78
(27.5%) 159
(56.0%)
284
3
Worker 69
(13.0%) 163
(31.5%) 286
(55.2%)
518
Total 170 307 575 1052
It is implied from the above table that the percentage of high level of perception
towards job in paper industries was the highest (56.0) among the respondents of staff and
the same was the lowest (52.0) among the respondents of manager. The percentage of
medium level of perception towards job in paper industries was the highest (31.5) among
the respondents of worker and the same was the lowest (26.4) among the respondents of
manager. The percentage of low level of perception towards job in paper industries was
the highest (21.6) among the respondents of manager and the same was the lowest (13.0)
among the respondents of worker.
In order to find the relationship between the designation of the respondents and
their level of perception towards job in paper industries, the following hypothesis was
framed and tested with the help of Chi-square test and the result is shown in the following
table.

144
H0 : There is no significant relationship between designation and their level of
perception towards job in paper industries.
H1 : There is a significant relationship between designation and their level of
perception towards job in paper industries.
TABLE NO. 5.13
DESIGNATION AND LEVEL OF PERCEPTION TOWARDS JOB
(CHI-SQUARE TEST)
Factor Calculated
2
Value
Table Value
D.F
Remarks
Designation
9.510
9.488
4 Significant at 5%
level
It is discerned from the above table that the calculated chi-square value is greater
than the table value and the result is significant at 5% level. Hence the hypothesis,
―Designation of the respondents and the level of perception towards job in paper
industries are not associated‖ does not hold good. From the analysis, it is found that there
is a close relationship between the designation of the respondents and their level of
perception towards job in paper industries.
DEPARTMENT AND LEVEL OF PERCEPTION TOWARDS JOB
Department is very essential in paper industry. The work was allotted to different
departments in the industry. Based on that, the level of perception varies among the
respondents‘ in paper industries. For the purpose of this study, department has been
studied into four groups viz., administrative, marketing and production. The sample
consists of 292 (27.8%) respondents who are working in administrative department, 318

145
(30.2%) respondents who are working in marketing department and 442 (42.0%)
respondents who are working in production department.
The distribution of sample respondents according to the department and their
level of perception towards job in paper industries are shown in the following table.
TABLE NO. 5.14
DEPARTMENT AND LEVEL OF PERCEPTION TOWARDS JOB
S.No.
Department No. of
Respondents
% Ave
rage
Range
S.D Min Max
1 Administrative 292 27.8 94.0 71.0 129.0 9.7
2 Marketing 318 30.2 91.6 71.0 131.0 8.7
3. Production 442 42.0 92.7 47.0 123.0 9.7
Total 1052 100.0
It is witnessed from the above table that the level of perception towards job in
paper industries of the administrative department ranged between 71 and 129 with an
average of 94.0 and the level of perception of the marketing department ranged between
71 and 131 with an average of 91.6. Finally, the level of perception towards production
department ranged between 47 and 123 with an average of 92.7. From the analysis it is
identified that maximum level of perception towards job in paper industries was attained
by the administrative department.
With a view to find the degree of association, department and level of perception
towards job in paper industries, a two-way table was prepared and it is shown in the
following table.

146
TABLE NO. 5.15
DEPARTMENT AND LEVEL OF PERCEPTION TOWARDS JOB (TWO-WAY
TABLE)
S.No.
Department Level of Perception towards job
Total Low Medium High
1
Administrative 40
(13.7%) 75
(25.7%) 177
(60.6%)
292
2
Marketing 64
(20.1%) 97
(30.5%) 157
(49.4%)
318
3
Production 66
(14.9%)
135
(30.5%)
241
(54.5%)
442
Total 170 307 575 1052
It is scrutinized from the above table that the percentage of high level of
perception towards job in paper industries was the highest (60.6) among the respondents
of personnel department and the same was the lowest (49.4) towards marketing
department. The percentage of medium level of perception towards job in paper
industries was the highest (30.5) among the respondents of marketing and production
department and the same was the lowest (25.7) amongst the respondents of
administration department. The percentage of low level of perception towards job in
paper industries was the highest (20.1) among the respondents of marketing department
and the same was the lowest (13.7) amongst the respondents of administration
department.
In order to find the relationship between the department of the respondents and
their level of perception towards job in paper industries, the following hypothesis was
framed and tested with the help of Chi-square test and the result is shown in the following
table.

147
H0 : There is no significant relationship between department and their level of
perception towards job in paper industries.
H1 : There is a significant relationship between department and their level of
perception towards job in paper industries.
TABLE NO. 5.16
DEPARTMENT AND LEVEL OF PERCEPTION TOWARDS JOB
(CHI-SQUARE TEST)
Factor Calculated
2
Value
Table Value
D.F
Remarks
Department
9.821
9.488
4 Significant at 5%
level
It is extrapolated from the above table that the calculated chi-square value is
greater than the table value and the result is significant at 5% level. Hence, the
hypothesis, ―Department of the respondents and the level of perception towards job in
paper industries are not associated‖ does not hold good. From the analysis, it is found that
there is a close relationship between the department and level of perception towards job
in paper industries.
MONTHLY INCOME AND LEVEL OF SATISFACTION
Monthly income is very needful to run their family and to stand upon the society.
The level of perception towards job has varied according to their monthly income in
paper industry. For the purpose of this study, monthly income has been studied into four
groups viz., Below Rs.9000, between Rs.9000 and 12000, between 12000 and 15000 and
above Rs.15000. The sample consists 223 (21.2%) respondents who are earning Below
Rs.9000, 239 (22.7%) respondents earning between Rs.8001 and 12000, 280 (26.6%)
148
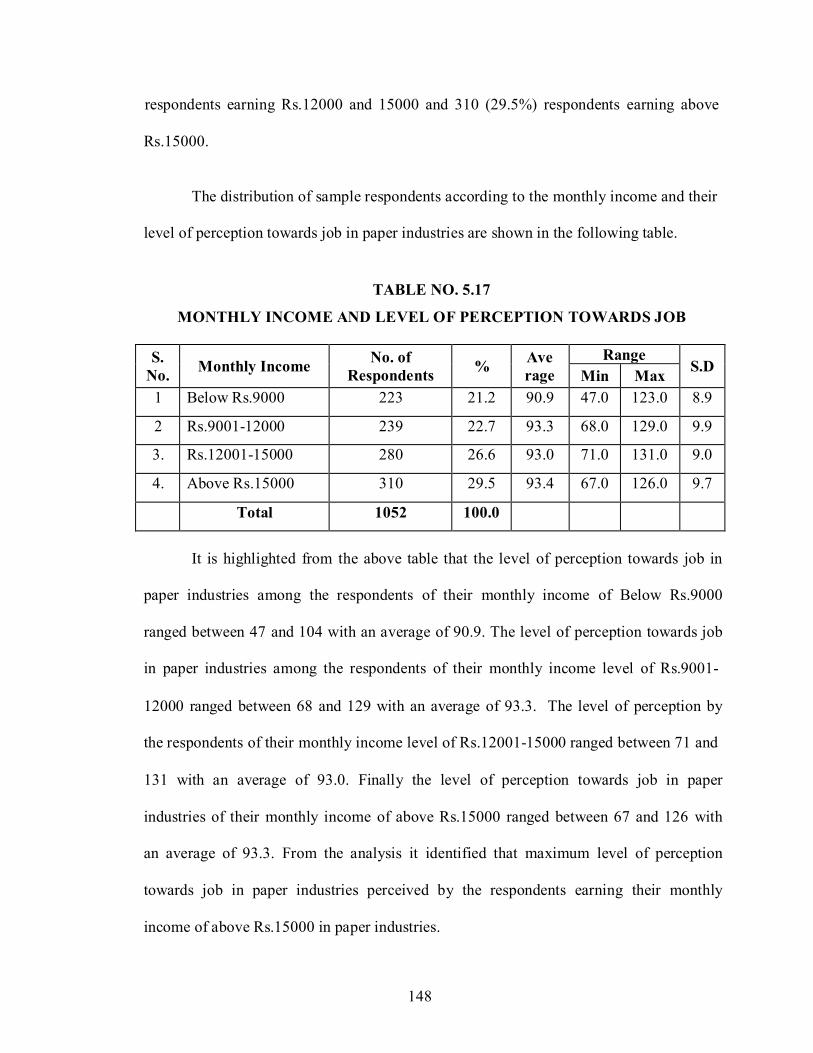
respondents earning Rs.12000 and 15000 and 310 (29.5%) respondents earning above
Rs.15000.
The distribution of sample respondents according to the monthly income and their
level of perception towards job in paper industries are shown in the following table.
TABLE NO. 5.17
MONTHLY INCOME AND LEVEL OF PERCEPTION TOWARDS JOB
S.
No.
Monthly Income No. of
Respondents
% Ave
rage
Range
S.D Min Max
1 Below Rs.9000 223 21.2 90.9 47.0 123.0 8.9
2 Rs.9001-12000 239 22.7 93.3 68.0 129.0 9.9
3. Rs.12001-15000 280 26.6 93.0 71.0 131.0 9.0
4. Above Rs.15000 310 29.5 93.4 67.0 126.0 9.7
Total 1052 100.0
It is highlighted from the above table that the level of perception towards job in
paper industries among the respondents of their monthly income of Below Rs.9000
ranged between 47 and 104 with an average of 90.9. The level of perception towards job
in paper industries among the respondents of their monthly income level of Rs.9001-
12000 ranged between 68 and 129 with an average of 93.3. The level of perception by
the respondents of their monthly income level of Rs.12001-15000 ranged between 71 and
131 with an average of 93.0. Finally the level of perception towards job in paper
industries of their monthly income of above Rs.15000 ranged between 67 and 126 with
an average of 93.3. From the analysis it identified that maximum level of perception
towards job in paper industries perceived by the respondents earning their monthly
income of above Rs.15000 in paper industries.
149
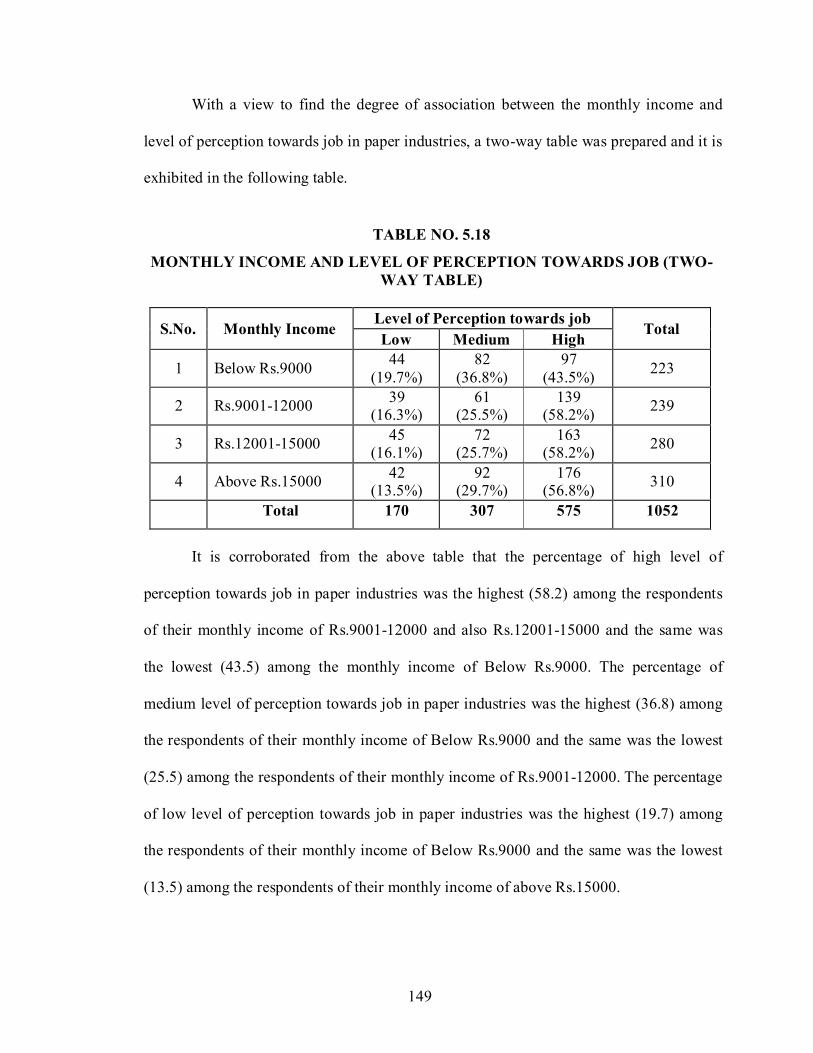
With a view to find the degree of association between the monthly income and
level of perception towards job in paper industries, a two-way table was prepared and it is
exhibited in the following table.
TABLE NO. 5.18
MONTHLY INCOME AND LEVEL OF PERCEPTION TOWARDS JOB (TWO-
WAY TABLE)
S.No.
Monthly Income Level of Perception towards job
Total Low Medium High
1
Below Rs.9000 44
(19.7%)
82
(36.8%)
97
(43.5%)
223
2
Rs.9001-12000 39
(16.3%) 61
(25.5%) 139
(58.2%)
239
3
Rs.12001-15000 45
(16.1%) 72
(25.7%) 163
(58.2%)
280
4
Above Rs.15000 42
(13.5%) 92
(29.7%) 176
(56.8%)
310
Total 170 307 575 1052
It is corroborated from the above table that the percentage of high level of
perception towards job in paper industries was the highest (58.2) among the respondents
of their monthly income of Rs.9001-12000 and also Rs.12001-15000 and the same was
the lowest (43.5) among the monthly income of Below Rs.9000. The percentage of
medium level of perception towards job in paper industries was the highest (36.8) among
the respondents of their monthly income of Below Rs.9000 and the same was the lowest
(25.5) among the respondents of their monthly income of Rs.9001-12000. The percentage
of low level of perception towards job in paper industries was the highest (19.7) among
the respondents of their monthly income of Below Rs.9000 and the same was the lowest
(13.5) among the respondents of their monthly income of above Rs.15000.

150
In order to find the relationship between the monthly income of the respondents
and their level of perception towards job in paper industries, the following hypothesis
was framed and tested with the help of Chi-square test and the result is shown in the
following table.
H0 : There is no significant relationship between monthly income and their
level of perception towards job in paper industries.
H1 : There is a significant relationship between monthly income and their level
of perception towards job in paper industries.
TABLE NO. 5.19
MONTHLY INCOME AND LEVEL OF PERCEPTION TOWARDS JOB
(CHI-SQUARE TEST)
Factor Calculated
2
Value
Table Value
D.F
Remarks
Monthly
Income
16.270
12.592
6 Significant at 5%
level
It is extrapolated from the above table that the calculated chi-square value is
greater than the table value and the result is significant at 5% level. Hence, the
hypothesis, ―monthly income of the respondents and the level of perception towards job
in paper industries are not associated‖ does not hold good. From the analysis, it is found
that there is a close relationship between the monthly income and level of perception
towards job in paper industries.
MARITAL STATUS AND LEVEL OF SATISFACTION
It is an important factor to know about the married and unmarried respondents‘
level of perception towards job in paper industries. For the purpose of this study, marital

151
status has been studied under two categories namely married and unmarried. The sample
consists 304 (28.9%) unmarried respondents and 748 (71.1%) married category.
The distribution of sample respondents according to the marital status of the
respondents and their level of perception towards job in paper industries are shown in the
following table.
TABLE NO. 5.20
MARITAL STATUS AND LEVEL OF PERCEPTION TOWARDS JOB
S.
No.
Marital Status No. of
Respondents
% Ave
rage
Range
S.D Min Max
1 Married 304 28.9 92.3 68.0 126.0 8.9
2 Unmarried 748 71.1 92.9 47.0 131.0 9.6
Total 1052 100.0
It is scrutinized from the above table that the level of perception towards job in
paper industries of the married respondents ranged between 68 and 126 with an average
of 92.3 and the level of perception of the unmarried respondents ranged between 47 and
131 with an average of 92.9. From the above analysis it concluded that the maximum
level of perception towards job perceived by the unmarried respondents in paper
industries.
With a view to find the degree of association between the marital status and level
of perception towards job in paper industries, a two-way table was prepared and it is
shown in the following table.

152
TABLE NO. 5.21
MARITAL STATUS AND LEVEL OF PERCEPTION TOWARDS JOB
(TWO-WAY TABLE)
S. No.
Marital Status Level of Perception towards job
Total Low Medium High
1
Married 36
(11.8%) 110
(36.2%) 158
(52.0%)
304
2
Unmarried 134
(17.9%) 197
(26.3%) 417
(55.7%)
748
Total 170 307 575 1052
It is determined from the above table that the percentage of high level of
perception towards job in paper industries was the highest (55.7) among the unmarried
respondents and the same was the lowest (52.0) among married respondents. The
percentage of medium level of perception towards job in paper industries was the highest
(36.2) among the married respondents and the same was the lowest (26.3) among
unmarried respondents. On the other hand, the percentage of low level of perception
towards job in paper industries was the highest (17.9) among unmarried respondents and
the same was the lowest (11.8) among married respondents.
In order to find the relationship between the marital status of the respondents and
their level of perception towards job in paper industries, the following hypothesis was
framed and tested with the help of Chi-square test and the result is shown in the following
table.
H0 : There is no significant relationship between marital status and their level
of perception towards job in paper industries.

153
H1 : There is a significant relationship between marital status and their level of
perception towards job in paper industries.
TABLE NO. 5.22
MARITAL STATUS AND LEVEL OF PERCEPTION TOWARDS JOB
(CHI-SQUARE TEST)
Factor Calculated
2
Value
Table Value
D.F
Remarks
Marital Status
12.678
5.991
2 Significant at 5%
level
It is divulged from the above table that the calculated chi-square value is greater
than the table value and the result is significant at 5% level. Hence, the hypothesis,
―marital status of the respondents and the level of perception towards job in paper
industries are not associated‖ does not hold good. From the analysis, it is found that there
is a close relationship between the marital status and level of perception towards job in
paper industries.
NUMBER OF DEPENDENTS IN THE FAMILY AND LEVEL OF PERCEPTION
TOWARDS JOB
Based on the number of dependents in their family, the respondents‘ level of
perception varies in their job in paper industries. For the purpose of the study, number of
dependents in the family has been classified into three categories namely 1-3 members, 4-
5 members and above 5 members. The sample consists 332 (31.6%) respondents having
to 1-3 members in their family, 462 (43.9%) respondents having to 4-5 members in their
family and 258 (24.5%) respondents having to above 5 members in their family.

154
The distribution of sample respondents according to the number of dependents
and level of perception towards job in paper industries are shown in the following table.
TABLE NO. 5.23
NUMBER OF DEPENDENTS IN THE FAMILY AND LEVEL OF PERCEPTION
TOWARDS JOB
S.
No.
No. of Dependents No. of
Respondents
% Ave
rage
Range
S.D Min Max
1 1-3 members 332 31.6 92.8 67.0 131.0 9.8
2 4-5 members 462 43.9 93.0 71.0 129.0 9.0
3 Above 5 members 258 24.5 92.2 47.0 123.0 9.7
Total 1052 100.0
It is extrapolated from the above table that the level of perception towards job in
paper industries among the respondents of 1-3 dependents in their family ranged between
67 and 131 with an average of 92.8. The level of perception among the respondents of 4-
5 dependents in their family ranged between 71 and 129 with an average of 93.0. The
level of perception by the respondents of more than 5 dependents in their family ranged
between 47 and 123 with an average of 92.2. From the analysis it identified that
maximum level of perception towards job in paper industries perceived by the
respondents of 4-5 dependents in a family.
With a view to find the degree of association between the number of dependents
in the family and level of perception towards job in paper industries, a two-way table was
prepared and it is exhibited in the following table.

155
TABLE NO. 5.24
NUMBER OF DEPENDENTS IN THE FAMILY AND LEVEL OF
PERCEPTION TOWARDS JOB (TWO-WAY TABLE)
S.No.
No. of Dependents Level of Perception towards job
Total Low Medium High
1
1-3 members 57
(17.2%) 95
(28.6%) 180
(54.2%)
332
2
4-5 members 56
(12.1%)
149
(32.3%)
257
(55.6%)
462
3
Above 5 members 57
(22.1%) 63
(24.4%) 138
(53.5%)
258
Total 170 307 575 1052
It is scrutinized from the above table that the percentage of high level of
perception towards job in paper industries was the highest (55.6) among the respondents
of 4-5 dependents in their family and the same was the lowest (53.5) towards the
respondents of above 5 dependents in their family. The percentage of medium level of
perception towards job in paper industries was the highest (32.3) among the respondents
of 4-5 dependents in their family and the same was the lowest (24.4) towards the
respondents of above 5 dependents in their family. The percentage of low level of
perception towards job in paper industries was the highest (22.1) among the respondents
of above 5 dependents in their family and the same was the lowest (12.1) towards the
respondents of 4-5 dependents in their family.
In order to find the relationship between the number of dependents in the family
and level of perception towards job in paper industries, the following hypothesis was
framed and tested with the help of Chi-square test and the result is shown in the following
table.

156
H0 : There is no significant relationship between number of dependents in the
family and their level of perception towards job in paper industries.
H1 : There is a significant relationship between number of dependents in the
family and their level of perception towards job in paper industries.
TABLE NO. 5.25
NUMBER OF DEPENDENTS IN THE FAMILY AND LEVEL OF
PERCEPTION TOWARDS JOB (CHI-SQUARE TEST)
Factor Calculated
2
Value
Table Value
D.F
Remarks
No. of dependents
14.182
9.488
4 Significant at 5%
level
It is divulged from the above table that the calculated chi-square value is greater
than the table value and the result is significant at 5% level. Hence, the hypothesis,
―number of dependents in the family and level of perception towards job in paper
industries are not associated‖ does not hold good. From the analysis, it is found that there
is a close relationship between the number of dependents in the family and level of
perception towards job in paper industries.
FAMILY SYSTEM AND LEVEL OF PERCEPTION TOWARDS JOB
Family system is one among the important factor to analyse the respondents‘ level
of perception towards job in paper industry. For the purpose of the study, family system
has been classified into two categories namely nuclear and joint family. The sample
consists 611 (58.1%) respondents belonged to nuclear family and 441 (41.9%)
respondents belonged to joint family.
157
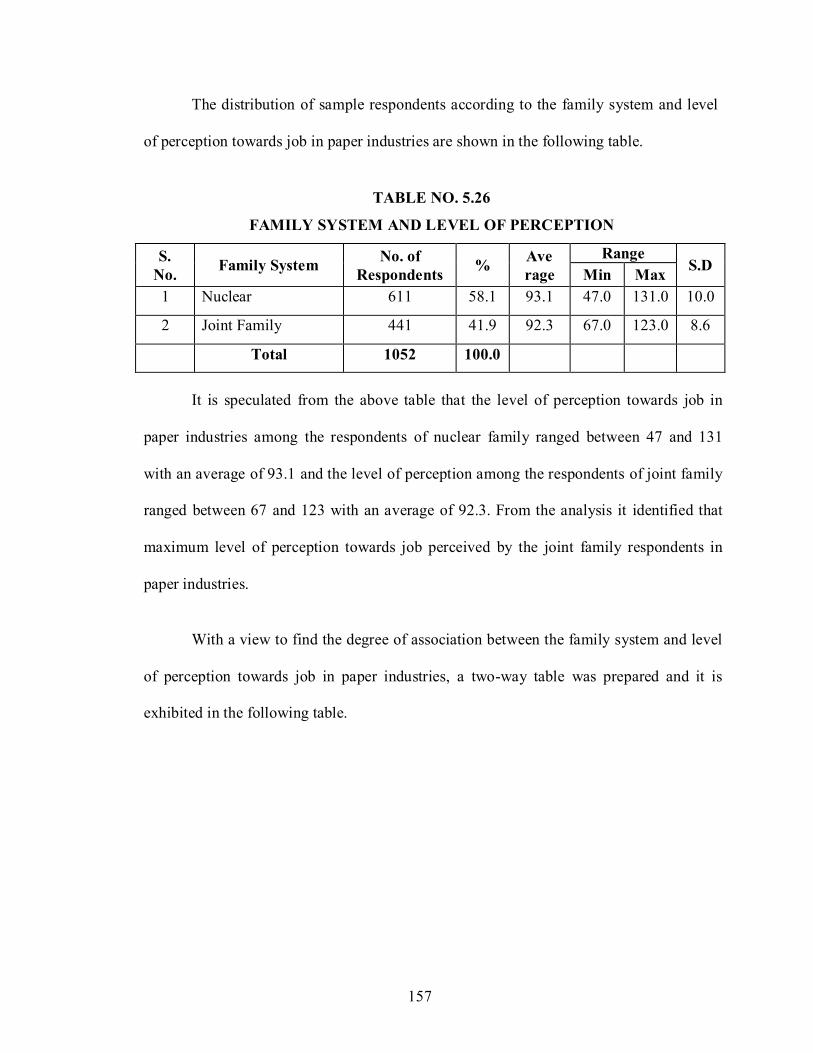
The distribution of sample respondents according to the family system and level
of perception towards job in paper industries are shown in the following table.
TABLE NO. 5.26
FAMILY SYSTEM AND LEVEL OF PERCEPTION
S.
No.
Family System No. of
Respondents
% Ave
rage
Range
S.D Min Max
1 Nuclear 611 58.1 93.1 47.0 131.0 10.0
2 Joint Family 441 41.9 92.3 67.0 123.0 8.6
Total 1052 100.0
It is speculated from the above table that the level of perception towards job in
paper industries among the respondents of nuclear family ranged between 47 and 131
with an average of 93.1 and the level of perception among the respondents of joint family
ranged between 67 and 123 with an average of 92.3. From the analysis it identified that
maximum level of perception towards job perceived by the joint family respondents in
paper industries.
With a view to find the degree of association between the family system and level
of perception towards job in paper industries, a two-way table was prepared and it is
exhibited in the following table.
158
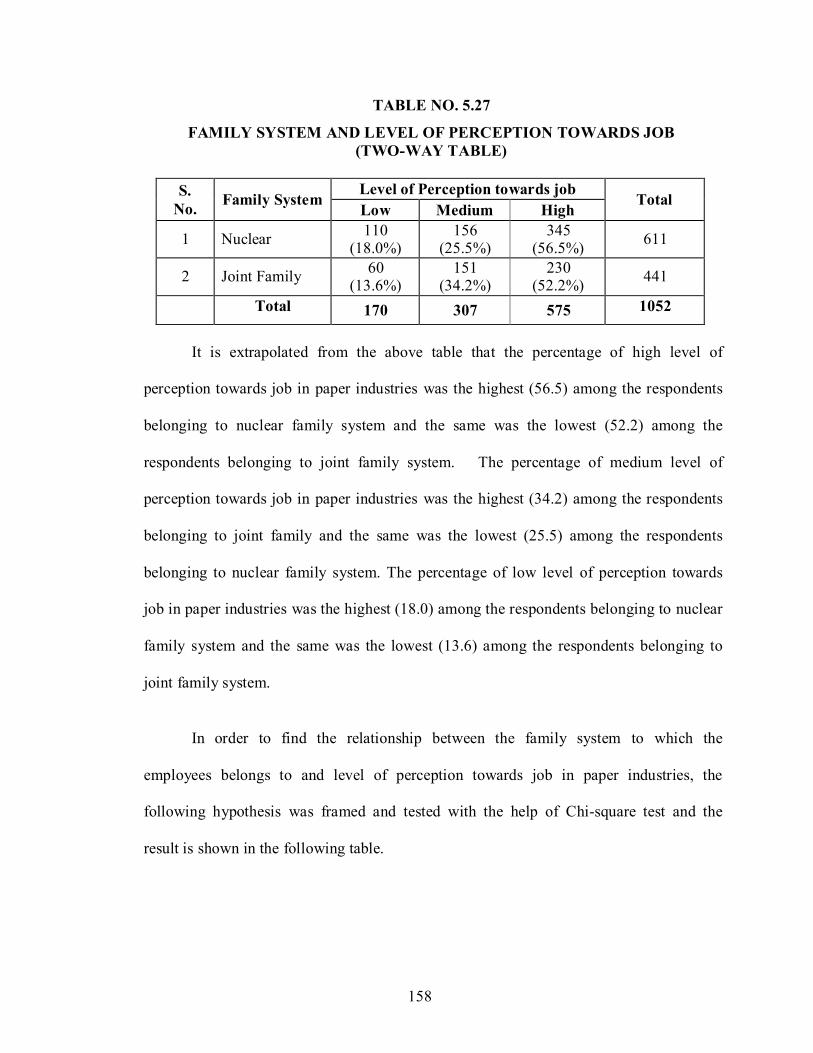
TABLE NO. 5.27
FAMILY SYSTEM AND LEVEL OF PERCEPTION TOWARDS JOB
(TWO-WAY TABLE)
S.
No.
Family System Level of Perception towards job
Total Low Medium High
1
Nuclear 110
(18.0%) 156
(25.5%) 345
(56.5%)
611
2
Joint Family 60
(13.6%) 151
(34.2%) 230
(52.2%)
441
Total 170 307 575 1052
It is extrapolated from the above table that the percentage of high level of
perception towards job in paper industries was the highest (56.5) among the respondents
belonging to nuclear family system and the same was the lowest (52.2) among the
respondents belonging to joint family system. The percentage of medium level of
perception towards job in paper industries was the highest (34.2) among the respondents
belonging to joint family and the same was the lowest (25.5) among the respondents
belonging to nuclear family system. The percentage of low level of perception towards
job in paper industries was the highest (18.0) among the respondents belonging to nuclear
family system and the same was the lowest (13.6) among the respondents belonging to
joint family system.
In order to find the relationship between the family system to which the
employees belongs to and level of perception towards job in paper industries, the
following hypothesis was framed and tested with the help of Chi-square test and the
result is shown in the following table.

159
H0 : There is no significant relationship between family system to which the
employees belong to and their level of perception towards job in paper
industries.
H1 : There is a significant relationship between family system to which the
employees belong to and their level of perception towards job in paper
industries.
TABLE NO. 5.28
FAMILY SYSTEM AND LEVEL OF PERCEPTION TOWARDS JOB (CHI-
SQUARE TEST)
Factor Calculated
2
Value
Table Value
D.F
Remarks
Family system
10.592
5.992
2 Significant at 5%
level
It is divulged from the above table that the calculated chi-square value is greater
than the table value and the result is significant at 5% level. Hence, the hypothesis,
―family system of the respondents and their level of perception towards job in paper
industries are not associated‖ does not hold good. From the analysis, it is found that there
is a close relationship between the family system of the respondents and their level of
perception towards job in paper industries.
EXPERIENCE AND LEVEL OF PERCEPTION TOWARDS JOB
Experience makes everyone to lead a comfortable life in society. According to
the respondents‘ year of experience, their level of perception towards job will be vary.
For the purpose of this study experience gained by the individual has been classified into
four strata viz., upto 5 years experience, between 6 and 10 years experience, between 11

160
and 15 years experience and above 15 years experience. The sample consists of 287
(27.3%) respondents having 1-5 years experience, 322 (30.6%) respondents having
between 6 and 10 years experience, 276 (26.2%) respondents having 11 and 15 years
experience and 167 (15.9%) respondents having above 15 years experience.
The distribution of sample respondents according to the experience and level of
perception towards job in paper industries are shown in the following table.
TABLE NO. 5.29
EXPERIENCE AND LEVEL OF PERCEPTION TOWARDS JOB
S.
No.
Experience No. of
Respondents
% Ave
rage
Range
S.D Min Max
1 Upto 5 years 287 27.3 92.1 47.0 125.0 9.4
2 6 to 10 years 322 30.6 92.7 68.0 131.0 9.9
3 11 to 15 years 276 26.2 93.3 67.0 123.0 9.4
4 Above 15 years 167 15.9 93.0 71.0 128.0 8.5
Total 1052 100.0
It is speculated from the above table that the level of perception towards job in
paper industries among the respondents who gained upto 5 years of experience ranged
between 47 and 125 with an average of 92.1. The level of perception among the
respondents who gained 6 to 10 years of experience ranged between 68 and 131 with an
average of 92.7. The level of perception by the respondents who gained 11 and 15 years
of experience ranges between 67 and 123 with an average of 93.3. The level of
perception by the respondents who gained above 15 years of experience ranged between
71 and 128 with an average of 93.0. From the analysis it identified that maximum level of

161
perception towards job was perceived by the respondents who gained between 11 and 15
years of experience in paper industries.
With a view to find the degree of association between the experience and level of
perception towards job in paper industries, a two-way table was prepared and it is
exhibited in the following table.
TABLE NO. 5.30
EXPERIENCE AND LEVEL OF PERCEPTION TOWARDS JOB
(TWO-WAY TABLE)
S.
No.
Experience Level of Perception towards job
Total Low Medium High
1
Upto 5 years 50
(17.4%) 89
(31.0%) 148
(51.6%)
287
2
6 to 10 years 67
(20.7%) 84
(26.0%) 172
(53.3%)
322
3
11 to 15 years 28
(10.1%) 94
(34.1%) 154
(55.8%)
276
4
Above 15 years 25
(15.0%) 41
(24.6%) 101
(60.5%)
167
Total 170 308 575 1052
It is observed from the above table that the percentage of high level of perception
towards job in paper industries was the highest (60.5) among the respondents who gained
above 15 years of experience and the same was the lowest (51.6) among the respondents
who gained 1-5 years of experience. The percentage of medium level of perception
towards job in paper industries was the highest (34.1) among the respondents who gained
between 11 and 15 years of experience and the same was the lowest (24.6) among the
respondents who gained above 15 years of experience. The percentage of low level of
perception towards job in paper industries was the highest (20.7) among the respondents

162
who gained between 6 and 10 years of experience and the same was the lowest (10.1)
among the respondents who gained between 11 and 15 years of experience.
In order to find the relationship between the experience and level of perception
towards job in paper industries, the following hypothesis was framed and tested with the
help of Chi-square test and the result is shown in the following table.
H0 : There is no significant relationship between experience and their level of
perception towards job in paper industries.
H1 : There is a significant relationship between experience and their level of
perception towards job in paper industries.
TABLE NO. 5.31
EXPERIENCE AND LEVEL OF PERCEPTION TOWARDS JOB
(CHI-SQUARE TEST)
Factor Calculated
2
Value
Table Value
D.F
Remarks
Experience
17.445
12.592
6 Significant at 5%
level
It is conjectured from the above table that the calculated chi-square value is
greater than the table value and the result is significant at 5% level. Hence, the
hypothesis, ―experience of the respondents and their level of perception towards job in
paper industries are not associated‖ does not hold good. From the analysis, it is found that
there is a close relationship between experience and level of perception towards job in
paper industries.
163
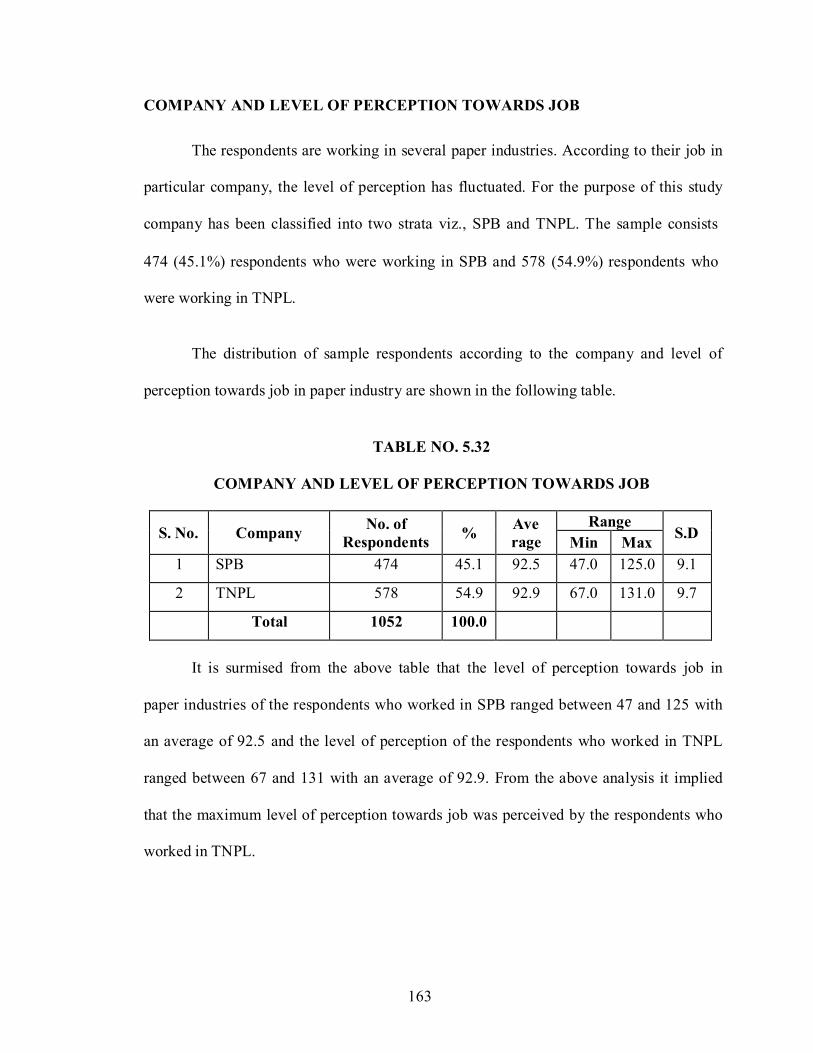
COMPANY AND LEVEL OF PERCEPTION TOWARDS JOB
The respondents are working in several paper industries. According to their job in
particular company, the level of perception has fluctuated. For the purpose of this study
company has been classified into two strata viz., SPB and TNPL. The sample consists
474 (45.1%) respondents who were working in SPB and 578 (54.9%) respondents who
were working in TNPL.
The distribution of sample respondents according to the company and level of
perception towards job in paper industry are shown in the following table.
TABLE NO. 5.32
COMPANY AND LEVEL OF PERCEPTION TOWARDS JOB
S. No.
Company No. of
Respondents
% Ave
rage
Range
S.D Min Max
1 SPB 474 45.1 92.5 47.0 125.0 9.1
2 TNPL 578 54.9 92.9 67.0 131.0 9.7
Total 1052 100.0
It is surmised from the above table that the level of perception towards job in
paper industries of the respondents who worked in SPB ranged between 47 and 125 with
an average of 92.5 and the level of perception of the respondents who worked in TNPL
ranged between 67 and 131 with an average of 92.9. From the above analysis it implied
that the maximum level of perception towards job was perceived by the respondents who
worked in TNPL.
164
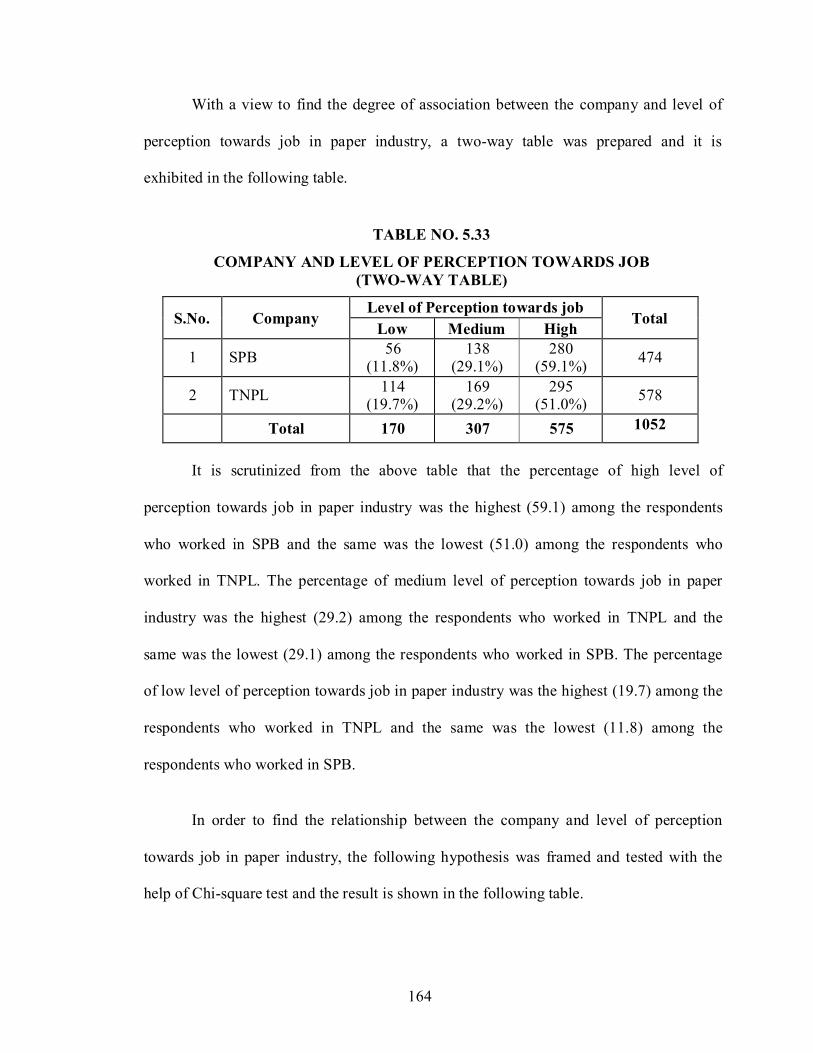
With a view to find the degree of association between the company and level of
perception towards job in paper industry, a two-way table was prepared and it is
exhibited in the following table.
TABLE NO. 5.33
COMPANY AND LEVEL OF PERCEPTION TOWARDS JOB
(TWO-WAY TABLE)
S.No.
Company Level of Perception towards job
Total Low Medium High
1
SPB 56
(11.8%) 138
(29.1%) 280
(59.1%)
474
2
TNPL 114
(19.7%) 169
(29.2%) 295
(51.0%)
578
Total 170 307 575 1052
It is scrutinized from the above table that the percentage of high level of
perception towards job in paper industry was the highest (59.1) among the respondents
who worked in SPB and the same was the lowest (51.0) among the respondents who
worked in TNPL. The percentage of medium level of perception towards job in paper
industry was the highest (29.2) among the respondents who worked in TNPL and the
same was the lowest (29.1) among the respondents who worked in SPB. The percentage
of low level of perception towards job in paper industry was the highest (19.7) among the
respondents who worked in TNPL and the same was the lowest (11.8) among the
respondents who worked in SPB.
In order to find the relationship between the company and level of perception
towards job in paper industry, the following hypothesis was framed and tested with the
help of Chi-square test and the result is shown in the following table.
165
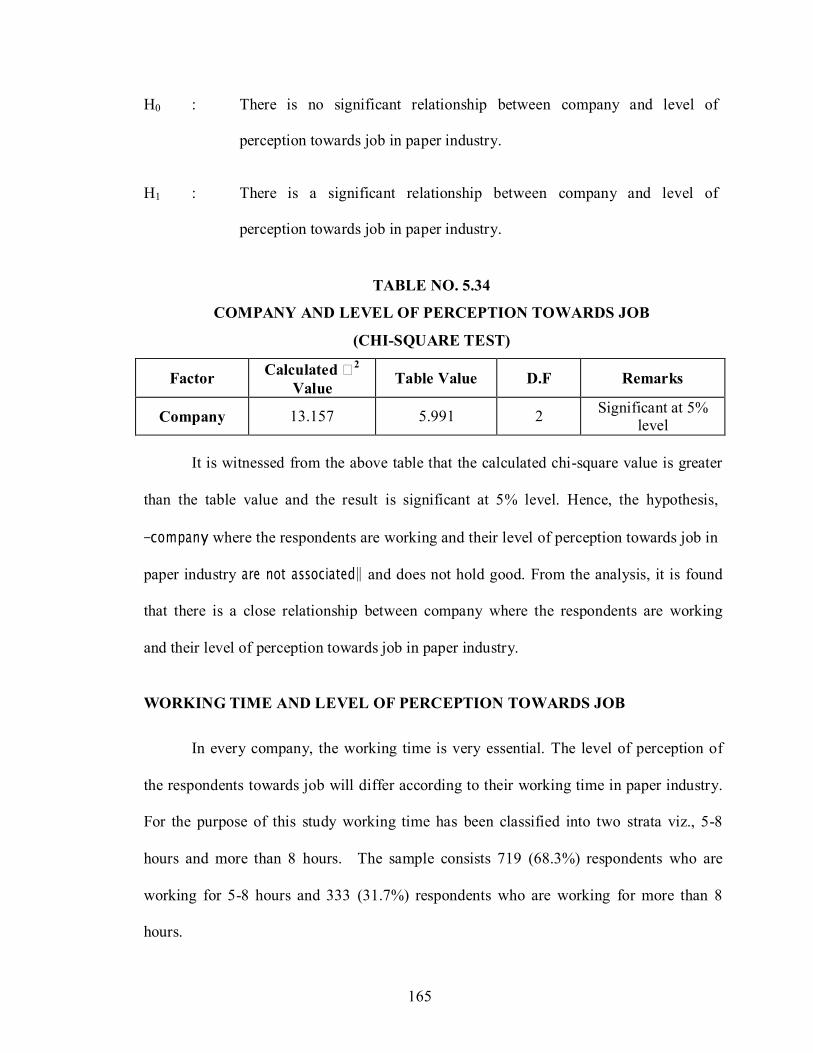
H0 : There is no significant relationship between company and level of
perception towards job in paper industry.
H1 : There is a significant relationship between company and level of
perception towards job in paper industry.
TABLE NO. 5.34
COMPANY AND LEVEL OF PERCEPTION TOWARDS JOB
(CHI-SQUARE TEST)
Factor Calculated
2
Value
Table Value
D.F
Remarks
Company
13.157
5.991
2 Significant at 5%
level
It is witnessed from the above table that the calculated chi-square value is greater
than the table value and the result is significant at 5% level. Hence, the hypothesis,
―company where the respondents are working and their level of perception towards job in
paper industry are not associated‖ and does not hold good. From the analysis, it is found
that there is a close relationship between company where the respondents are working
and their level of perception towards job in paper industry.
WORKING TIME AND LEVEL OF PERCEPTION TOWARDS JOB
In every company, the working time is very essential. The level of perception of
the respondents towards job will differ according to their working time in paper industry.
For the purpose of this study working time has been classified into two strata viz., 5-8
hours and more than 8 hours. The sample consists 719 (68.3%) respondents who are
working for 5-8 hours and 333 (31.7%) respondents who are working for more than 8
hours.

166
The distribution of sample respondents according to the working time and level of
perception towards job in paper industry are shown in the following table.
TABLE NO. 5.35
WORKING TIME AND LEVEL OF PERCEPTION TOWARDS JOB
S.
No.
Working time No. of
Respondents
% Ave
rage
Range
S.D Min Max
1 5-8 hours 719 68.3 92.5 67.0 131.0 9.1
2 More than 8 hours 333 31.7 93.2 47.0 128.0 10.1
Total 1052 100.0
It could be inferred from the above table that the level of perception towards job
in paper industry of the respondents who worked for 5-8 hours ranged between 67 and
131 with an average of 92.5 and the level of perception of the respondents who worked
for more than 8 hours ranged between 47 and 128 with an average of 93.2. It is implied
from the above analysis that the maximum level of perception towards job in paper
industry was perceived by the respondents who worked for more than 8 hours.
With a view to find the degree of association between the working time and level
of perception towards job in paper industry, a two-way table was prepared and it is
exhibited in the following table.

167
TABLE NO. 5.36
WORKING TIME AND LEVEL OF PERCEPTION TOWARDS JOB
(TWO-WAY TABLE)
S.No.
Working time Level of Perception towards job
Total Low Medium High
1
5-8 hours 105
(14.6%)
229
(31.8%)
385
(53.5%)
719
2
More than 8 hours 65
(19.5%)
78
(23.4%)
190
(57.1%)
333
Total 170 307 575 1052
It could be examined from the above table that the percentage of high level of
perception towards job in paper industry was the highest (57.1) among the respondents
who worked for more than 8 hours and the same was the lowest (53.5) among the
respondents who worked for 5-8 hours. The percentage of medium level of perception
towards job in paper industry was the highest (31.8) among the respondents who worked
for 5-8 hours and the same was the lowest (23.4) among the respondents who worked for
more than 8 hours. The percentage of low level of perception towards job in paper
industry was the highest (19.5) among the respondents who worked for more than 8
hours, and the same was the lowest (14.6) among the respondents who worked for 5-8
hours in paper industry.
In order to find the relationship between the working time and level of perception
towards job in paper industry, the following hypothesis was framed and tested with the
help of Chi-square test and the result is shown in the following table.

168
H0 : There is no significant relationship between working time and level of
perception towards job in paper industry.
H1 : There is a significant relationship between working time and level of
perception towards job in paper industry.
TABLE NO. 5.37
WORKING TIME AND LEVEL OF PERCEPTION TOWARDS JOB
(CHI-SQUARE TEST)
Factor Calculated
2
Value
Table Value
D.F
Remarks
Working
Time
9.454
5.991
2 Significant at 5%
level
It is extrapolated from the above table that the calculated chi-square value is
greater than the table value and the result is significant at 5% level. Hence, the
hypothesis, ―working time of the respondents and their level of perception towards job in
paper industry are not associated‖ and does not hold good. From the analysis, it is found
that there is a close relationship between working time of the respondents and their level
of perception towards job in paper industry.
169
5.3 LEVEL OF OCCUPATIONAL STRESS AMONG EMPLOYEES
TOWARDS THEIR WORK - ANOVA – ANALYSIS
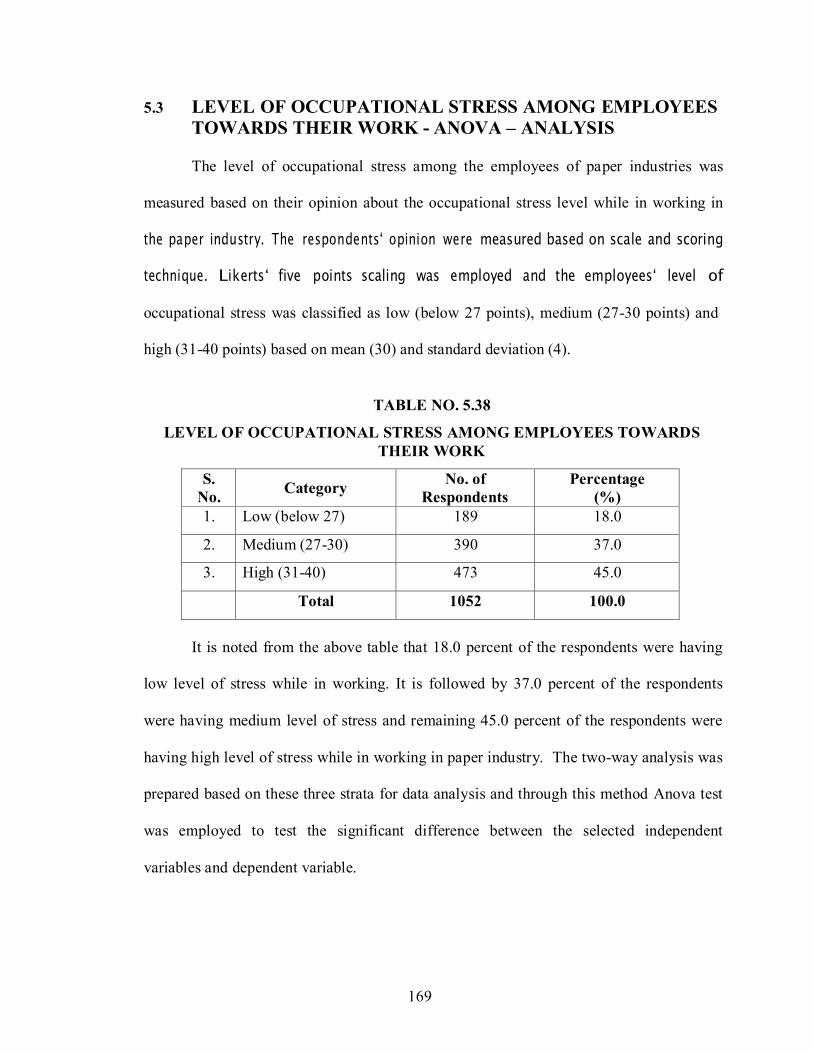
The level of occupational stress among the employees of paper industries was
measured based on their opinion about the occupational stress level while in working in
the paper industry. The respondents‘ opinion were measured based on scale and scoring
technique. Likerts‘ five points scaling was employed and the employees‘ level of
occupational stress was classified as low (below 27 points), medium (27-30 points) and
high (31-40 points) based on mean (30) and standard deviation (4).
TABLE NO. 5.38
LEVEL OF OCCUPATIONAL STRESS AMONG EMPLOYEES TOWARDS
THEIR WORK
S.
No.
Category No. of
Respondents
Percentage
(%)
1. Low (below 27) 189 18.0
2. Medium (27-30) 390 37.0
3. High (31-40) 473 45.0
Total 1052 100.0
It is noted from the above table that 18.0 percent of the respondents were having
low level of stress while in working. It is followed by 37.0 percent of the respondents
were having medium level of stress and remaining 45.0 percent of the respondents were
having high level of stress while in working in paper industry. The two-way analysis was
prepared based on these three strata for data analysis and through this method Anova test
was employed to test the significant difference between the selected independent
variables and dependent variable.

170
AGE AND IMPACT OF OCCUPATIONAL STRESS
The distribution of sample respondents according to the age of the respondents
and their impact of occupational stress in paper industry are shown in the following table.
TABLE NO. 5.39
AGE AND IMPACT OF OCCUPATIONAL STRESS
S.
No.
Age No. of
Respondents
% Ave
rage
Range
S.D Min Max
1 Below 25 yrs. 270 25.7 29.9 12.0 45.0 4.5
2 25-35 yrs. 284 27.0 30.2 17.0 45.0 4.1
3 36-45 yrs. 304 28.9 30.1 12.0 44.0 4.0
4 Above 45 yrs. 194 18.4 30.5 21.0 41.0 3.8
Total 1052 100.0
It could be observed from the above table that the impact of occupational stress in
paper industry perceived by the respondents who belong to the age group of below 25
years ranged between 12 and 45 with an average of 29.9. The respondents with the age
group between 25 and 35 years revealed that their impact of occupational stress in paper
industry ranged between 17 and 45 with an average of 30.2. The impact of occupational
stress in paper industry perceived by the respondents between 35 and 45 years age group
ranged between 12 and 44 with an average of 30.1. Finally, the impact of occupational
stress in paper industry perceived by the respondents who are above 45 years age group
ranged between 21 and 41 with an average of 30.5. It is inferred from the analysis that the
maximum impact of occupational stress was among the age group of above 45 years.
171
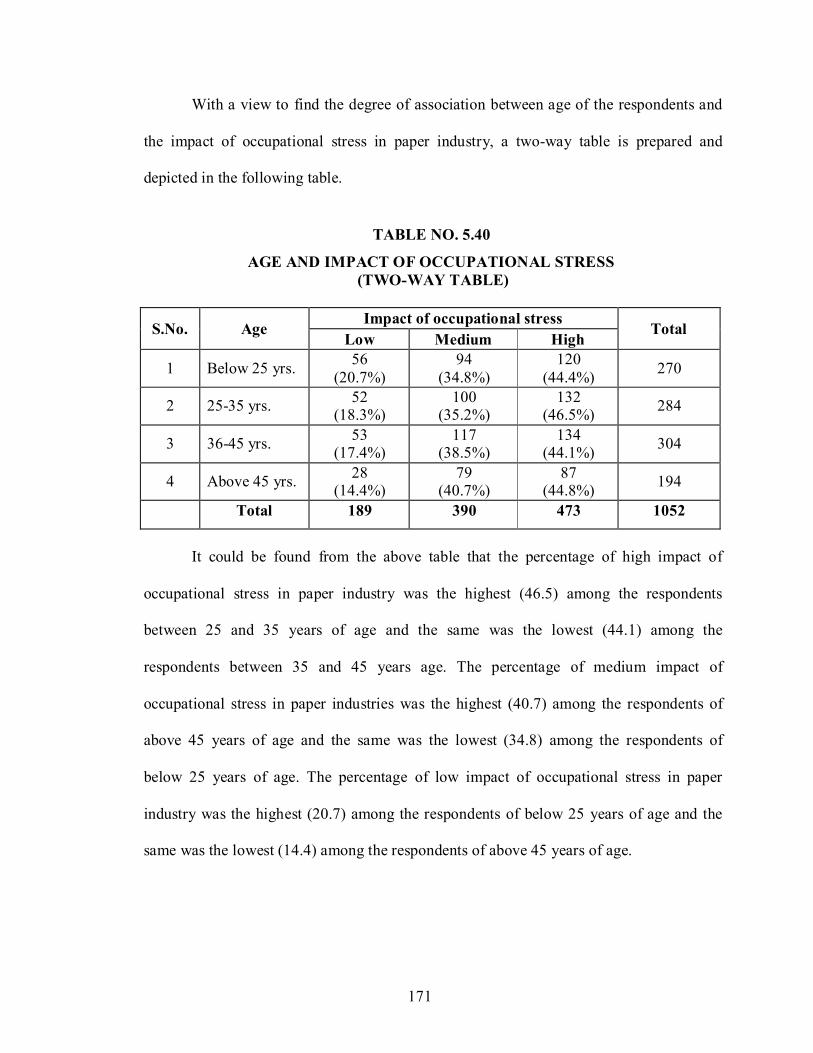
With a view to find the degree of association between age of the respondents and
the impact of occupational stress in paper industry, a two-way table is prepared and
depicted in the following table.
TABLE NO. 5.40
AGE AND IMPACT OF OCCUPATIONAL STRESS
(TWO-WAY TABLE)
S.No.
Age Impact of occupational stress
Total Low Medium High
1
Below 25 yrs. 56
(20.7%)
94
(34.8%)
120
(44.4%)
270
2
25-35 yrs. 52
(18.3%) 100
(35.2%) 132
(46.5%)
284
3
36-45 yrs. 53
(17.4%) 117
(38.5%) 134
(44.1%)
304
4
Above 45 yrs. 28
(14.4%) 79
(40.7%) 87
(44.8%)
194
Total 189 390 473 1052
It could be found from the above table that the percentage of high impact of
occupational stress in paper industry was the highest (46.5) among the respondents
between 25 and 35 years of age and the same was the lowest (44.1) among the
respondents between 35 and 45 years age. The percentage of medium impact of
occupational stress in paper industries was the highest (40.7) among the respondents of
above 45 years of age and the same was the lowest (34.8) among the respondents of
below 25 years of age. The percentage of low impact of occupational stress in paper
industry was the highest (20.7) among the respondents of below 25 years of age and the
same was the lowest (14.4) among the respondents of above 45 years of age.

172
In order to find the relationship between the age of the respondents and impact of
occupational stress in paper industry, the following hypothesis was framed and tested
with the help of Anova test and the result is shown in the following table.
H0 : There is no significant difference between age of the respondents and
impact of occupational stress in paper industry.
H1 : There is a significant difference between age of the respondents and
impact of occupational stress in paper industry.
TABLE NO. 5.41
AGE AND IMPACT OF OCCUPATIONAL STRESS
(ANOVA TEST)
Source SS DF MS F S
Between Groups
4.307
2
2.153
1.920
Not significant Within Groups
1176.412
1049
1.121
Total 1180.719 1051
It is examined from the above table that the calculated F value is less than the
table value and the result is not significant. Hence, the hypothesis, ―Age of the
respondents and the impact of occupational stress are not associated‖ is accepted. From
the analysis, it is found that there is no significant difference between the age of the
respondents and the impact of occupational stress.
GENDER AND IMPACT OF OCCUPATIONAL STRESS
The distribution of sample respondents according to the gender and the impact of
occupational stress in paper industry are shown in the following table.
173
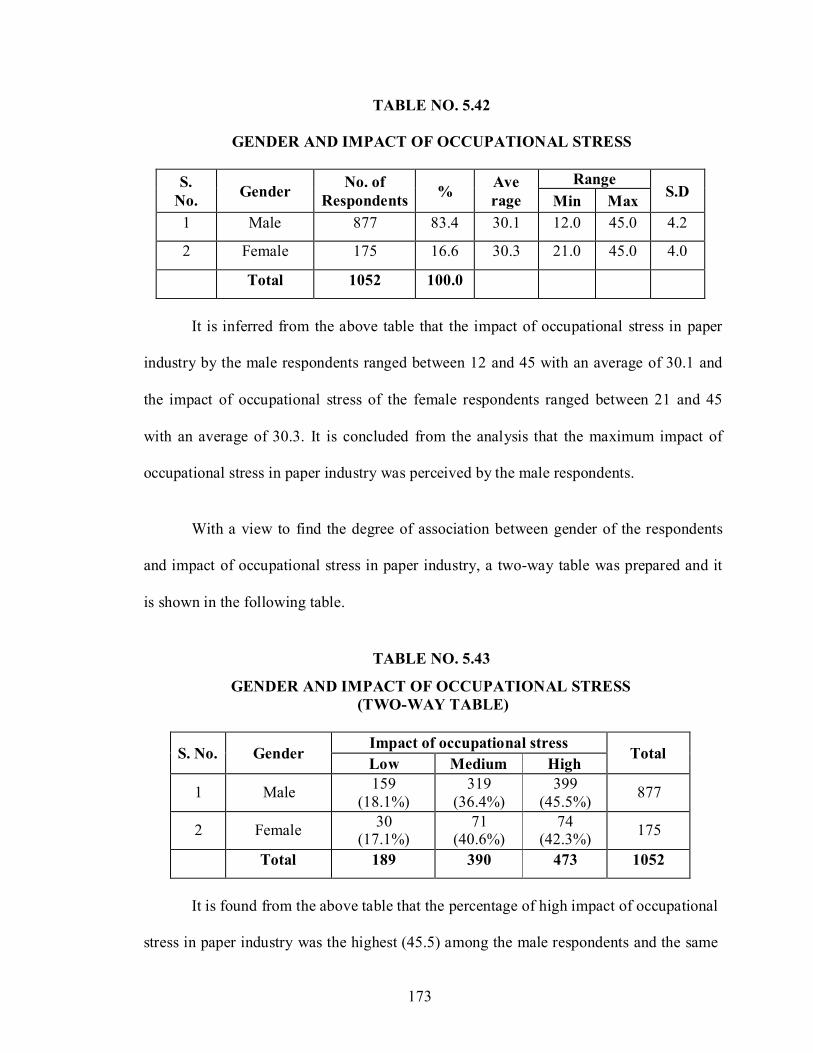
TABLE NO. 5.42
GENDER AND IMPACT OF OCCUPATIONAL STRESS
S.
No.
Gender No. of
Respondents
% Ave
rage
Range
S.D Min Max
1 Male 877 83.4 30.1 12.0 45.0 4.2
2 Female 175 16.6 30.3 21.0 45.0 4.0
Total 1052 100.0
It is inferred from the above table that the impact of occupational stress in paper
industry by the male respondents ranged between 12 and 45 with an average of 30.1 and
the impact of occupational stress of the female respondents ranged between 21 and 45
with an average of 30.3. It is concluded from the analysis that the maximum impact of
occupational stress in paper industry was perceived by the male respondents.
With a view to find the degree of association between gender of the respondents
and impact of occupational stress in paper industry, a two-way table was prepared and it
is shown in the following table.
TABLE NO. 5.43
GENDER AND IMPACT OF OCCUPATIONAL STRESS
(TWO-WAY TABLE)
S. No.
Gender Impact of occupational stress
Total Low Medium High
1
Male 159
(18.1%)
319
(36.4%)
399
(45.5%)
877
2
Female 30
(17.1%) 71
(40.6%) 74
(42.3%)
175
Total 189 390 473 1052
It is found from the above table that the percentage of high impact of occupational
stress in paper industry was the highest (45.5) among the male respondents and the same

174
was the lowest (42.3) among the female respondents. The percentage of medium impact
of occupational stress in paper industry was the highest (40.6) among the female
respondents and the same was the lowest (36.4) among the male respondents. The
percentage of low impact of occupational stress in paper industry was the highest (18.1)
among the male respondents and the same was the lowest (17.1) among the female
respondents.
In order to find the relationship between the gender of the respondents and the
impact of occupational stress in paper industry, the following hypothesis was framed and
tested with the help of Anova test and the result is shown in the following table.
H0 : There is no significant difference between gender and
occupational stress in paper industry.
impact of
H1 : There is a significant difference between gender and
occupational stress in paper industry.
impact
of
TABLE NO. 5.44
GENDER AND IMPACT OF OCCUPATIONAL STRESS
(ANOVA TEST)
Source SS DF MS F S
Between Groups
.153
2
7.675E-02
.552
Not significant Within
Groups
145.735
1049
.139
Total 145.889 1051
It is witnessed from the above table that the calculated F value is less than the
table value and the result is not significant. Hence, the hypothesis, ―Gender of the
175
respondents and the impact of occupational stress are not associated‖ is accepted. From
the analysis, it is found that there is no significant difference between the gender of the
respondents and the impact of occupational stress.
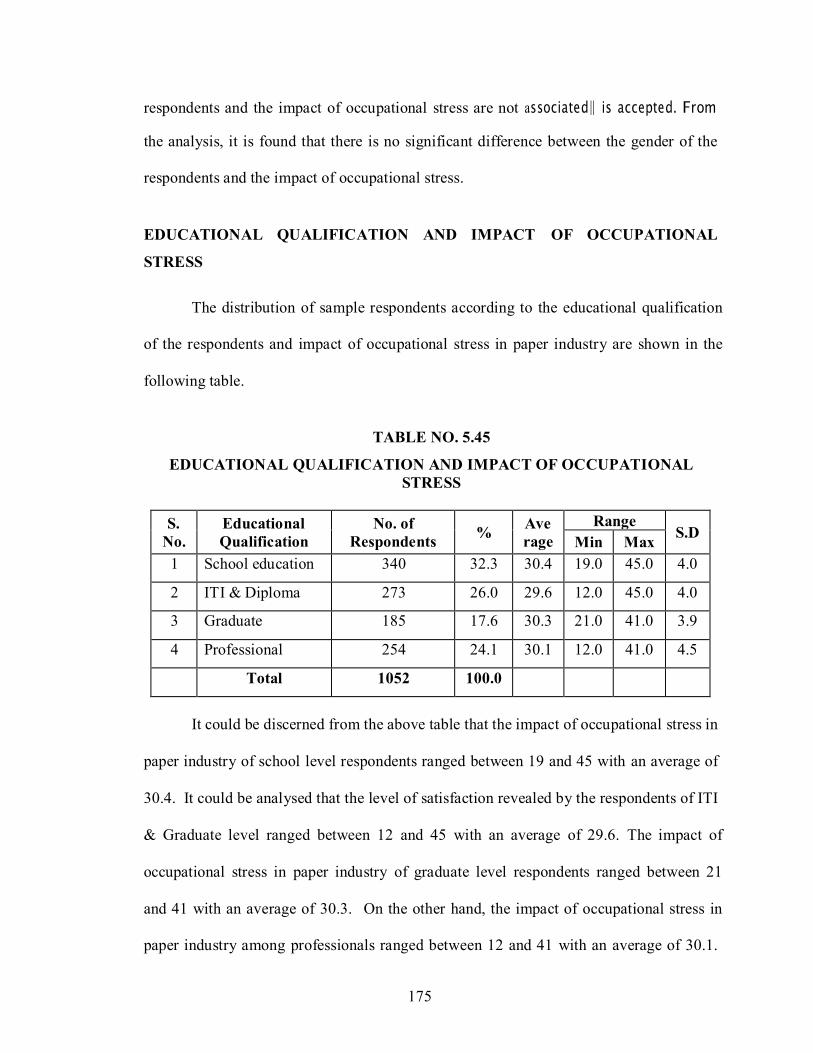
EDUCATIONAL QUALIFICATION AND IMPACT OF OCCUPATIONAL
STRESS
The distribution of sample respondents according to the educational qualification
of the respondents and impact of occupational stress in paper industry are shown in the
following table.
TABLE NO. 5.45
EDUCATIONAL QUALIFICATION AND IMPACT OF OCCUPATIONAL
STRESS
S.
No.
Educational
Qualification
No. of
Respondents
% Ave
rage
Range
S.D Min Max
1 School education 340 32.3 30.4 19.0 45.0 4.0
2 ITI & Diploma 273 26.0 29.6 12.0 45.0 4.0
3 Graduate 185 17.6 30.3 21.0 41.0 3.9
4 Professional 254 24.1 30.1 12.0 41.0 4.5
Total 1052 100.0
It could be discerned from the above table that the impact of occupational stress in
paper industry of school level respondents ranged between 19 and 45 with an average of
30.4. It could be analysed that the level of satisfaction revealed by the respondents of ITI
& Graduate level ranged between 12 and 45 with an average of 29.6. The impact of
occupational stress in paper industry of graduate level respondents ranged between 21
and 41 with an average of 30.3. On the other hand, the impact of occupational stress in
paper industry among professionals ranged between 12 and 41 with an average of 30.1.
176
From the analysis it is identified that the maximum impact of occupational stress in paper
industry was attained by the respondents who did their ‗schooling‘.
With a view to find the degree of association, educational qualification of the
respondents and impact of occupational stress in paper industry, a two-way table was
prepared and it is shown in the following table.
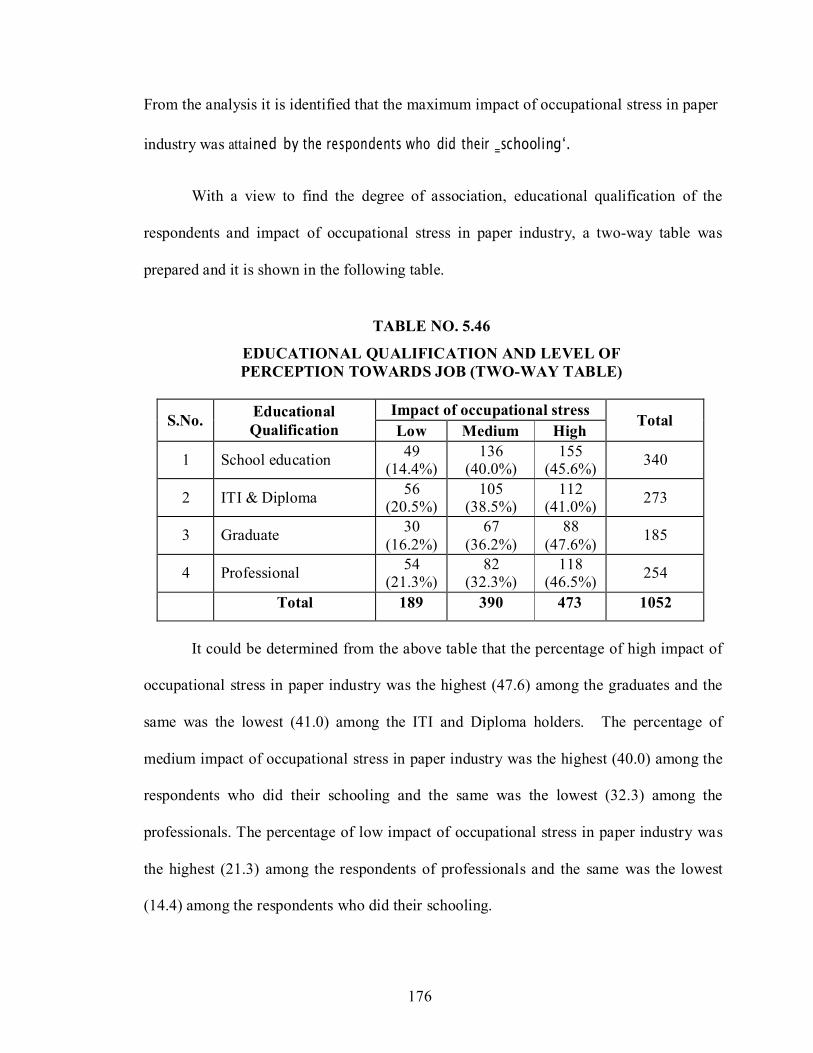
TABLE NO. 5.46
EDUCATIONAL QUALIFICATION AND LEVEL OF
PERCEPTION TOWARDS JOB (TWO-WAY TABLE)
S.No. Educational
Qualification
Impact of occupational stress
Total Low Medium High
1
School education 49
(14.4%) 136
(40.0%) 155
(45.6%)
340
2
ITI & Diploma 56
(20.5%) 105
(38.5%) 112
(41.0%)
273
3
Graduate 30
(16.2%)
67
(36.2%)
88
(47.6%)
185
4
Professional 54
(21.3%) 82
(32.3%) 118
(46.5%)
254
Total 189 390 473 1052
It could be determined from the above table that the percentage of high impact of
occupational stress in paper industry was the highest (47.6) among the graduates and the
same was the lowest (41.0) among the ITI and Diploma holders. The percentage of
medium impact of occupational stress in paper industry was the highest (40.0) among the
respondents who did their schooling and the same was the lowest (32.3) among the
professionals. The percentage of low impact of occupational stress in paper industry was
the highest (21.3) among the respondents of professionals and the same was the lowest
(14.4) among the respondents who did their schooling.
177
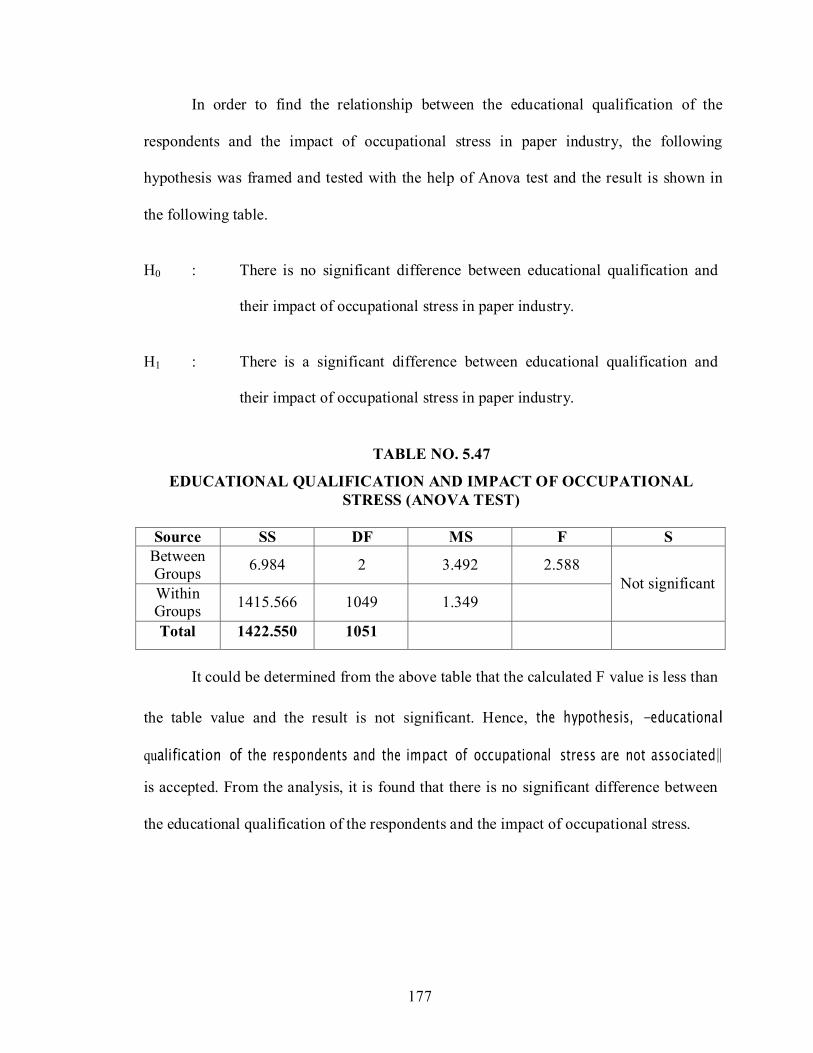
In order to find the relationship between the educational qualification of the
respondents and the impact of occupational stress in paper industry, the following
hypothesis was framed and tested with the help of Anova test and the result is shown in
the following table.
H0 : There is no significant difference between educational qualification and
their impact of occupational stress in paper industry.
H1 : There is a significant difference between educational qualification and
their impact of occupational stress in paper industry.
TABLE NO. 5.47
EDUCATIONAL QUALIFICATION AND IMPACT OF OCCUPATIONAL
STRESS (ANOVA TEST)
Source SS DF MS F S
Between Groups
6.984
2
3.492
2.588
Not significant Within Groups
1415.566
1049
1.349
Total 1422.550 1051
It could be determined from the above table that the calculated F value is less than
the table value and the result is not significant. Hence, the hypothesis, ―educational
qualification of the respondents and the impact of occupational stress are not associated‖
is accepted. From the analysis, it is found that there is no significant difference between
the educational qualification of the respondents and the impact of occupational stress.

178
DESIGNATION AND IMPACT OF OCCUPATIONAL STRESS
The distribution of sample respondents according to the designation and impact of
occupational stress in paper industry are shown in the following table.
TABLE NO. 5.48
DESIGNATION AND IMPACT OF OCCUPATIONAL STRESS
S. No.
Designation No. of
Respondents
% Ave
rage
Range
S.D Min Max
1 Manager 250 27.0 30.1 12.0 44.0 4.6
2 Staff 284 23.8 30.4 21.0 44.0 4.0
3. Worker 518 49.2 30.0 17.0 45.0 4.0
Total 1052 100.0
It could be inferred from the above table that the impact of occupational stress in
paper industry of the managers ranged between 12 and 44 with an average of 30.1. The
level of perception among the staffs ranged between 21 and 44 with an average of 30.4.
Finally, the level of perception among workers ranged between 17 and 45 with an
average of 30. From the analysis it is identified that maximum impact of occupational
stress in paper industry was attained by the staffs.
With a view to find the degree of association, educational qualification of the
respondents and impact of occupational stress in paper industry, a two-way table was
prepared and it is shown in the following table.
179
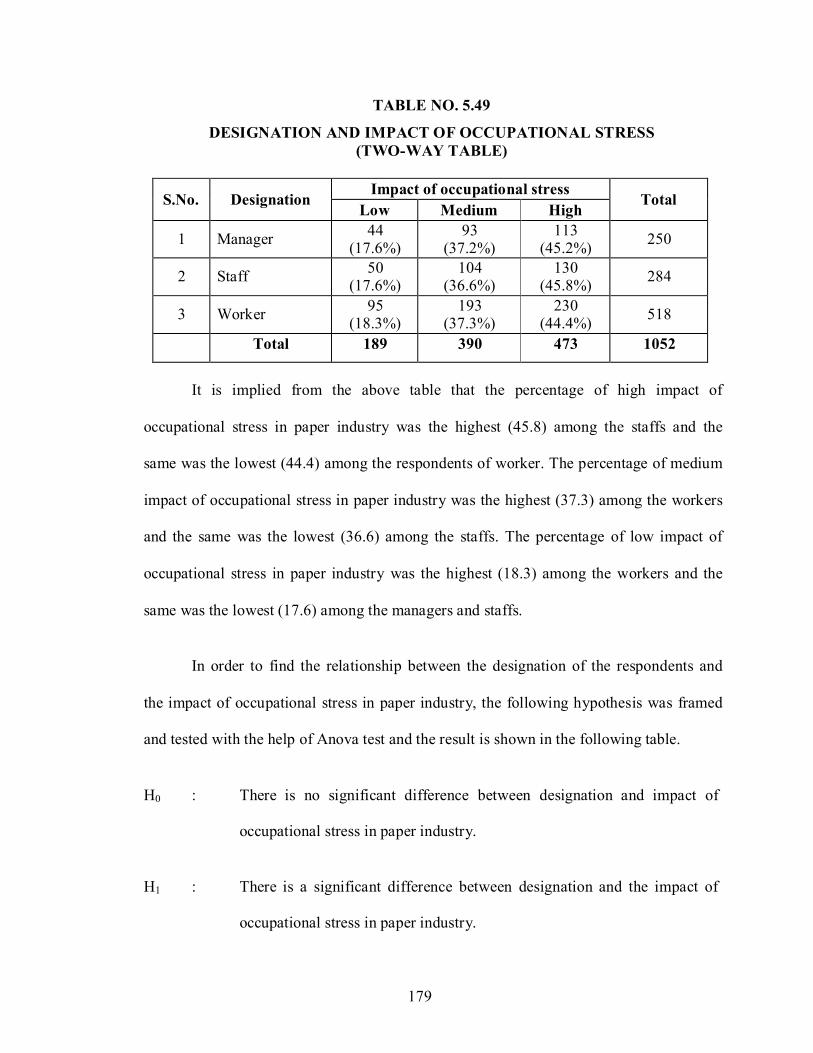
TABLE NO. 5.49
DESIGNATION AND IMPACT OF OCCUPATIONAL STRESS
(TWO-WAY TABLE)
S.No.
Designation Impact of occupational stress
Total Low Medium High
1
Manager 44
(17.6%) 93
(37.2%) 113
(45.2%)
250
2
Staff 50
(17.6%) 104
(36.6%) 130
(45.8%)
284
3
Worker 95
(18.3%) 193
(37.3%) 230
(44.4%)
518
Total 189 390 473 1052
It is implied from the above table that the percentage of high impact of
occupational stress in paper industry was the highest (45.8) among the staffs and the
same was the lowest (44.4) among the respondents of worker. The percentage of medium
impact of occupational stress in paper industry was the highest (37.3) among the workers
and the same was the lowest (36.6) among the staffs. The percentage of low impact of
occupational stress in paper industry was the highest (18.3) among the workers and the
same was the lowest (17.6) among the managers and staffs.
In order to find the relationship between the designation of the respondents and
the impact of occupational stress in paper industry, the following hypothesis was framed
and tested with the help of Anova test and the result is shown in the following table.
H0 : There is no significant difference between designation and impact of
occupational stress in paper industry.
H1 : There is a significant difference between designation and the impact of
occupational stress in paper industry.
180
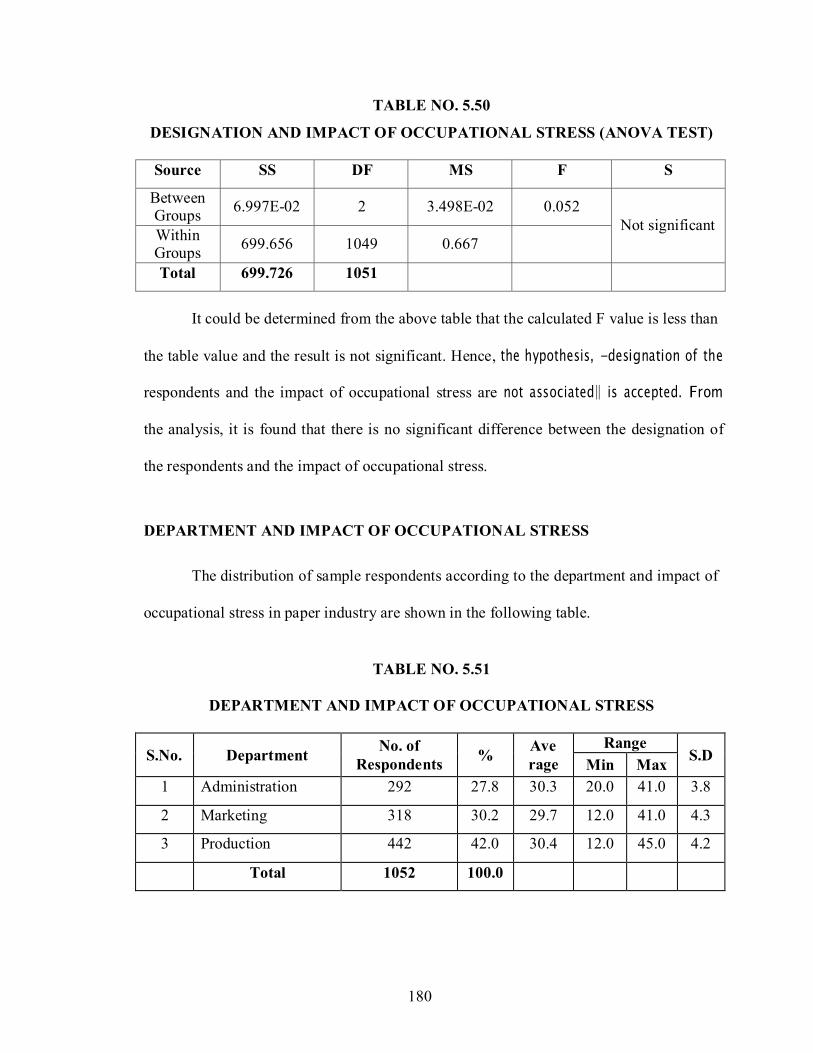
TABLE NO. 5.50
DESIGNATION AND IMPACT OF OCCUPATIONAL STRESS (ANOVA TEST)
Source SS DF MS F S
Between Groups
6.997E-02
2
3.498E-02
0.052
Not significant Within Groups
699.656
1049
0.667
Total 699.726 1051
It could be determined from the above table that the calculated F value is less than
the table value and the result is not significant. Hence, the hypothesis, ―designation of the
respondents and the impact of occupational stress are not associated‖ is accepted. From
the analysis, it is found that there is no significant difference between the designation of
the respondents and the impact of occupational stress.
DEPARTMENT AND IMPACT OF OCCUPATIONAL STRESS
The distribution of sample respondents according to the department and impact of
occupational stress in paper industry are shown in the following table.
TABLE NO. 5.51
DEPARTMENT AND IMPACT OF OCCUPATIONAL STRESS
S.No.
Department No. of
Respondents
% Ave
rage
Range
S.D Min Max
1 Administration 292 27.8 30.3 20.0 41.0 3.8
2 Marketing 318 30.2 29.7 12.0 41.0 4.3
3 Production 442 42.0 30.4 12.0 45.0 4.2
Total 1052 100.0
181
It could be witnessed from the above table that the impact of occupational stress
in paper industry of the administrative department ranged between 20 and 41 with an
average of 30.3. And the level of perception of the marketing department ranged
between 12 and 41 with an average of 29.7. Finally, the level of perception towards
production department ranged between 12 and 45 with an average of 30.4. From the
analysis it identified that the maximum impact of occupational stress in paper industry
was attained by the production department.
With a view to find the degree of association between department and the impact
of occupational stress in paper industry, a two-way table was prepared and it is shown in
the following table.
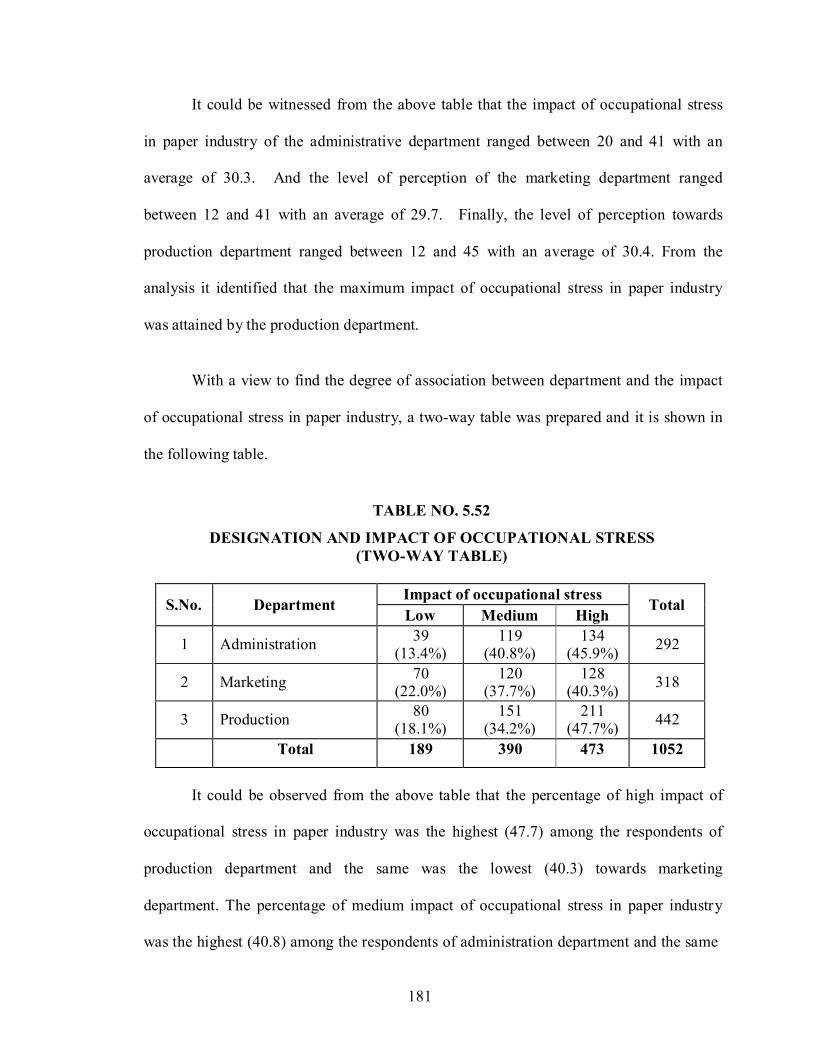
TABLE NO. 5.52
DESIGNATION AND IMPACT OF OCCUPATIONAL STRESS
(TWO-WAY TABLE)
S.No.
Department Impact of occupational stress
Total Low Medium High
1
Administration 39
(13.4%) 119
(40.8%) 134
(45.9%)
292
2
Marketing 70
(22.0%) 120
(37.7%) 128
(40.3%)
318
3
Production 80
(18.1%) 151
(34.2%) 211
(47.7%)
442
Total 189 390 473 1052
It could be observed from the above table that the percentage of high impact of
occupational stress in paper industry was the highest (47.7) among the respondents of
production department and the same was the lowest (40.3) towards marketing
department. The percentage of medium impact of occupational stress in paper industry
was the highest (40.8) among the respondents of administration department and the same

182
was the lowest (34.2) towards production department. The percentage of low impact of
occupational stress in paper industry was the highest (22) among the respondents of
marketing department and the same was the lowest (13.4) towards administration
department.
In order to find the relationship between the department of the respondents and
the impact of occupational stress in paper industry, the following hypothesis was framed
and tested with the help of Anova test and the result is shown in the following table.
H0 : There is no significant difference between department and the impact of
occupational stress in paper industry.
H1 : There is a significant difference between department and the impact of
occupational stress in paper industry.
TABLE NO. 5.53
DEPARTMENT AND IMPACT OF OCCUPATIONAL STRESS (ANOVA TEST)
Source SS DF MS F S
Between
Groups
2.667
2
1.333
1.970
Not significant Within Groups
709.945
1049
.677
Total 712.612 1051
It is noted from the above table that the calculated F value is less than the table
value and the result is not significant. Hence, the hypothesis, ―department of the
respondents and the impact of occupational stress are not associated‖ is accepted. From
the analysis, it is found that there is no significant difference between the department of
the respondents and the impact of occupational stress.

183
MONTHLY INCOME AND IMPACT OF OCCUPATIONAL STRESS
The distribution of sample respondents according to the monthly income of the
respondents and the impact of occupational stress in paper industry are shown in the
following table.
TABLE NO. 5.54
MONTHLY INCOME AND IMPACT OF OCCUPATIONAL STRESS
S.
No.
Monthly Income No. of
Respondents
% Ave
rage
Range
S.D Min Max
1 Below Rs.9000 223 21.2 29.8 12.0 45.0 3.8
2 Rs.9001-12000 239 22.7 30.2 19.0 40.0 4.1
3. Rs.12001-15000 280 26.6 30.3 20.0 41.0 4.0
4. Above Rs.15000 310 29.5 30.2 12.0 45.0 4.5
Total 1052 100.0
It could be highlighted from the above table that the impact of occupational stress
in paper industry among the respondents of the monthly income of Below Rs.9000
ranged between 12 and 45 with an average of 29.8. The impact of occupational stress in
paper industry among the respondents of the monthly income of Rs.9001-12000 ranged
between 19 and 40 with an average of 30.2. The level of perception by the respondents
of the monthly income level of Rs.12001-15000 ranged between 20 and 41 with an
average of 30.3. Finally the impact of occupational stress in paper industry of the
monthly income of above Rs.15000 ranged between 12 and 45 with an average of 30.2. It
is identified from the analysis that the maximum impact of occupational stress in paper
industry was perceived by the respondents earning their monthly income of Rs.12001 and
Rs.15000 in the paper industry.
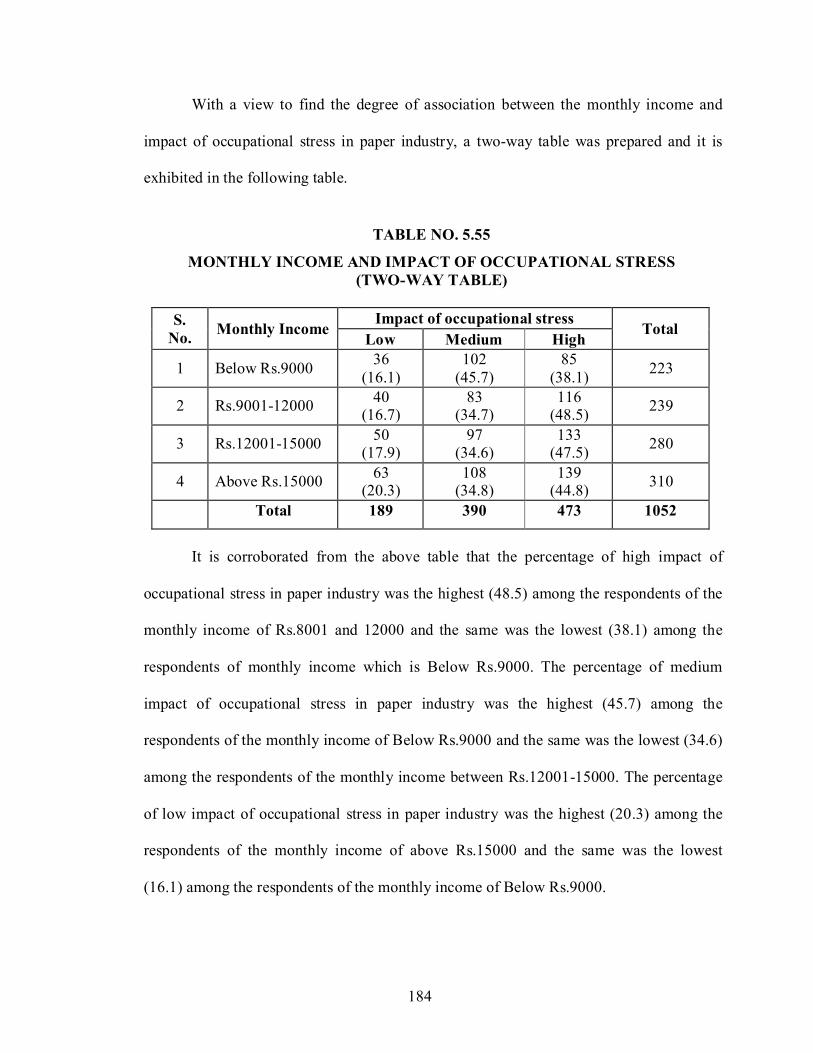
184
With a view to find the degree of association between the monthly income and
impact of occupational stress in paper industry, a two-way table was prepared and it is
exhibited in the following table.
TABLE NO. 5.55
MONTHLY INCOME AND IMPACT OF OCCUPATIONAL STRESS
(TWO-WAY TABLE)
S.
No.
Monthly Income Impact of occupational stress
Total Low Medium High
1
Below Rs.9000 36
(16.1)
102
(45.7)
85
(38.1)
223
2
Rs.9001-12000 40
(16.7) 83
(34.7) 116
(48.5)
239
3
Rs.12001-15000 50
(17.9) 97
(34.6) 133
(47.5)
280
4
Above Rs.15000 63
(20.3) 108
(34.8) 139
(44.8)
310
Total 189 390 473 1052
It is corroborated from the above table that the percentage of high impact of
occupational stress in paper industry was the highest (48.5) among the respondents of the
monthly income of Rs.8001 and 12000 and the same was the lowest (38.1) among the
respondents of monthly income which is Below Rs.9000. The percentage of medium
impact of occupational stress in paper industry was the highest (45.7) among the
respondents of the monthly income of Below Rs.9000 and the same was the lowest (34.6)
among the respondents of the monthly income between Rs.12001-15000. The percentage
of low impact of occupational stress in paper industry was the highest (20.3) among the
respondents of the monthly income of above Rs.15000 and the same was the lowest
(16.1) among the respondents of the monthly income of Below Rs.9000.
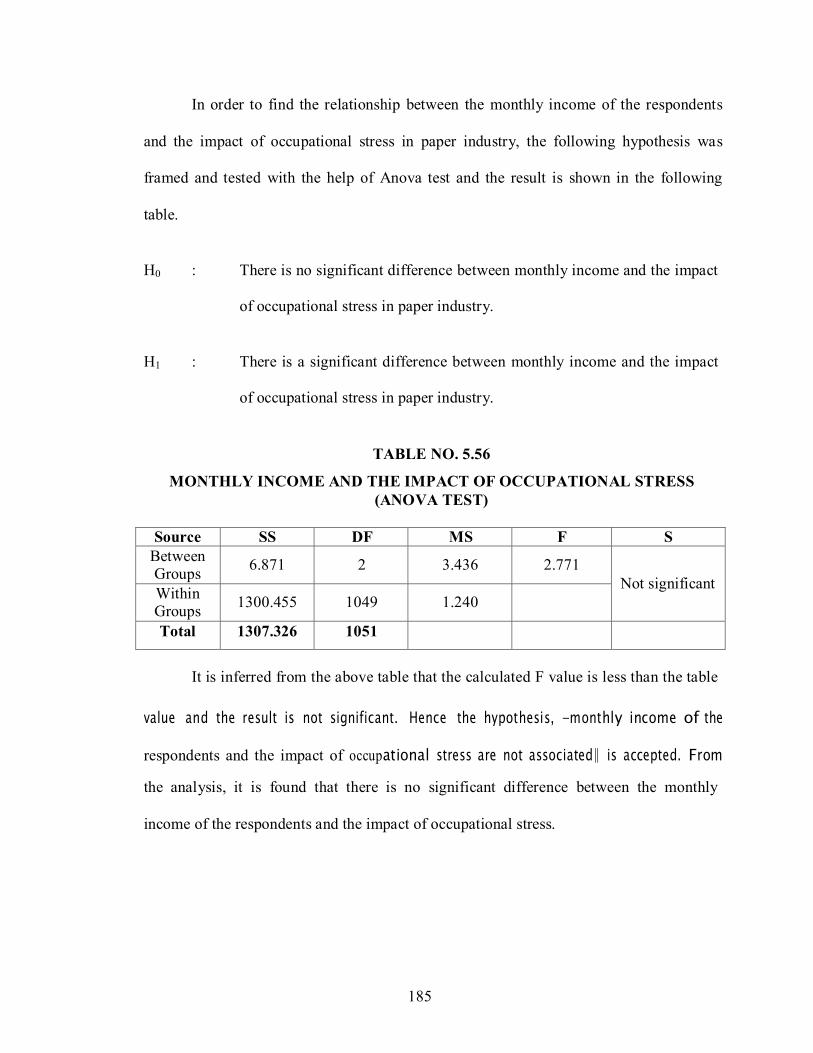
185
In order to find the relationship between the monthly income of the respondents
and the impact of occupational stress in paper industry, the following hypothesis was
framed and tested with the help of Anova test and the result is shown in the following
table.
H0 : There is no significant difference between monthly income and the impact
of occupational stress in paper industry.
H1 : There is a significant difference between monthly income and the impact
of occupational stress in paper industry.
TABLE NO. 5.56
MONTHLY INCOME AND THE IMPACT OF OCCUPATIONAL STRESS
(ANOVA TEST)
Source SS DF MS F S
Between Groups
6.871
2
3.436
2.771
Not significant Within Groups
1300.455
1049
1.240
Total 1307.326 1051
It is inferred from the above table that the calculated F value is less than the table
value and the result is not significant. Hence the hypothesis, ―monthly income of the
respondents and the impact of occupational stress are not associated‖ is accepted. From
the analysis, it is found that there is no significant difference between the monthly
income of the respondents and the impact of occupational stress.
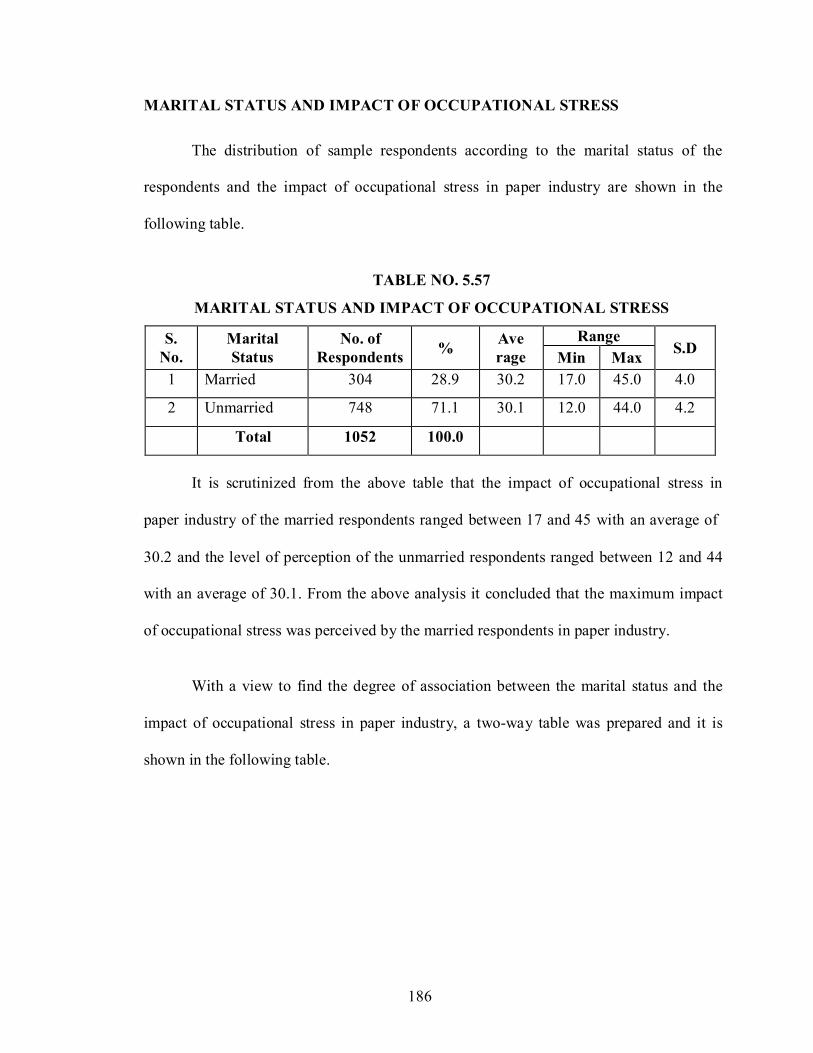
186
MARITAL STATUS AND IMPACT OF OCCUPATIONAL STRESS
The distribution of sample respondents according to the marital status of the
respondents and the impact of occupational stress in paper industry are shown in the
following table.
TABLE NO. 5.57
MARITAL STATUS AND IMPACT OF OCCUPATIONAL STRESS
S.
No.
Marital
Status
No. of
Respondents
% Ave
rage
Range
S.D Min Max
1 Married 304 28.9 30.2 17.0 45.0 4.0
2 Unmarried 748 71.1 30.1 12.0 44.0 4.2
Total 1052 100.0
It is scrutinized from the above table that the impact of occupational stress in
paper industry of the married respondents ranged between 17 and 45 with an average of
30.2 and the level of perception of the unmarried respondents ranged between 12 and 44
with an average of 30.1. From the above analysis it concluded that the maximum impact
of occupational stress was perceived by the married respondents in paper industry.
With a view to find the degree of association between the marital status and the
impact of occupational stress in paper industry, a two-way table was prepared and it is
shown in the following table.
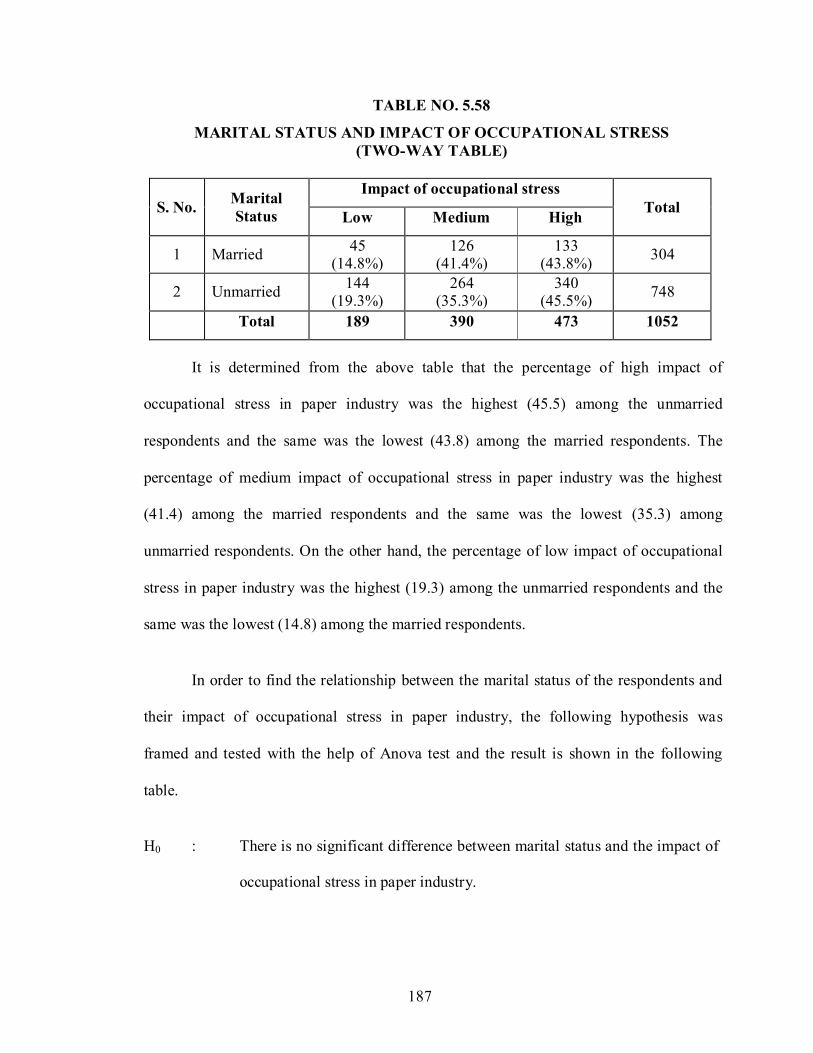
187
TABLE NO. 5.58
MARITAL STATUS AND IMPACT OF OCCUPATIONAL STRESS
(TWO-WAY TABLE)
S. No.
Marital
Status
Impact of occupational stress Total
Low Medium High
1
Married 45
(14.8%) 126
(41.4%) 133
(43.8%)
304
2
Unmarried 144
(19.3%) 264
(35.3%) 340
(45.5%)
748
Total 189 390 473 1052
It is determined from the above table that the percentage of high impact of
occupational stress in paper industry was the highest (45.5) among the unmarried
respondents and the same was the lowest (43.8) among the married respondents. The
percentage of medium impact of occupational stress in paper industry was the highest
(41.4) among the married respondents and the same was the lowest (35.3) among
unmarried respondents. On the other hand, the percentage of low impact of occupational
stress in paper industry was the highest (19.3) among the unmarried respondents and the
same was the lowest (14.8) among the married respondents.
In order to find the relationship between the marital status of the respondents and
their impact of occupational stress in paper industry, the following hypothesis was
framed and tested with the help of Anova test and the result is shown in the following
table.
H0 : There is no significant difference between marital status and the impact of
occupational stress in paper industry.

188
H1 : There is a significant difference between marital status and the impact of
occupational stress in paper industry.
TABLE NO. 5.59
MARITAL STATUS AND THE IMPACT OF OCCUPATIONAL STRESS
(ANOVA TEST)
Source SS DF MS F S
Between Groups
.972
2
.486
2.368
Not significant Within Groups
215.181
1049
.205
Total 216.152 1051
It is noted from the above table that the calculated F value is less than the table
value and the result is not significant. Hence the hypothesis, ―marital status of the
respondents and the impact of occupational stress are not associated‖ is accepted. From
the analysis, it is found that there is no significant difference between the marital status of
the respondents and the impact of occupational stress.
NUMBER OF DEPENDENTS IN THE FAMILY AND IMPACT OF
OCCUPATIONAL STRESS
The distribution of sample respondents according to the number of dependents
and impact of occupational stress in paper industry are shown in the following table.
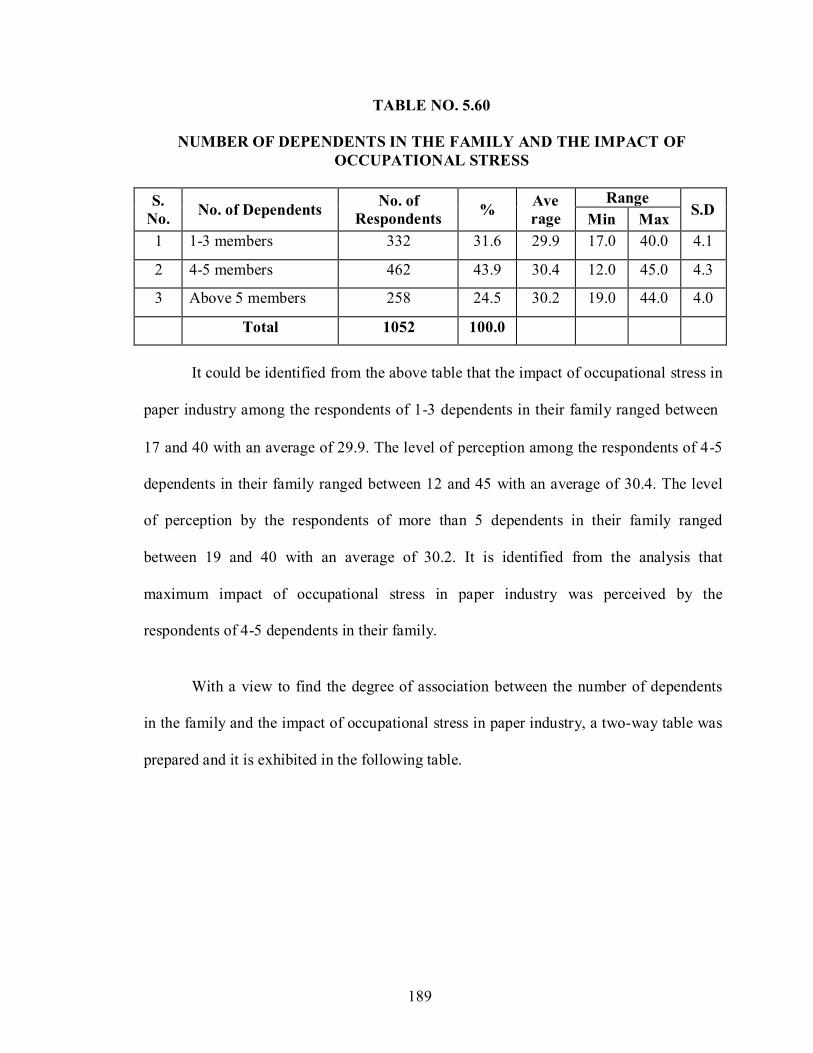
189
TABLE NO. 5.60
NUMBER OF DEPENDENTS IN THE FAMILY AND THE IMPACT OF
OCCUPATIONAL STRESS
S.
No.
No. of Dependents No. of
Respondents
% Ave
rage
Range
S.D Min Max
1 1-3 members 332 31.6 29.9 17.0 40.0 4.1
2 4-5 members 462 43.9 30.4 12.0 45.0 4.3
3 Above 5 members 258 24.5 30.2 19.0 44.0 4.0
Total 1052 100.0
It could be identified from the above table that the impact of occupational stress in
paper industry among the respondents of 1-3 dependents in their family ranged between
17 and 40 with an average of 29.9. The level of perception among the respondents of 4-5
dependents in their family ranged between 12 and 45 with an average of 30.4. The level
of perception by the respondents of more than 5 dependents in their family ranged
between 19 and 40 with an average of 30.2. It is identified from the analysis that
maximum impact of occupational stress in paper industry was perceived by the
respondents of 4-5 dependents in their family.
With a view to find the degree of association between the number of dependents
in the family and the impact of occupational stress in paper industry, a two-way table was
prepared and it is exhibited in the following table.

190
TABLE NO. 5.61
NUMBER OF DEPENDENTS IN THE FAMILY AND LEVEL OF
PERCEPTION TOWARDS JOB (TWO-WAY TABLE)
S.No.
No. of Dependents Impact of occupational stress
Total Low Medium High
1
1-3 members 64
(19.3%)
116
(34.9%)
152
(45.8%)
332
2
4-5 members 79
(17.1%)
176
(38.1%)
207
(44.8%)
462
3
Above 5 members 46
(17.8%) 98
(38.0%) 114
(44.2%)
258
Total 189 390 473 1052
It is scrutinized from the above table that the percentage of high impact of
occupational stress in paper industry was the highest (45.8) among the respondents of 1-3
dependents in their family and the same was the lowest (44.2) towards the respondents of
above 5 dependents in their family. The percentage of medium impact of occupational
stress in paper industry was the highest (38.1) among the respondents of 4-5 dependents
in their family and the same was the lowest (34.9) towards the respondents of 1-3
dependents in their family. The percentage of low impact of occupational stress in paper
industry was the highest (19.3) among the respondents of 1-3 dependents in their family
and the same was the lowest (17.1) towards the respondents of 4-5 dependents in their
family.
In order to find the relationship between the number of dependents in the family
and impact of occupational stress in the paper industry, the following hypothesis was
framed and tested with the help of Anova test and the result is shown in the following
table.

191
H0 : There is no significant difference between the number of dependents in the
family and the impact of occupational stress in paper industry.
H1 : There is a significant difference between the number of dependents in the
family and the impact of occupational stress in paper industry.
TABLE NO. 5.62
NUMBER OF DEPENDENTS IN THE FAMILY AND LEVEL OF
PERCEPTION TOWARDS JOB (ANOVA TEST)
Source SS DF MS F S
Between Groups
.393
2
.196
.352
Not significant Within Groups
584.402
1049
.557
Total 584.795 1051
It is indicated from the above table that the calculated F value is less than the table
value and the result is not significant. Hence the hypothesis, ―number of dependents in
the family and the impact of occupational stress are not associated‖ is accepted. From the
analysis, it is found that there is no significant difference between the number of
dependents in the family and the impact of occupational stress.
FAMILY SYSTEM AND IMPACT OF OCCUPATIONAL STRESS
The distribution of sample respondents according to the family system and the
impact of occupational stress in paper industry are shown in the following table.
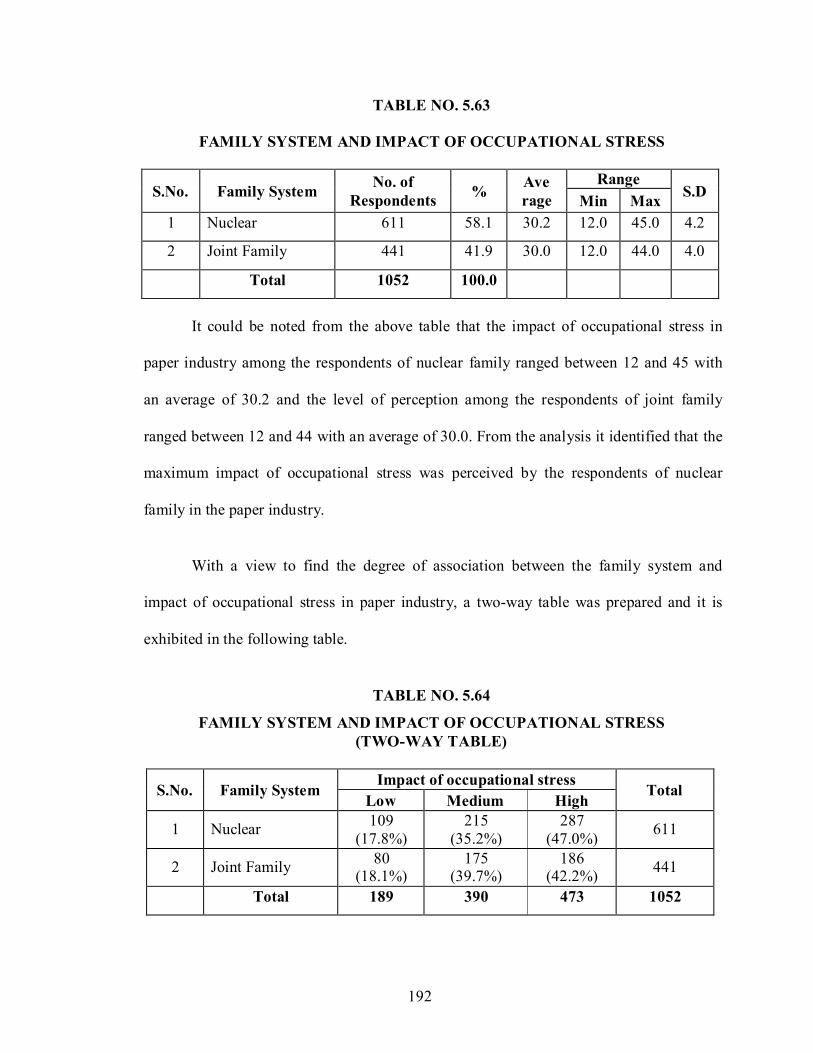
192
TABLE NO. 5.63
FAMILY SYSTEM AND IMPACT OF OCCUPATIONAL STRESS
S.No.
Family System No. of
Respondents
% Ave
rage
Range
S.D Min Max
1 Nuclear 611 58.1 30.2 12.0 45.0 4.2
2 Joint Family 441 41.9 30.0 12.0 44.0 4.0
Total 1052 100.0
It could be noted from the above table that the impact of occupational stress in
paper industry among the respondents of nuclear family ranged between 12 and 45 with
an average of 30.2 and the level of perception among the respondents of joint family
ranged between 12 and 44 with an average of 30.0. From the analysis it identified that the
maximum impact of occupational stress was perceived by the respondents of nuclear
family in the paper industry.
With a view to find the degree of association between the family system and
impact of occupational stress in paper industry, a two-way table was prepared and it is
exhibited in the following table.
TABLE NO. 5.64
FAMILY SYSTEM AND IMPACT OF OCCUPATIONAL STRESS
(TWO-WAY TABLE)
S.No.
Family System Impact of occupational stress
Total Low Medium High
1
Nuclear 109
(17.8%)
215
(35.2%)
287
(47.0%)
611
2
Joint Family 80
(18.1%) 175
(39.7%) 186
(42.2%)
441
Total 189 390 473 1052

193
It could be inferred from the above table that the percentage of high impact of
occupational stress in paper industry was the highest (47.0) among the respondents
belonging to nuclear family and the same was the lowest (42.2) among the respondents
belonging to joint family. The percentage of medium impact of occupational stress in
paper industry was the highest (39.7) among the respondents belonging to joint family
and the same was the lowest (35.2) among the respondents belonging to nuclear family.
The percentage of low impact of occupational stress in paper industry was the highest
(18.1) among the respondents belonging to joint family and the same was the lowest
(17.8) among the respondents belonging to nuclear family.
In order to find the relationship between the family system and the impact of
occupational stress in paper industry, the following hypothesis was framed and tested
with the help of Anova test and the result is shown in the following table.
H0 : There is no significant difference between family system and the impact of
occupational stress in paper industry.
H1 : There is a significant difference between family system and the impact of
occupational stress in paper industry.
TABLE NO. 5.65
FAMILY SYSTEM AND IMPACT OF OCCUPATIONAL STRESS
(ANOVA TEST)
Source SS DF MS F S
Between Groups
.662
2
.331
1.359
Not significant Within Groups
255.470
1049
.244
Total 256.132 1051
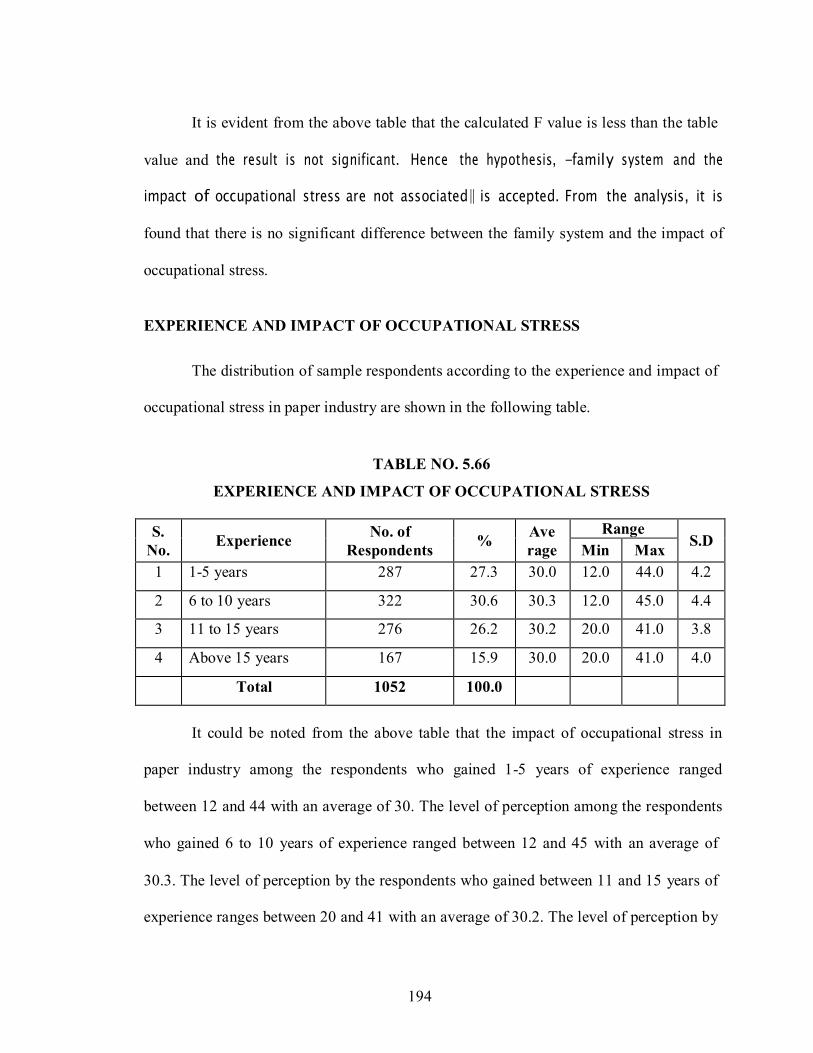
194
It is evident from the above table that the calculated F value is less than the table
value and the result is not significant. Hence the hypothesis, ―family system and the
impact of occupational stress are not associated‖ is accepted. From the analysis, it is
found that there is no significant difference between the family system and the impact of
occupational stress.
EXPERIENCE AND IMPACT OF OCCUPATIONAL STRESS
The distribution of sample respondents according to the experience and impact of
occupational stress in paper industry are shown in the following table.
TABLE NO. 5.66
EXPERIENCE AND IMPACT OF OCCUPATIONAL STRESS
S.
No.
Experience No. of
Respondents
% Ave
rage
Range
S.D Min Max
1 1-5 years 287 27.3 30.0 12.0 44.0 4.2
2 6 to 10 years 322 30.6 30.3 12.0 45.0 4.4
3 11 to 15 years 276 26.2 30.2 20.0 41.0 3.8
4 Above 15 years 167 15.9 30.0 20.0 41.0 4.0
Total 1052 100.0
It could be noted from the above table that the impact of occupational stress in
paper industry among the respondents who gained 1-5 years of experience ranged
between 12 and 44 with an average of 30. The level of perception among the respondents
who gained 6 to 10 years of experience ranged between 12 and 45 with an average of
30.3. The level of perception by the respondents who gained between 11 and 15 years of
experience ranges between 20 and 41 with an average of 30.2. The level of perception by

195
the respondents who gained above 15 years of experience ranged between 20 and 41 with
an average of 30. From the analysis it identified that the maximum impact of
occupational stress was perceived by the respondents who gained between 6 and 10 years
of experience in the paper industry.
With a view to find the degree of association between the experience and the
impact of occupational stress in paper industry, a two-way table was prepared and it is
exhibited in the following table.
TABLE NO. 5.67
EXPERIENCE AND IMPACT OF OCCUPATIONAL STRESS
(TWO-WAY TABLE)
S.No.
Experience Impact of occupational stress
Total Low Medium High
1
1-5 years 61
(21.3%) 100
(34.8%) 126
(43.9%)
287
2
6 to 10 years 52
(16.1%) 117
(36.3%) 153
(47.5%)
322
3
11 to 15 years 39
(14.1%)
113
(40.9%)
124
(44.9%)
276
4
Above 15 years 37
(22.2%) 60
(35.9%) 70
(41.9%)
167
Total 189 390 473 1052
It is observed from the above table that the percentage of high impact of
occupational stress in paper industry was the highest (47.5) among the respondents who
gained 6 and 10 years of experience and the same was the lowest (41.9) among the
respondents who gained above 15 years of experience. The percentage of medium impact
of occupational stress in paper industry was the highest (10.9) among the respondents
who gained 11 and 15 years of experience and the same was the lowest (34.8) among the
respondents who gained 1-5 years of experience. The percentage of low impact of
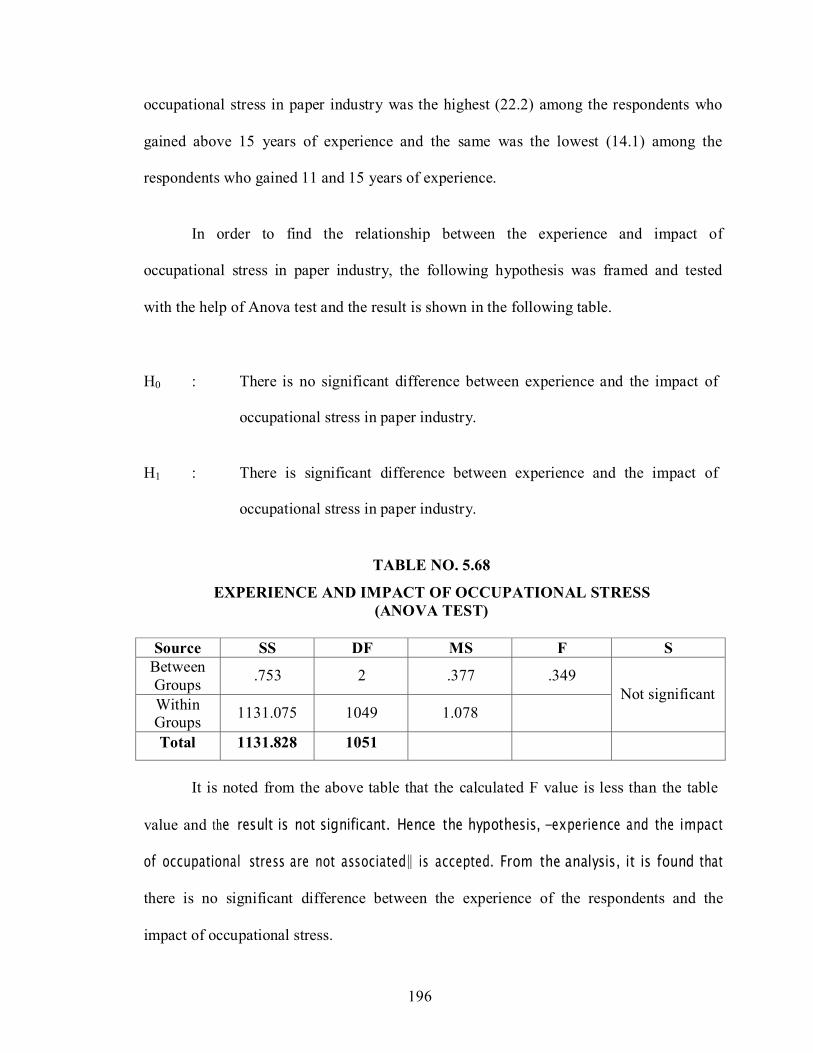
196
occupational stress in paper industry was the highest (22.2) among the respondents who
gained above 15 years of experience and the same was the lowest (14.1) among the
respondents who gained 11 and 15 years of experience.
In order to find the relationship between the experience and impact of
occupational stress in paper industry, the following hypothesis was framed and tested
with the help of Anova test and the result is shown in the following table.
H0 : There is no significant difference between experience and the impact of
occupational stress in paper industry.
H1 : There is significant difference between experience and the impact of
occupational stress in paper industry.
TABLE NO. 5.68
EXPERIENCE AND IMPACT OF OCCUPATIONAL STRESS
(ANOVA TEST)
Source SS DF MS F S
Between
Groups
.753
2
.377
.349
Not significant Within Groups
1131.075
1049
1.078
Total 1131.828 1051
It is noted from the above table that the calculated F value is less than the table
value and the result is not significant. Hence the hypothesis, ―experience and the impact
of occupational stress are not associated‖ is accepted. From the analysis, it is found that
there is no significant difference between the experience of the respondents and the
impact of occupational stress.
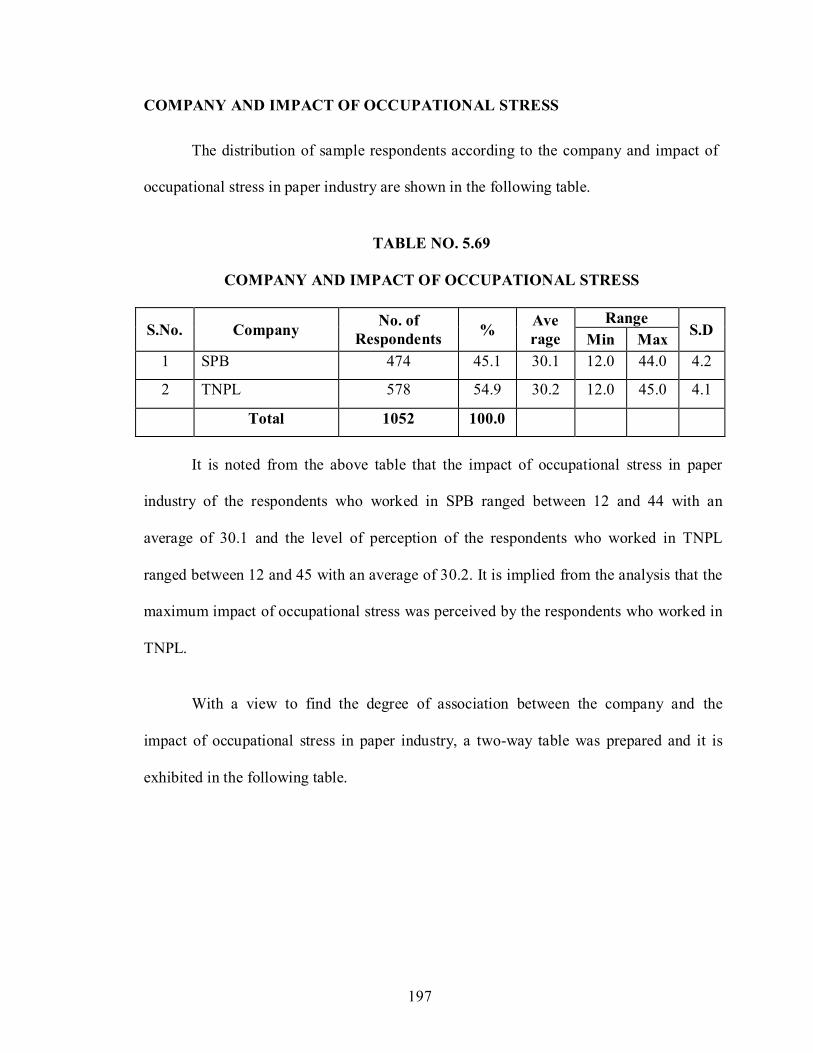
197
COMPANY AND IMPACT OF OCCUPATIONAL STRESS
The distribution of sample respondents according to the company and impact of
occupational stress in paper industry are shown in the following table.
TABLE NO. 5.69
COMPANY AND IMPACT OF OCCUPATIONAL STRESS
S.No.
Company No. of
Respondents
% Ave
rage
Range
S.D Min Max
1 SPB 474 45.1 30.1 12.0 44.0 4.2
2 TNPL 578 54.9 30.2 12.0 45.0 4.1
Total 1052 100.0
It is noted from the above table that the impact of occupational stress in paper
industry of the respondents who worked in SPB ranged between 12 and 44 with an
average of 30.1 and the level of perception of the respondents who worked in TNPL
ranged between 12 and 45 with an average of 30.2. It is implied from the analysis that the
maximum impact of occupational stress was perceived by the respondents who worked in
TNPL.
With a view to find the degree of association between the company and the
impact of occupational stress in paper industry, a two-way table was prepared and it is
exhibited in the following table.
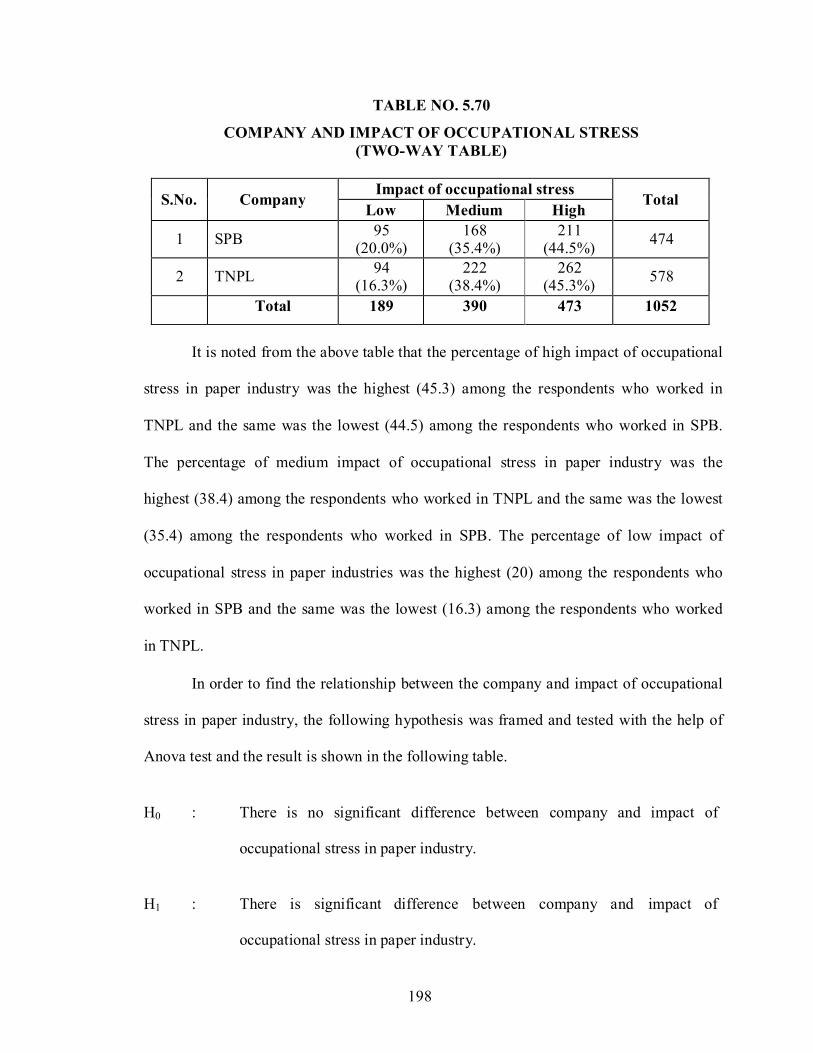
198
TABLE NO. 5.70
COMPANY AND IMPACT OF OCCUPATIONAL STRESS
(TWO-WAY TABLE)
S.No.
Company Impact of occupational stress
Total Low Medium High
1
SPB 95
(20.0%) 168
(35.4%) 211
(44.5%)
474
2
TNPL 94
(16.3%) 222
(38.4%) 262
(45.3%)
578
Total 189 390 473 1052
It is noted from the above table that the percentage of high impact of occupational
stress in paper industry was the highest (45.3) among the respondents who worked in
TNPL and the same was the lowest (44.5) among the respondents who worked in SPB.
The percentage of medium impact of occupational stress in paper industry was the
highest (38.4) among the respondents who worked in TNPL and the same was the lowest
(35.4) among the respondents who worked in SPB. The percentage of low impact of
occupational stress in paper industries was the highest (20) among the respondents who
worked in SPB and the same was the lowest (16.3) among the respondents who worked
in TNPL.
In order to find the relationship between the company and impact of occupational
stress in paper industry, the following hypothesis was framed and tested with the help of
Anova test and the result is shown in the following table.
H0 : There is no significant difference between company and impact of
occupational stress in paper industry.
H1 : There is significant difference between company and impact of
occupational stress in paper industry.
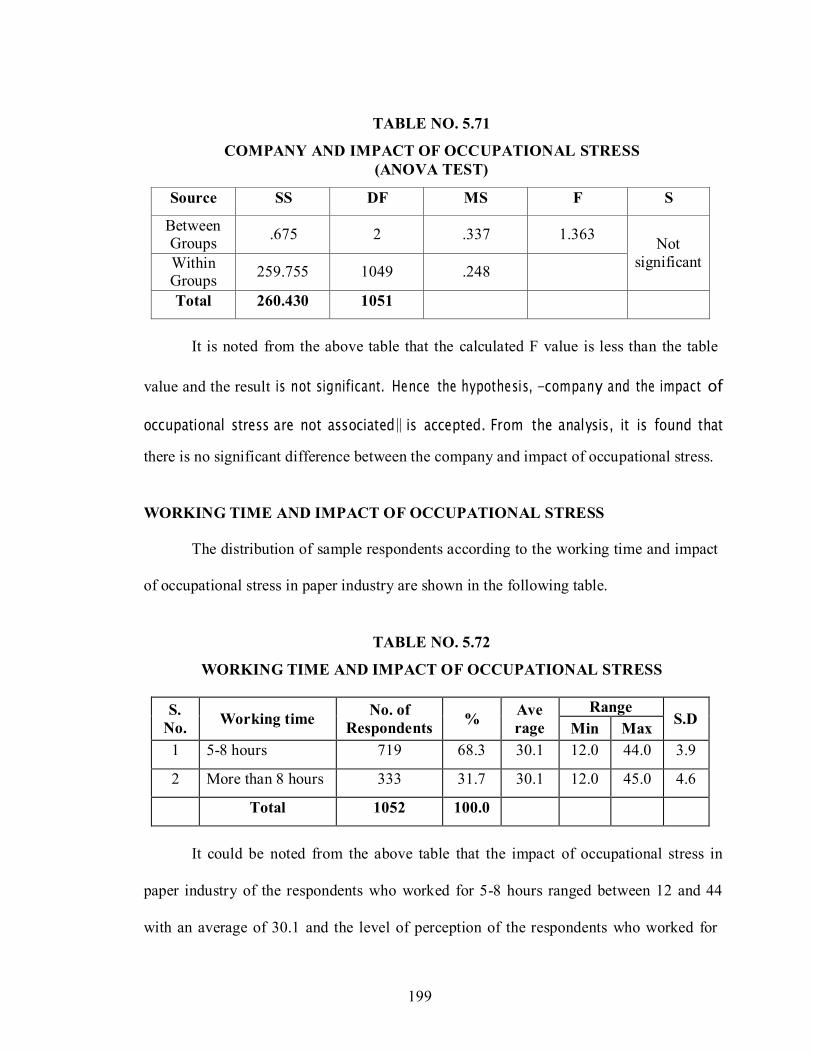
199
TABLE NO. 5.71
COMPANY AND IMPACT OF OCCUPATIONAL STRESS
(ANOVA TEST)
Source SS DF MS F S
Between Groups
.675
2
.337
1.363
Not
significant Within Groups
259.755
1049
.248
Total 260.430 1051
It is noted from the above table that the calculated F value is less than the table
value and the result is not significant. Hence the hypothesis, ―company and the impact of
occupational stress are not associated‖ is accepted. From the analysis, it is found that
there is no significant difference between the company and impact of occupational stress.
WORKING TIME AND IMPACT OF OCCUPATIONAL STRESS
The distribution of sample respondents according to the working time and impact
of occupational stress in paper industry are shown in the following table.
TABLE NO. 5.72
WORKING TIME AND IMPACT OF OCCUPATIONAL STRESS
S.
No.
Working time No. of
Respondents
% Ave
rage
Range
S.D Min Max
1 5-8 hours 719 68.3 30.1 12.0 44.0 3.9
2 More than 8 hours 333 31.7 30.1 12.0 45.0 4.6
Total 1052 100.0
It could be noted from the above table that the impact of occupational stress in
paper industry of the respondents who worked for 5-8 hours ranged between 12 and 44
with an average of 30.1 and the level of perception of the respondents who worked for
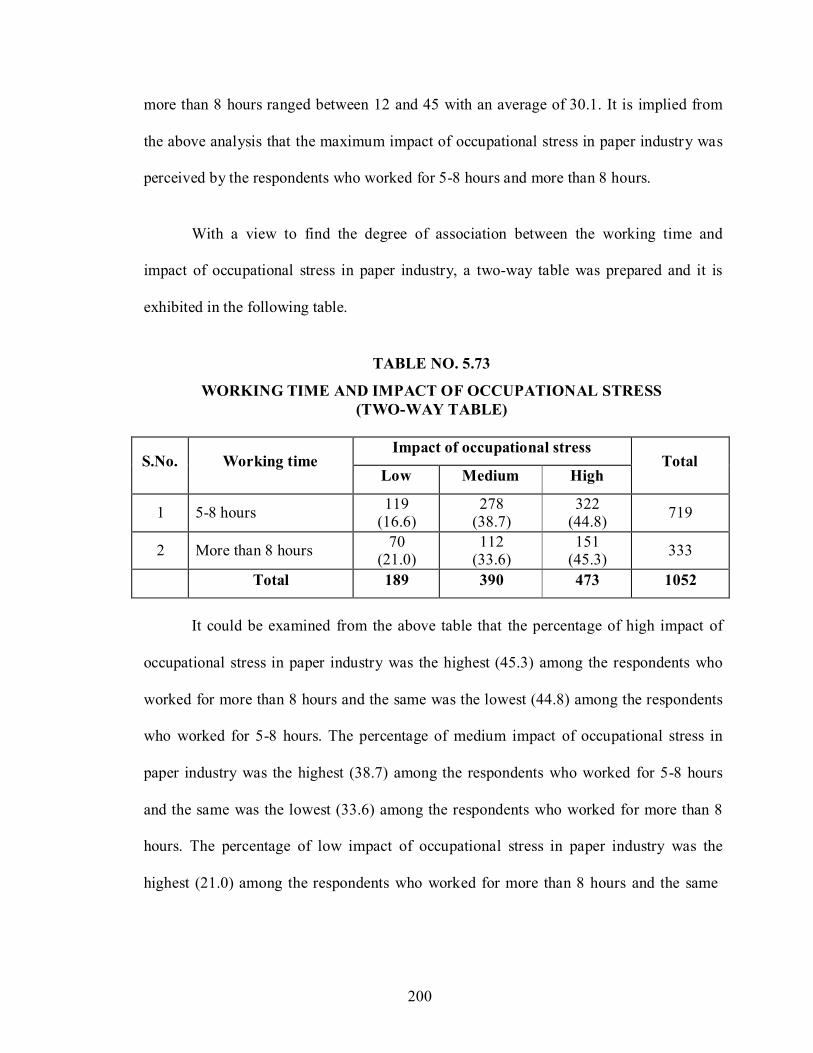
200
more than 8 hours ranged between 12 and 45 with an average of 30.1. It is implied from
the above analysis that the maximum impact of occupational stress in paper industry was
perceived by the respondents who worked for 5-8 hours and more than 8 hours.
With a view to find the degree of association between the working time and
impact of occupational stress in paper industry, a two-way table was prepared and it is
exhibited in the following table.
TABLE NO. 5.73
WORKING TIME AND IMPACT OF OCCUPATIONAL STRESS
(TWO-WAY TABLE)
S.No.
Working time Impact of occupational stress
Total Low Medium High
1
5-8 hours 119
(16.6) 278
(38.7) 322
(44.8)
719
2
More than 8 hours 70
(21.0) 112
(33.6) 151
(45.3)
333
Total 189 390 473 1052
It could be examined from the above table that the percentage of high impact of
occupational stress in paper industry was the highest (45.3) among the respondents who
worked for more than 8 hours and the same was the lowest (44.8) among the respondents
who worked for 5-8 hours. The percentage of medium impact of occupational stress in
paper industry was the highest (38.7) among the respondents who worked for 5-8 hours
and the same was the lowest (33.6) among the respondents who worked for more than 8
hours. The percentage of low impact of occupational stress in paper industry was the
highest (21.0) among the respondents who worked for more than 8 hours and the same
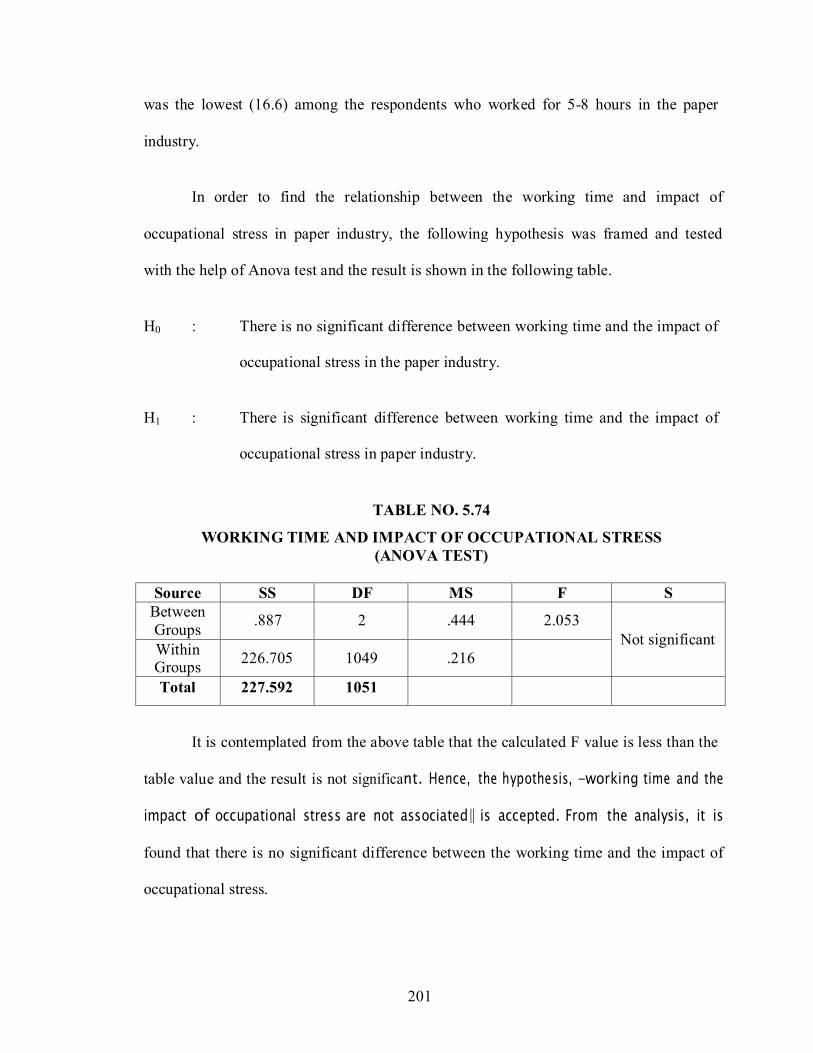
201
was the lowest (16.6) among the respondents who worked for 5-8 hours in the paper
industry.
In order to find the relationship between the working time and impact of
occupational stress in paper industry, the following hypothesis was framed and tested
with the help of Anova test and the result is shown in the following table.
H0 : There is no significant difference between working time and the impact of
occupational stress in the paper industry.
H1 : There is significant difference between working time and the impact of
occupational stress in paper industry.
TABLE NO. 5.74
WORKING TIME AND IMPACT OF OCCUPATIONAL STRESS
(ANOVA TEST)
Source SS DF MS F S
Between
Groups
.887
2
.444
2.053
Not significant Within Groups
226.705
1049
.216
Total 227.592 1051
It is contemplated from the above table that the calculated F value is less than the
table value and the result is not significant. Hence, the hypothesis, ―working time and the
impact of occupational stress are not associated‖ is accepted. From the analysis, it is
found that there is no significant difference between the working time and the impact of
occupational stress.

202
5.4 PERCENTAGE ANALYSIS
In this section percentage analysis was employed to ascertain the results and the
details are furnished as follows:
DISTANCE BETWEEN THE WORKING COMPANY AND RESIDENCE
This factor is very important to distinguish their traveling time in working days of
employees working in paper industry. In this study, an attempt was made to know about
the distance between the working company and the residence of the employees. The
details are furnished in the following table.
TABLE NO.5.75
DISTANCE BETWEEN THE WORKING COMPANY AND RESIDENCE
S.No. Distance No. of respondents Percentage
1 Less than 2 kms 295 28.0
2 2 to 4 kms 267 25.4
3 4 to 6 kms 310 29.5
4 6 kms and above 180 17.1
Total 1052 100.0
It is surmised from the above table that 28 percent of the respondents were
travelling less than 2 kms distance between the working company and their residence,
25.4 of the respondents were travelling for 2-4 kms to the working company from their
residence, 29.5 percent of the respondents were travelling from 4 to 6 kms distance
between the working company and their residence and 17.1 percent of the respondents
were travelling above 6 kms to the working place from their residence. From the analysis

203
it is noted that majority (29.5%) of the respondents were travelling 4 to 6 kms to the
working place from their residence.
FACTOR MOTIVATED THE EMPLOYEES IN CHOOSING THEIR
PROFESSION
Everyone has the reason in choosing their profession with their at most level of
interest and sincerity. In this study, an attempt was made to know about the factors
motivating the employees in choosing their profession. The details are furnished in the
following table.
TABLE NO.5.76
FACTOR MOTIVATED THE EMPLOYEES IN CHOOSING THEIR
PROFESSION
S.No.
Factors No. of
Respondents
Percentage
1 Respect in society 293 27.9
2 High pay packages 303 28.8
3 Comfort 263 25.0
4 Convenient working hours 128 12.2
5 Challenging profession 65 6.1
Total 1052 100.0
It is corroborated from the above table that 27.9 percent of the respondents were
motivated to choose their profession because of respect in society, 28.8 percent of the
respondents preferred their profession because of high pay packages, 25 percent of the
respondents selected their profession because of comfort, 12.2 percent of the respondents
preferred their profession because of convenient working hours and 6.1 percent of the
respondents selected their profession since it was a challenging one. From the analysis it
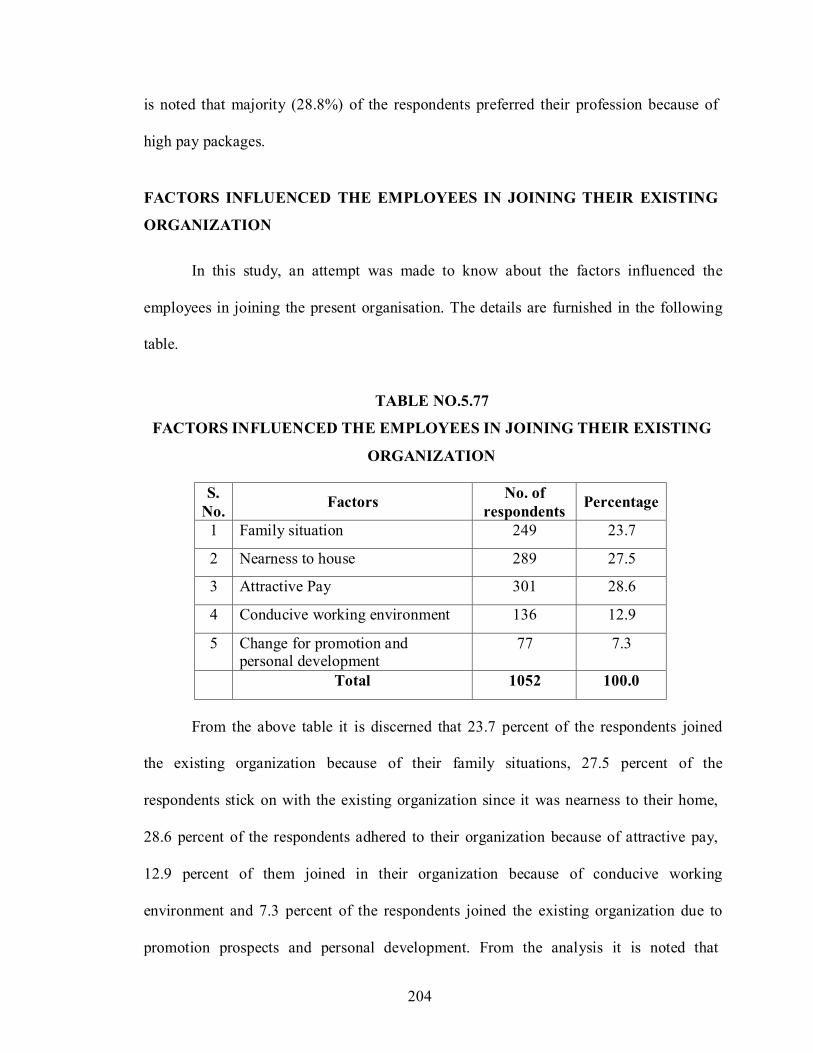
204
is noted that majority (28.8%) of the respondents preferred their profession because of
high pay packages.
FACTORS INFLUENCED THE EMPLOYEES IN JOINING THEIR EXISTING
ORGANIZATION
In this study, an attempt was made to know about the factors influenced the
employees in joining the present organisation. The details are furnished in the following
table.
TABLE NO.5.77
FACTORS INFLUENCED THE EMPLOYEES IN JOINING THEIR EXISTING
ORGANIZATION
S.
No.
Factors No. of
respondents
Percentage
1 Family situation 249 23.7
2 Nearness to house 289 27.5
3 Attractive Pay 301 28.6
4 Conducive working environment 136 12.9
5 Change for promotion and personal development
77 7.3
Total 1052 100.0
From the above table it is discerned that 23.7 percent of the respondents joined
the existing organization because of their family situations, 27.5 percent of the
respondents stick on with the existing organization since it was nearness to their home,
28.6 percent of the respondents adhered to their organization because of attractive pay,
12.9 percent of them joined in their organization because of conducive working
environment and 7.3 percent of the respondents joined the existing organization due to
promotion prospects and personal development. From the analysis it is noted that

205
majority (28.6%) of the respondents adhered to the existing organization because of
attractive pay offered to them.
OPINION OF EMPLOYEES TOWARDS STRESSFUL EVENT
Every human being is having many problems in both formal and informal way. In
this study, an attempt was made to know about opinion towards stressful event. The
details are furnished in the following table.
TABLE NO.5.78
OPINION TOWARDS STRESSFUL EVENT
S.
No.
Factors No. of
respondents
Percentage
1 Work related issues 211 20.1
2 Relationships with superior, peers and subordinates
261 24.8
3 Family events 263 25.0
4 Health problems 317 30.1
Total 1052 100.0
It is substantiated from the above table that 20.1 percent of the respondents felt
stress related with the work issues, 24.8 percent of the respondents were undergone
stressful events with their superior, peers and subordinates, 25 percent of the respondents
have experienced the stress mostly with their family events and 30.1 percent of the
respondents felt stress because of their health problems. From the analysis it is noted that
majority (30.1%) of the respondents have experienced stress because of their health
problems.

206
PERCEPTION OF RESPONDENTS TOWARDS OCCUPATIONAL STRESS
An attempt was made to know about the perception of respondents towards
occupational stress. The details are furnished in the following table.
TABLE NO. 5.79
PERCEPTION OF RESPONDENTS TOWARDS OCCUPATIONAL STRESS
(in percentage)
S.No.
Statements
Agree
Neutral
Disagree
1
My job is stressful 573
(54.5) 248
(23.6) 231
(22.0)
2
My experience stress very often 310
(29.5) 484
(46.0) 258
(24.5)
3 Occupational Stress has a negative impact on my performance
402 (38.2)
294 (27.9)
356 (33.8)
4 Occupational stress does not have any impact on my performance at work
315 (29.9)
412 (39.2)
325 (30.9)
From the above table it is conjectured that the respondents have agreed with the
statements that job is stressful and occupational stress has a negative impact on their
performance to the extent of 54.5 and 38.2 percent respectively. The respondents were
neutral towards the statements of they being experiencing stress very often and
occupational stress does not have any impact on their performance at work as 46 and 39.2
percent respectively. From the analysis it is noted that the most (54.5%) of the
respondents have agreed to the statement that job is stressful.
OPINION OF RESPONDENTS TOWARDS OCCUPATIONAL STRESS
In this study, an attempt was made to know about the opinion of respondents
towards occupational stress. The details are given in the following table.

207
TABLE NO. 5.80
OPINION OF RESPONDENTS ON OCCUPATIONAL STRESS
(in percentage)
S.No.
Statements
Agree
Disagree
1
Do you have self-confidence 988
(93.9) 64
(6.1)
2
Are you able to adapt to changes 619
(58.8) 433
(41.2)
3
Are you aggressive 475
(45.2)
577
(54.8)
4
Are you competitive 752
(71.5) 300
(28.5)
5
Do you have positive image of your self 648
(61.6) 404
(38.4)
6
Do you have patience 665
(63.2) 387
(36.8)
7
Do you mild mannered 710
(67.5)
342
(32.5)
8
Do you have high self-esteem 678
(64.4) 374
(35.6)
9
Are you suspicious of others 453
(43.1) 599
(56.9)
10
Do you have tolerance 568
(54.0) 484
(46.0)
From the above table it is surmised that the respondents opinion towards
occupational stress. The respondents were agreed with the statements like having self-
confidence, able to adapt for the changes, very competitive, having positive image of
their self, having patience, very mild mannered, having high self-esteem and having
tolerance as the percentage of 93.9, 58.8, 71.5, 61.6, 63.2, 67.5, 6.4 and 54.0 respectively.
The respondents were not agreed with the statements like very aggressive and suspicious
of others as 54.8 and 56.9 percent respectively. It is analysed from the above table that
the maximum (93.9%) of the respondents were agreed with the statement of having self
confidence.

208
PERCEPTION TOWARDS JOB
In this study, an attempt was made to know about the perception about job. The
details are given in the following table.
TABLE NO. 5.81
PERCEPTION ABOUT JOB
(in percentage)
S.No.
Statements
SA
A
N
D
SD
1 On the whole, I get well along with
others at work
520
(49.4)
312
(29.7)
94
(8.9)
88
(8.4)
38
(3.6)
2
No conflict within my team 347
(33.0)
171
(16.3)
163
(15.5)
185
(17.6)
186
(17.7)
3 I am able to share my feelings with my
boss/colleagues
363
(34.5)
225
(21.4)
209
(19.9)
167
(15.9)
88
(8.4)
4
I am confidence to succeed in the job 436
(41.4)
184
(17.5)
166
(15.8)
195
(18.5)
71
(6.7)
5 The shift work is a main source of stress
for me
200
(19.0)
147
(14.0)
221
(21.0)
279
(26.5)
205
(19.5)
6 Intellectual / Technical demands of a
job are the source of stress for me
320
(30.4)
155
(14.7)
202
(19.2)
229
(21.8)
146
(13.9)
7
The work assigned is monotonous 259
(24.6)
90
(8.6)
182
(17.3)
289
(27.5)
232
(22.1)
8 Interruption makes it difficult to
complete all my works
286
(27.2)
195
(18.5)
200
(19.0)
224
(21.3)
147
(14.0)
9 I am satisfied by the corrective
measures given by the organisation
321
(30.5)
189
(18.0)
175
(16.6)
245
(23.3)
122
(11.6)
10 I feel the leadership style in the
organisation is appropriate
378
(35.9)
209
(19.9)
160
(15.2)
158
(15.0)
147
(14.0)
11 Ability to complete the work assigned
to me
345
(32.8)
205
(19.5)
164
(15.6)
209
(19.9)
129
(12.3)
12 Information received about the things
need to know for me
365
(34.7)
185
(17.6)
192
(18.3)
181
(17.2)
129
(12.3)
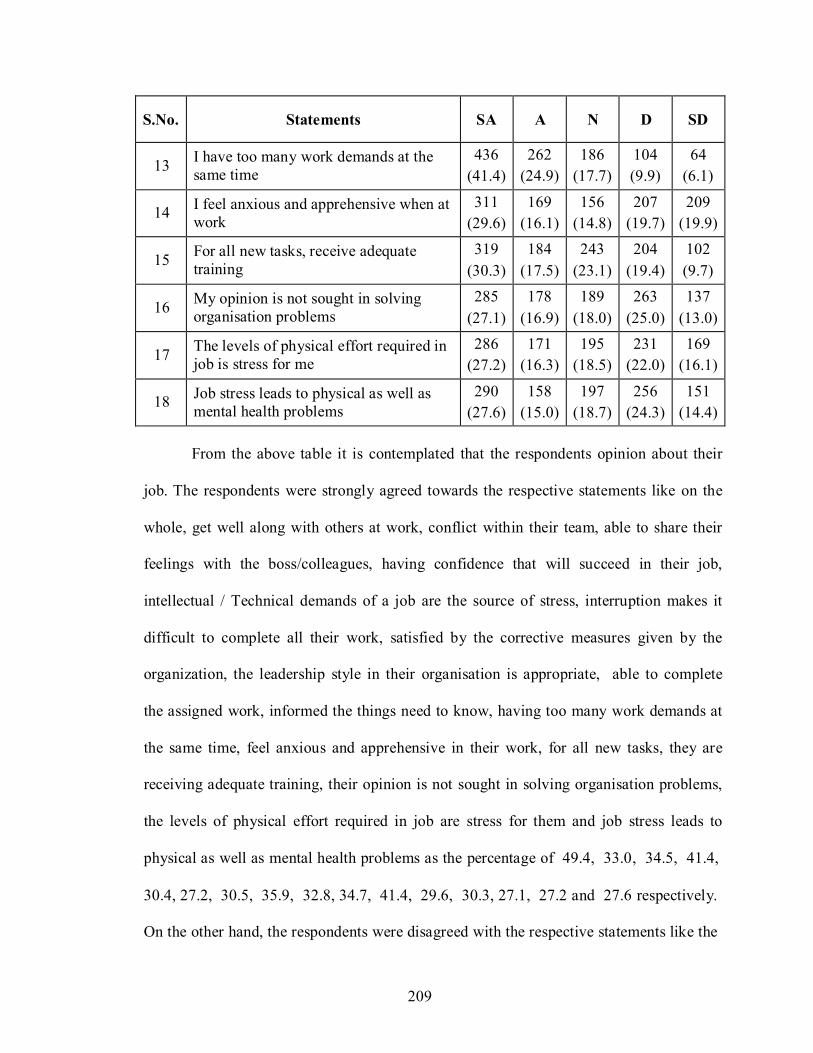
209
S.No.
Statements
SA
A
N
D
SD
13 I have too many work demands at the
same time
436
(41.4)
262
(24.9)
186
(17.7)
104
(9.9)
64
(6.1)
14 I feel anxious and apprehensive when at
work
311
(29.6)
169
(16.1)
156
(14.8)
207
(19.7)
209
(19.9)
15 For all new tasks, receive adequate
training
319
(30.3)
184
(17.5)
243
(23.1)
204
(19.4)
102
(9.7)
16 My opinion is not sought in solving
organisation problems
285
(27.1)
178
(16.9)
189
(18.0)
263
(25.0)
137
(13.0)
17 The levels of physical effort required in
job is stress for me
286
(27.2)
171
(16.3)
195
(18.5)
231
(22.0)
169
(16.1)
18 Job stress leads to physical as well as
mental health problems
290
(27.6)
158
(15.0)
197
(18.7)
256
(24.3)
151
(14.4)
From the above table it is contemplated that the respondents opinion about their
job. The respondents were strongly agreed towards the respective statements like on the
whole, get well along with others at work, conflict within their team, able to share their
feelings with the boss/colleagues, having confidence that will succeed in their job,
intellectual / Technical demands of a job are the source of stress, interruption makes it
difficult to complete all their work, satisfied by the corrective measures given by the
organization, the leadership style in their organisation is appropriate, able to complete
the assigned work, informed the things need to know, having too many work demands at
the same time, feel anxious and apprehensive in their work, for all new tasks, they are
receiving adequate training, their opinion is not sought in solving organisation problems,
the levels of physical effort required in job are stress for them and job stress leads to
physical as well as mental health problems as the percentage of 49.4, 33.0, 34.5, 41.4,
30.4, 27.2, 30.5, 35.9, 32.8, 34.7, 41.4, 29.6, 30.3, 27.1, 27.2 and 27.6 respectively.
On the other hand, the respondents were disagreed with the respective statements like the

210
shift work leads to source of stress and the work assigned is monotonous as 26.5 and 27.5
percent respectively. It is analysed from the above table that the maximum (49.4) of the
respondents were strongly agreed with the statement of get well along with others at
work.
PERCEPTION ABOUT FAMILY
An attempt was made to know about the respondents‘ perception about their
family. The details are given in the following table.
TABLE NO. 5.82
PERCEPTION ABOUT FAMILY
(in percentage)
S.No.
Statements
SA
A
N
D
SD
1
Drugs have become part of my life 365
(34.7)
131
(12.5)
151
(14.4)
173
(16.4)
232
(22.1)
2
My work is cutting into my family life 267
(25.4)
133
(12.6)
127
(12.1)
255
(24.2)
270
(25.7)
3
Problems in my family gives me stress 264
(25.1)
159
(15.1)
224
(21.3)
254
(24.1)
151
(14.4)
4
Financial problems gives me stress 297
(28.2)
178
(16.9)
193
(18.3)
247
(23.5)
137
(13.0)
5
Low social support leads me to stress 286
(27.2)
150
(14.3)
206
(19.6)
252
(24.0)
158
(15.0)
6 I feel uncomfortable to adjust with the
society when I am in stress
312
(29.7)
176
(16.7)
186
(17.7)
238
(22.6)
140
(13.3)
7 I agree that my qualification is more for
the present job
295
(28.0)
161
(15.3)
164
(15.6)
284
(27.0)
148
(14.1)
8 I have a close and warm relationship
with family and friends
410
(39.0)
202
(19.2)
182
(17.3)
184
(17.5)
74
(7.0)
9 I am satisfied with my family members
co-operation in my work life
480
(45.6)
171
(16.3)
118
(11.2)
145
(13.8)
138
(13.1)
10
My journey to work place is stressful 202
(19.2)
136
(12.9)
216
(20.5)
300
(28.5)
198
(18.8)

211
From the above table it is extrapolated that the respondents were strongly agreed
with the statement about their family like, drugs becoming part of their life, work is
cutting into their family life, Problems in their family gives stress, financial problems
gives stress, low social support leads to stress, feel uncomfortable to adjust with the
society when they are in stress, agree that their qualification is more for their present job,
having a close and warm relationship with family and friends and satisfied with their
family members co-operation in their work life as the percentage of 34.7, 25.4, 25.1,
28.2, 27.2, 29.7, 28.0, 39.0 and 45.6 respectively. The respondents were disagreed with
the statement of their journey to work place is stressful as 28.5 percent. It is witnessed
from the above analysis that maximum (45.6%) of the respondents were satisfied with
their family members co-operation in their work life.
IMPACT OF OCCUPATIONAL STRESS
An attempt was made to know about the impact of occupational stress towards the
respondents in paper industry. The details are given in the following table.
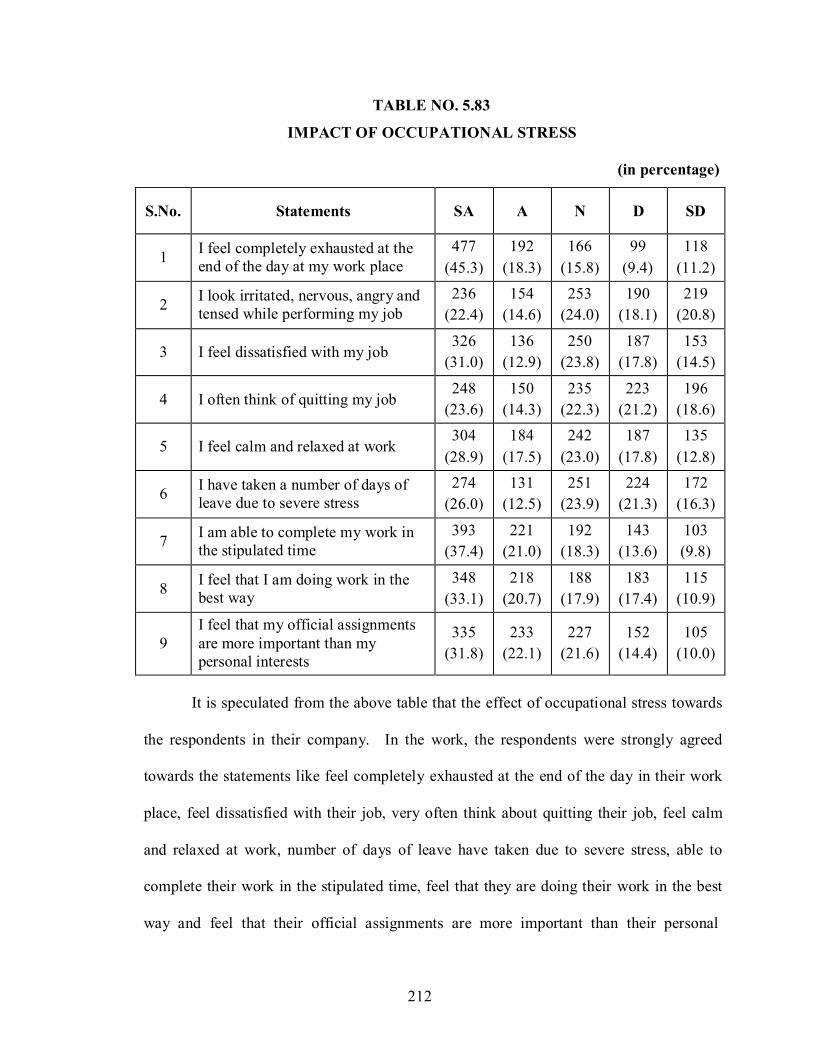
212
TABLE NO. 5.83
IMPACT OF OCCUPATIONAL STRESS
(in percentage)
S.No.
Statements
SA
A
N
D
SD
1 I feel completely exhausted at the
end of the day at my work place
477
(45.3)
192
(18.3)
166
(15.8)
99
(9.4)
118
(11.2)
2 I look irritated, nervous, angry and
tensed while performing my job
236
(22.4)
154
(14.6)
253
(24.0)
190
(18.1)
219
(20.8)
3
I feel dissatisfied with my job 326
(31.0)
136
(12.9)
250
(23.8)
187
(17.8)
153
(14.5)
4
I often think of quitting my job 248
(23.6)
150
(14.3)
235
(22.3)
223
(21.2)
196
(18.6)
5
I feel calm and relaxed at work 304
(28.9)
184
(17.5)
242
(23.0)
187
(17.8)
135
(12.8)
6 I have taken a number of days of
leave due to severe stress
274
(26.0)
131
(12.5)
251
(23.9)
224
(21.3)
172
(16.3)
7 I am able to complete my work in
the stipulated time
393
(37.4)
221
(21.0)
192
(18.3)
143
(13.6)
103
(9.8)
8 I feel that I am doing work in the
best way
348
(33.1)
218
(20.7)
188
(17.9)
183
(17.4)
115
(10.9)
9
I feel that my official assignments
are more important than my
personal interests
335
(31.8)
233
(22.1)
227
(21.6)
152
(14.4)
105
(10.0)
It is speculated from the above table that the effect of occupational stress towards
the respondents in their company. In the work, the respondents were strongly agreed
towards the statements like feel completely exhausted at the end of the day in their work
place, feel dissatisfied with their job, very often think about quitting their job, feel calm
and relaxed at work, number of days of leave have taken due to severe stress, able to
complete their work in the stipulated time, feel that they are doing their work in the best
way and feel that their official assignments are more important than their personal
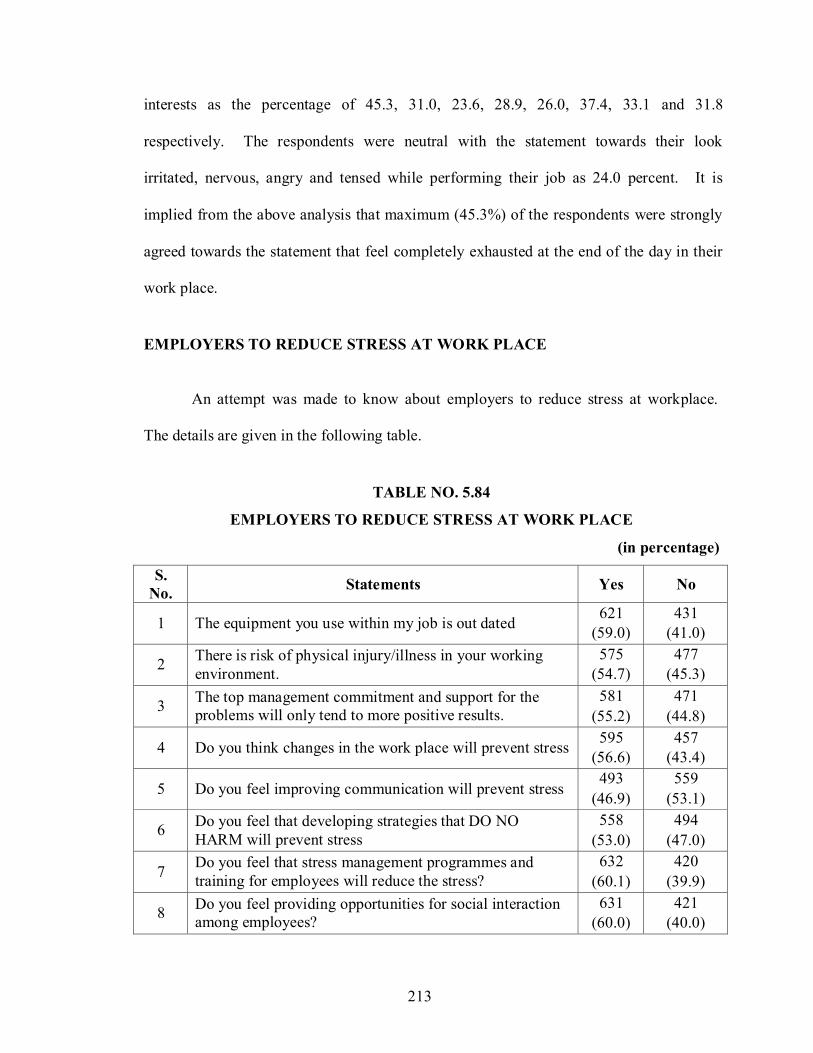
213
interests as the percentage of 45.3, 31.0, 23.6, 28.9, 26.0, 37.4, 33.1 and 31.8
respectively. The respondents were neutral with the statement towards their look
irritated, nervous, angry and tensed while performing their job as 24.0 percent. It is
implied from the above analysis that maximum (45.3%) of the respondents were strongly
agreed towards the statement that feel completely exhausted at the end of the day in their
work place.
EMPLOYERS TO REDUCE STRESS AT WORK PLACE
An attempt was made to know about employers to reduce stress at workplace.
The details are given in the following table.
TABLE NO. 5.84
EMPLOYERS TO REDUCE STRESS AT WORK PLACE
(in percentage)
S.
No.
Statements
Yes
No
1
The equipment you use within my job is out dated 621
(59.0)
431
(41.0)
2 There is risk of physical injury/illness in your working
environment.
575
(54.7)
477
(45.3)
3 The top management commitment and support for the
problems will only tend to more positive results.
581
(55.2)
471
(44.8)
4
Do you think changes in the work place will prevent stress 595
(56.6)
457
(43.4)
5
Do you feel improving communication will prevent stress 493
(46.9)
559
(53.1)
6 Do you feel that developing strategies that DO NO
HARM will prevent stress
558
(53.0)
494
(47.0)
7 Do you feel that stress management programmes and
training for employees will reduce the stress?
632
(60.1)
420
(39.9)
8 Do you feel providing opportunities for social interaction
among employees?
631
(60.0)
421
(40.0)
214
From the above table it is scrutinized that the respondents were agreed with the
employers to reduced the stress in their work place of the respective statements like the
equipment they use within their job is out dated, there is risk of physical injury/illness in
their working environment, the top management commitment and support for the
problems will only tend to more positive results, think changes in the work place will
prevent stress, feel that developing strategies that DO NO HARM will prevent stress,
feel that stress management programmes and training for employees will reduce the stress
and providing opportunities for social interaction among employees as the percentage of
59.0, 54.7, 55.2, 56.6, 53.0, 60.1 and 60.0 respectively. On the other hand, the
respondents were disagreed with the statement that improving communication will
prevent stress as 53.1 percent. It is noted from the analysis that maximum (60.1) of the
respondents were agreed with the statement of the employers to reduced the stress in their
work place by conducting the stress management programmes and training for employees
will reduce the stress.
5.5 HENRY GARRETT RANKING TECHNIQUE
WORK RELATED CAUSES FOR STRESS
In paper industry, each and every person has to experience the stress in their
work. Many factors cause the stress in related with respondents work in the paper
industry. For the purpose of this study, work related causes are categorized into nine
issues viz., temperature, noise, lightening, technology, accident at work place,
cleanliness, health hazards, air pollution and excess work load. The factors are studied
with the help of Henry Garrett ranking technique and the details are shown in the
following table.
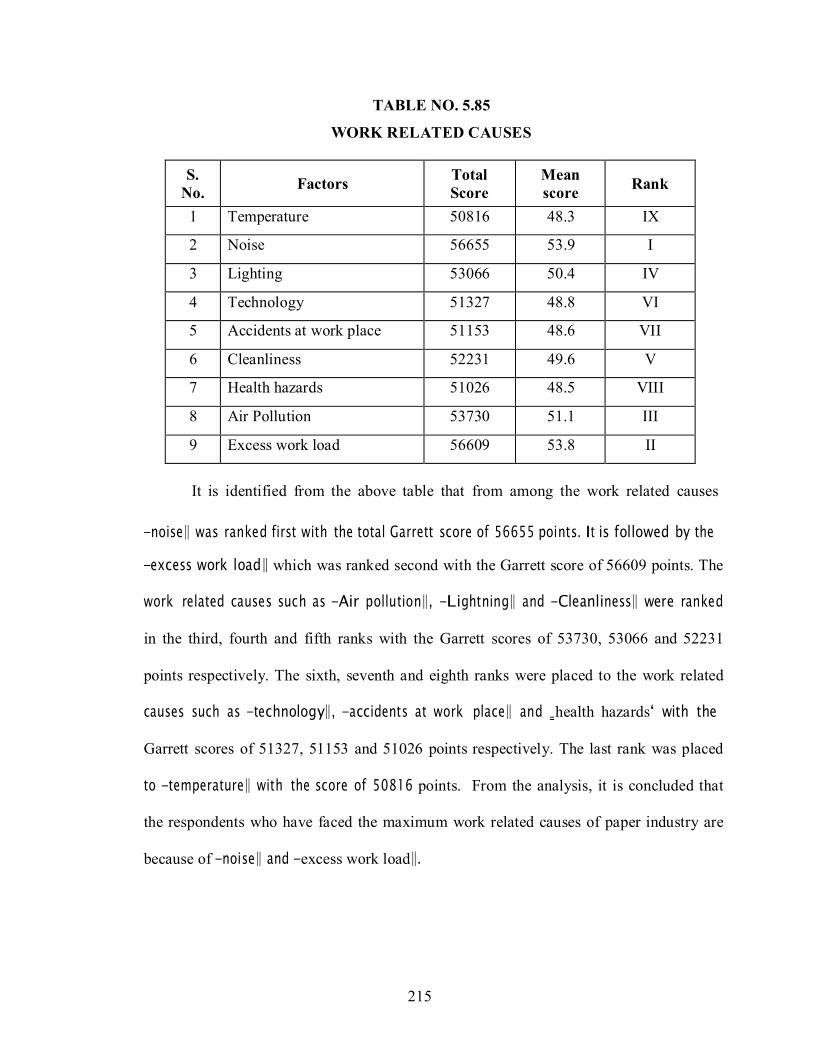
215
TABLE NO. 5.85
WORK RELATED CAUSES
S.
No.
Factors Total
Score
Mean
score
Rank
1 Temperature 50816 48.3 IX
2 Noise 56655 53.9 I
3 Lighting 53066 50.4 IV
4 Technology 51327 48.8 VI
5 Accidents at work place 51153 48.6 VII
6 Cleanliness 52231 49.6 V
7 Health hazards 51026 48.5 VIII
8 Air Pollution 53730 51.1 III
9 Excess work load 56609 53.8 II
It is identified from the above table that from among the work related causes
―noise‖ was ranked first with the total Garrett score of 56655 points. It is followed by the
―excess work load‖ which was ranked second with the Garrett score of 56609 points. The
work related causes such as ―Air pollution‖, ―Lightning‖ and ―Cleanliness‖ were ranked
in the third, fourth and fifth ranks with the Garrett scores of 53730, 53066 and 52231
points respectively. The sixth, seventh and eighth ranks were placed to the work related
causes such as ―technology‖, ―accidents at work place‖ and ‗health hazards‘ with the
Garrett scores of 51327, 51153 and 51026 points respectively. The last rank was placed
to ―temperature‖ with the score of 50816 points. From the analysis, it is concluded that
the respondents who have faced the maximum work related causes of paper industry are
because of ―noise‖ and ―excess work load‖.
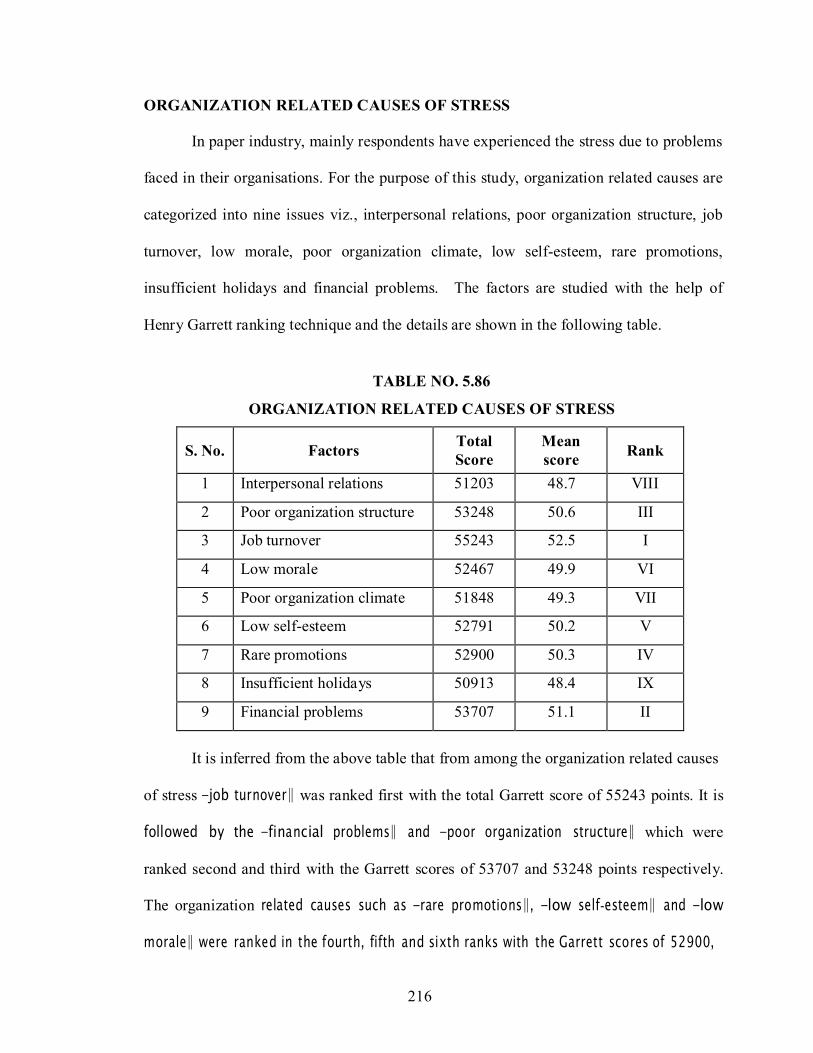
216
ORGANIZATION RELATED CAUSES OF STRESS
In paper industry, mainly respondents have experienced the stress due to problems
faced in their organisations. For the purpose of this study, organization related causes are
categorized into nine issues viz., interpersonal relations, poor organization structure, job
turnover, low morale, poor organization climate, low self-esteem, rare promotions,
insufficient holidays and financial problems. The factors are studied with the help of
Henry Garrett ranking technique and the details are shown in the following table.
TABLE NO. 5.86
ORGANIZATION RELATED CAUSES OF STRESS
S. No.
Factors Total
Score
Mean
score
Rank
1 Interpersonal relations 51203 48.7 VIII
2 Poor organization structure 53248 50.6 III
3 Job turnover 55243 52.5 I
4 Low morale 52467 49.9 VI
5 Poor organization climate 51848 49.3 VII
6 Low self-esteem 52791 50.2 V
7 Rare promotions 52900 50.3 IV
8 Insufficient holidays 50913 48.4 IX
9 Financial problems 53707 51.1 II
It is inferred from the above table that from among the organization related causes
of stress ―job turnover‖ was ranked first with the total Garrett score of 55243 points. It is
followed by the ―financial problems‖ and ―poor organization structure‖ which were
ranked second and third with the Garrett scores of 53707 and 53248 points respectively.
The organization related causes such as ―rare promotions‖, ―low self-esteem‖ and ―low
morale‖ were ranked in the fourth, fifth and sixth ranks with the Garrett scores of 52900,
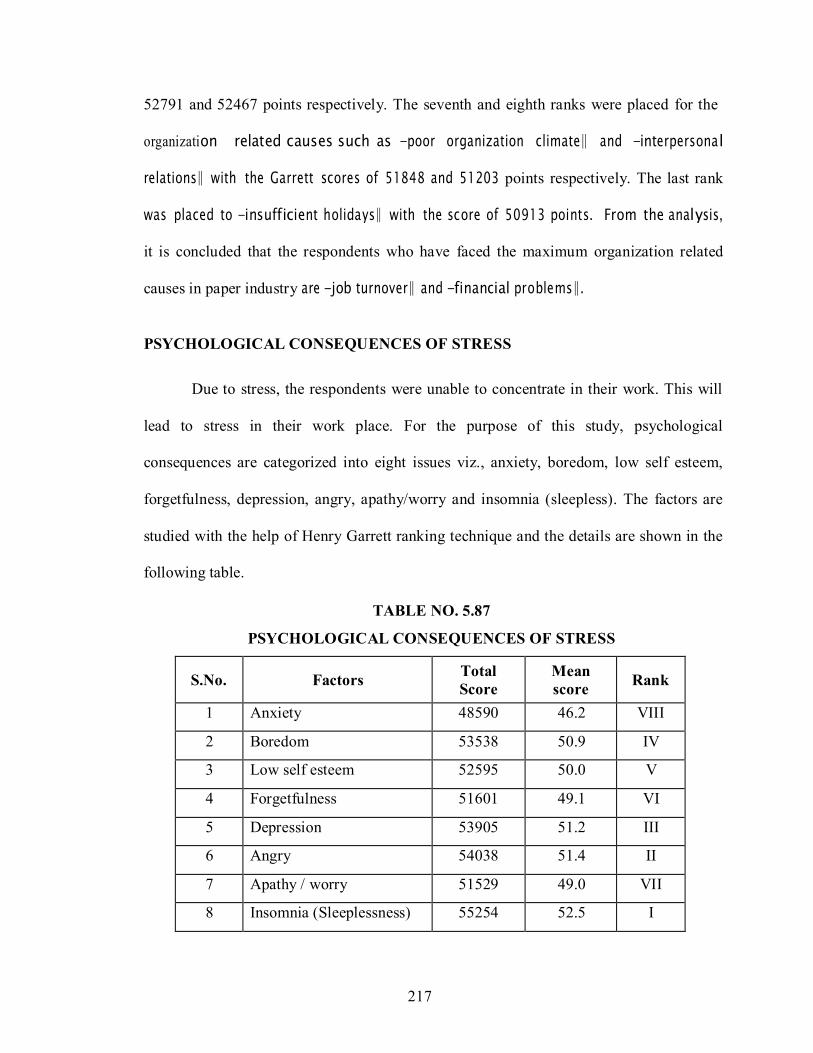
217
52791 and 52467 points respectively. The seventh and eighth ranks were placed for the
organization related causes such as ―poor organization climate‖ and ―interpersonal
relations‖ with the Garrett scores of 51848 and 51203 points respectively. The last rank
was placed to ―insufficient holidays‖ with the score of 50913 points. From the analysis,
it is concluded that the respondents who have faced the maximum organization related
causes in paper industry are ―job turnover‖ and ―financial problems‖.
PSYCHOLOGICAL CONSEQUENCES OF STRESS
Due to stress, the respondents were unable to concentrate in their work. This will
lead to stress in their work place. For the purpose of this study, psychological
consequences are categorized into eight issues viz., anxiety, boredom, low self esteem,
forgetfulness, depression, angry, apathy/worry and insomnia (sleepless). The factors are
studied with the help of Henry Garrett ranking technique and the details are shown in the
following table.
TABLE NO. 5.87
PSYCHOLOGICAL CONSEQUENCES OF STRESS
S.No.
Factors Total
Score
Mean
score
Rank
1 Anxiety 48590 46.2 VIII
2 Boredom 53538 50.9 IV
3 Low self esteem 52595 50.0 V
4 Forgetfulness 51601 49.1 VI
5 Depression 53905 51.2 III
6 Angry 54038 51.4 II
7 Apathy / worry 51529 49.0 VII
8 Insomnia (Sleeplessness) 55254 52.5 I
218
It is identified from the above table that the psychological causes ―Insomnia
(Sleeplessness)‖ was ranked first with the total Garrett score of 55254 points. It is
followed by the consequence of being ―angry‖ which was ranked second with the Garrett
score of 54038 points. The factors such as ―depression‖, ―boredom‖ and ―low self-
esteem‖ were ranked in the third, fourth and fifth ranks with the Garrett scores of 53905,
53538 and 52595 points respectively. The sixth and seventh ranks were placed to
―forgetfulness‖ and ―apathy/worry‖ with the Garrett scores of 51601 and 51529 points
respectively. The last rank was placed to ―anxiety‖ with the score of 48590 points. From
the analysis, it is concluded that the respondents who have faced the most psychological
consequences of the paper industries are ―Insomnia (Sleeplessness)‖ and being ―angry‖.
PHYSICAL CONSEQUENCES
Physical health is very important for every human being. The depression of stress
makes ones physical body to undergo many problems. For the purpose of this study,
physical consequences are categorized into seven issues viz., headache, diabetes,
hypertension, skin disorder, ulcers, hair loss and stomach upset. The factors are studied
with the help of Henry Garrett ranking technique and the details are shown in the
following table.
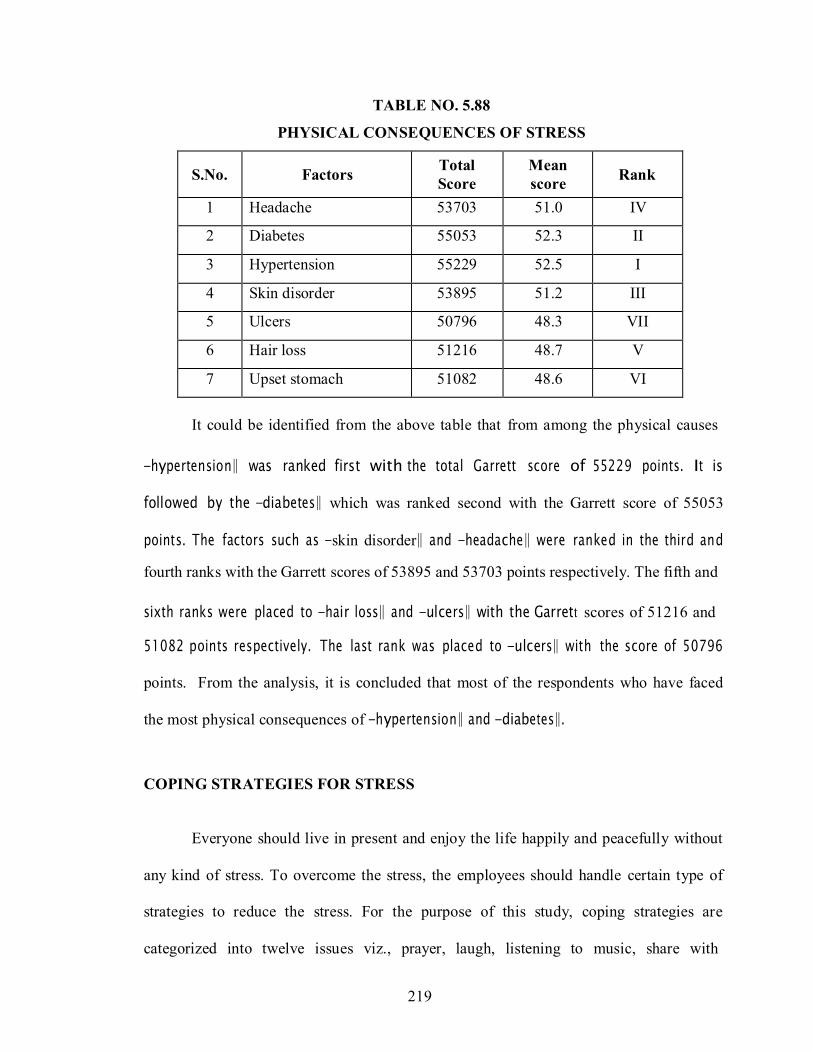
219
TABLE NO. 5.88
PHYSICAL CONSEQUENCES OF STRESS
S.No.
Factors Total
Score
Mean
score
Rank
1 Headache 53703 51.0 IV
2 Diabetes 55053 52.3 II
3 Hypertension 55229 52.5 I
4 Skin disorder 53895 51.2 III
5 Ulcers 50796 48.3 VII
6 Hair loss 51216 48.7 V
7 Upset stomach 51082 48.6 VI
It could be identified from the above table that from among the physical causes
―hypertension‖ was ranked first with the total Garrett score of 55229 points. It is
followed by the ―diabetes‖ which was ranked second with the Garrett score of 55053
points. The factors such as ―skin disorder‖ and ―headache‖ were ranked in the third and
fourth ranks with the Garrett scores of 53895 and 53703 points respectively. The fifth and
sixth ranks were placed to ―hair loss‖ and ―ulcers‖ with the Garrett scores of 51216 and
51082 points respectively. The last rank was placed to ―ulcers‖ with the score of 50796
points. From the analysis, it is concluded that most of the respondents who have faced
the most physical consequences of ―hypertension‖ and ―diabetes‖.
COPING STRATEGIES FOR STRESS
Everyone should live in present and enjoy the life happily and peacefully without
any kind of stress. To overcome the stress, the employees should handle certain type of
strategies to reduce the stress. For the purpose of this study, coping strategies are
categorized into twelve issues viz., prayer, laugh, listening to music, share with
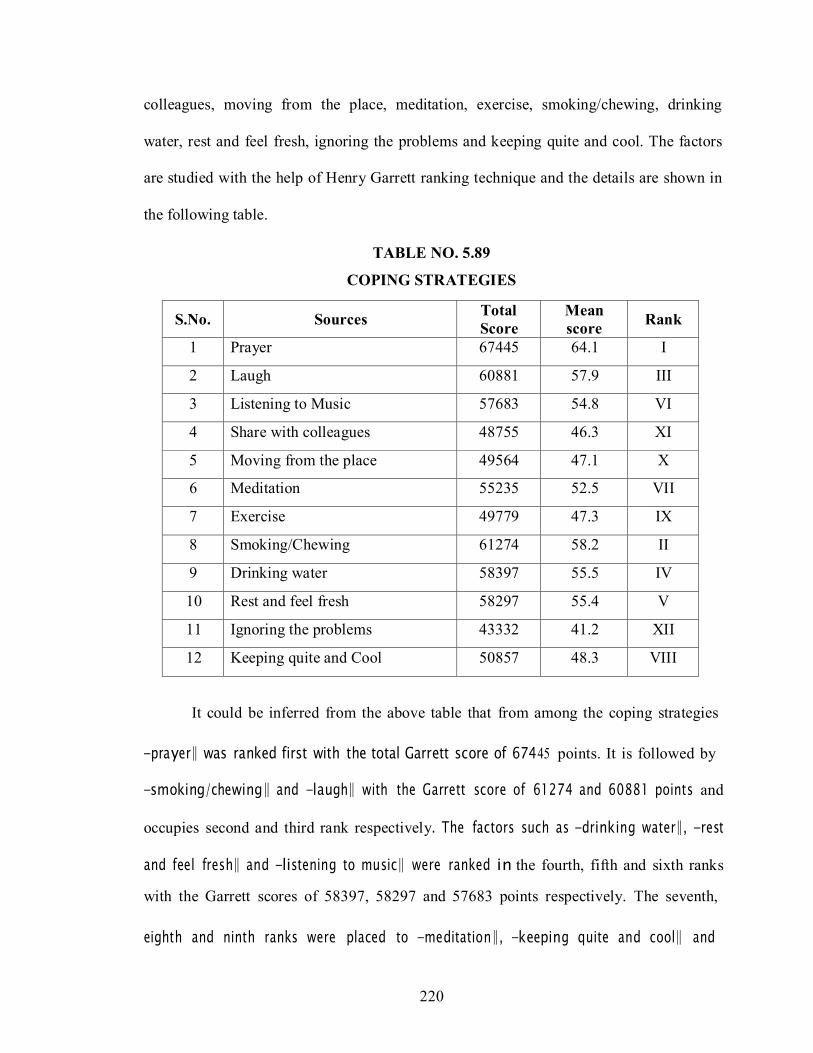
220
colleagues, moving from the place, meditation, exercise, smoking/chewing, drinking
water, rest and feel fresh, ignoring the problems and keeping quite and cool. The factors
are studied with the help of Henry Garrett ranking technique and the details are shown in
the following table.
TABLE NO. 5.89
COPING STRATEGIES
S.No.
Sources Total
Score
Mean
score
Rank
1 Prayer 67445 64.1 I
2 Laugh 60881 57.9 III
3 Listening to Music 57683 54.8 VI
4 Share with colleagues 48755 46.3 XI
5 Moving from the place 49564 47.1 X
6 Meditation 55235 52.5 VII
7 Exercise 49779 47.3 IX
8 Smoking/Chewing 61274 58.2 II
9 Drinking water 58397 55.5 IV
10 Rest and feel fresh 58297 55.4 V
11 Ignoring the problems 43332 41.2 XII
12 Keeping quite and Cool 50857 48.3 VIII
It could be inferred from the above table that from among the coping strategies
―prayer‖ was ranked first with the total Garrett score of 67445 points. It is followed by
―smoking/chewing‖ and ―laugh‖ with the Garrett score of 61274 and 60881 points and
occupies second and third rank respectively. The factors such as ―drinking water‖, ―rest
and feel fresh‖ and ―listening to music‖ were ranked in the fourth, fifth and sixth ranks
with the Garrett scores of 58397, 58297 and 57683 points respectively. The seventh,
eighth and ninth ranks were placed to ―meditation‖, ―keeping quite and cool‖ and

221
―exercise‖ with the Garrett scores of 55235, 50857 and 49779 points respectively. The
factors such as ―moving from the place‖ and ―sharing with colleagues‖ were ranked in
the tenth and eleventh ranks with the Garrett scores of 49564 and 48755 points
respectively. The last rank was placed to ―ignoring the problems‖ with the score of 43332
points. From the analysis, it is concluded that from among the coping strategies to reduce
the stress ―prayers‖ and ―smoking/chewing‖ at the time of work in paper industry has
been opted by most of the respondents when compared to others.
5.6 MULTIPLE REGRESSION ANALYSIS – LEVEL OF STRESS
In the following analysis, the relationship between the level of stress among the
employees who are working in paper industry in Tamilnadu and twelve independent
factors were studied. It was found that out of twelve factors, ten factors were closely
associated with the level of stress by the selected sample respondents.
Selected twelve independent factors are.
1. Age
2. Gender
3. Educational status
4. Designation
5. Department
6. Salary
7. Marital Status
8. Number of dependents
9. Family System

222
10. Experience
11. Company working
12. Working Time
In order to measure the interdependence of independent factors and their level of
stress while working in paper industry in Tamilnadu, the results were subjected to
multiple regression analysis. The results of multiple regression analysis are shown in
Table No. 5.90.
TABLE 5.90
MULTIPLE REGRESSION ANALYSIS
Sl.
No.
Variables
Unstandardized
coefficients
Standardized
coefficients
T
Sig.
B Std.
Error
Beta
(Constant) 0.960 0.114
1 Age -0.003 0.011 -0.009 -0.292 NS
2 Gender 0.218 0.095 0.070 2.293 5%
3 Educational Qualification
0.068
0.025
0.085
2.758
1%
4 Designation -0.410 0.040 -0.303 -10.33 1%
5 Department 0.101 0.044 0.068 2.332 1%
6 Salary 0.053 0.023 0.070 2.247 5%
7 Marital Status 0.024 0.015 0.049 1.579 NS
8. Number of dependents 0.142 0.072 0.060 1.985 5%
9 Family system 0.111 0.047 0.071 2.337 5%
10 Experience 0.433 0.078 0.169 5.524 1%
11 Company working 0.072 0.033 0.069 2.161 5%
12 Working time 0.023 0.010 0.072 2.293 5%
R-Value R2
-Value Degree of
freedom – V1
Degree of
freedom – V2
F Value Significance
0.944 0.892 12 1039 711.90 1% Level

223
The multiple linear regression co-efficient (dependent variable) is found to be
statistically good fit as R2
is 0.892. It shows that independent variables contribute about
89.2 per cent of the variation in their level of stress and this is statistically significant at
1% level and 5% level respectively.
The table indicated that the co-efficient of Gender, Educational Qualification,
Department, Salary, Number of dependents, Family system, Experience, Company
Working and Working time are positively associated with the level of stress among the
employees in paper industry. On the other hand, the co-efficient of Designation is
negatively associated. The co-efficient of age and marital status are not associated with
the level of stress among the employees in paper industry. Further, it is indicated that the
contribution of Gender, Educational Qualification, Department, Salary, Number of
dependents, Family system, Experience, Company Working and Working time are
statistically significant implying that their level of stress is stronger than other variables.
Thus from the above analysis, the following observation could be made. The level
of stress is positively associated with their Gender, Educational Qualification,
Department, Salary, Number of dependents, Family system, Experience, Company
Working and Working time among the selected employees in the paper industry of
Tamilnadu.
5.7 DISCRIMINANT FUNCTION ANALYSIS
Opinions of employees towards their stress according to their experience in paper
industry of Tamilnadu were collected. In the study area 1052 respondents were divided
into two groups, one showing low level of stress and the other showing high level of
224
stress. The difference of opinion among the respondents in one group with the other was
studied with the help of discriminant function analysis. For the purpose of the study
twelve variables were selected.
1. Age
2. Gender
3. Educational status
4. Designation
5. Department
6. Salary
7. Marital Status
8. Number of dependents
9. Family System
10. Experience
11. Company Working
12. Working Time
The discriminant function analysis was attempted to construct a function with
these and other variables, so that the respondents belonging to these two groups are
differentiated at the maximum. The linear combination of variables is known as
discriminant function and its parameters are called discriminant function coefficients. In
constructing this discriminant function, all the variables which contribute more to
differentiate these two groups were examined.

225
Mahalanobis minimum D2
method is based on the generalized squared Euclidean
distance that adjusts for unequal variances in the variables. The major advantage of this
procedure is that it is computed in the original space of the predictor (independent)
variables rather than as a collapsed version which is used in the other method.
Generally, all the variables selected will not contribute to explain the maximum
discriminatory power of the function. So a selection rule is applied based on certain
criteria to include those variables which best discriminate. Stepwise selection method was
applied in constructing discriminant function which selects one variable at a time to
include in the function. Before entering into the function, the variables are examined for
inclusion in the function.
The variables which have maximum D2
value, if entered into the function are
selected for inclusion in the function. Once entered, any variable already in the equation
is again considered for removal based on certain removal criteria. Likewise, at each step,
the next best discriminating variable is selected and included in the function and any
variable already included in the function is considered for removal, based on the selection
and removal criteria respectively.
DISCRIMINANT ANALYSIS FOR THE PROBLEM UNDER STUDY
Since discriminant function analysis involved classification problem also, to
ascertain the efficiency of the discriminant function analysis all the variables which
satisfy the entry and removal criteria were entered into the function. Normally, the criteria
used to select the variables for inclusion in the function is minimum ‗F‘, to enter
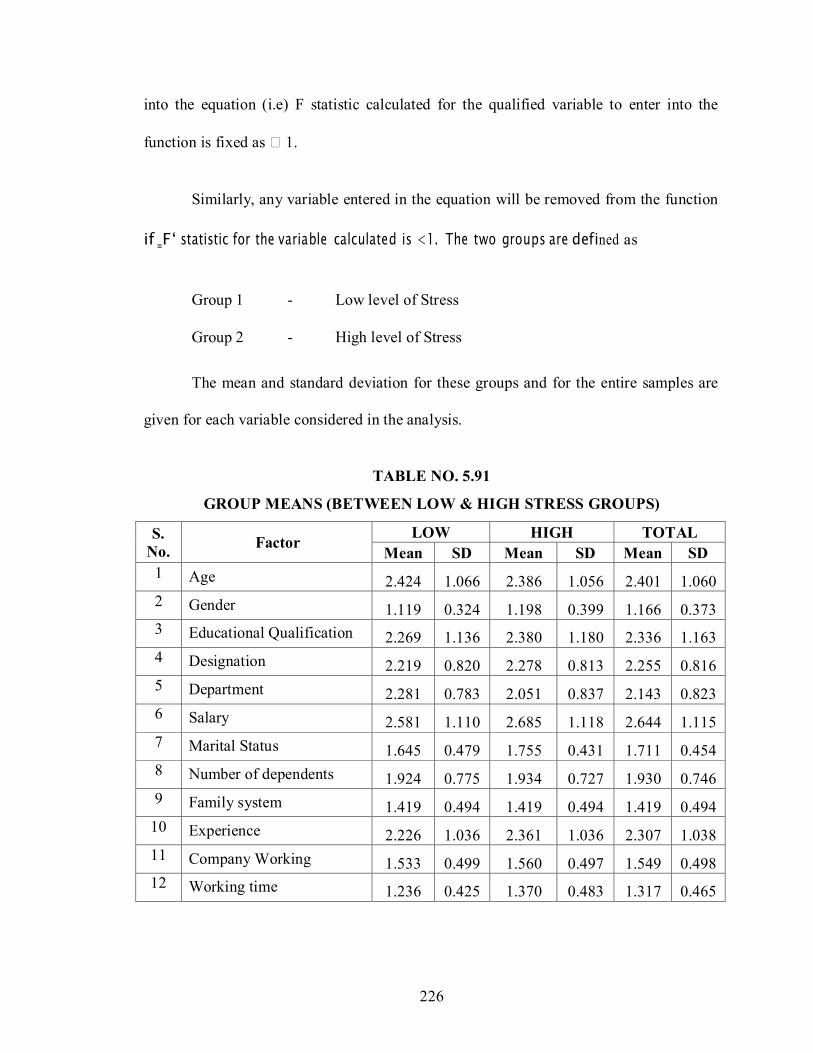
226
into the equation (i.e) F statistic calculated for the qualified variable to enter into the
function is fixed as 1.
Similarly, any variable entered in the equation will be removed from the function
if ‗F‘ statistic for the variable calculated is <1. The two groups are defined as
Group 1 - Low level of Stress
Group 2 - High level of Stress
The mean and standard deviation for these groups and for the entire samples are
given for each variable considered in the analysis.
TABLE NO. 5.91
GROUP MEANS (BETWEEN LOW & HIGH STRESS GROUPS)
S.
No.
Factor LOW HIGH TOTAL
Mean SD Mean SD Mean SD
1 Age
2.424
1.066
2.386
1.056
2.401
1.060
2 Gender
1.119
0.324
1.198
0.399
1.166
0.373
3 Educational Qualification
2.269
1.136
2.380
1.180
2.336
1.163
4 Designation
2.219
0.820
2.278
0.813
2.255
0.816
5 Department
2.281
0.783
2.051
0.837
2.143
0.823
6 Salary
2.581
1.110
2.685
1.118
2.644
1.115
7 Marital Status
1.645
0.479
1.755
0.431
1.711
0.454
8 Number of dependents
1.924
0.775
1.934
0.727
1.930
0.746
9 Family system
1.419
0.494
1.419
0.494
1.419
0.494
10 Experience
2.226
1.036
2.361
1.036
2.307
1.038
11 Company Working
1.533
0.499
1.560
0.497
1.549
0.498
12 Working time
1.236
0.425
1.370
0.483
1.317
0.465
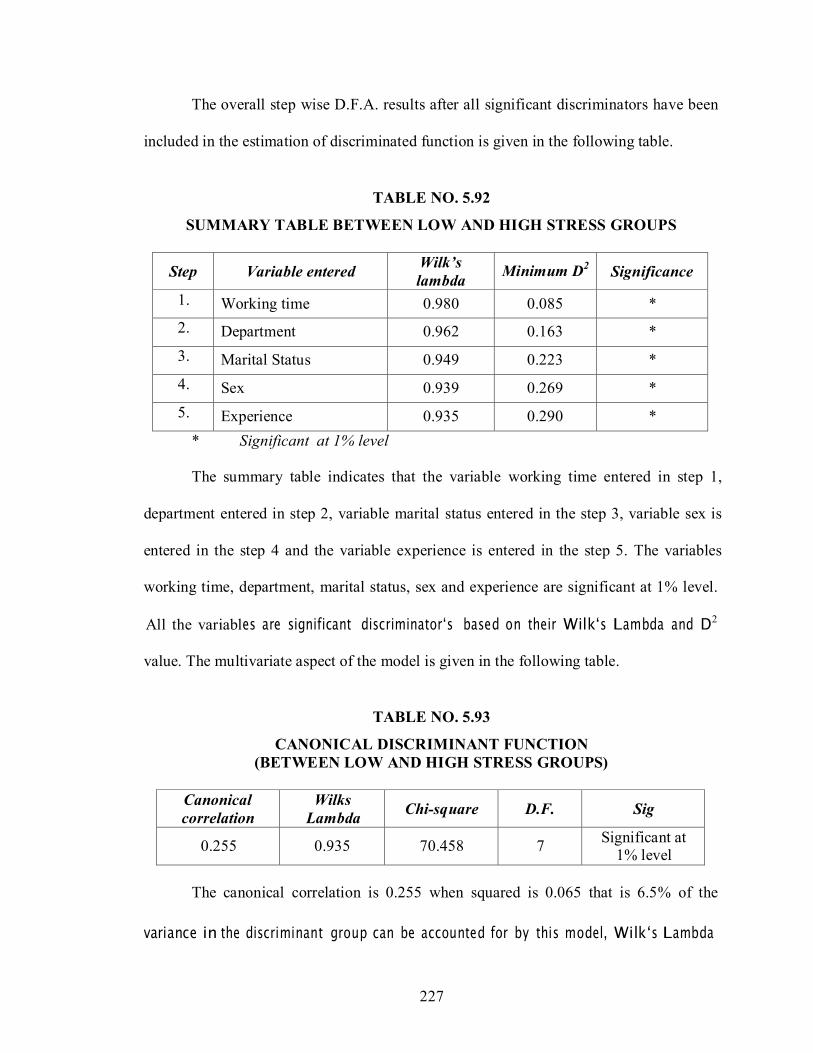
227
The overall step wise D.F.A. results after all significant discriminators have been
included in the estimation of discriminated function is given in the following table.
TABLE NO. 5.92
SUMMARY TABLE BETWEEN LOW AND HIGH STRESS GROUPS
Step
Variable entered Wilk’s
lambda Minimum D
2
Significance
1. Working time 0.980 0.085 *
2. Department 0.962 0.163 *
3. Marital Status 0.949 0.223 *
4. Sex 0.939 0.269 *
5. Experience 0.935 0.290 *
* Significant at 1% level
The summary table indicates that the variable working time entered in step 1,
department entered in step 2, variable marital status entered in the step 3, variable sex is
entered in the step 4 and the variable experience is entered in the step 5. The variables
working time, department, marital status, sex and experience are significant at 1% level.
All the variables are significant discriminator‘s based on their Wilk‘s Lambda and D2
value. The multivariate aspect of the model is given in the following table.
TABLE NO. 5.93
CANONICAL DISCRIMINANT FUNCTION
(BETWEEN LOW AND HIGH STRESS GROUPS)
Canonical
correlation
Wilks
Lambda
Chi-square
D.F.
Sig
0.255
0.935
70.458
7 Significant at
1% level
The canonical correlation is 0.255 when squared is 0.065 that is 6.5% of the
variance in the discriminant group can be accounted for by this model, Wilk‘s Lambda

228
and chi-square value suggested that D.F. is significant at 1% level. The variables given
above are identified finally by the D.F.A. as the eligible discriminating variables. Based
on the selected variables, the corresponding D.F. coefficients are calculated. They are
given in the following table.
TABLE NO. 5.94
DISCRIMINANT FUNCTION COEFFICIENTS
(BETWEEN LOW AND HIGH STRESS GROUPS)
Gender 1.096
Department -0.671
Marital Status 1.049
Experience 0.260
Working Time 1.094
Constant -3.677
Z = - 3.677
+ 1.096
(Gender)
- 0.671
(Department)
+ 1.049
(Marital Status)
+ 0.260
(Experience)
+ 1.094
(Working Time)
Using this D.F. coefficients and variables, discriminating scores for 2 groups are
found out which are called group centroids or group means.
For low stress (Z1) it is – 0.323
For high stress (Z2) it is + 0.215
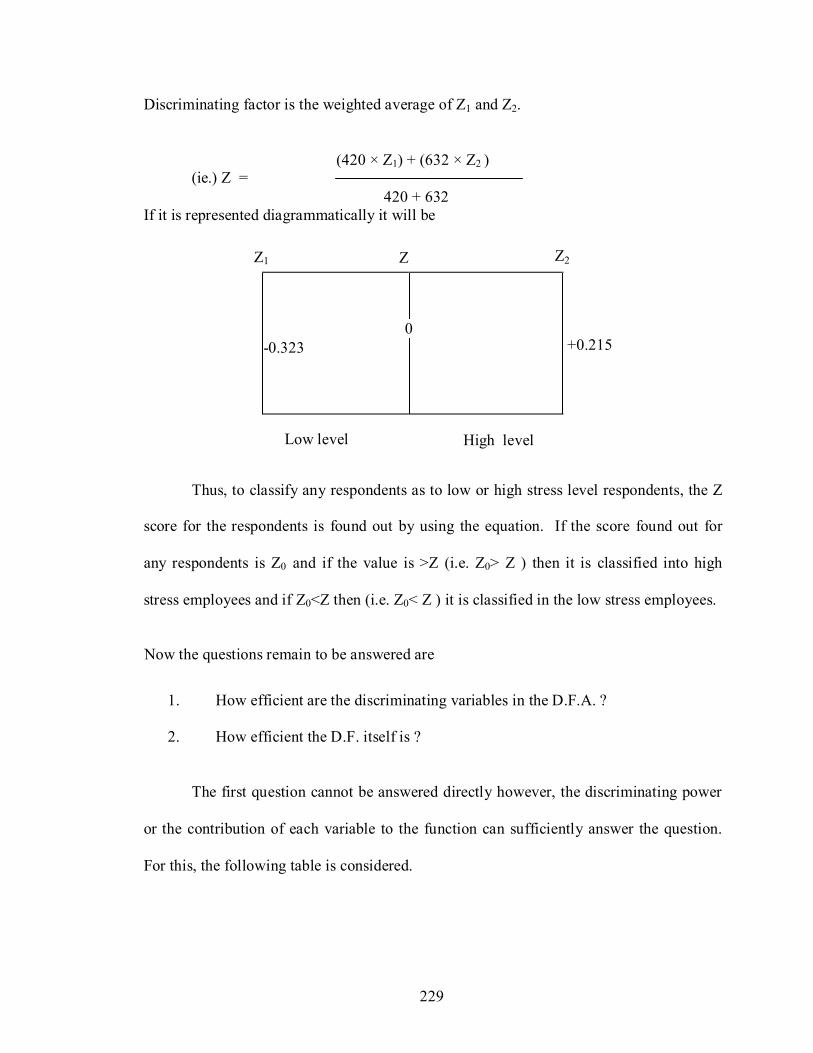
229
0
-0.323
Discriminating factor is the weighted average of Z1 and Z2.
(ie.) Z = (420 × Z1) + (632 × Z2 )
420 + 632
If it is represented diagrammatically it will be
Z1 Z Z2
+0.215
Low level High level
Thus, to classify any respondents as to low or high stress level respondents, the Z
score for the respondents is found out by using the equation. If the score found out for
any respondents is Z0 and if the value is >Z (i.e. Z0> Z ) then it is classified into high
stress employees and if Z0<Z then (i.e. Z0< Z ) it is classified in the low stress employees.
Now the questions remain to be answered are
1. How efficient are the discriminating variables in the D.F.A. ?
2. How efficient the D.F. itself is ?
The first question cannot be answered directly however, the discriminating power
or the contribution of each variable to the function can sufficiently answer the question.
For this, the following table is considered.

230
TABLE NO. 5.95
RELATIVE DISCRIMINATING INDEX
(BETWEEN LOW AND HIGH STRESS GROUPS)
Variables
Group 1
Mean X1
Group 2
Mean X2
Unstandardized
dic. Coeff. (kj)
Ij = ABS (Kj)
Mean
(Xjo – x ji)
Rj = Ij /
sum
Ij j*100
Gender 1.119 1.198 1.096 0.946 33.5
Department 2.281 2.051 -0.671 0.310 11.0
Marital Status 1.645 1.755 1.049 0.617 21.8
Experience 2.226 2.361 0.260 0.113 4.0
Working Time 1.236 1.370 1.094 0.840 29.7
Total 2.826 100.0
RELATIVE DISCRIMINATING INDEX
For each variable, the respective D.F. co-efficient, its mean for each group and Rj
are given. Rj called relative discriminating index is calculated from the discriminant
function coefficient and group means. Rj tells how much each variable is contributing
(%) to the function. By looking at this column it is found that ‗Gender‘ is maximum
discriminating variable and ‗Experience‘ is the least discriminating variable.
The second question is answered by reclassifying the already grouped individuals
into low or high level of stress the D.F.(Z) defined in the equation. This reclassification is
called predictor group membership. In short, the efficiency of the D.F. is how correctly it
predicts the respondents into respective groups.
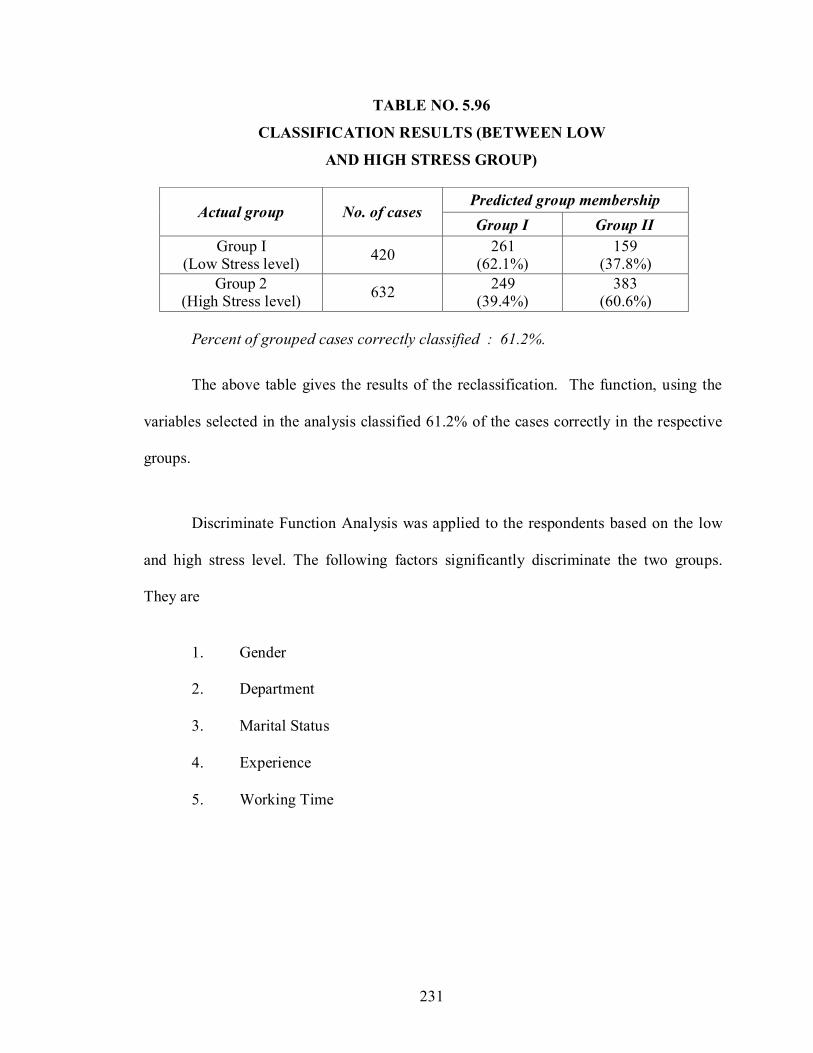
231
TABLE NO. 5.96
CLASSIFICATION RESULTS (BETWEEN LOW
AND HIGH STRESS GROUP)
Actual group
No. of cases Predicted group membership
Group I Group II
Group I (Low Stress level)
420 261
(62.1%) 159
(37.8%)
Group 2 (High Stress level)
632 249
(39.4%) 383
(60.6%)
Percent of grouped cases correctly classified : 61.2%.
The above table gives the results of the reclassification. The function, using the
variables selected in the analysis classified 61.2% of the cases correctly in the respective
groups.
Discriminate Function Analysis was applied to the respondents based on the low
and high stress level. The following factors significantly discriminate the two groups.
They are
1. Gender
2. Department
3. Marital Status
4. Experience
5. Working Time
232
5.8 FACTOR ANALYSIS
Factor analysis is a branch of multivariate analysis that is concerned with the
sharp internal relationship of a set of variables. The numerous variables used in a multi
item scale such as that utilized in the thesis, can be analyzed of those variables could be
seen approximately explaining a single factor. Both Exploratory Factor Analyses (EFA)
and Confirmatory Factor Analyses (CFA) were used in this thesis. EFA refers to the
determination of the number of common factors necessary and sufficient to account for
the inter correlations of a given set of variables. It is traditionally used to explore the
possible underlying structure of a set of items without imposing any structure.
CFA on the other hand is where the number of factor is assumed to be known and
the main issue is to fit a postulated pattern of zero and non zero loading to a given
correlation matrix. CFA more of a theory testing, rather than a theory rating method as it
is based on strong theoretical and empirical foundation. Data obtained were investigated
by an exploratory factor analysis to determine the number of latent constructs underlying
the variables. This was then used in the CFA carried out by utilizing the first or second
order CFA for the various scales used in the tests.
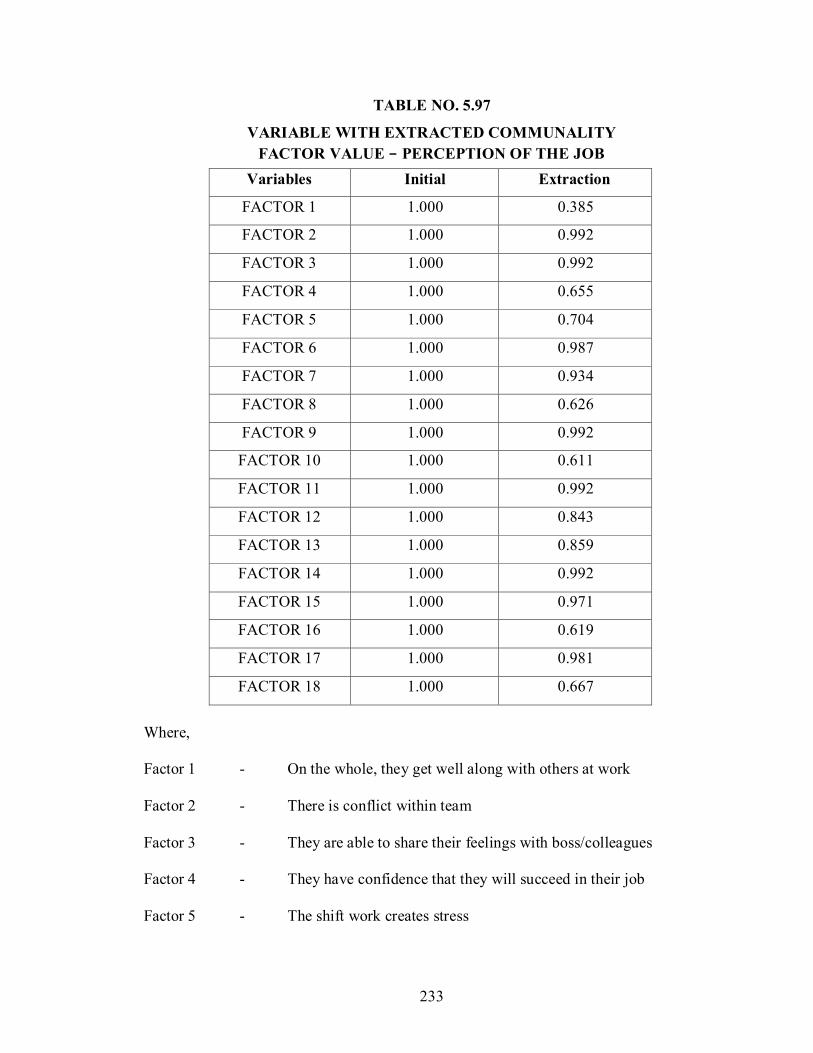
233
TABLE NO. 5.97
VARIABLE WITH EXTRACTED COMMUNALITY
FACTOR VALUE – PERCEPTION OF THE JOB
Variables Initial Extraction
FACTOR 1 1.000 0.385
FACTOR 2 1.000 0.992
FACTOR 3 1.000 0.992
FACTOR 4 1.000 0.655
FACTOR 5 1.000 0.704
FACTOR 6 1.000 0.987
FACTOR 7 1.000 0.934
FACTOR 8 1.000 0.626
FACTOR 9 1.000 0.992
FACTOR 10 1.000 0.611
FACTOR 11 1.000 0.992
FACTOR 12 1.000 0.843
FACTOR 13 1.000 0.859
FACTOR 14 1.000 0.992
FACTOR 15 1.000 0.971
FACTOR 16 1.000 0.619
FACTOR 17 1.000 0.981
FACTOR 18 1.000 0.667
Where,
Factor 1 - On the whole, they get well along with others at work
Factor 2 - There is conflict within team
Factor 3 - They are able to share their feelings with boss/colleagues
Factor 4 - They have confidence that they will succeed in their job
Factor 5 - The shift work creates stress

234
Factor 6 - Intellectual / Technical demands of a job are the source of stress
for them
Factor 7 - The work assigned to them is monotonous
Factor 8 - Interruption makes it difficult to complete all their work
Factor 9 - They are satisfied by the corrective measures given by the
organization
Factor 10 - The employees feel that the leadership style in their organization is
appropriate
Factor 11 - They are able to complete the work assigned to them
Factor 12 - The things they need to know they are getting informed
Factor 13 - They have too many work demands at the same time
Factor 14 - They feel anxious and apprehensive when they are at work
Factor 15 - For all new tasks, they are receiving adequate training
Factor 16 - Their opinion is not sought in solving organization problems
Factor 17 - The levels of physical effort required in job are stress for them
Factor 18 - Job stress leads to physical as well as mental health problems
The following table reveals that the extraction has been undertaken by using
principal-component method and the initial Eigen values are formulated from the
communalities table and the same has been developed as extraction sums of squared
loadings with percentage of variance and the relative cumulative percentage. From the
initial Eigen values and the extraction sums of squared loadings values, the rotation sums
of squared loadings has been formulated and shown in the following table.

TABLE NO. 5.98
TOTAL VARIANCE – PERCEPTION OF THE JOB
Component
Initial Eigen values Extraction Sum./s of Squared
Loadings
Rotation Sums of Squared
Loadings
Total
percentage
of
Variance
Cumulative
percentage
Total
percentage
of
Variance
Cumulative
percentage
Total
percentage
of
Variance
Cumulative
percentage
1 9.125 50.695 50.695 9.125 50.695 50.695 8.961 49.786 49.786
2 1.854 10.300 60.995 1.854 10.300 60.995 1.788 9.931 59.717
3 1.477 8.207 69.202 1.477 8.207 69.202 1.386 7.700 67.417
4 1.259 6.994 76.197 1.259 6.994 76.197 1.383 7.684 75.101
5 1.088 6.046 82.243 1.088 6.046 82.243 1.286 7.142 82.243
6 .845 4.694 86.936
7 .728 4.042 90.978
8 .632 3.508 94.486
9 .576 3.199 97.685
10 .274 1.521 99.206
11 .072 .400 99.607
12 .043 .238 99.844
13 .013 .071 99.916
14 .011 .062 99.978
15 .004 .022 100.000
16 .000 .000 100.000
17 .000 .000 100.000
18 .000 .000 100.000
Extraction Method: Principal Component Analysis
235

236
The extraction process has been carried out by using principal-component
method, and it is found from the rotation sums of squared loadings and the total sum
of twenty five variables has been extracted and the same has been grouped into five
components which have Eigen value of more than one. It ranges from component no.
1 to component no. 5 with the cumulative percentage from 50.695 percent to 82.243
percent. The percentage of variance ranges from 49.786percentage to
7.142percentage. For the fifth component of initial Eigen values, the total, percentage
of variance and the cumulative percentage values are 1.088, 6.046 percentage and
82.243 respectively. The extracted sum of squared loadings for the same are 1.088,
6.046 percentage and 82.243 percentage respectively. The rotation sums of squared
loadings for the above are 1.286, 7.142 and 82.243 respectively.
From the analysis, it is inferred that the factor analysis has been supported up
to 82.243 percentage in this study. This is an excellent result and made the study
reliable to the analysis.
The following table has been formulated by using ‗principal-component
method‘ for extraction of variables into components and Varimax with Kaiser
Normalization has been done by using ‗rotation method‘. All the eighteen variables
have been grouped into five components and each component consists of sets of
factors and the analysis has been made to identify the influence of one variable over
another.

237
TABLE NO. 5.99
ROTATED COMPONENT MATRIX a –
PERCEPTION OF THE JOB
Variable No. Component
1 2 3 4 5
FACTOR 1
FACTOR 2 .992
FACTOR 3 .992
FACTOR 4 .750
FACTOR 5 -.838
FACTOR 6 .989
FACTOR 7 .952
FACTOR 8 .760
FACTOR 9 .992
FACTOR 10 .744
FACTOR 11 .992
FACTOR 12 .912
FACTOR 13 .924
FACTOR 14 .992
FACTOR 15 .977
FACTOR 16 .780
FACTOR 17 .986
FACTOR 18 .809
Extraction Method: Principal Component Analysis
Rotation Method: Varimax with Kaiser Normalization
a. Rotation converged in 5 iterations
It is observed from the above table that the following are the results extracted
from the rotated component matrix among eighteen variables. Among the eighteen
variables the Component factor 1 consisted of nine variables which have high
influence with one another. They are variable no. 2,3,6,7,9,11,14,15 and 17.

238
Component factor 2 consisted of two variables which have high influence with one
another and they are 12 and 13. Component factor 3 has two closely influencing
variables and the numbers are 4 and 5. Component factor 4 has two high influencing
variables and the variable numbers are 16 and 18 respectively. Component factor 5
consisted of two closely related variables and their numbers are 8 and 10.
From the above factor analysis, it has been identified that all the eighteen
factors are very much closely associated with one another and the same has been
analyzed by using factor analysis and the influence of one factor with another has
been tested and the same has succeeded in measuring the correlation between the
particular variable and the factor with 82.243 percent reliability and the factor
analysis supported the study.
CONCLUSION
In this chapter, the researcher discussed about the socio-economic conditions
of the employees, the level of perception of the employees, occupational stress of the
employees and different category of causes in different situations who are working in
paper industries in Tamilnadu. From the analysis, majority of the employees are
having high level of perception while working in Paper Industries. From the selected
independent factors, the factors like age, gender, educational qualification,
designation, working department, monthly income level, marital status, number of
dependents, family system, working experience, working company and working time
are closed associated with their level of perception. On the other hand, the selected
239
independent factors are not having any significant difference with the occupational
stress of them.
While in the case of work related causes, the respondents are facing the
problems like loud sound and excess work load. In analyzing with organization
related causes, the respondents caused by job turnover problem and financial
problems. The respondents attend the psychological problems like ‗Insomnia
(sleeplessness)‘ and ‗angry‘ while in working in the company. Physical problems like
‗hypertension‘ and ‗diabetes‘ are also faced by the selected respondents.
From the selected twelve coping strategies, majority of the respondents are
using ‗Prayer‘ for reducing the problems followed by ‗Smoking / Chewing‘ for
managing the stress.