chapter v - planning department(uttar pradesh)planning.up.nic.in/annual plan 2012-13 for … ·...
TRANSCRIPT
Chapter -I
Farm Sector In Uttar Pradesh
Agriculture
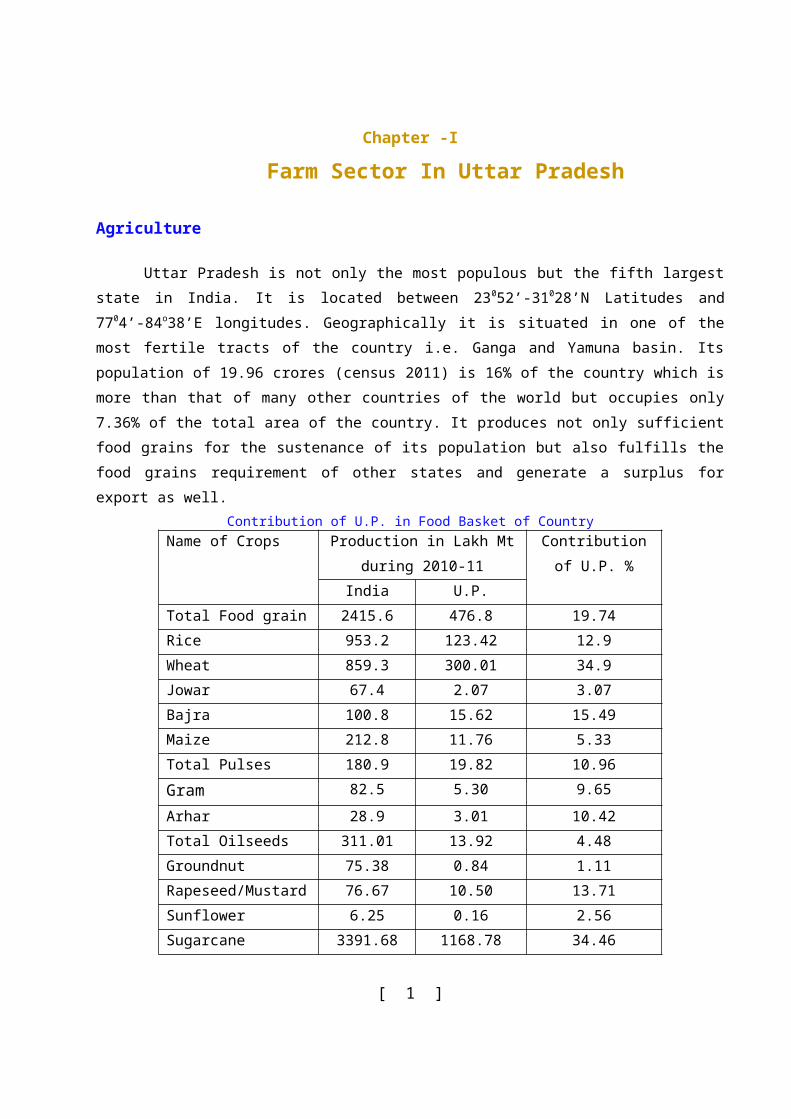
Uttar Pradesh is not only the most populous but the fifth largest state in India. It is located between 23052’-31028’N Latitudes and 7704’-84o38’E longitudes. Geographically it is situated in one of the most fertile tracts of the country i.e. Ganga and Yamuna basin. Its population of 19.96 crores (census 2011) is 16% of the country which is more than that of many other countries of the world but occupies only 7.36% of the total area of the country. It produces not only sufficient food grains for the sustenance of its population but also fulfills the food grains requirement of other states and generate a surplus for export as well.
Contribution of U.P. in Food Basket of Country Name of Crops Production in Lakh Mt during
2010-11Contribution of U.P.
%India U.P.
Total Food grain 2415.6 476.8 19.74Rice 953.2 123.42 12.9Wheat 859.3 300.01 34.9Jowar 67.4 2.07 3.07Bajra 100.8 15.62 15.49Maize 212.8 11.76 5.33Total Pulses 180.9 19.82 10.96Gram 82.5 5.30 9.65
Arhar 28.9 3.01 10.42Total Oilseeds 311.01 13.92 4.48Groundnut 75.38 0.84 1.11Rapeseed/Mustard 76.67 10.50 13.71Sunflower 6.25 0.16 2.56Sugarcane 3391.68 1168.78 34.46
Agro-climatic Zones
2. In order to drive maximum benefit from the available resource and prevailing growing conditions, an agro-climatic orientation is necessary in land use planning. Such an approach provides the desirable frame work of sustainable use of land, water and vegetation. Planning Commission of India has identified 15 Resource Development Regions in the country, 14 in the Main land and remaining 1 in the Islands of Bay of Bengal and the Arabian Sea. The goal was to organize Agricultural Planning Systems for 15 Agro climatic regions so identified and to develop policies for further Agricultural Development on Regional
[ 1 ]
basis. The country was divided into 126 agro-climatic zones. Later on 3 more zones for Andaman and Nicobar Island and 2 zones for Pondicherry was delineated.
3. The concept of zoning was mainly based on ecological land classification recognizing various components like soils, climate, topography, vegetation and crops etc. as major influencing factors. The zones were selected as contiguous areas within the State boundary and to the possible extent zones have homogenous physical characteristics such as Topography, Rainfall, Soils, Cropping pattern and Irrigation availability. Uttar Pradesh, on the basis on rainfall, terrain and soils has been divided into 9 agro-climatic zones.
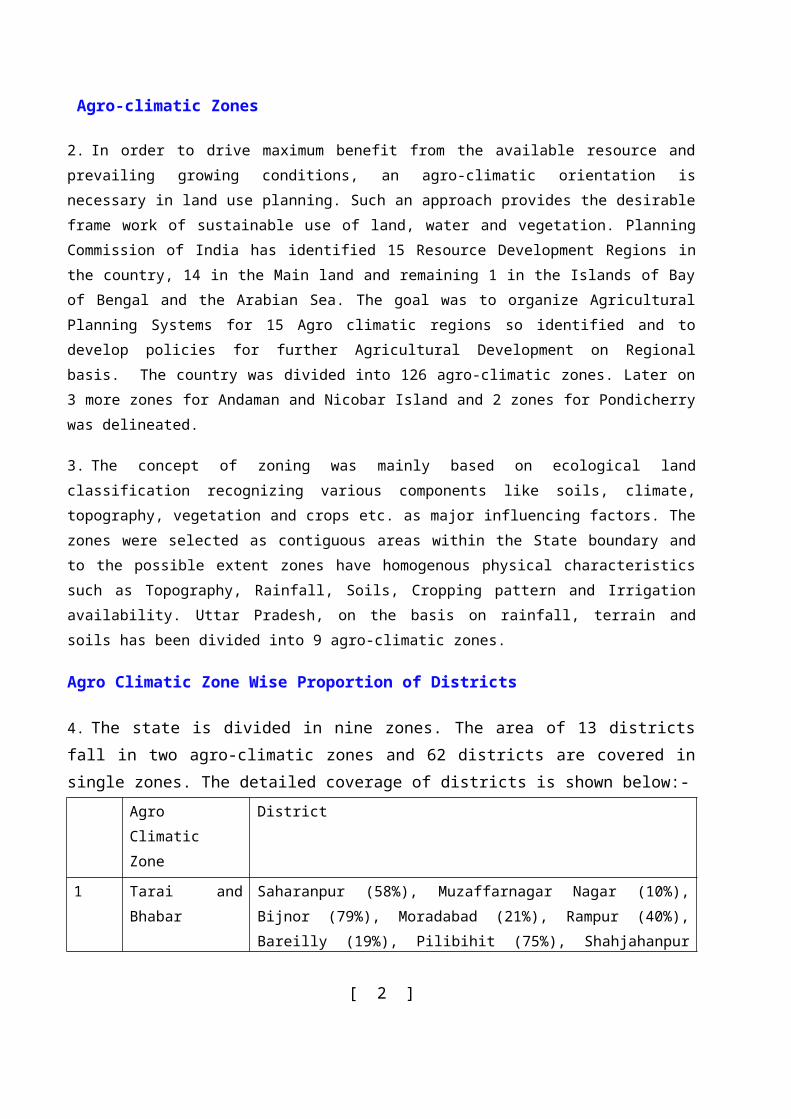
Agro Climatic Zone Wise Proportion of Districts
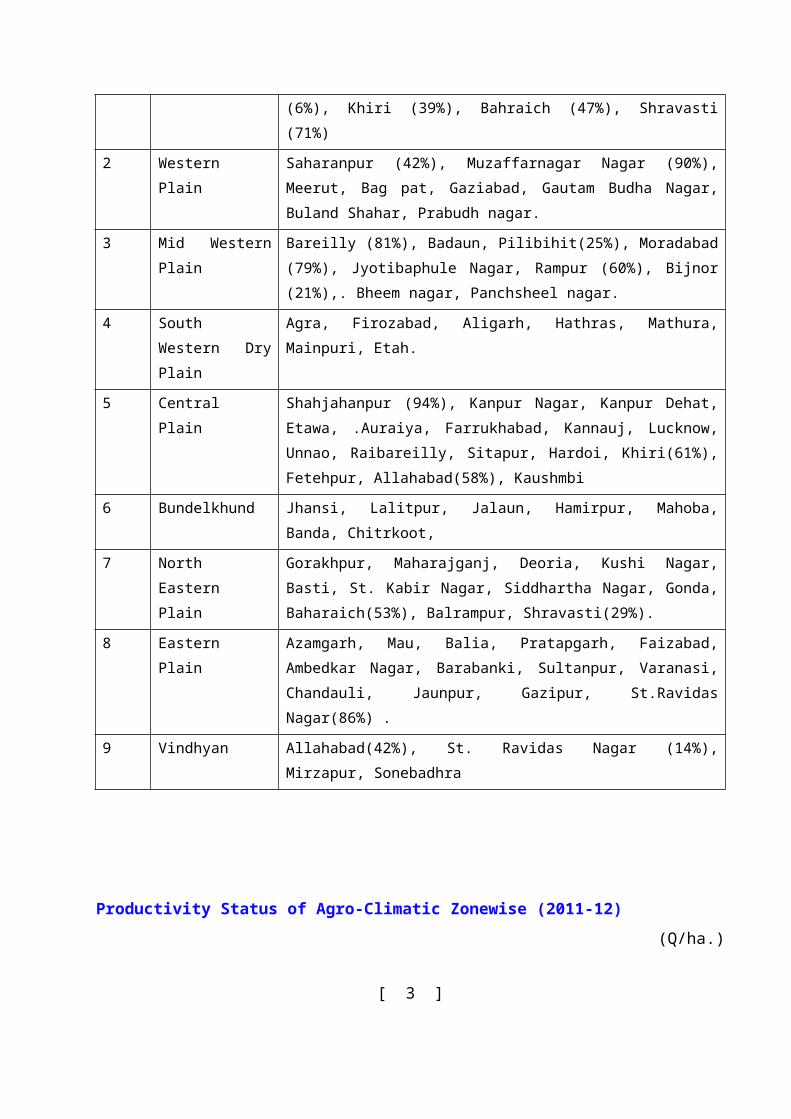
4. The state is divided in nine zones. The area of 13 districts fall in two agro-climatic zones and 62 districts are covered in single zones. The detailed coverage of districts is shown below:-
Agro Climatic Zone
District
1 Tarai and Bhabar Saharanpur (58%), Muzaffarnagar Nagar (10%), Bijnor (79%), Moradabad (21%), Rampur (40%), Bareilly (19%), Pilibihit (75%), Shahjahanpur (6%), Khiri (39%), Bahraich (47%), Shravasti (71%)
2 Western Plain Saharanpur (42%), Muzaffarnagar Nagar (90%), Meerut, Bag pat, Gaziabad, Gautam Budha Nagar, Buland Shahar, Prabudh nagar.
3 Mid Western Plain Bareilly (81%), Badaun, Pilibihit(25%), Moradabad (79%), Jyotibaphule Nagar, Rampur (60%), Bijnor (21%),. Bheem nagar, Panchsheel nagar.
4 South Western Dry Plain
Agra, Firozabad, Aligarh, Hathras, Mathura, Mainpuri, Etah.
5 Central Plain Shahjahanpur (94%), Kanpur Nagar, Kanpur Dehat, Etawa, .Auraiya, Farrukhabad, Kannauj, Lucknow, Unnao, Raibareilly, Sitapur, Hardoi, Khiri(61%), Fetehpur, Allahabad(58%), Kaushmbi
6 Bundelkhund Jhansi, Lalitpur, Jalaun, Hamirpur, Mahoba, Banda, Chitrkoot,
7 North Eastern Plain
Gorakhpur, Maharajganj, Deoria, Kushi Nagar, Basti, St. Kabir Nagar, Siddhartha Nagar, Gonda, Baharaich(53%), Balrampur, Shravasti(29%).
8 Eastern Plain Azamgarh, Mau, Balia, Pratapgarh, Faizabad, Ambedkar Nagar, Barabanki, Sultanpur, Varanasi, Chandauli, Jaunpur, Gazipur, St.Ravidas Nagar(86%) .
9 Vindhyan Allahabad(42%), St. Ravidas Nagar (14%), Mirzapur, Sonebadhra
[ 2 ]
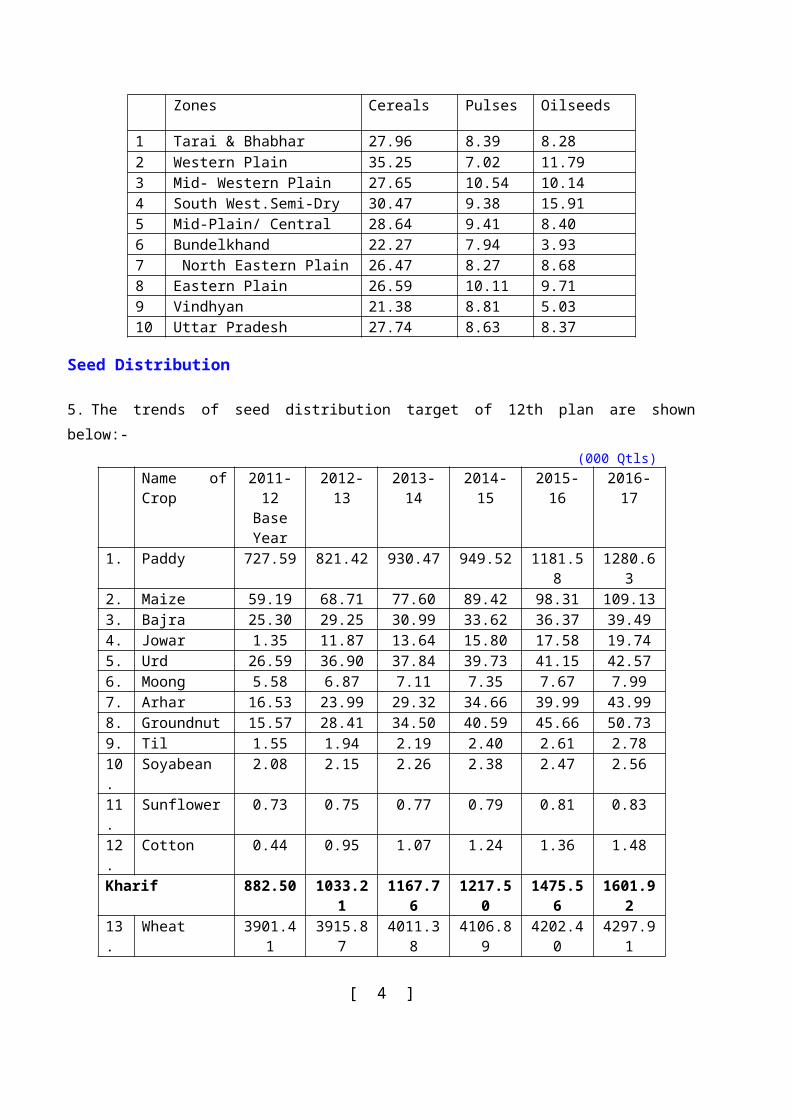
Productivity Status of Agro-Climatic Zonewise (2011-12)
(Q/ha.)Zones Cereals Pulses Oilseeds
1 Tarai & Bhabhar 27.96 8.39 8.282 Western Plain 35.25 7.02 11.793 Mid- Western Plain 27.65 10.54 10.144 South West.Semi-Dry 30.47 9.38 15.915 Mid-Plain/ Central 28.64 9.41 8.406 Bundelkhand 22.27 7.94 3.937 North Eastern Plain 26.47 8.27 8.688 Eastern Plain 26.59 10.11 9.719 Vindhyan 21.38 8.81 5.0310 Uttar Pradesh 27.74 8.63 8.37
Seed Distribution
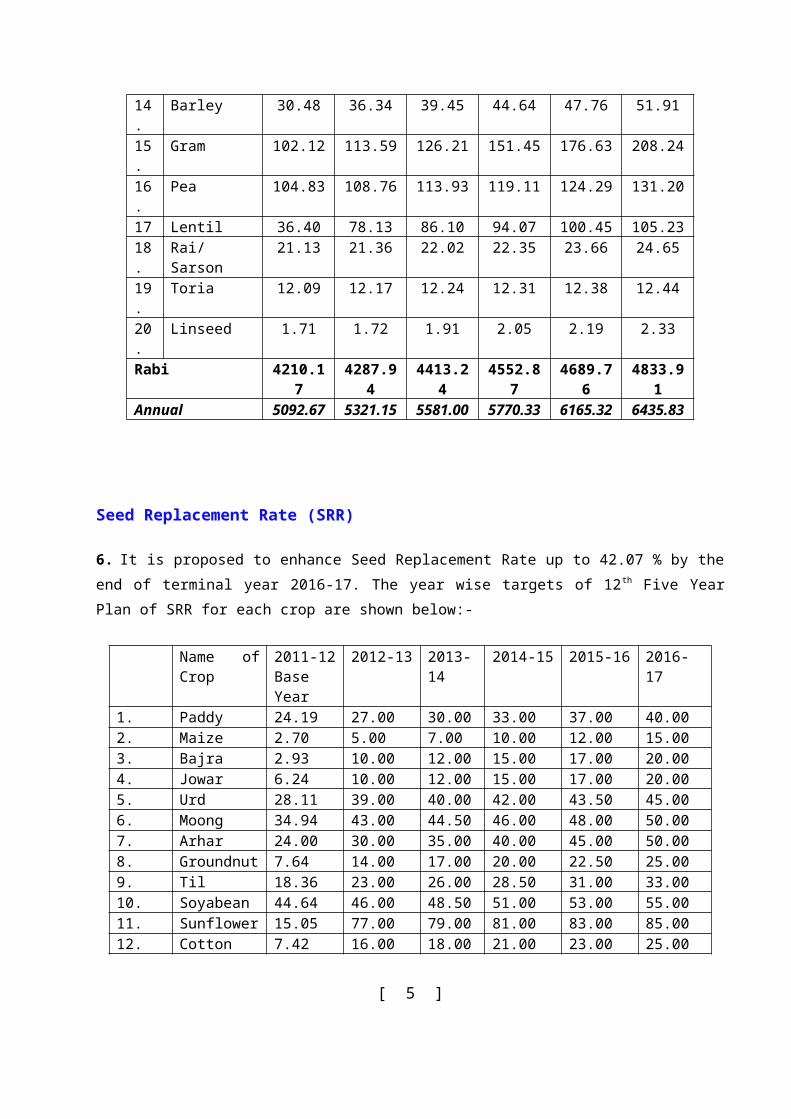
5. The trends of seed distribution target of 12th plan are shown below:- (000 Qtls)
Name of Crop 2011-12Base Year
2012-13 2013-14 2014-15 2015-16 2016-17
1. Paddy 727.59 821.42 930.47 949.52 1181.58 1280.632. Maize 59.19 68.71 77.60 89.42 98.31 109.133. Bajra 25.30 29.25 30.99 33.62 36.37 39.494. Jowar 1.35 11.87 13.64 15.80 17.58 19.745. Urd 26.59 36.90 37.84 39.73 41.15 42.576. Moong 5.58 6.87 7.11 7.35 7.67 7.997. Arhar 16.53 23.99 29.32 34.66 39.99 43.998. Groundnut 15.57 28.41 34.50 40.59 45.66 50.739. Til 1.55 1.94 2.19 2.40 2.61 2.7810. Soyabean 2.08 2.15 2.26 2.38 2.47 2.5611. Sunflower 0.73 0.75 0.77 0.79 0.81 0.8312. Cotton 0.44 0.95 1.07 1.24 1.36 1.48Kharif 882.50 1033.21 1167.76 1217.50 1475.56 1601.9213. Wheat 3901.41 3915.87 4011.38 4106.89 4202.40 4297.9114. Barley 30.48 36.34 39.45 44.64 47.76 51.9115. Gram 102.12 113.59 126.21 151.45 176.63 208.2416. Pea 104.83 108.76 113.93 119.11 124.29 131.2017 Lentil 36.40 78.13 86.10 94.07 100.45 105.2318. Rai/Sarson 21.13 21.36 22.02 22.35 23.66 24.6519. Toria 12.09 12.17 12.24 12.31 12.38 12.4420. Linseed 1.71 1.72 1.91 2.05 2.19 2.33Rabi 4210.17 4287.94 4413.24 4552.87 4689.76 4833.91Annual 5092.67 5321.15 5581.00 5770.33 6165.32 6435.83
[ 3 ]
Seed Replacement Rate (SRR)
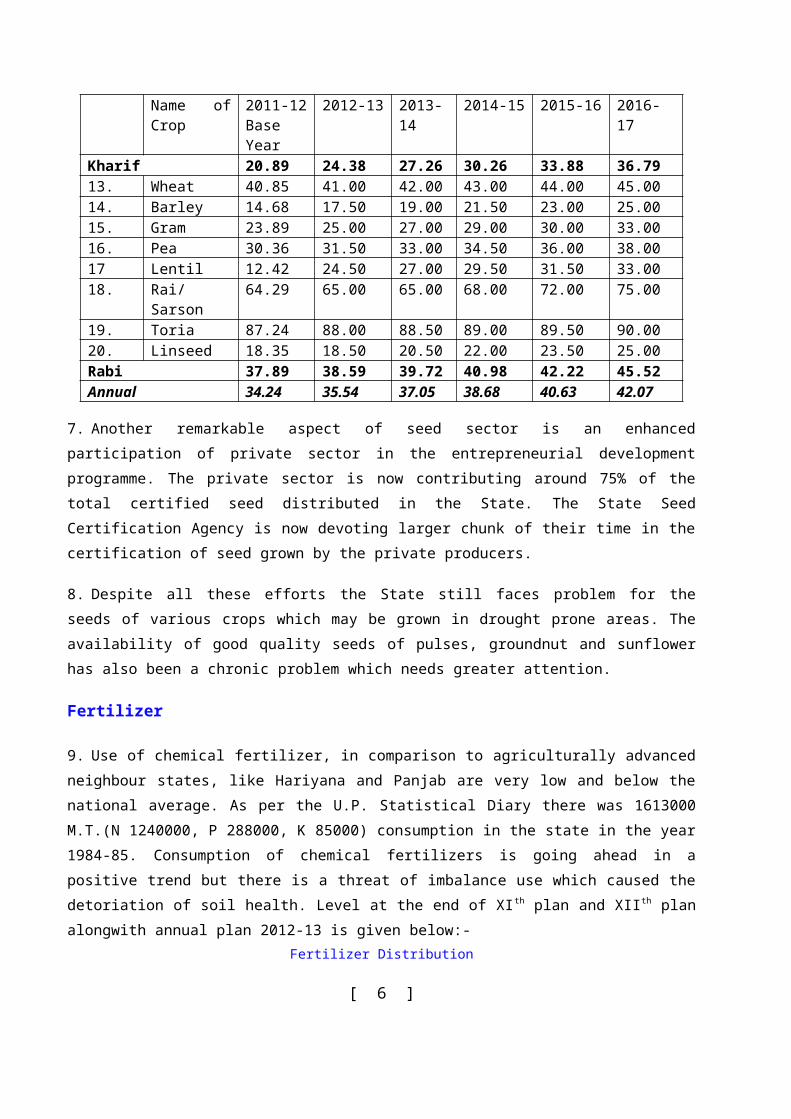
6. It is proposed to enhance Seed Replacement Rate up to 42.07 % by the end of terminal year 2016-17. The year wise targets of 12th Five Year Plan of SRR for each crop are shown below:-
Name of Crop
2011-12Base Year
2012-13 2013-14 2014-15 2015-16 2016-17
1. Paddy 24.19 27.00 30.00 33.00 37.00 40.002. Maize 2.70 5.00 7.00 10.00 12.00 15.003. Bajra 2.93 10.00 12.00 15.00 17.00 20.004. Jowar 6.24 10.00 12.00 15.00 17.00 20.005. Urd 28.11 39.00 40.00 42.00 43.50 45.006. Moong 34.94 43.00 44.50 46.00 48.00 50.007. Arhar 24.00 30.00 35.00 40.00 45.00 50.008. Groundnut 7.64 14.00 17.00 20.00 22.50 25.009. Til 18.36 23.00 26.00 28.50 31.00 33.0010. Soyabean 44.64 46.00 48.50 51.00 53.00 55.0011. Sunflower 15.05 77.00 79.00 81.00 83.00 85.0012. Cotton 7.42 16.00 18.00 21.00 23.00 25.00Kharif 20.89 24.38 27.26 30.26 33.88 36.7913. Wheat 40.85 41.00 42.00 43.00 44.00 45.0014. Barley 14.68 17.50 19.00 21.50 23.00 25.0015. Gram 23.89 25.00 27.00 29.00 30.00 33.0016. Pea 30.36 31.50 33.00 34.50 36.00 38.0017 Lentil 12.42 24.50 27.00 29.50 31.50 33.0018. Rai/Sarson 64.29 65.00 65.00 68.00 72.00 75.0019. Toria 87.24 88.00 88.50 89.00 89.50 90.0020. Linseed 18.35 18.50 20.50 22.00 23.50 25.00Rabi 37.89 38.59 39.72 40.98 42.22 45.52Annual 34.24 35.54 37.05 38.68 40.63 42.07
7. Another remarkable aspect of seed sector is an enhanced participation of private sector in the entrepreneurial development programme. The private sector is now contributing around 75% of the total certified seed distributed in the State. The State Seed Certification Agency is now devoting larger chunk of their time in the certification of seed grown by the private producers.
8. Despite all these efforts the State still faces problem for the seeds of various crops which may be grown in drought prone areas. The availability of good quality seeds of pulses, groundnut and sunflower has also been a chronic problem which needs greater attention.
Fertilizer
9. Use of chemical fertilizer, in comparison to agriculturally advanced neighbour states, like Hariyana and Panjab are very low and below the national average. As per the U.P. Statistical Diary there was 1613000 M.T.(N 1240000, P 288000, K 85000) consumption in the state in the year 1984-85. Consumption of chemical fertilizers is going ahead in a positive trend but there is a threat of imbalance use
[ 4 ]
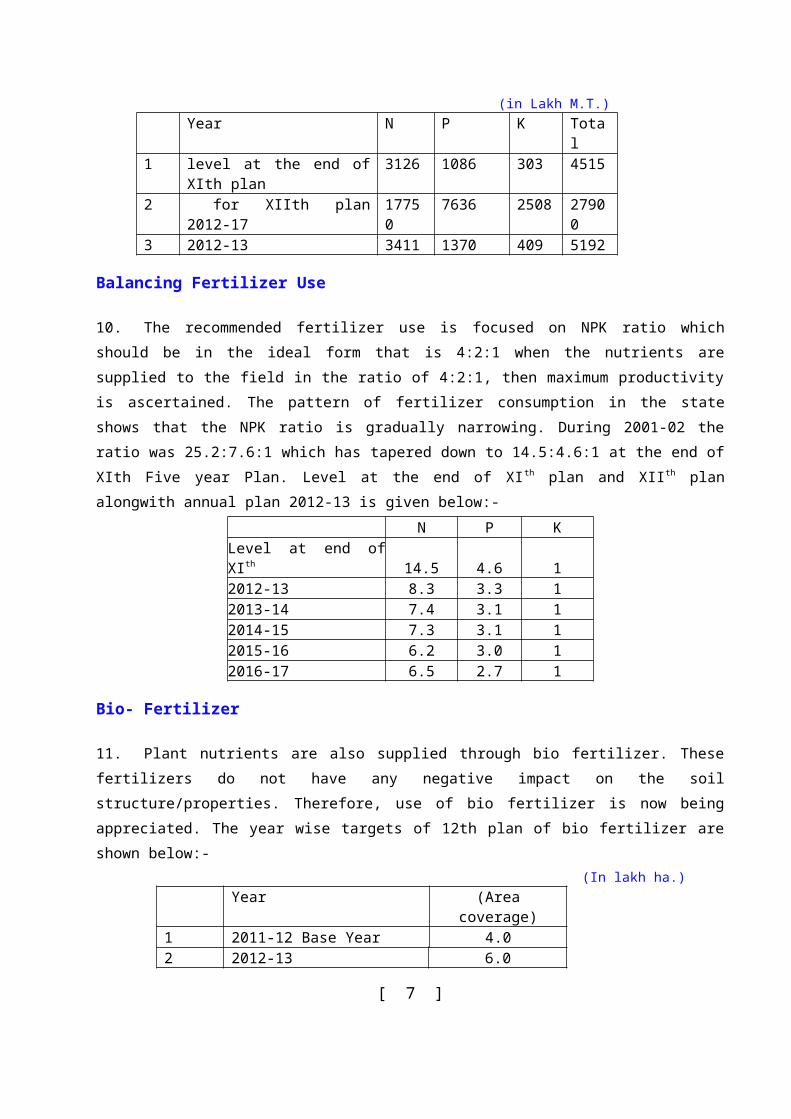
which caused the detoriation of soil health. Level at the end of XI th plan and XIIth plan alongwith annual plan 2012-13 is given below:-
Fertilizer Distribution (in Lakh M.T.)
Year N P K Total1 level at the end of XIth plan 3126 1086 303 45152 for XIIth plan 2012-17 17750 7636 2508 279003 2012-13 3411 1370 409 5192
Balancing Fertilizer Use
10. The recommended fertilizer use is focused on NPK ratio which should be in the ideal form that is 4:2:1 when the nutrients are supplied to the field in the ratio of 4:2:1, then maximum productivity is ascertained. The pattern of fertilizer consumption in the state shows that the NPK ratio is gradually narrowing. During 2001-02 the ratio was 25.2:7.6:1 which has tapered down to 14.5:4.6:1 at the end of XIth Five year Plan. Level at the end of XIth plan and XIIth plan alongwith annual plan 2012-13 is given below:-
N P KLevel at end of XIth 14.5 4.6 12012-13 8.3 3.3 12013-14 7.4 3.1 12014-15 7.3 3.1 12015-16 6.2 3.0 12016-17 6.5 2.7 1
Bio- Fertilizer
11. Plant nutrients are also supplied through bio fertilizer. These fertilizers do not have any negative impact on the soil structure/properties. Therefore, use of bio fertilizer is now being appreciated. The year wise targets of 12th plan of bio fertilizer are shown below:-
(In lakh ha.)Year (Area coverage)
1 2011-12 Base Year 4.02 2012-13 6.03 2013-14 6.04 2014-15 6.05 2015-16 6.06 2016-17 6.0
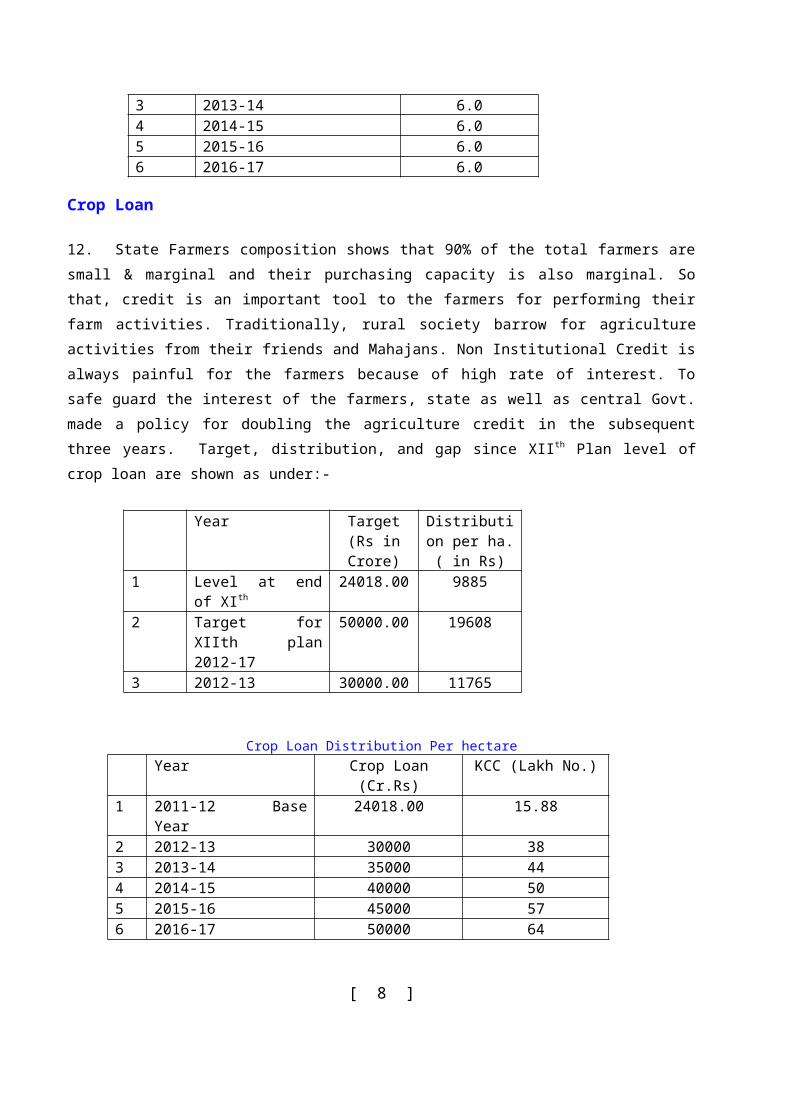
Crop Loan
12. State Farmers composition shows that 90% of the total farmers are small & marginal and their purchasing capacity is also marginal. So that, credit is an important tool to the farmers for performing their farm activities. Traditionally, rural society barrow for agriculture activities from their friends and Mahajans. Non Institutional Credit is always painful for the farmers because of high rate of interest. To safe guard the interest of the farmers, state as well as central Govt. made a policy for doubling the
[ 5 ]
agriculture credit in the subsequent three years. Target, distribution, and gap since XIIth Plan level of crop loan are shown as under:-
Year Target(Rs in Crore)
Distribution per ha.( in Rs)
1 Level at end of XIth 24018.00 98852 Target for XIIth plan
2012-1750000.00 19608
3 2012-13 30000.00 11765
Crop Loan Distribution Per hectareYear Crop Loan (Cr.Rs) KCC (Lakh No.)
1 2011-12 Base Year 24018.00 15.882 2012-13 30000 383 2013-14 35000 444 2014-15 40000 505 2015-16 45000 576 2016-17 50000 64
Micro Irrigation System
13. Keeping in mind the importance of water and its judicious use, a very effective scheme has been launched through out the state. Efficient and economic use of surface and sub surface water by demonstration of various method of irrigation system is being made possible through “Kushal Jal Prabandhan Yojna”. Dripped and sprinkler irrigation system are being made popular through out the state by this scheme.
Rain Water Harvesting
14. U.P. has diverse agro climatic zones which almost different from another. For example eastern plain is being presumed as water logged area whereas Bundelkhand is well known for their drought prone climatic property. A concept of rain water harvesting is to conserve and collect the rain water of rainy season in a water body for their multipurpose use i.e. for live stock, human needs and farm sector. A scheme has been launched for Bundelkhand region to minimize the adversity of drought in this region. Through this scheme dripped and sprinkler irrigation system also provided to the farmers at this subsidized rate. Judicious use of rain water demonstration is being made as a component of this scheme for the purpose of its popularization amongst the farming community.
Net Irrigated Area versus Net Area Sown
15. The total irrigated area of state is 130.85 Lakh Hectares during the year 2010-11. The source wise Irrigation status, as indicated in the table below, shows that canal irrigation is 18.02%, State Tube well irrigation is 3.01% and Private tube wells have maximum share of irrigation that is 70.17%.
[ 6 ]
(in, Lakh ha.) Irrigation Source Area Percentage
(NAS)Percentage(Irrigated)
Net Area Sown 164.171 Canal 14.36 18.022 State Tube-wells 2.40 3.013 Private Tube-wells 55.93 70.174 Other Sources 7.01 8.80
Net Irrigated Area 130.85
Source-wise Irrigation Status
16. Agro-climatic Zone-wise and source-wise irrigation status of the year 2009-10 is as under:- . Particulars Tarai WP MWP SWS
DPMP BUND NEP EP VIN U.P.
1 Canal 1.02 1.89 0.51 2.74 6.62 1.78 1.66 5.94 1.47 23.52Tube-wells Govt. 0.13 0.17 0.10 0.28 0.80 0.50 0.68 1.04 0.22 3.94Private 7.46 9.90 7.68 11.86 24.32 3.10 12.19 15.24 0.58 91.82Total 7.59 9.57 7.78 12.40 25.12 3.60 12.07 16.28 0.80 95.76
2 Other wells 1.68 0.20 2.73 1.18 0.17 2.57 0.888 0.03 0.18 10.043 Tank etc 0.04 @ 0.01 0.01 0.07 0.43 0.37 0.01 0.11 1.054 Other Means 0.0 0.002 0.14 0.07 0.01 0.08 0.0 0.01 0.0 0.415 Net Irrigated
Area10.34 11.62 11.62 16.14 31.99 8.45 15.82 22.28 5.59 130.85
6 Area irrigated More Than once
5.53 7.58 7.60 6.51 14.23 0.38 3.43 14.24 1.07 60.58
7 Kharif 8.50 11.04 8.02 5.63 17.57 0.71 5.22 16.03 1.62 74.418 Rabi 6.57 7.12 9.65 15.98 26.85 7.97 13.87 19.28 1.99 109.299 Zaid 0.79 1.03 1.55 1.04 1.80 0.14 0.17 1.15 0.04 7.7210 Total 15.86 19.20 19.22 22.65 46.22 8.83 19.25 36.52 3.66 191.42
Gross Irri. Area 15.86 19.20 19.22 22.65 46.22 8.83 19.25 36.52 3.66 191.421 Canal 1.32 2.69 0.86 4.38 10.51 1.91 1.82 10.20 2.13 36.40
Tube-wells Govt. 0.16 0.28 0.13 0.47 1.04 0.51 0.93 1.46 0.26 5.19Private 11.55 15.96 12.78 16.09 34.35 3.21 14.80 24.79 0.86 134.39Total 11.71 16.24 12.91 16.56 35.39 2.72 15.66 26.26 1.12 139.57
2 Other wells 2.55 0.25 5.27 1.63 0.22 2.69 1.00 0.04 0.23 13.903 Tank etc 0.04 @ 0.02 @ 0.09 0.43 0.37 0.01 0.13 1.104 Other Means 0.03 @ 0.15 0.08 0.01 0.08 0.04 0.01 0.04 0.44
*(WP=Western Plain, MWP= Mid Western Plain, SWSDP= South Western Semi Dry Plain, MP= Mid Plain, BUND= Bundelkhand, NEP= North-Eastern Plain, EP= Eastern Plain, VIN= Vindhyan, @=figures are below 500)
Cropping Pattern/Coverage
17. Paddy and Wheat are the most important crops of the State. Maximum area is being used for cultivation of food grains of which only 13.8% is covered under pulses. Approximately 79.8% of the gross cropped area is devoted for the production of food grains. Other important crops grown in the State are sugarcane, potato, mustard, groundnut, gram, pea and lentil. The sunflower and soybeans have also been introduced successfully in the State during past. The cropping pattern in various agro-climatic zones and
[ 7 ]
agro-economic regions in the State however differ significantly in terms of commodities and seasonal crops.
Strategy forAnnual Plan 2012-13
Formulation of new Agriculture Policy and implementation of scheme's accordingly
18. Uttar Pradesh has approved a new Agriculture Policy for the state, envisaging 4% agriculture growth rate. To achieve this, Agriculture Policy revolves around implementation of activities based on seven thrust areas, called SAPTA KRANTI, viz. extension, irrigation and water management, soil health and fertility, seed management, agriculture marketing, mechanization, agriculture research and diversification. In 12th five year plan, implementation of a new Agriculture Policy is under consideration for achieving 5 percent agriculture growth rate.
Converting small and marginal farmers in profit making units
Organizing small and marginal farmers in productive and profit making groups offers a practical solution to the problem of fragmentation of holdings. Smaller farming units can turn into economical units if they are brought together as a group.
Implementation of all the programmes of agriculture and rural development will have to be undertaken through farmer and women Self Help Groups (SHGs). Execution of schemes through these groups will certainly help in improving their skill, and at the same time provide them an alternate source of earning. Marketing of agriculture produce can also be taken up through these groups.
Inculcating a change and prioritizing the Research strategy of concerned institutions for developing area based appropriate technology, agriculture implements etc for small and marginal farmers.
Improving Soil Health:
19. Improving soil health will be the highest concern. Following activities are proposed in this direction:
In order to improve balanced use of fertilizers, based on soil testing, strengthening of soil testing laboratories will be essential. In addition to the existing 48 Soil Testing Laboratories, additional 22 have been sanctioned in 2006-07 with an aim of raising existing soil testing capacity from 15 lacs to 22 lacs. At present, only 12 Labs are equipped to handle analysis of soil samples for micronutrients. It is proposed to develop facility of micronutrient testing in all the Soil Testing Labs of the state.
Providing congenial atmosphere to fertilizer companies /suppliers, input providers and other agencies involved in marketing of agriculture produce to further enlarge their existing soil testing activities, extensively. Provision of additional soil testing with the help of private sector will act as a booster dose towards improving soil health in a big way. It will also strengthen public Private Partnership (PPP) in the field of agriculture. Presently, these
[ 8 ]
agencies are engaged in testing, mainly Nitrogen Phosphorus and Potash. To give a thrust to soil testing for micro nutrients, these agencies can be permitted to send their soil sample to State Governments Labs on cost sharing basis.
Balanced use of fertilizers based on soil testing has to be given highest priority. Extensive use of micronutrients, mainly Zinc, Iron and Sulphur has to be encouraged. For this Crop and varietal demonstrations coupled with the principles of Integrated Plan Nutrient Management (IPMN) have to be, extensively, organized in each agro-climatic zone with finances from Macro-mode and ISOPOM. Present NPK ratio of 13:5:1 has to balance towards 4:2:1.
In addition to existing use of available farm yard manures and other traditional composts, large scale adoption of improved manuring technologies such as NADEP, Vermi-composting have to be ensured at village level. Financial assistance can be availed from Rural Development Department for the construction of NADEP and Vermi Pits in large numbers. This activity can be one of major activities of Gram Panchayat. It will not only help in restoring microbial population and improve soil health but will also provide an alternate source of income to educated rural youths at local level.
Inclusion of bio-fertilizers has to be increased substantially. At present state government owned labs and other Private agencies such as IFFCO, Kribhco, Chambal, NAFED and NFL etc. are engaged in production and distribution of bio-fertilizers such Rhizobium, PSB culture, Azetobacter etc. Last years almost 50 lac packets of above mentioned bio-fertilizers were distributed. It is, extremely, essential to encourage these private agencies to enhance the production and distribution of bio-fertilizers by several folds. Each farming family starts using bio-fertilizers in his or her field. Awareness campaigns have to be organized at village, Nyaya Panchayat and Block level. Regular availability of this important component in sufficient quantity has to be ensured. This will not only increase micro flora and fauna in the soil but will also ensure better utilization of chemical fertilizers, especially phosphatic. It will be a welcome a step towards reducing cost of cultivation, considerably.
Cultivation of Dhaincha, Sanai and Moong as green manure during Zaid must to be given very high priority. Green Manuring helps in improving soil health tremendously and also reduces cost of cultivation, substantially.
Accelerating Pace of Land Development Programmes:
20. As already reported that out of 120.44 lac hectares of problematic area, 84.40 lac hectare area has already been treated. Out of remaining 36.04 lac hectares untreated land. Programmes have been proposed for reclamation of degraded land. Keeping in mind, the working capacity of department of agriculture and U P Bhoomi Sudhar Nigam, following programmes are being proposed.
A new scheme Bhoomi Sena Yojna the most ambitious, multifaceted, employment generating scheme has been proposed in 12th Five Year Plan This scheme is being initiated to reclaim the degraded lands owned by small, marginal and land allottees. These land owners along with other landless farmers of the village are groomed and technically trained and given the responsibility for improving their own lands. Looking at the success of the programme and the
[ 9 ]
challenge of achieving target of 5.1 percent agriculture growth rate, it is essential to run the scheme with certain improvements.
Strengthen Technology Dissemination System:-
To achieve agriculture growth rate of 5.1 percent it is imperative to experiment and avail every single opportunity and all kinds of means to take -the new technology to the door steps of farmers. In this context, Public Private Partnership will, obviously, draw special attention. Right from use of information technology (IT) to farmer-led extension, it will be crucial to upgrade the skill and knowledge of farmers.
There is an urgent need to prepare a well thought comprehensive and Intensive Human Resource development calendar with the help of State Agriculture Universities (SAUs), training organization and research institutions and has to be sincerely, followed in 12th Five Year Plan.
It is proposed to establish "Common Service Centers under National Information Technology Policy". These centers are to be linked with SAUs and other extension agencies. In addition to above, establishment of centers like E-Choupal of ITC etc have to be encouraged to streamline marketing of agriculture produce along with IT based availability of new technology.
Priority has to be given to develop a network between SAUs. KVKs, KGKs, and other similar research agencies, farmers, Kisan Sahayak, and farmer's organization like Farmer's Field School so that new technology through "lab to land" programme reaches to the farmers at the earliest.
To intensity Public Private Partnership in the field of technology dissemination a favorable atmosphere has to be created so that extension activities being carried out by input provider companies such as IFFCO, Kribhco, IPL, NFL, Tata fertilizers, Khushhali, Haryali etc. are intensively enlarged and reaches to the far flung areas.
Uttar Pradesh has four Agriculture Universities, 30 Agriculture colleges which produce around 5200 agriculture graduates and 1400 post graduates each year. A sizable number of well trained energetic youths can be linked to Central Government sponsored Agri-clinic scheme. It will not only provide employment opportunities to rural youth but will also ensure dissemination of new knowledge and availability of quality inputs at village level from single window only.
Farmer School for strengthening farmer to farmer extension approach:
21. In order to strengthen farmer-led extension approach, department has decided to establish 820 farmer's field schools (FFS) consisting of best practicing farmers for the purpose of disseminating and sharing new knowledge with the fellow farmers of the block. The step would help in arranging quality inputs as well as ensure marketing of agri. produce at appropriate price apart from dissemination of new technology.
It is proposed to train unemployed agriculture graduate or post graduate at each Nyaya Panchayat level and engage them for dissemination of technology. This trained workforce can
[ 10 ]
be linked with SAUs/KVKs/ Research Institutions/Agri-clinics/ Farmer's Field Schools etc. for continuous Updation of knowledge. This step would provide and alternate source of income to the unemployed graduates.
There are more than one lac registered fertilizer, seed and pesticide dealers who are providing important inputs to the farmers on regular basis. If these dealers are trained, periodically in important technologies, the message will travel must faster to the farmers than by any other means. Therefore, it is proposed to convert these 1 lac traders from dealers to technical experts. This step may prove to be a milestone in the field of Agriculture Extension in the state.
Involving women farmers in the implementation of Agriculture schemes are very important. It is a well known fact that most of agriculture activities are performed by women farmers in the state. Therefore, more and more women have been encouraged to participate in Kisan Melas/Gosthis to be organized at Nyaya Panchayat, Block & District level. Development Departments have to involve SHGs already functional at village level. Some of the activities mentioned for this purpose are crop demonstration, IPM demonstration, Seed Processing
Seed Production
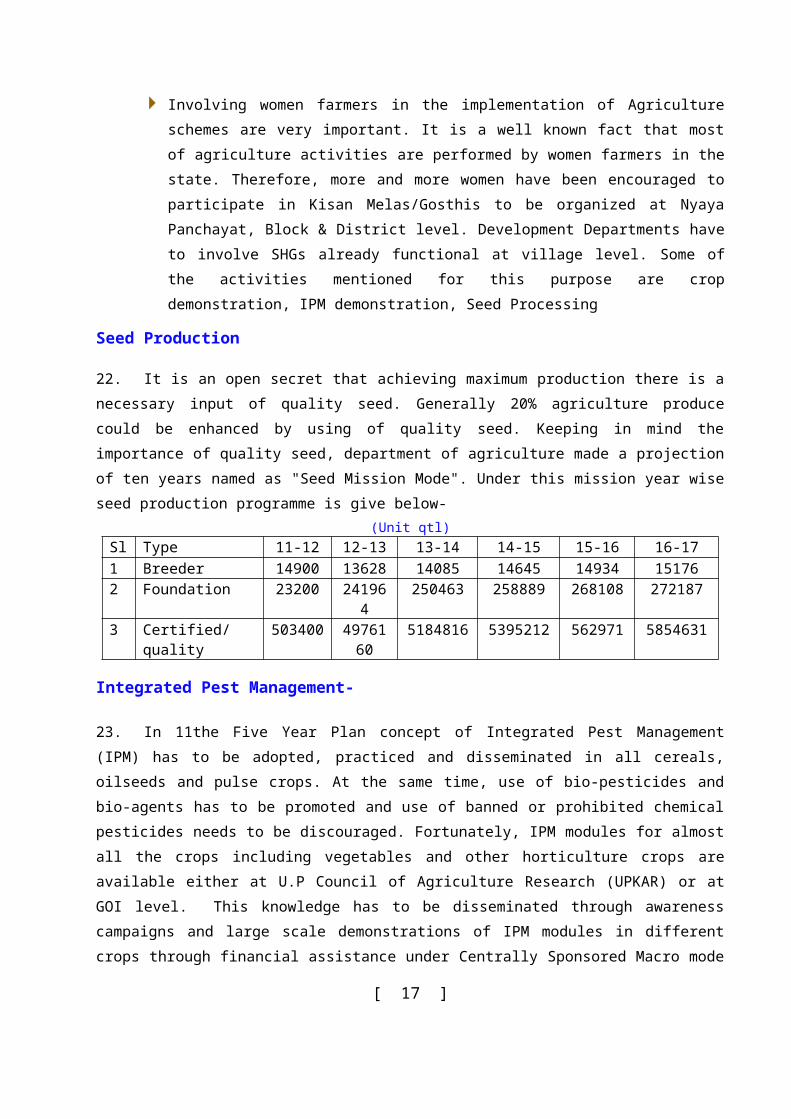
22. It is an open secret that achieving maximum production there is a necessary input of quality seed. Generally 20% agriculture produce could be enhanced by using of quality seed. Keeping in mind the importance of quality seed, department of agriculture made a projection of ten years named as "Seed Mission Mode". Under this mission year wise seed production programme is give below-
(Unit qtl)Sl Type 11-12 12-13 13-14 14-15 15-16 16-171 Breeder 14900 13628 14085 14645 14934 151762 Foundation 23200 241964 250463 258889 268108 2721873 Certified/ quality 503400 4976160 5184816 5395212 562971 5854631
Integrated Pest Management-
23. In 11the Five Year Plan concept of Integrated Pest Management (IPM) has to be adopted, practiced and disseminated in all cereals, oilseeds and pulse crops. At the same time, use of bio-pesticides and bio-agents has to be promoted and use of banned or prohibited chemical pesticides needs to be discouraged. Fortunately, IPM modules for almost all the crops including vegetables and other horticulture crops are available either at U.P Council of Agriculture Research (UPKAR) or at GOI level. This knowledge has to be disseminated through awareness campaigns and large scale demonstrations of IPM modules in different crops through financial assistance under Centrally Sponsored Macro mode and ISOPOM Schemes. Large scale demonstration is required in horticulture crops along with agriculture crops. Financial assistance can come from National Horticulture Mission.
Public Private Partnership in Agriculture-
[ 11 ]
24. Contribution of private agencies in agriculture has been increasing. Presently, inputs providing companies as well as those involved in marketing of agriculture produce are engaged in agriculture extension, soil testing and several other agriculture oriented activities according to their business requirement.
Research Initiatives-
25. Following priorities have to be given in the field of Research during the forthcoming Annual Plan.
Priority has to be given to the development of high yielding varieties which are
specifically suited to the Agro-Eco-Situation of the area.
Favorable atmosphere has to be created for the development of hybrids in the state.
Availability of parent-lines has to be ensured for the same.
Farming system modules with specific thrust on cropping system for Rainfed areas have to be developed.
Market oriented development of technology has to be encouraged. Looking at the
competitive international market, research works have to be reoriented towards production of qualitative agri-produce. For this organic farming modules need to be developed so that agriculture export could be given a boost.
Priority has to be given to reduction in post harvest losses.
Different Agriculture implements for different AES have to be developed.
Irrigation techniques have to be redesigned as per availability of water.
While selecting research issues or further investigation priority has to be given to
the researchable problems identified in the SREPs of each district.
To avoid duplication in research works and make available the entire information
regarding new technology at one place. U P Council of Agriculture Research (UPCAR) will document the research works being carried at different place/institution in the state and recommend lining agencies for further dissemination in the field.
National Food Security Mission
26. The National Development Council (NDC) in its 53rd meeting held on 29th May, 2007 adopted a resolution to launch a Food Security Mission comprising Rice, Wheat and Pulses to increase the production of rice by 10 million tons, wheat by 8 million tons and pulses by 2 million tons by the end of the Eleventh Plan (2011-12), Accordingly, A Centrally Sponsored Scheme, National Food Security Mission has been launched from 2007-08 to operationalize the above mentioned resolution. The National Food Security Mission will have three components;
(i) Rice component - 27 Districts
(ii) Wheat component - 38 Districts
[ 12 ]
(iii) Pulses component - 75 Districts
Rashtriya Krishi Vikas Yojna
Objectves:-
27. The main objectives of the scheme are as follows:-
To ensure that the local crops/priorities/needs are reflected in the Agricultural Plans.
To reduce the yield gaps in the important crops through focused interventions.
To maximize returns to the farmers in Agriculture and allied sectors.
To bring quantifiable changes in the production and productivity of various components of Agriculture and allied sectors.
To encourage public investment in Agriculture and allied sectors.
Annual Plan 2012-13
Seed Replacement Rate
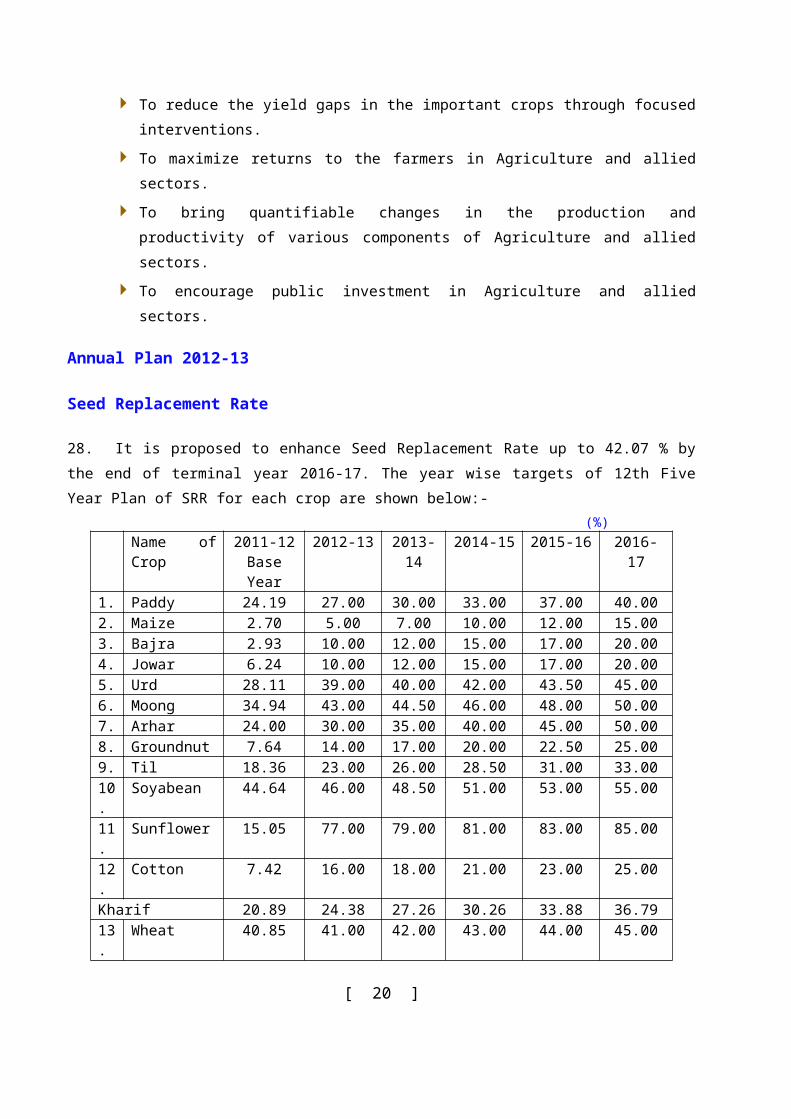
28. It is proposed to enhance Seed Replacement Rate up to 42.07 % by the end of terminal year 2016-17. The year wise targets of 12th Five Year Plan of SRR for each crop are shown below:-
(%)Name of Crop 2011-12
Base Year2012-13 2013-14 2014-15 2015-16 2016-17
1. Paddy 24.19 27.00 30.00 33.00 37.00 40.002. Maize 2.70 5.00 7.00 10.00 12.00 15.003. Bajra 2.93 10.00 12.00 15.00 17.00 20.004. Jowar 6.24 10.00 12.00 15.00 17.00 20.005. Urd 28.11 39.00 40.00 42.00 43.50 45.006. Moong 34.94 43.00 44.50 46.00 48.00 50.007. Arhar 24.00 30.00 35.00 40.00 45.00 50.008. Groundnut 7.64 14.00 17.00 20.00 22.50 25.009. Til 18.36 23.00 26.00 28.50 31.00 33.0010. Soyabean 44.64 46.00 48.50 51.00 53.00 55.0011. Sunflower 15.05 77.00 79.00 81.00 83.00 85.0012. Cotton 7.42 16.00 18.00 21.00 23.00 25.00Kharif 20.89 24.38 27.26 30.26 33.88 36.7913. Wheat 40.85 41.00 42.00 43.00 44.00 45.0014. Barley 14.68 17.50 19.00 21.50 23.00 25.0015. Gram 23.89 25.00 27.00 29.00 30.00 33.0016. Pea 30.36 31.50 33.00 34.50 36.00 38.0017 Lentil 12.42 24.50 27.00 29.50 31.50 33.0018. Rai/Sarson 64.29 65.00 65.00 68.00 72.00 75.0019. Toria 87.24 88.00 88.50 89.00 89.50 90.0020. Linseed 18.35 18.50 20.50 22.00 23.50 25.00Rabi 37.89 38.59 39.72 40.98 42.22 45.52
[ 13 ]
Name of Crop 2011-12Base Year
2012-13 2013-14 2014-15 2015-16 2016-17
Annual 34.24 35.54 37.05 38.68 40.63 42.07
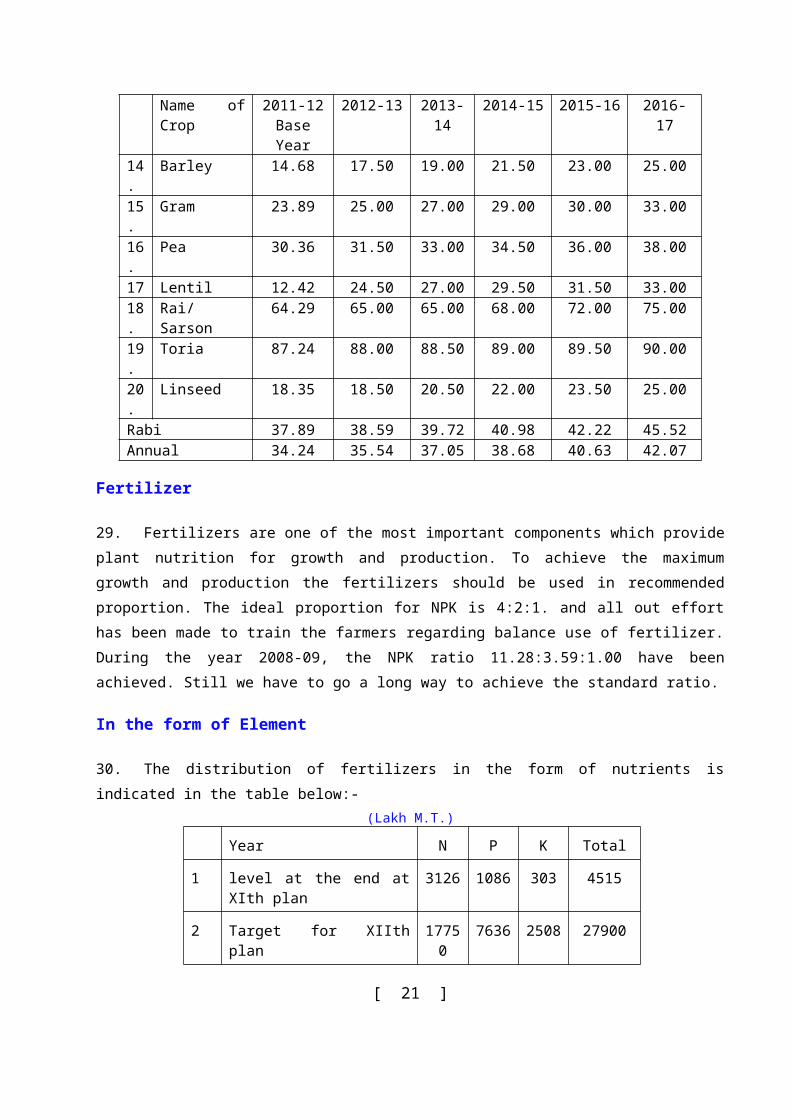
Fertilizer
29. Fertilizers are one of the most important components which provide plant nutrition for growth and production. To achieve the maximum growth and production the fertilizers should be used in recommended proportion. The ideal proportion for NPK is 4:2:1. and all out effort has been made to train the farmers regarding balance use of fertilizer. During the year 2008-09, the NPK ratio 11.28:3.59:1.00 have been achieved. Still we have to go a long way to achieve the standard ratio.
In the form of Element
30. The distribution of fertilizers in the form of nutrients is indicated in the table below:-(Lakh M.T.)
Year N P K Total
1 level at the end at XIth plan 3126 1086 303 4515
2 Target for XIIth plan 17750 7636 2508 27900
3 2012-13 3411 1370 409 5192
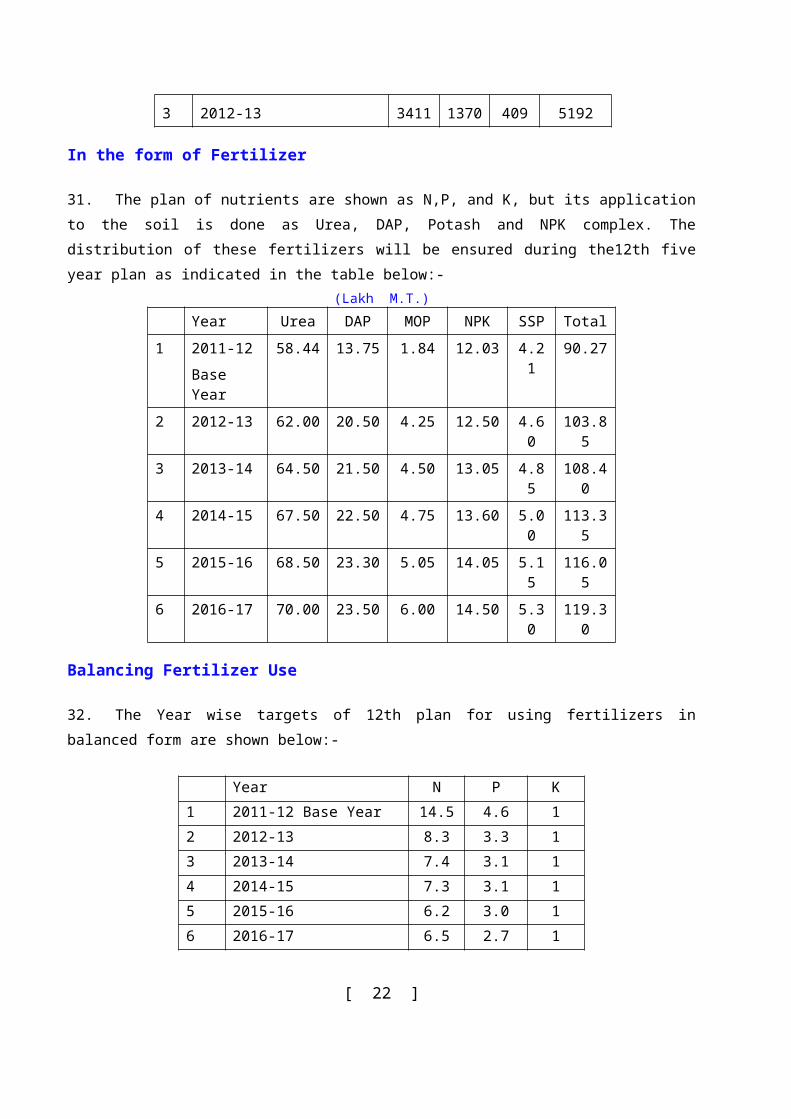
In the form of Fertilizer
31. The plan of nutrients are shown as N,P, and K, but its application to the soil is done as Urea, DAP, Potash and NPK complex. The distribution of these fertilizers will be ensured during the12th five year plan as indicated in the table below:-
(Lakh M.T.)Year Urea DAP MOP NPK SSP Total
1 2011-12 Base Year
58.44 13.75 1.84 12.03 4.21 90.27
2 2012-13 62.00 20.50 4.25 12.50 4.60 103.85
3 2013-14 64.50 21.50 4.50 13.05 4.85 108.40
4 2014-15 67.50 22.50 4.75 13.60 5.00 113.35
5 2015-16 68.50 23.30 5.05 14.05 5.15 116.05
6 2016-17 70.00 23.50 6.00 14.50 5.30 119.30
Balancing Fertilizer Use
32. The Year wise targets of 12th plan for using fertilizers in balanced form are shown below:-
Year N P K
[ 14 ]
1 2011-12 Base Year 14.5 4.6 12 2012-13 8.3 3.3 13 2013-14 7.4 3.1 14 2014-15 7.3 3.1 15 2015-16 6.2 3.0 16 2016-17 6.5 2.7 1
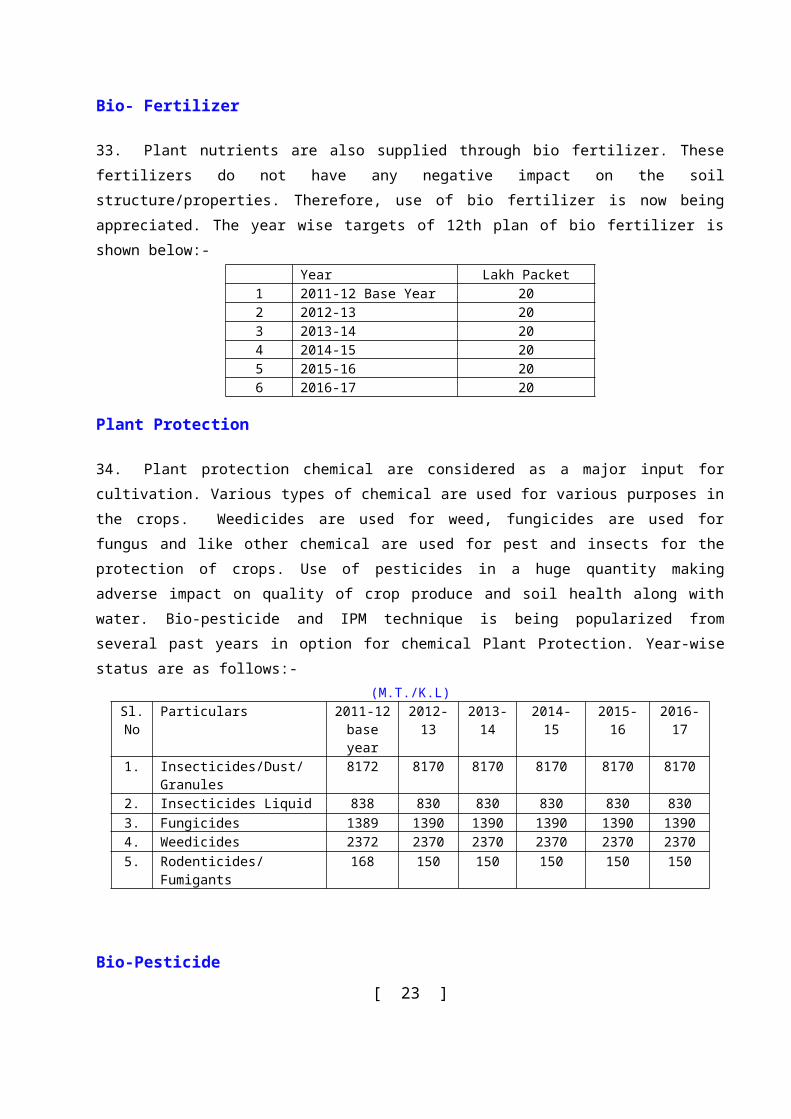
Bio- Fertilizer
33. Plant nutrients are also supplied through bio fertilizer. These fertilizers do not have any negative impact on the soil structure/properties. Therefore, use of bio fertilizer is now being appreciated. The year wise targets of 12th plan of bio fertilizer is shown below:-
Year Lakh Packet1 2011-12 Base Year 202 2012-13 203 2013-14 204 2014-15 205 2015-16 206 2016-17 20
Plant Protection
34. Plant protection chemical are considered as a major input for cultivation. Various types of chemical are used for various purposes in the crops. Weedicides are used for weed, fungicides are used for fungus and like other chemical are used for pest and insects for the protection of crops. Use of pesticides in a huge quantity making adverse impact on quality of crop produce and soil health along with water. Bio-pesticide and IPM technique is being popularized from several past years in option for chemical Plant Protection. Year-wise status are as follows:-
(M.T./K.L)Sl.No
Particulars 2011-12 base year
2012-13 2013-14 2014-15 2015-16 2016-17
1. Insecticides/Dust/Granules 8172 8170 8170 8170 8170 81702. Insecticides Liquid 838 830 830 830 830 8303. Fungicides 1389 1390 1390 1390 1390 13904. Weedicides 2372 2370 2370 2370 2370 23705. Rodenticides/ Fumigants 168 150 150 150 150 150
Bio-Pesticide
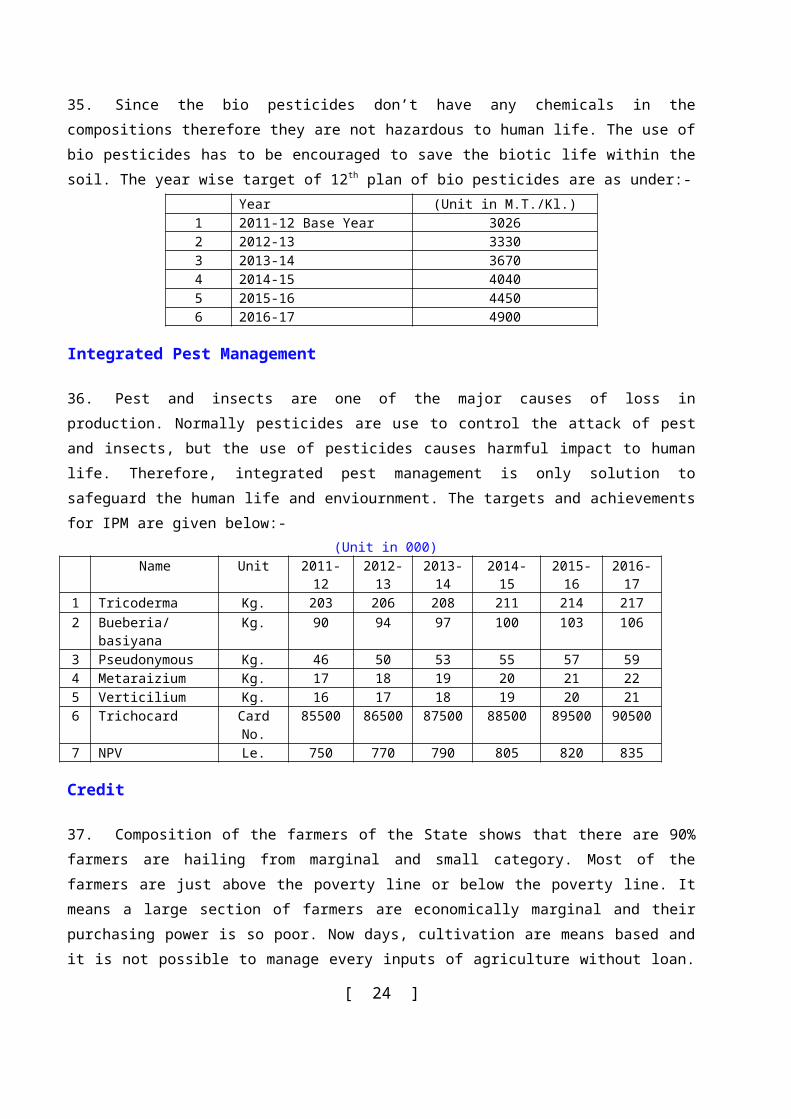
35. Since the bio pesticides don’t have any chemicals in the compositions therefore they are not hazardous to human life. The use of bio pesticides has to be encouraged to save the biotic life within the soil. The year wise target of 12th plan of bio pesticides are as under:-
[ 15 ]
Year (Unit in M.T./Kl.)1 2011-12 Base Year 30262 2012-13 33303 2013-14 36704 2014-15 40405 2015-16 44506 2016-17 4900
Integrated Pest Management
36. Pest and insects are one of the major causes of loss in production. Normally pesticides are use to control the attack of pest and insects, but the use of pesticides causes harmful impact to human life. Therefore, integrated pest management is only solution to safeguard the human life and enviournment. The targets and achievements for IPM are given below:-
(Unit in 000)Name Unit 2011-12 2012-13 2013-14 2014-15 2015-16 2016-17
1 Tricoderma Kg. 203 206 208 211 214 2172 Bueberia/ basiyana Kg. 90 94 97 100 103 1063 Pseudonymous Kg. 46 50 53 55 57 594 Metaraizium Kg. 17 18 19 20 21 225 Verticilium Kg. 16 17 18 19 20 216 Trichocard Card No. 85500 86500 87500 88500 89500 905007 NPV Le. 750 770 790 805 820 835
Credit
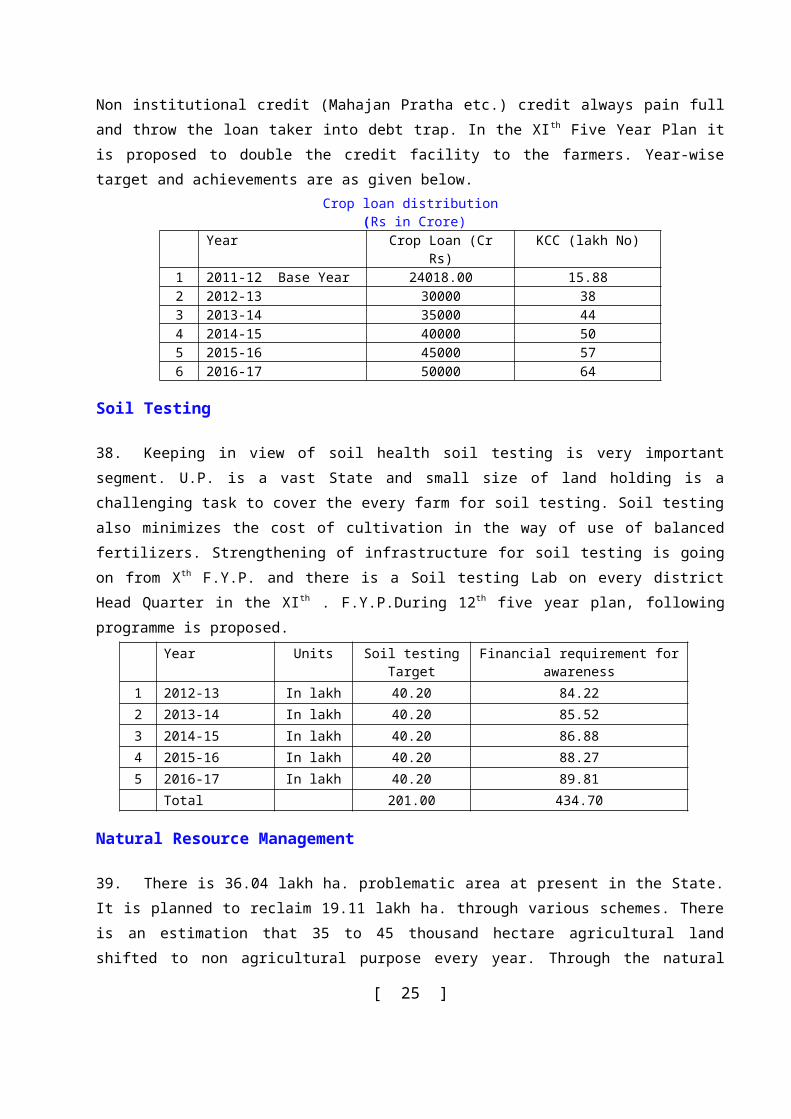
37. Composition of the farmers of the State shows that there are 90% farmers are hailing from marginal and small category. Most of the farmers are just above the poverty line or below the poverty line. It means a large section of farmers are economically marginal and their purchasing power is so poor. Now days, cultivation are means based and it is not possible to manage every inputs of agriculture without loan. Non institutional credit (Mahajan Pratha etc.) credit always pain full and throw the loan taker into debt trap. In the XIth Five Year Plan it is proposed to double the credit facility to the farmers. Year-wise target and achievements are as given below.
Crop loan distribution (Rs in Crore)
Year Crop Loan (Cr Rs) KCC (lakh No)1 2011-12 Base Year 24018.00 15.882 2012-13 30000 383 2013-14 35000 444 2014-15 40000 505 2015-16 45000 576 2016-17 50000 64
Soil Testing
38. Keeping in view of soil health soil testing is very important segment. U.P. is a vast State and small size of land holding is a challenging task to cover the every farm for soil testing. Soil testing also minimizes the
[ 16 ]
cost of cultivation in the way of use of balanced fertilizers. Strengthening of infrastructure for soil testing is going on from Xth F.Y.P. and there is a Soil testing Lab on every district Head Quarter in the XI th . F.Y.P.During 12th five year plan, following programme is proposed.
Year Units Soil testing Target Financial requirement for awareness1 2012-13 In lakh 40.20 84.222 2013-14 In lakh 40.20 85.523 2014-15 In lakh 40.20 86.884 2015-16 In lakh 40.20 88.275 2016-17 In lakh 40.20 89.81
Total 201.00 434.70
Natural Resource Management
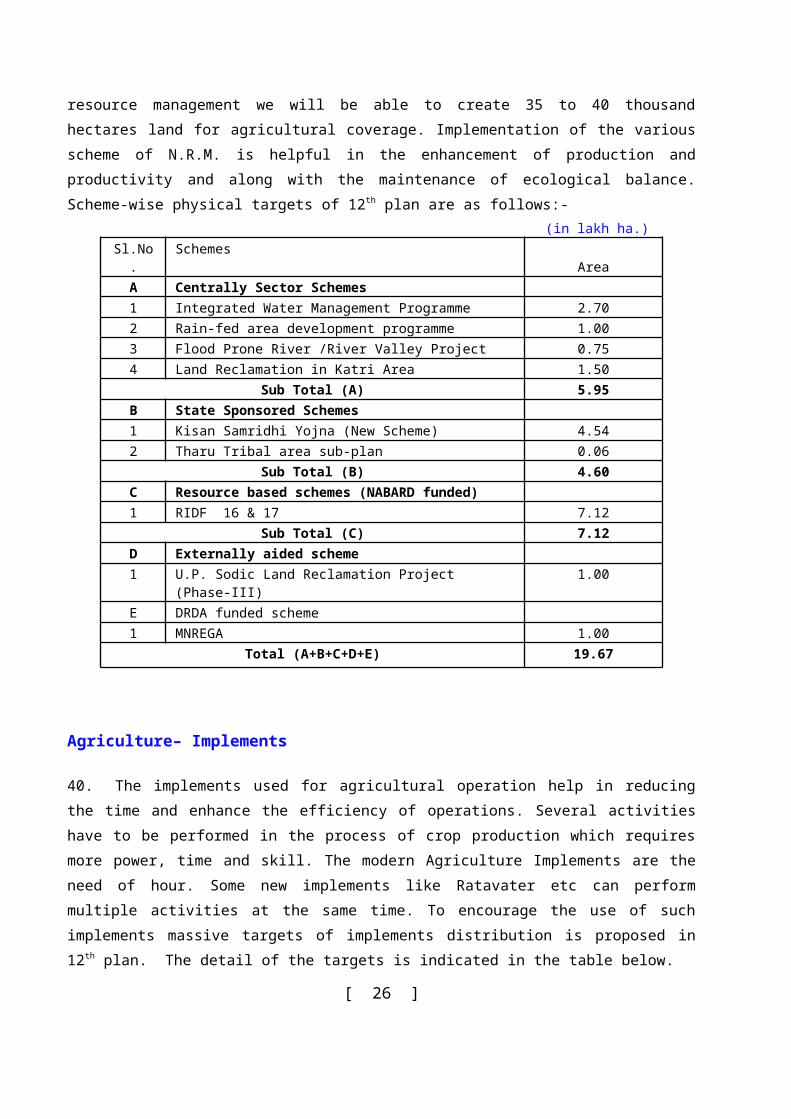
39. There is 36.04 lakh ha. problematic area at present in the State. It is planned to reclaim 19.11 lakh ha. through various schemes. There is an estimation that 35 to 45 thousand hectare agricultural land shifted to non agricultural purpose every year. Through the natural resource management we will be able to create 35 to 40 thousand hectares land for agricultural coverage. Implementation of the various scheme of N.R.M. is helpful in the enhancement of production and productivity and along with the maintenance of ecological balance. Scheme-wise physical targets of 12th plan are as follows:-
(in lakh ha.)Sl.No. Schemes Area
A Centrally Sector Schemes 1 Integrated Water Management Programme 2.70 2 Rain-fed area development programme 1.00 3 Flood Prone River /River Valley Project 0.75 4 Land Reclamation in Katri Area 1.50
Sub Total (A) 5.95 B State Sponsored Schemes 1 Kisan Samridhi Yojna (New Scheme) 4.54 2 Tharu Tribal area sub-plan 0.06
Sub Total (B) 4.60 C Resource based schemes (NABARD funded) 1 RIDF 16 & 17 7.12
Sub Total (C) 7.12 D Externally aided scheme 1 U.P. Sodic Land Reclamation Project (Phase-III) 1.00 E DRDA funded scheme 1 MNREGA 1.00
Total (A+B+C+D+E) 19.67
Agriculture– Implements
[ 17 ]
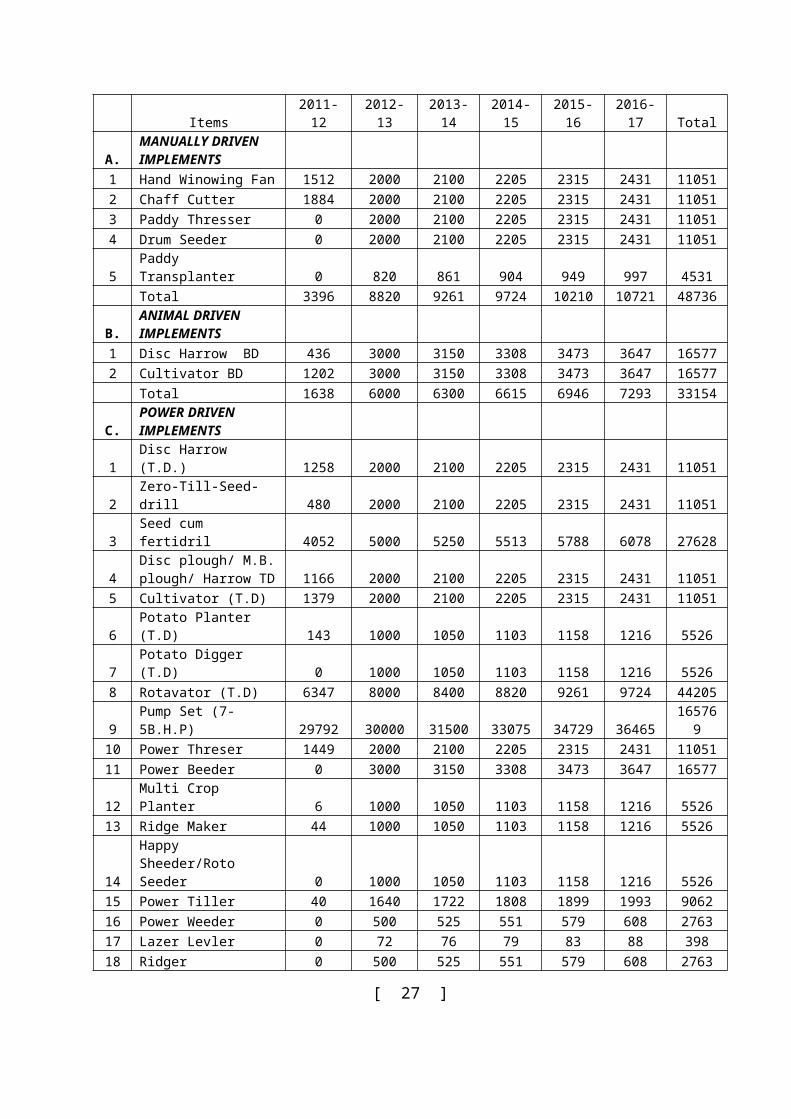
40. The implements used for agricultural operation help in reducing the time and enhance the efficiency of operations. Several activities have to be performed in the process of crop production which requires more power, time and skill. The modern Agriculture Implements are the need of hour. Some new implements like Ratavater etc can perform multiple activities at the same time. To encourage the use of such implements massive targets of implements distribution is proposed in 12 th plan. The detail of the targets is indicated in the table below.
Items 2011-12 2012-13 2013-14 2014-15 2015-16 2016-17 Total
A.MANUALLY DRIVEN IMPLEMENTS
1 Hand Winowing Fan 1512 2000 2100 2205 2315 2431 110512 Chaff Cutter 1884 2000 2100 2205 2315 2431 110513 Paddy Thresser 0 2000 2100 2205 2315 2431 110514 Drum Seeder 0 2000 2100 2205 2315 2431 110515 Paddy Transplanter 0 820 861 904 949 997 4531 Total 3396 8820 9261 9724 10210 10721 48736
B.ANIMAL DRIVEN IMPLEMENTS
1 Disc Harrow BD 436 3000 3150 3308 3473 3647 165772 Cultivator BD 1202 3000 3150 3308 3473 3647 16577 Total 1638 6000 6300 6615 6946 7293 33154
C.POWER DRIVEN IMPLEMENTS
1 Disc Harrow (T.D.) 1258 2000 2100 2205 2315 2431 110512 Zero-Till-Seed-drill 480 2000 2100 2205 2315 2431 110513 Seed cum fertidril 4052 5000 5250 5513 5788 6078 27628
4Disc plough/ M.B. plough/ Harrow TD 1166 2000 2100 2205 2315 2431 11051
5 Cultivator (T.D) 1379 2000 2100 2205 2315 2431 110516 Potato Planter (T.D) 143 1000 1050 1103 1158 1216 55267 Potato Digger (T.D) 0 1000 1050 1103 1158 1216 55268 Rotavator (T.D) 6347 8000 8400 8820 9261 9724 442059 Pump Set (7-5B.H.P) 29792 30000 31500 33075 34729 36465 16576910 Power Threser 1449 2000 2100 2205 2315 2431 1105111 Power Beeder 0 3000 3150 3308 3473 3647 1657712 Multi Crop Planter 6 1000 1050 1103 1158 1216 552613 Ridge Maker 44 1000 1050 1103 1158 1216 5526
14Happy Sheeder/Roto Seeder 0 1000 1050 1103 1158 1216 5526
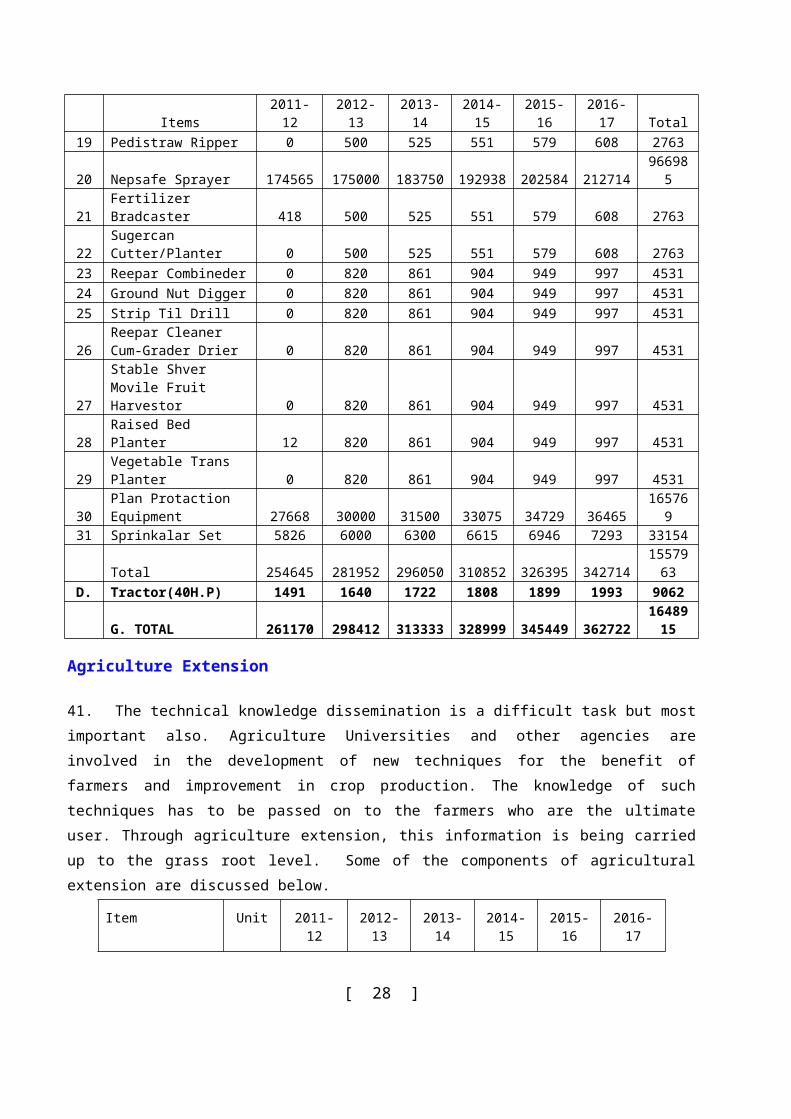
15 Power Tiller 40 1640 1722 1808 1899 1993 906216 Power Weeder 0 500 525 551 579 608 276317 Lazer Levler 0 72 76 79 83 88 39818 Ridger 0 500 525 551 579 608 276319 Pedistraw Ripper 0 500 525 551 579 608 276320 Nepsafe Sprayer 174565 175000 183750 192938 202584 212714 96698521 Fertilizer Bradcaster 418 500 525 551 579 608 2763
[ 18 ]
Items 2011-12 2012-13 2013-14 2014-15 2015-16 2016-17 Total22 Sugercan Cutter/Planter 0 500 525 551 579 608 276323 Reepar Combineder 0 820 861 904 949 997 453124 Ground Nut Digger 0 820 861 904 949 997 453125 Strip Til Drill 0 820 861 904 949 997 4531
26Reepar Cleaner Cum-Grader Drier 0 820 861 904 949 997 4531
27Stable Shver Movile Fruit Harvestor 0 820 861 904 949 997 4531
28 Raised Bed Planter 12 820 861 904 949 997 453129 Vegetable Trans Planter 0 820 861 904 949 997 4531
30Plan Protaction Equipment 27668 30000 31500 33075 34729 36465 165769
31 Sprinkalar Set 5826 6000 6300 6615 6946 7293 33154 Total 254645 281952 296050 310852 326395 342714 1557963
D. Tractor(40H.P) 1491 1640 1722 1808 1899 1993 9062 G. TOTAL 261170 298412 313333 328999 345449 362722 1648915
Agriculture Extension
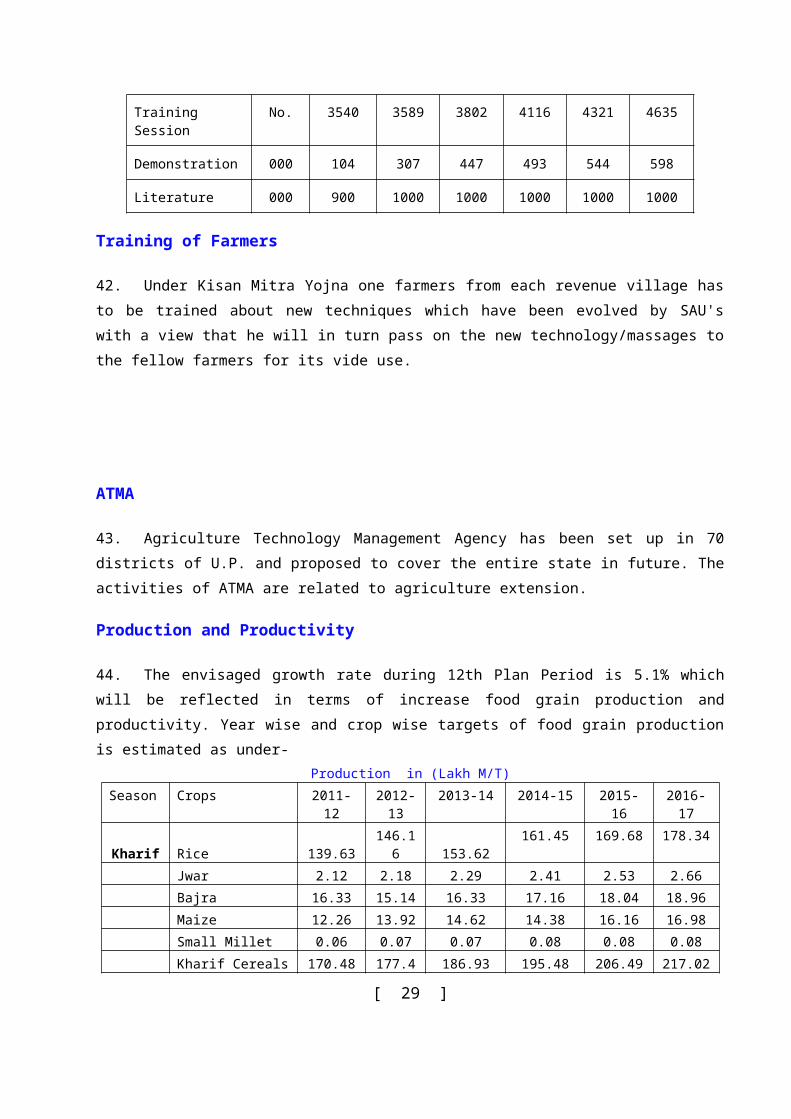
41. The technical knowledge dissemination is a difficult task but most important also. Agriculture Universities and other agencies are involved in the development of new techniques for the benefit of farmers and improvement in crop production. The knowledge of such techniques has to be passed on to the farmers who are the ultimate user. Through agriculture extension, this information is being carried up to the grass root level. Some of the components of agricultural extension are discussed below.
Item Unit 2011-12 2012-13 2013-14 2014-15 2015-16 2016-17
Training Session No. 3540 3589 3802 4116 4321 4635
Demonstration 000 104 307 447 493 544 598
Literature 000 900 1000 1000 1000 1000 1000
Training of Farmers
42. Under Kisan Mitra Yojna one farmers from each revenue village has to be trained about new techniques which have been evolved by SAU's with a view that he will in turn pass on the new technology/massages to the fellow farmers for its vide use.
ATMA
[ 19 ]
43. Agriculture Technology Management Agency has been set up in 70 districts of U.P. and proposed to cover the entire state in future. The activities of ATMA are related to agriculture extension.
Production and Productivity
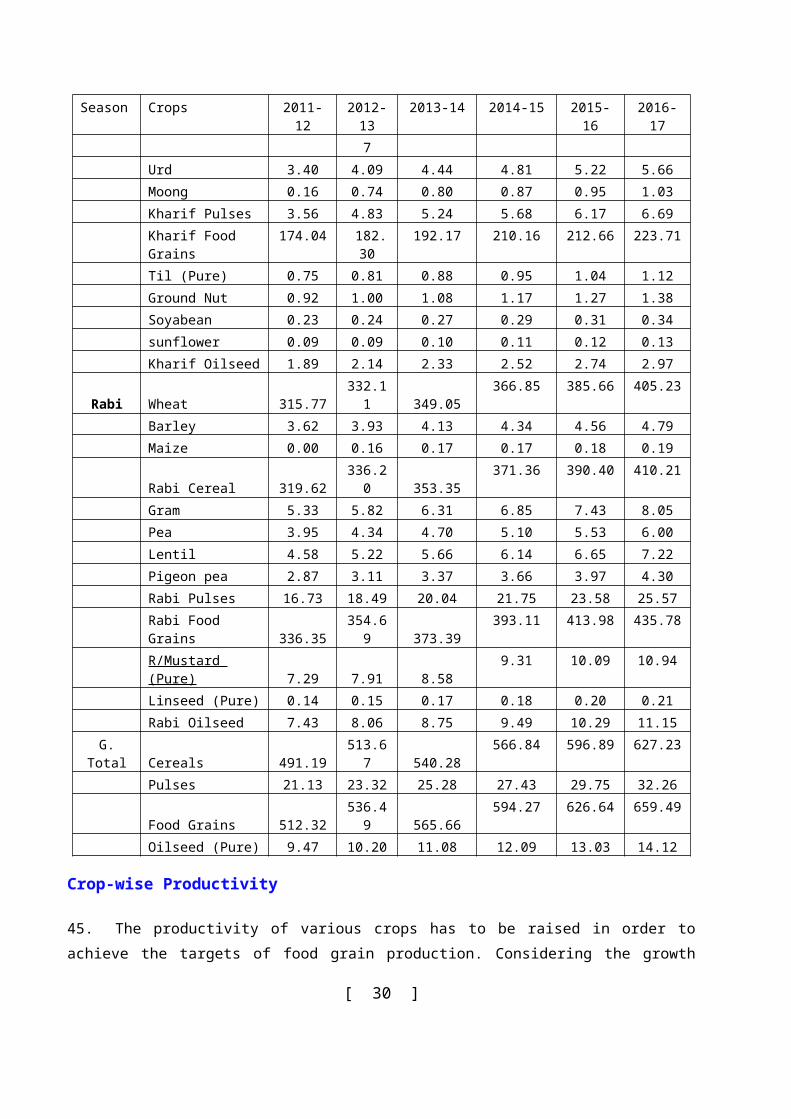
44. The envisaged growth rate during 12th Plan Period is 5.1% which will be reflected in terms of increase food grain production and productivity. Year wise and crop wise targets of food grain production is estimated as under-
Production in (Lakh M/T)Season Crops 2011-12 2012-13 2013-14 2014-15 2015-16 2016-17
Kharif Rice 139.63 146.16 153.62 161.45 169.68 178.34Jwar 2.12 2.18 2.29 2.41 2.53 2.66Bajra 16.33 15.14 16.33 17.16 18.04 18.96Maize 12.26 13.92 14.62 14.38 16.16 16.98Small Millet 0.06 0.07 0.07 0.08 0.08 0.08Kharif Cereals 170.48 177.47 186.93 195.48 206.49 217.02Urd 3.40 4.09 4.44 4.81 5.22 5.66Moong 0.16 0.74 0.80 0.87 0.95 1.03Kharif Pulses 3.56 4.83 5.24 5.68 6.17 6.69Kharif Food Grains 174.04 182.30 192.17 210.16 212.66 223.71Til (Pure) 0.75 0.81 0.88 0.95 1.04 1.12Ground Nut 0.92 1.00 1.08 1.17 1.27 1.38Soyabean 0.23 0.24 0.27 0.29 0.31 0.34sunflower 0.09 0.09 0.10 0.11 0.12 0.13Kharif Oilseed 1.89 2.14 2.33 2.52 2.74 2.97
Rabi Wheat 315.77 332.11 349.05 366.85 385.66 405.23Barley 3.62 3.93 4.13 4.34 4.56 4.79Maize 0.00 0.16 0.17 0.17 0.18 0.19Rabi Cereal 319.62 336.20 353.35 371.36 390.40 410.21Gram 5.33 5.82 6.31 6.85 7.43 8.05Pea 3.95 4.34 4.70 5.10 5.53 6.00Lentil 4.58 5.22 5.66 6.14 6.65 7.22Pigeon pea 2.87 3.11 3.37 3.66 3.97 4.30Rabi Pulses 16.73 18.49 20.04 21.75 23.58 25.57Rabi Food Grains 336.35 354.69 373.39 393.11 413.98 435.78R/Mustard (Pure) 7.29 7.91 8.58 9.31 10.09 10.94Linseed (Pure) 0.14 0.15 0.17 0.18 0.20 0.21Rabi Oilseed 7.43 8.06 8.75 9.49 10.29 11.15
G. Total Cereals 491.19 513.67 540.28 566.84 596.89 627.23Pulses 21.13 23.32 25.28 27.43 29.75 32.26Food Grains 512.32 536.49 565.66 594.27 626.64 659.49Oilseed (Pure) 9.47 10.20 11.08 12.09 13.03 14.12
Crop-wise Productivity
[ 20 ]
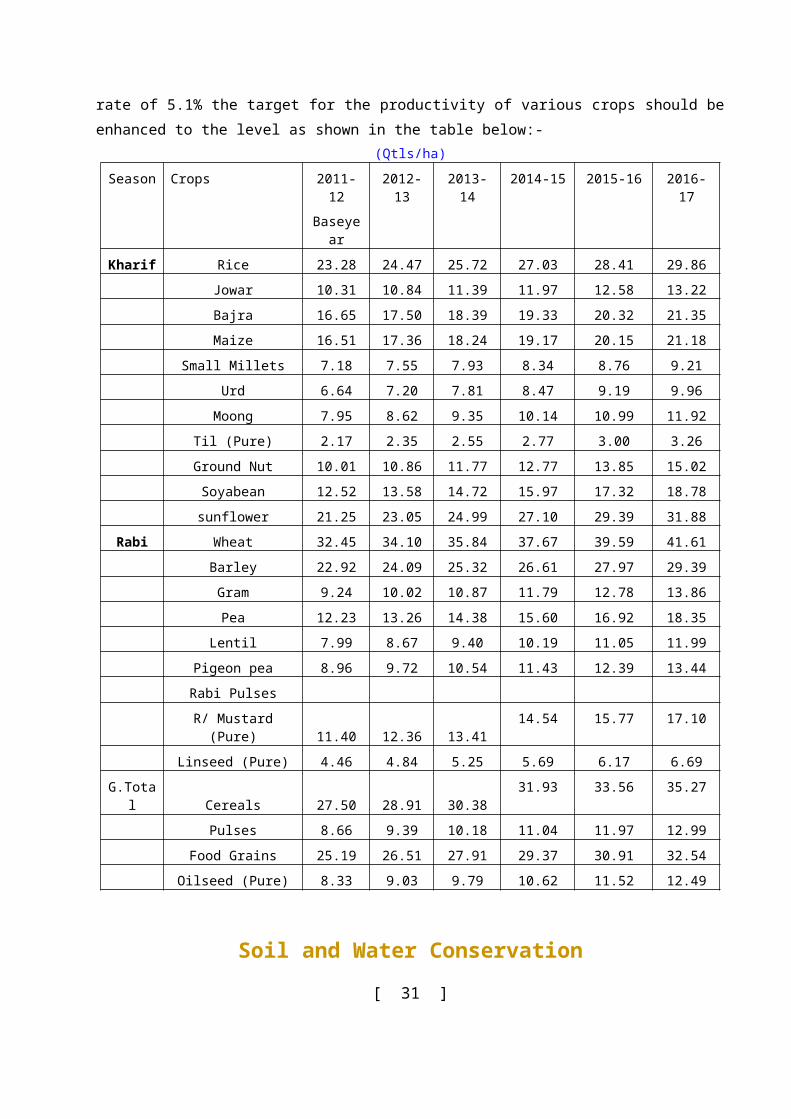
45. The productivity of various crops has to be raised in order to achieve the targets of food grain production. Considering the growth rate of 5.1% the target for the productivity of various crops should be enhanced to the level as shown in the table below:-
(Qtls/ha)
Season Crops 2011-12
Baseyear
2012-13 2013-14 2014-15 2015-16 2016-17
Kharif Rice 23.28 24.47 25.72 27.03 28.41 29.86
Jowar 10.31 10.84 11.39 11.97 12.58 13.22
Bajra 16.65 17.50 18.39 19.33 20.32 21.35
Maize 16.51 17.36 18.24 19.17 20.15 21.18
Small Millets 7.18 7.55 7.93 8.34 8.76 9.21
Urd 6.64 7.20 7.81 8.47 9.19 9.96
Moong 7.95 8.62 9.35 10.14 10.99 11.92
Til (Pure) 2.17 2.35 2.55 2.77 3.00 3.26
Ground Nut 10.01 10.86 11.77 12.77 13.85 15.02
Soyabean 12.52 13.58 14.72 15.97 17.32 18.78
sunflower 21.25 23.05 24.99 27.10 29.39 31.88
Rabi Wheat 32.45 34.10 35.84 37.67 39.59 41.61
Barley 22.92 24.09 25.32 26.61 27.97 29.39
Gram 9.24 10.02 10.87 11.79 12.78 13.86
Pea 12.23 13.26 14.38 15.60 16.92 18.35
Lentil 7.99 8.67 9.40 10.19 11.05 11.99
Pigeon pea 8.96 9.72 10.54 11.43 12.39 13.44
Rabi Pulses
R/ Mustard (Pure) 11.40 12.36 13.41 14.54 15.77 17.10
Linseed (Pure) 4.46 4.84 5.25 5.69 6.17 6.69
G.Total Cereals 27.50 28.91 30.38 31.93 33.56 35.27
Pulses 8.66 9.39 10.18 11.04 11.97 12.99
Food Grains 25.19 26.51 27.91 29.37 30.91 32.54
Oilseed (Pure) 8.33 9.03 9.79 10.62 11.52 12.49
Soil and Water Conservation
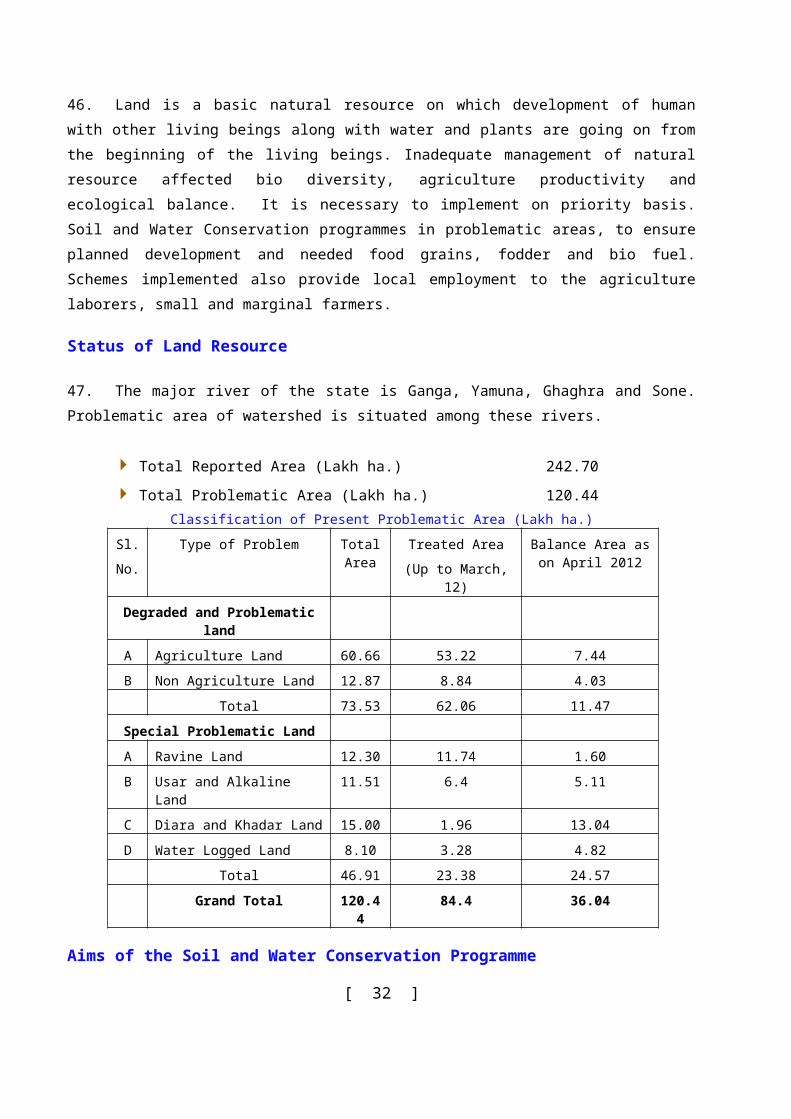
46. Land is a basic natural resource on which development of human with other living beings along with water and plants are going on from the beginning of the living beings. Inadequate management of natural resource affected bio diversity, agriculture productivity and ecological balance. It is necessary to implement on priority basis. Soil and Water Conservation programmes in problematic areas, to ensure planned development and needed food grains, fodder and bio fuel. Schemes implemented also provide local employment to the agriculture laborers, small and marginal farmers.
[ 21 ]
Status of Land Resource
47. The major river of the state is Ganga, Yamuna, Ghaghra and Sone. Problematic area of watershed is situated among these rivers.
Total Reported Area (Lakh ha.) 242.70
Total Problematic Area (Lakh ha.) 120.44Classification of Present Problematic Area (Lakh ha.)
Sl.
No.
Type of Problem Total Area
Treated Area
(Up to March, 12)
Balance Area as on April 2012
Degraded and Problematic land
A Agriculture Land 60.66 53.22 7.44
B Non Agriculture Land 12.87 8.84 4.03
Total 73.53 62.06 11.47
Special Problematic Land
A Ravine Land 12.30 11.74 1.60
B Usar and Alkaline Land 11.51 6.4 5.11
C Diara and Khadar Land 15.00 1.96 13.04
D Water Logged Land 8.10 3.28 4.82
Total 46.91 23.38 24.57
Grand Total 120.44 84.4 36.04
Aims of the Soil and Water Conservation Programme
Treatment through engineering and botanic method in Rainfed watershed areas to conserve moisture and water harvesting. Cropping intensity and productivity enhancement is the major issue of these areas.
To check the flood through appropriate measures of soil and water conservation techniques to cope up the problem of land degradation, silting and minimization of moisture.
Plan development and treatment of USAR, ravine and water logged area.
Implementation of schemes for social up-liftment of small, marginal and SC/ST in watershed areas.
Implementation of schemes for employment generation for landless agriculture laborers and small and marginal farmers for their socio economic up-liftment.
Ground water up-liftment through ground water recharging.
To maintain the ecological balance through the soil and water conservation programme.
Renovation of rural ponds through different schemes for aquaculture and fisheries. It is also helpful ground water level up-liftment.
Agriculture Education and Research[ 22 ]
48. The work of agriculture education and research is being carried out by four state agricultural universities. Besides SAUs, two central universities and 37 agricultural colleges affiliated to general universities are also imparting agricultural education and pursuing research and extension in some form. The agricultural research, extension and technology generation system is further augmented by 14 ICAR and 5 CSIR institutions.
Agricultural Research
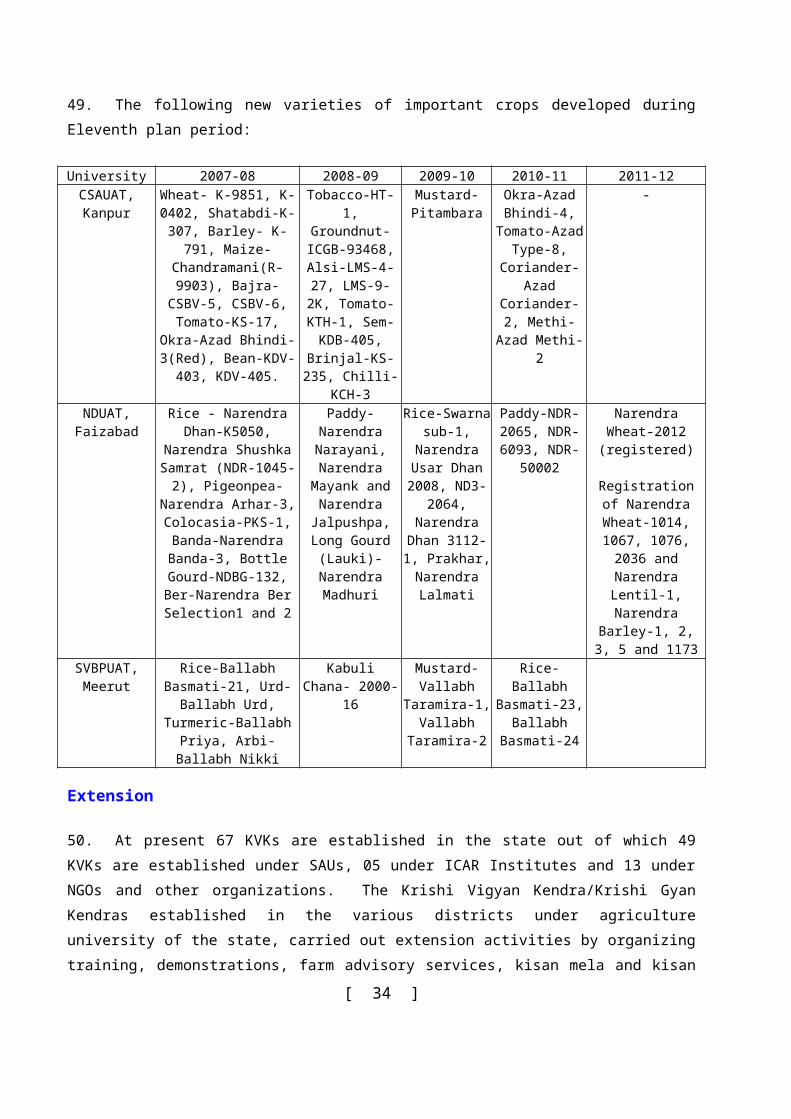
49. The following new varieties of important crops developed during Eleventh plan period:
University 2007-08 2008-09 2009-10 2010-11 2011-12CSAUAT,
KanpurWheat- K-9851, K-0402, Shatabdi-K-307, Barley-
K-791, Maize- Chandramani(R-9903),
Bajra- CSBV-5, CSBV-6, Tomato-KS-17, Okra-Azad Bhindi-3(Red),
Bean-KDV-403, KDV-405.
Tobacco-HT-1, Groundnut-ICGB-93468, Alsi-LMS-4-27, LMS-9-2K, Tomato-KTH-1, Sem-KDB-405, Brinjal-KS-235, Chilli-KCH-3
Mustard- Pitambara
Okra-Azad Bhindi-4,
Tomato-Azad Type-8,
Coriander-Azad Coriander-2, Methi-Azad
Methi-2
-
NDUAT, Faizabad
Rice - Narendra Dhan-K5050, Narendra Shushka
Samrat (NDR-1045-2), Pigeonpea- Narendra
Arhar-3, Colocasia-PKS-1, Banda-Narendra Banda-3, Bottle Gourd-NDBG-132, Ber-Narendra Ber
Selection1 and 2
Paddy-Narendra Narayani,
Narendra Mayank and Narendra
Jalpushpa, Long Gourd (Lauki)-
Narendra Madhuri
Rice-Swarna sub-1, Narendra
Usar Dhan 2008, ND3-
2064, Narendra Dhan 3112-1,
Prakhar, Narendra Lalmati
Paddy-NDR-2065, NDR-6093, NDR-
50002
Narendra Wheat-2012 (registered)
Registration of Narendra Wheat-1014, 1067, 1076, 2036 and Narendra Lentil-1, Narendra
Barley-1, 2, 3, 5 and 1173
SVBPUAT, Meerut
Rice-Ballabh Basmati-21, Urd-Ballabh Urd,
Turmeric-Ballabh Priya, Arbi-Ballabh Nikki
Kabuli Chana- 2000-16
Mustard-Vallabh
Taramira-1, Vallabh
Taramira-2
Rice-Ballabh Basmati-23,
Ballabh Basmati-24
Extension
50. At present 67 KVKs are established in the state out of which 49 KVKs are established under SAUs, 05 under ICAR Institutes and 13 under NGOs and other organizations. The Krishi Vigyan Kendra/Krishi Gyan Kendras established in the various districts under agriculture university of the state, carried out extension activities by organizing training, demonstrations, farm advisory services, kisan mela and kisan gosthis. The queries of the farmers were answered by Krishak Help Line and Kisan Call Centres established in agriculture universities. In addition to above, the KVKs also carried out seed production programme, fisheries, production of bio-fertiliser and bio agents for control of crop pests and distributed among the farmers. The literatures of various agriculture technologies were published and also experts from agriculture universities provided latest know-how to the farmers through radio and TV.
Vision for the Twelfth Five Year Plan
[ 23 ]
51. To equip agriculture education and research to meet the challenges of dependence on monsoons, fragmented land-holding, imbalanced and low level of input usage, inefficient natural resource management, poor pre- and post-harvest practices and inadequate marketing infrastructure are some of the well-known weaknesses that lead to low yields and high cost of the farm produce resulting poor economic condition of farming community.
Goals Evolving new varieties by using frontier areas of science. Development of management techniques according to local problems. Promoting market oriented research. Encouraging agriculture research in private sector. Linkage with industries for commercialization of agricultural research. Strengthening of laboratories and educational programmes of agriculture universities. Quality improvement in education system in SAUs. Strengthening of UPCAR for effective and efficient coordination of research and education. Motivation of women's in the area of agriculture science and education. Encouraging employment oriented education and training programmes.
Priorities
Education To make Manyavar Sri Kanshiram Ji University of Agriculture & Technology, Banda fully
functional To orient degree curriculum with more practical orientation to cater to the needs of public,
private and corporate sectors in Agriculture To initiate new curriculum in frontier areas of Agriculture such as organic farming, farming
systems, IPR, communication skill development, Horti Agri- business management, biotechnology, etc..
To initiate short-term vocational diploma programmes in SAUs.
Research Strengthening of regional research stations established under SAUs (CSAUAT-14, NDUAT-
07, SVBPUAT-04 ) for location specific research and UPCAR for effective and efficient coordination between research and line departments.
To develop area specific crop varieties and technologies and solutions for problems encountered by the farmers particularly small and marginal.
Genetic manipulation in Field crops, vegetables crops & fruits plants/trees. Development of thermo tolerant insensitive sensitive varieties of wheat. Develop genotypes for biotic (diseases, insects etc.) and abiotic (drought, flood, heat, cold,
salinity) stress management either by traditional plant breeding, or genetic modification.
[ 24 ]
Critical appraisal of agronomic strategies and evolving new agronomy for climate change scenarios.
Exploring opportunities for maintenance/restoration/enhancement of soil properties. Development of farm implements suitable for small and marginal holdings. Develop technologies to minimize the water and energy use for crops and cropping systems
specially for declining ground water table areas. Dvelopment of farming modules for different land holdings located in different regions of
Uttar Pradesh. Development of technologies for facilitating diversification through intensive production of
fruits, vegetables, flower, other high value crops, fisheries, dairy and other enterprises. Development of IPM and IPNM packages for different farm holdings to improve soil health. Development of mosaic resistant varieties of tomato, chilli, urd and moong. Isolation of efficient bioagents for disease and pest management. Post harvest processing and value addition. Packaging technologies for fruits, flowers and vegetables for domestic as well as international
market. Validation and refinement of ITKs. Development of packages for peri-urban agriculture. Developing spatially differentiated operational contingent plans for temperature and rainfall
related risks, including supply management through market and non-market interventions in the event of adverse supply changes.
Enhancing research on applications of short, medium and long range weather forecasts for reducing production risks.
Developing knowledge based decision support system for translating weather information into operational management practices.
Developing pests and disease forecasting system for contingent planning and effective disease management.
Pest and disease dynamics in relation to weather forecasting. Research on market intelligence. Management of water-logged area. Management of water in ground water depleted area Strengthening of fodder research
Extension
52. Establishment of new KVKs in leftout districts to strengthen knowledge dissemination network.
Annual Plan 2012-2013
[ 25 ]
Strengthening of Education, Research and Extension in State Agriculture Universities
Establishment of a new university of agriculture and technology at Banda district was sanctioned in 2008-09. During 2011-12, 12442.78 lacs was provided for construction of College of Veterinary Sc. and AH, Administrative Building, Hostels and Residential Buildings. An outlay of Rs. 9621.68 lacs has been proposed for construction of remaining work of construction and essential infrastructure facilities like electricity, Sever, Drinking water, roads, etc. in the Annual Plan 2012-13.
Strengthening of Education, Research and Extension in C.S. Azad University of Agriculture and Technology, Kanpur
The C.S. Azad University of Agriculture and Technology is one of the oldest agriculture university in the country. The university was upgraded to status of agriculture university in 1975 from its status of Government College.
53. In order to strengthen the College of Dairy Technology and College of Fisheries at Etawah and Research, an outlay of Rs. 500.00 lacs is proposed in the Annual Plan 2012-13.
Strengthening of Education, Research and Extension in N.D. University of Agriculture and Technology, Faizabad
54. The Fisheries Industrial Centre in Gonda, College of Agri-business Management, Construction of Stadium, International Hostel cum VIP Guest house, Internal roads, high mask electric tower and boundary wall, Residential buildings under Faizabad agriculture university is under process of construction and establishment. In order to complete the remaining work of construction and furnishing of these colleges and strengthening research and extension work, an outlay of Rs. 1972.92 lacs is proposed in the Annual Plan 2012-13.
Strengthening of Education, Research and Extension in Sardar Vallabh Bhai Patel University of Agriculture and Technology, Meerut
55. The construction and establishment work of residential buildings, College of Technology, College of Post Harvest Technology, Poultry Research and Training Centre is under process. To develop infrastructure facilities and to complete the construction work of these buildings and strengthen research and extension work in SVBPUAT, Meerut, an outlay of Rs. 1573.72 lacs has been proposed in Annual Plan 2012-13 and are essentially required for the smooth running of university.
ICAR funded projects
56. In the field of research, the All India Coordinated Research Projects are being operated in the state agriculture universities on 75:25 basis. Out of total grant the 75% share is met by Indian Council of
[ 26 ]
Agricultural Research and 25 % share has to be met by State Govt as per MoU. Therefore an outlay Rs. 800.00 lacs has been proposed in Annual Plan 2012-13 for this purpose.
Horticulture
57. Uttar Pradesh has the natural advantage of diverse agro climatic conditions, which enables production of wide range of horticulture crops. Uttar Pradesh is bestowed with rich bio-diversity and varied agro-climatic conditions, ideal for growing a large variety of horticultural crops. The sector, which includes fruits, vegetables, floriculture, spices and medicinal & aromatic plants, has gained importance in terms of enhanced income per unit area, providing nutritional security, source of raw material for many food processing industries, earning considerable amount of foreign exchange, leading to socio-economic improvement of the people of the state. Keeping the above importance of horticulture in the national economy and the economy of the state, in particular, a systematic and scientific effort of developing horticulture in the state has been made. The objective, therefore, is to formulate programmes aimed at developing the potential that exists for growing a variety of horticultural crops, to raise income and to generate employment and to achieve a growth rate of 10% in horticulture sector. By increasing horticultural production activities right from sowing to its maintenance, irrigation, harvesting, cutting, marketing, processing and value addition etc. help in creating 860 man days per hectare per years.
58. Keeping the above importance of horticulture in the national economy and the economy of the state, in particular, a systematic and scientific effort of developing horticulture in the state has been made. The objective, therefore, is to formulate programmes aimed at developing the potential that exists for growing a variety of horticultural crops, to raise income and to generate employment and to achieve a growth rate of 10.40 % in horticulture sector.
Twelfth Five Year Plan, 2012-17
Vision Increase in Area, Production and Productivity . Enhancement of Income of small and marginal Farmers. Strengthening of Marketing infrastructure. Promotion of Food Processing.
Goals To achieve 10.40% horticulture growth rate, Bringing 17.94 lakh hectare additional area under horticultural crops,
(a) New plantation of fruit crops covering 5.24 lakh ha., and (b) Increase in area expansion of vegetables by 11.50 lakh ha. and potato by 1.20 lakh ha. in
plan period. Increasing Productivity by 2.43 M.T. per ha. and production by 456.72 M.T.
[ 27 ]
Priority Areas Focus on increasing both production and productivity through cluster approach. Forward linkages of these clusters for marketing. Ensure supply of quality planting material. Use of Hi-Tech Horticulture. Export Quality Production through Organic Farming. Development of post harvest infrastructure. Awareness to the farmers related to IPM & INM practices and crop pattern.
New Initiatives Creation of Horticulture Data Base (Area, Production, Pdty, Marketing, Processing, etc data’s
at village levels). Strengthening of active Primary Horticulture Cooperative Societies for marketing of
horticulture produce. Facilitate marketing & export of horticulture & processed produce through institutional
support. Activization of RFRAC and creation of Organic certification system. Execution of National Mission on Food Processing for Technology Up-gradation/Setting
up/Modernization/Expansion of Food Processing Industries. Facilitation for supporting Cold Chain transportation & storage facilities for Horticultural &
Non-Horticultural produce. Specialized training of entrepreneur at premier institutions in the country.
Major Areas
Production of Quality planting material and Promotion of certified & hybrid vegetable seeds.
Promotion of protected cultivation/ latest cultivation Technologies, high-density plantation, adoption of intercropping.
Rejuvenation of old and unproductive Orchards.
Promotion of innovative programmes like-Organic farming, sprinkler/ drip systems, etc. in cluster approach.
Promotion of short term cultivation crops as banana, papaya, zimikand, flowers, vegetable, spices, medicinal and aromatic plants etc.
Generate awareness among farmers to use optimum dose of fertilizers/green manuring/INM as per soil testing report.
Minimize pre and post harvest losses.
Promotion of bee keeping and mushroom production.
Activate existing co-operative Societies.
[ 28 ]
Development of post harvest Infrastructure as-grading/packing centers, pack houses, cold storage, onion storage, rural markets etc.
Strengthening food processing sector through food processing mission.
Present Status
59. Uttar Pradesh has diverse agro-climatic conditions and with its vast agricultural & natural resources, it is facilitating production of various food crops like fruits, vegetable, spices, medicinal and aromatic plants etc. In terms of geographical area the state is first in the country with a cultivated area of 23.50 Lac hectares in vegetable. The state inhibits 16% of India's total human population and produces 17% the country's vegetables production. UP ranks First in vegetables production among all states. Major vegetables are potato and peas (leading state), sweet potato (second among states), cabbage (sixth among states). The productivity of vegetables in the state is 22.0 MT/ha against national average of 16.70 MT per ha. U.P. contributes 44-45% of the potato production of the country.
60. Similarly, UP ranks Sixth in fruits production among all states. Major fruits grown in the state are Mango (leading state in India in terms of production), Guava (ranked fourth in India), Banana and Litchi. The overall productivity of fruits in the state is 15.01 MT/ha against national average of 11.30 MT per hectares. The important spices produced in Uttar Pradesh are onion (sixth among states), turmeric, chilli, Garlic, fennel, fenugreek and coriander.
Potential U.P. is a major producer of fruits & vegetables. U.P has considerable potential to increase the
productivity and production of fruits, vegetables, spices and flowers on account of the varied agro climatic conditions, abundance of natural resources and introduction of technological changes.
Horticulture sector may prove largest sector of the state economy, with its highest shares both in terms of state income as well as in employment. Its share in total work force is higher than its share in state income. Cultivation of vegetable & fruits creates two to three times more employment than in cereal crops. Employment in this sector may be increased more by improving cropping intensity. It is known that horticultural crops create 860 man days per hectare.
This is prime need to bring more area under highly productive horticultural crops both for table as well as processing purpose as per national and international demand so as to establish these varieties in the market on competitive basis.
Production of seed of new varieties and planting material in private sector. Crop diversification of Horticultural crops. Marketing and Export promotion of different Horticultural produces so as to exploit
competitive advantage for the export of horticultural crops. Promotion of horticultural processing industries.
[ 29 ]
Horticulture provide opportunity for nutritional security and also food security through better accessibility.
Vast opportunity to attract youth towards Horticulture which creates two to three times more employment than in agriculture cereal crops.
There exists great scope of utilizing waste and ravine lands for horticultural crops.
ACHIEVEMENTS OF XITH FIVE YEAR PLAN
61. The year-wise achievements in area, production and Productivity of different crops as- Fruits, Vegetables and Potato are given as under:-
(Area in Lac. Hact.) (Production in Lac. Ton)
(Productivity in Ton/Ha.)Year Fruits Vegetables Potato Total
area prod. pvty. area prod. pvty. area prod. pvty. area prod. pvty.Ach. at the end of X th plan 2006-07
8.24 88.87 10.79 15.91 266.06 16.72 5.07 122.30 24.12 29.22 477.23 16.33
G.R. 1.29 4.43 3.39 5.49 4.65 6.39 2.97 5.512007-08 8.40 91.06 10.84 17.76 296.20 16.68 5.17 125.65 24.30 31.33 512.91 16.372008-09 9.53 109.60 11.50 19.21 332.00 17.28 5.27 108.00 20.49 34.01 549.60 16.162009-10 10.15 122.52 12.07 21.10 359.56 17.04 5.29 137.00 25.90 36.54 619.08 16.942010-11 11.00 136.74 12.43 23.18 401.72 17.33 5.50 145.00 26.36 39.68 683.46 17.22Ant.achie. at the end of XIth plan (2011-12 )
11.76 145.28 12.35 23.50 433.00 18.43 5.55 135.00 24.32 40.81 713.28 17.48
Ant. G.R. 7.37 10.33 8.11 10.23 1.83 2 6.91 8.37
62. The total production of 88.87 Lac tons of fruits had been achieved at the end of Xth plan 2006-07 which increased upto 136.74 Lac tons in the year 2010-11. Thus, a total increment of 53.87 % is achieved, during XIth Five Year Plan period. The production of vegetables in 2006-07 was 266.06 Lac tons which reached 401.72 Lac tons during 2010-11, thus, there was 51% increment during above period in vegetables production.
63. Similarly,The fruits productivity of 10.79 Ton per ha. was during 2006-07 which had increased to 12.43 Ton per ha. during 2010-11. Thus, there was 15.26% increment in fruit productivity during the period. Likewise the productivity of vegetables during the year 2006-07 was 16.72 Ton per ha. which increased to 17.33 Ton per ha. in the year 2010-11.
64. In the year 2006-07, the productivity of potato was 24.12 Ton per ha., which was increased to 26.36 Ton per ha. in the year 2010-11. Thus the productivity of potato increased to 9.29 % during aforesaid period.
XIIth PLAN
[ 30 ]
65. As mentioned above, the horticultural crops are well suited to the agro-ecological conditions of Uttar Pradesh and have considerable scope for further expansion. Being densely populated state, most of the farmers are of small and marginal holding and they practice farming of vegetables, spices, floriculture and early fruiting crops like banana & papaya, where on one hand labor is optimally used and on the other continued annual income are also earned. The present Growth Rate of Horticulture sector in the state is 8.37 % and it is proposed to increase it up to the level of 10.40%. in the XIIth Plan Period. The year wise potential aspects are as follows -
(Area in Lac. Hact.) (Production in Lac. Ton)
(Productivity in Ton/Ha.)Year Fruits Vegetables Potato Total
area prod. pvty area prod. pvty area prod. pvty. area prod. pvty
Achi. of XIth plan 2011-12
11.76 145.28 12.35 23.50 433.00 18.43 5.55 135.00 24.32 40.81 713.28 17.48
Ant. G.R. 7.37 10.33 8.11 10.23 1.83 2 6.91 8.37
2012-13 12.81 166.22 12.98 25.80 494.40 19.16 5.79 144.00 24.87 44.40 804.62 18.12
2013-14 13.86 187.17 13.50 28.10 555.80 19.78 6.03 153.00 25.37 47.99 895.97 18.67
2014-15 14.90 208.11 13.97 30.40 617.20 20.30 6.27 162.00 25.84 51.57 987.31 19.15
2015-16 15.95 229.06 14.36 32.70 678.60 20.75 6.51 171.00 26.27 55.16 1078.66 19.56
Targ. of XIIth plan (2016-17)
17.00 250.00 14.71 35.00 740.00 21.14 6.75 180.00 26.67 58.75 1170.00 19.91
Prop. G.R. 7.65 11.47 8.29 11.31 3.99 5.92 7.56 10.40
Strategy
To disseminate improved horticultural technology with area expansion in respect of fruits, vegetable, potato, flowers, spices and aromatic plants.
To increase the availability of improved seeds and elite planting material with high productivity and suitability to Indian and Export Market.
To improve productivity with export quality production.
To provide Post harvest infrastructure and give priority to food processing industry.
To encourage and motivate the growers to organize themselves and arrange their input supply as well as marketing of the produce through formation of Farmers Interest Groups (FIGs) and Horticultural Co-operative societies.
To enhance and strengthen the technology base particularly up gradation of the technical knowledge of the staff and farmers in respect of production, post harvest techniques and marketing of the produce.
66. Adoption of Hi-Tech horticulture is imperative for competing in International market. The technologies include genetically modified varieties, micro-propagation, integrated nutrient, water and pest management, fertigation, protected cultivation, organic farming, bio-pesticides, bio-fertilizers and hi-tech
[ 31 ]
post harvest technologies as- ionizing radiation, microwave and infra-red processing, membrane filtration, cold chain and controlled atmospheric storage, is to be introduced.
67. The programmes under the plan have been so designed as to increase area, production and productivity of horticultural crops as well as increase income of the rural people/ farmers and to generate employment, especially for women. Briefly stated, the plan components would include:
New plantings of fruit trees covering 5.24 lakh ha, in addition to replanting of old and uneconomic mango and guava orchards. Rejuvenation of the degraded fruit trees covering 15,000 ha is also being considered under the programme.
The addition area expansion in vegetables covering 11.50 lakh ha and potato 1.20 lakh ha;
Provision of irrigation facilities through modernization of minor irrigation schemes by means of sprinkler and drip systems;
Infrastructure development covering establishment of fruit and vegetable markets with facilities for grading, packing and storage, strengthening of existing assembly markets, promotion of growers' cooperative societies and establishment of a few pack houses at predominant producing centers to serve as marketing outlets for fruits, vegetables and potato including facilities for processing of fruits and vegetables to take care of post-harvest handling;
Institutional strengthening through appointment of horticulture assistance on contractual basis and capability of DOH and strengthening of training facilities. Establishment of new nurseries and colonel orchards at district level and strengthening of the existing nurseries to meet the requirements of planting material/seeds of recommended varieties of plant species would be supported.
New Plantation
68. A total area of 17.94 lakh ha would be brought under various horticultural crops. Area expansion under this component has been assumed at an annual growth rate of 7.65-8.29 per cent for fruits, vegetables and potato. Under this, 25,000-30,000 ha. area of plantation will be covered under different scheme/programmes annually, for which 75 per cent subsidy has been proposed. Under demonstration effect, Approx. three time area of 75,000-80,000 ha. will have to covered annually through the establishment of commercial orchards of 0.4 ha to 4.0 ha. size by fruit growers. Under these two programmes an additional area of an average 1.05 Lac.ha is proposed to be brought under fruits annually and 5.24 lakh ha over a period of 5 years from 2012 up to 2017. The proposed area coverage in XII th Plan Period of different crops would be as under:-
Crops Area inHa.Mango 80,000
[ 32 ]
Guava 95,000Citrus 30,000Litchi 40,000Papaya 30,000Banana 1,25,000Bel 10,000Aonla 65,000Other Fruits 49,000Total 5,24,000
Rejuvenation
It is also proposed to undertake rejuvenate programme for mango orchards between the age of 20 and 50 years. The area proposed to be covered under this programme would be 5,000 ha under the age group of 30 to 40 years, and 10,000 ha under 40 - 50 years.
Vegetables
New area brought under vegetables covers 11.50 lakh ha.. Taking the area under vegetables from the present level of 23.50 lakh ha to 35.00 lakh ha.. Besides cultivation of seasonal vegetables, production of vegetable seeds and potato seeds as well are covered under the programme. The area under vegetable cultivation will grow at an annual rate of around 8.29 per cent beginning in year 2012 and ending in year 2017.
Potato
Potato production will cover a total area of 6.75 lakh ha. by the year 2017 showing an increase of 1.20 Lac ha over the present level. Production of potato would cover both table and for seed purpose.
Irrigation and Water Management
Optimum and judicious utilisation of irrigation water would aid adoption of improved techniques of production being proposed under the project. In regions which experience acute shortage of water for irrigation, use of improved systems like sprinkler and drip irrigation have been proposed to accelerate growth of horticultural crops. The use of such systems in the cooperative sector may also be considered. Modernisation of minor irrigation schemes by way of sprinkler and drip systems has been proposed.
Infrastructure Support
[ 33 ]
The magnitude of horticulture development programme envisaged necessitates infrastructural support in the form of establishment of new nurseries to ensure supply of improved planting material and facilities for post harvest handling of fruits and vegetables.
Establishment of Nurseries
Establishment of 50 new nurseries at district level to provide disease free elite plant material has been supported. Likewise, investment on modernisation of the existing farms/nurseries of government and Universities has been proposed to ensure supply of improved plant material of high pedigree.
Establishment of New Markets
Establishment of exclusive markets for fruits and vegetables with facilities for grading, packing and storage has been proposed, with the help of Mandi Parishad, in Mission components. These would be set up in cluster areas. These markets will be provided with fencing, internal roads, auction halls, grading platforms, administrative services, water supply and other utilities. Each market yard would be developed with approved layouts depending on the expected arrivals, number of buyers and sellers etc. The structural work would be as per that applicable to the market yards in the State. A detailed feasibility study may have to be conducted by the State Mandi Parishad to establish viability of these markets.
Establishment of Rural market yards to provide better facilities to farmers has been proposed. The market yards in these major assembly markets are not in a position to provide facilities. Better facilities and amenities need to be created which is sought to be provided through strengthening them. Where the space requirements cannot be met by the existing market yards, the fruit market to combine the benefits of infrastructure availability. The proposed market yards would be provided with the necessary amenities, administrative services and other utilities.
Establishment of Pack Houses
Small Pack Houses will be set up in important production areas. Each house will have a command area of between 150 and 200 ha and an average annual production of about 2000 tonnes of assorted produce. Each centre would handle on an average 1000 MT of fruits and vegetables per year which is considered adequate to influence the price.
Proposed Scheme's/Programmes in XIIth Plan
69. The plan will specially focus on increasing the production and productivity through adoption of improved technologies for ensuring quality of all horticultural crops. Creation of markets at the block, district and state level will be an integral activity of the plan. Special emphasis will be on adopting cluster approach for developing regionally differentiated crops, which are most suitable for the state/region. Availability of good quality planting material being a key area for the development of horticulture, efforts will be made to create necessary infrastructure in the form of nurseries. This will be supplemented with
[ 34 ]
plantation development programmes by adding new areas under improved varieties to meet the demand of the market in fresh as well as processed form.
70. The low productivity of the perennial fruits like mango, citrus is mainly due to small size of holdings, the preponderance of old and senile trees and the poor management available to them. Under the SHM it is proposed to take up rejuvenation/productivity improvement programmes is such old and thickly shaded mango and guava orchards.
71. For enabling vertical growth through increased productivity, it is proposed to take up activities like protected cultivation, promotion of integrated Nutrient Management (INM) and Integrated Pest Management (IPM). Besides, precision farming techniques will be tried out on pilot scale for selected crops like banana, litchi, aonla, chilli and flowers like gladiolus, tuberose etc.
72. Post harvest management would help in creating suitable infrastructure for efficient post harvest management and marketing of horticulture produce, including Marketing promotional activities such as dissemination of market information to the farmers, processors, traders and consumers. Special thrust would be provided to promote the export of horticultural produce through Agri-Export Zones (AEZ), for which there is potential global market. The farmers will also be encouraged to work with corporate houses for ensuring supply of quality inputs and buy back arrangement.
73. The congenial agro-climatic conditions prevalent in the state viz; which are suitable for production of many horticultural crops, availability of plenty of sun shine, cheap skilled labour, improved variety of seeds, etc offer good opportunities of horticultural development. It is proposed to optimally utilize the existing strengths and opportunities by overcoming weakness and threats. The department is all set to meet the above challenges with all its capabilities through following programmes which are proposed under State & Centre sector schemes:-
Proposed Programme/Assitance-
Programmes Assistance Per Unit (Rs.) A Fruits Development (a) Fruits Cultivation Papaya 90% of cost subject to a max. of Rs.34762 /- ha. limited
to 2 ha. / benef. Mango, Guava, Aonla, Litchi 90% of cost subject to a max. of Rs. 27,000 /- ha.
limited to 2 ha. / benef.(Rs. 13500/- in First year, Rs. 8100/- in Second year & Rs. 5400/- in Third year)
Banana ( Tissue culture) 75% of cost subject to a max. of Rs. 97,500 /- ha. limited to 2 ha. / benef.( in First year)
(b)Plantation on Orchard's Boundary Karonda (2 meter spacing/ 200 plants per
ha.)90% of cost subject to a max. of Rs.1800 /- ha. in Ist year
Ber, Bel, Sharifa, Shahazen(8 meter spacing / 50 plants per ha.)
90% of cost subject to a max. of Rs.540 /- ha. in Ist year
B. Vegetable& Spices Cultivation (a) Vegetable Cultivation
[ 35 ]
Programmes Assistance Per Unit (Rs.) (i) Promotion of Machan Cultivation(ha.) Cucurbits 75% of cost max. of Rs.75000/-per ha. (ii) Promotion of Hybrid Vegetable Cultivation (ha.)
Hybrid Capsicum 75% of cost subject to a max. of Rs.70500/-per ha. European Vegetable 75% of cost subject to a max. of Rs.61500/-per ha. (b) Spices Cultivation (ha.) Chili 90% of cost subject to a max. of Rs.33434/-per ha. Coriander 90% of cost subject to a max. of Rs.23400/-per ha. Garlic 90% of cost subject to a max. of Rs.41421/-per ha. I.P.M. (Vegetable) Rs.2000/-per ha. Est. of Plastic Tunnels (250 sq.m.) (no.) Rs.2520/-per Unit per 250 sq.m. Est. of Zero Energy Cool Chambers (no.) Rs.2880/-per Unit of 100 kg.
C. Floriculture& Medi. Plant Culti. (i) Floriculture (ha.) Rose (cutting) 90% of cost subject to a max. of Rs.27000/-per 0.2ha. Merigold 90% of cost subject to a max. of Rs.7200/-per 0.2ha.D. Beekeeping Distribution of Bee Colonies (No.) 90% of cost subject to a max. of Rs.1440 /- per colony
with beehiveE. Project Management / Monitoring (a) Hire of Vehicles, , Publicity Through
Seminars, Gosthi, Electronic Media, Consultancy etc.
Appro.2% of the project amount
F. Appointment of horticulture assistant
Establishment of Lohia Gardens/Parks
74. It is proposed to established new gardens/parks in 8 districts like- Basti, Kannauj, Etawah, Hardoi, Ghazipur, Rampur and Ballia, to control the environmental pollution and to provide an ornamental and beautiful ambiences to people in urban areas. It will also help to maintain level of oxygen in cities to keep people healthy and tension free. Recreation facilities will also be provided for children in the park. Besides ornamental and flowering plants, lawn, water-body, bird baths and good landscape areas will also be developed in the proposed park. In the year 2012-13, 03 gardens/parks are being proposed to be established.
Promotion of betelvine cultivation
75. Betelvine cultivation is one of commercial horticulture crops in the state. It is cultivated partially in several districts like- Unnao, Raebareli, Hardoi, Lucknow, Sitapur, Barabanki, Sultanpur, Lalitpur, Mahoba, Banda, Pratapgarh, Jaunpur, Ballia, Ghazipur, Azamgarh, Kanpur-Nagar, Allahabad, Chhatrapati Shahuji Nagar, Varanasi, Mirzapur, Sonbhadra etc. Betelvine cultivation is very costly because its requires to erect Barejas (a structure made of bamboos and dry grasses) to protect betel leaf from direct sunlight and hot winds. Betelvine cultivators are mainly from poor categories and they have no
[ 36 ]
economical competence to invest money for cultivation. Betelvine cultivation can be enhanced by providing assistance to these poor farmers.
76. To promote betelvine cultivation in the state, it is proposed to provide 50% subsidy upto the Rs. 47300/= per 1000 sq.mtr. area to the farmers. In the year 2012-13, 200 Barejas of 1000 sq.mtr. will be proposed to be erected.
Food Processing
77. Food processing enhances shelf life and adds value even if the agri - produce is merely cleaned, sorted and packaged. Further processing into high value - added product is even more advantageous. Value addition enables remunerative prices to farmers. Enhanced shelf life leads to reduction in wastages .It provides convenience and safe food to consumers and promotes diversification and commercialization of agriculture by providing effective linkage between consumers and farmers . Moreover it makes farm produce more exportable . Promotion of food processing thus is necessary for the nation economy, the farmers and the consumers. Growth of food processing is also inevitable with rising incomes, favorable demographic transition and changing consumption pattern.
Status
78. Out of production of 120 lacs MT of fruits , mango contributes 75 % but the varieties grown are suitable for table purpose only .Value of organized mango business , even if 5 % of the present production is targeted , will work out to about Rs 300 crore . A brief description of the activities being undertaken by the department is given below :-
ANNUAL PLAN:2012-13
79. Food processing mission has an important role to play in linking Indian agriculture to consumers in the domestic and international markets. The agriculture sector in India contributes a fourth of the country’s GDP and provides employment to approximately two thirds of the population. However, its potential has not been tapped due to under development of the food-processing sector in India. The single most important challenge facing the country is providing remunerative prices to farmers for their produce without incurring the additional burden of subsidy through minimum support prices or other such measures. This challenge could be addressed if cereals, fruits, vegetables, milk, fish, meat and poultry etc. are processed for consumption in the domestic and international markets. The impact of increased economic growth in agribusiness through food processing mission can play a significant role in reducing rural poverty and increasing rural income.
80. Further, food processing mission leads to significant employment generation- not only directly but across the supply chain in production of raw materials, storage of produce and finished products and distribution of food products to consumers. Processing of food enhances shelf life of agricultural products
[ 37 ]
and thus reduces wastages. The role of food processing mission becomes critical since food production is targeted to double in the next years. With low farmer price realizations and wastage in the food supply chain being significant even with the current level of production, only processing food can secure farmer incomes against a slump in prices as well as reduce wastages. Further, a vibrant food processing mission industry can be a catalyst for crop diversification.
81. Uttar Pradesh is one of the largest producers of farm commodities in the country and the largest producer of vegetables, wheat, maize, sugarcane, potato and milk. Some of the most delicious varieties of fruits are grown in the state. Thus there is an immense inherent potential in this sector. The state also has diverse agro climate conditions, which are conducive for a variety of crops round the year.
82. Despite the inherent potential, it has so far been untapped. Large quantities of vegetables and fruits are wasted as only around 2% of the production is commercially processed. Most of the efforts in the agricultural production systems have been focussed on increase in production of different agricultural and horticultural commodities with little attention being paid to processing of the commodities thus produced. To harness the better returns from the agriculture and horticultural produce, the NMFP proposes to adopt a strategy which would centre around identification of potential areas for value addition, keeping in view both the international and domestic market demand and addressing issues relating to the entire value chain, right from farm to the palate, for achieving the objectives outlined in the project. This would include an extensive farmers/enterpreneurs training mechanism to help producers improve incomes through minimization of the post harvest losses of farm production, while going beyond this by assisting them in improvement of hygienic, sanitary and packaging standards.
83. The Project also proposes to educate traditional traders for clean and hygienic marketing apart from skill up gradation, motivation and awareness amongst farmers towards adoption of improved technologies.
84. To popularise organic or bio farming by planning for creation of an umbrella agency for organic and other certification in the state. Recognition of R-FRAC, established during DASP Phase I through the Project with a major support from Government of India, for organic certification from GOI would be an important milestone in promoting quality standards in agri-processing sector of U.P. Also, NMFP would promote actual Organic certification of the Horticulture/Agricultural Produce .
85. Another important element of value addition for agricultural and horticultural produce is Packaging. Packaging plays an important role in the marketing of fresh and processed produce by enhancing its shelf life. It also prevents the contamination of food by deterioration in its quality. Packaging has wide ramification feature- resource utilization, loss minimization, market penetration, market expansion, brand projection, consumer protection and environment preservation.
Implementation Plan
[ 38 ]
86. The Strategic Plan would be implemented through over a five year period of the 12th Plan i.e. 2012-17 through the implementation of the schemes of the Ministry as well as the state sponsoerd schemes. The strategy would be implemented through the implementation of the Plan schemes of the Food processing mission –
Scheme for Technology up gradation/ setting up/Modernization/expansion of Food Processing Industries
Scheme for supporting Cold Chain facilities for non horticultural products and refer vehicles
.Scheme for Human Resource Development (HRD)
Creation of Infrastructure Facilities for running Degree/Diploma/certificate courses in Food Processing Technology
Entrepreneurship Development Programme(EDP)
Food Processing Training Center(FPTC)
Scheme for promotional Activities
Organising Seminars/workshops
Conducting studies/surveys
Support to Exhibitions/Fairs
Advertisement & Publicity
Other Direct Schemes for Infrastructure Development by MOFPI,, GoI:
Establishment of Mega Food Parks
Modernization of Abattoirs
Scheme for Research & Development
Major Sub-sectors
87. The food processing sector comprises of two segments- Primary processed food and Value added food. Primary segment comprises of packaged fruit and vegetables, milk, flour, rice, spices etc and constitutes around 62% in value terms of the processed foods. Value added segment includes processed fruits and vegetables, juices, jam & jelly etc and holds around 38 % share in the total processed food. Major sub sectors of the food processing industry are:
Fruits and vegetable
Dairy
Fish & Marine Products
Snacks
Beverage
Growth drivers for industry
[ 39 ]
88.88. Food and grocery dominates total retail spend: While rural consumers spend around 53%5 of their total consumption expenditure on food, urban India spends 40% of their retail spend on food items thus offering huge opportunity for processed food products.
Higher disposable income:
Shift in demographic profile:
Increasing number of working women
Emergence of organized food retail
Opportunities
Large and diversified production base
Huge and growing consumer market
Enabling policy framework
Strategic location
Constraints Affecting the Growth of Food Processing Industry
89. While the food-processing sector offers several opportunities, it faces constraints as well, such as:
Lack of robust policy mechanism
Low Level of Government Outlay for Development of Food Processing Industries
APMC Act:
Essential Commodities Act, Stock Order etc.
Food Quality Regulation
Taxes on processed food items
Central Taxes
Direct Tax
Indirect taxes
Sugarcane
90. Uttar Pradesh is the prominent sugar cane producing state in the country. Besides U.P. other prominent states are Maharastra, Tamilnadu, Karnataka, Andhra Pradesh and Gujrat in tropical region and Punjab, Haryana and Bihar in subtropical region. The state of U.P. with regards to cane area, Av yield per hectare and total sugar cane production in country as whole and also in comparison to different states is presented as under.
Table-1 Prominent sugar producing-states of the country(Year 2010-11)
[ 40 ]
S.N.
State Cane Area (Thousand
ha.)
AV.Yield (Ton. per ha.)
Cane Crushed (lac Ton.)
Sugar Production (Thousand
Ton.)
Sugar recovery %
A Tropical region 1 Maharastra 964 81.80 802.23 9054 11.262 Tamilnadu 336 102.00 203.10 1846 9.093 Karnataka 421 89.30 337.65 3683 10.914 Andhra Pradesh 192 77.00 103.17 385 9.305 Gujrat 188 75.70 123.59 1235 9.99B Subtropical Region 1 U.P. 2101 56.34 643.81 5887 9.142 Haryana 85 70.40 43.46 392 9.013 Punjab 70 59.60 34.33 302 8.804 Bihar 300 50.00 14.60 385 9.30C All India 4944 68.06 2398.07 24394 10.17
Source Indian Sugar-December 2011 vol. No. (LXI)
91. From the perusal of the table following inferences are drawn:
Area under sugar cane in U.P. is highest amongst all the states, which is 42.50% of the total cane area of the country.
In total cane crush of the country, U.P. contributes 26.82%.
Except Punjab, Haryana average yield per hectare is highest in Uttar Pradesh amongst other states grouped in sub tropical region but much below than all India average being 68.06 ton.
Average sugar recovery is lower than Bihar but above in all subtropical states. But it lower than the all India average being 10.17%.
From the viewpoint of total sugar production U.P. is on the second among all states of the country.
92. Before going into details of plan wise achievement with regards to cane area, average yield, sugar cane production etc. It appears imperative to examine, as to how long the top sugar producing status was maintained by U.P. during, the last 10 year span.
Table-: State wise Sugar Production Directly from cane in India For ten years(lakh ton.)
STATES 2001-02 2002-03 2003-04 2004-05
2005-06
2006-07
2007-08
2008-09 2009-10 2010-11
1 Andhra Pradesh 10.48 12.10 8.86 9.82 12.36 16.80 13.35 5.93 5.15 10.062 Karnataka 15.50 18.68 11.16 10.40 19.43 26.60 29.00 16.54 25.58 36.833 Tamilnadu 18.39 16.44 9.21 11.08 21.42 25.40 21.41 15.98 12.80 18.464 Maharastra 56.13 62.13 31.75 22.17 51.97 91.00 90.75 45.78 70.67 90.545 Uttar Pradesh 52.60 56.51 45.51 50.37 57.84 84.75 73.19 40.64 51.79 58.876 Bihar 3.42 4.08 2.74 2.54 4.22 4.51 3.36 2.14 2.58 3.857 Haryana 6.24 6.36 5.82 4.00 4.09 6.52 5.99 2.29 2.48 3.92
All India 185.27 201.40 135.46 126.91 192.67 283.61 263.56 145.38 189.12 243.94Source : Indian Sugar- December 2011 vol. No. (LXI) No. nine
93. From the perusal of the table-2 it is evident that Maharastra was top leading state in sugar production during 2001-02 to 2010-11 except year 2003-04 to 2005-06, when U.P. was the leader. The fluctuation
[ 41 ]
in sugar production of the country was a prominent factor during the period under review, varying from 283.61 lakh ton. in 2006-07 to 126.91 in the year 2004-05, However, fluctuation in sugar production in U.P. is lesser.
94. Looking to the fluctuation in sugar production in the country a critical examination with special reference to U.P. with regards to cane area, average yield, total cane production, total sugar production, number of factories with installed capacity and sugar recovery obtained during the last eleven five year plans is necessary.
Table-3 Plan wise Achievement with regards to cane area, average yield, cane production sugar production etc.
S.N.
The final year of the plan
Cane area
(lac.h.)
Average yield
(M.t./Ha.)
Cane prodct. (L.t.)
Suger prodct. (L.t.)
No. of Mills
Crushing capecity
(Tcd)
Sugar recovery
%1 1st five year plan 7.97 40.10 319.34 10.98 68 72,327 9.692 2nd five year plan 9.84 37.72 371.10 12.04 71 84,859 9.323 3rd five year plan 8.26 36.43 300.88 7.11 71 1,02,059 9.584 4th five year plan 12.09 44.12 533.28 12.97 74 1,13,218 8.995 5th five year plan 14.69 39.40 578.78 14.63 88 1,31,535 9.286 6th five year plan 14.70 46.13 678.05 14.77 99 1,61,439 9.567 7th five year plan 18.55 57.51 1066.77 36.51 106 2,14,991 9.188 8th five year plan 21.96 60.76 1334.21 39.22 122 3,51,318 9.599 9th five year plan 20.54 54.40 1117.38 43.87 110/100 3,58,804 9.7310 10th five year plan 26.62 59.59 1546.22 84.75 133 709000 9.4711 11th five year plan
(Year 2007-08)28.50 56.44 1608.59 73.19 132 761328 9.78
Year 2008-09 21.40 51.77 1107.00 40.64 132 771701 8.94Year 2009-10 17.88 58.80 1051.33 51.79 128 772365 9.13Year 2010-11 21.01 56.35 1183.91 58.87 125 767240 9.14Year 2011-12(Anticipated)
22.51 58.00 1300.00 70.25 124 763740 9.00
95. Above table reveals that there is more than threefold increase in cane area of the state during the span of the last 11th five year plans. Average yield per hectare varied from 36.43 M.T. in 3 rd plan to 60.76 tones in 8th plan period.
96. Numbers of working mills was 68 in 1st five-year plan which was raised to 132 in 11th plan period. Similarly cane crushing capacity of mills was reported 72327 T.C.D. in first plan period which was raised to 7.78 lakh T.C.D. at the end of 11th plan.
The overall impact of increase in area, productivity, number of mills and subsequent increase in crushing capacity resulted in more than fivefold increase in sugar production during the span of 1st to 11th plan period.
Productivity of sugar cane in different part of the state in 11th plan
97. The existing sugarcane productivity level of U.P. is much below the national level. The average yield of sugar cane in U.P. was reported. 60.76 Ton. per ha. in 8 th five year plan while India’s average yield is about 64.06 ton. per ha. In the year 2010-11 productivity of the state can be increased up to the national average by adopting the high yielding varietal replacement program, using improved agricultural inputs
[ 42 ]
and suitable/ improved agricultural practices, use of suitable crop rotation, providing recommended dose of fertilizers and irrigation and applying plant protection measures.
98. The following table will give a picture of zone wise average yield of plant, ratoon and sugarcane crop as a whole. Table 5a, 5b, 5c, and 5d depict the segregated position of cane area, cane production. Average yield and sugar recovery in west, central & east U.P. during the 11th plan period.
Table-5A Cane area (lakh ha.)S.N. Year West Central East State
1 2007-08 7.38 12.28 8.84 28.502 2008-09 6.15 9.07 6.18 21.403 2009-10 5.28 7.78 4.82 17.884 2010-11 5.68 9.70 5.63 21.015 2011-12 22.51
Table-5B Cane production (lakh Ton.)S.N. Year West Central East State
1 2007-08 482.80 674.60 451.19 1608.592 2008-09 362.30 470.71 274.81 1107.823 2009-10 348.56 458.63 244.07 1051.264 2010-11 351.58 542.80 289.60 1183.985 2011-12 1300.00
Table-5C Average Yield (M.T./ha.)S.N. Year West Central East State
1 2 3 4 5 61 2007-08 65.39 54.94 51.05 56.442 2008-09 58.96 51.87 44.48 51.773 2009-10 65.97 58.96 50.67 58.804 2010-11 61.85 55.97 51.43 56.345 2011-12 58.00
Table-5D Sugar recovery (percentage.)Year West Central East State
1 2007-08 9.67 9.86 9.84 9.792 2008-09 8.83 9.05 8.89 8.943 2009-10 9.13 9.09 9.21 9.134 2010-11 8.92 9.24 9.25 9.145 2011-12 9.00
99. From the table 5a, 5b, 5c and 5d bring fallowing facts to notice:
Table 5a indicates that central U.P. commands highest cane area. Therefore a sincere effort is needed in the central U.P. to raise productivity of cane crop to achieve better average at state level.
Table 5b indicates that total cane production as expected is higher in central U.P. There exists possibility of more new sugar factory to come up in near future.
Table 5c reveals that eastern U.P. fetches poor yield per hectare than central and western U.P. Sincere effort is needed to increase productivity level in eastern U.P.
[ 43 ]
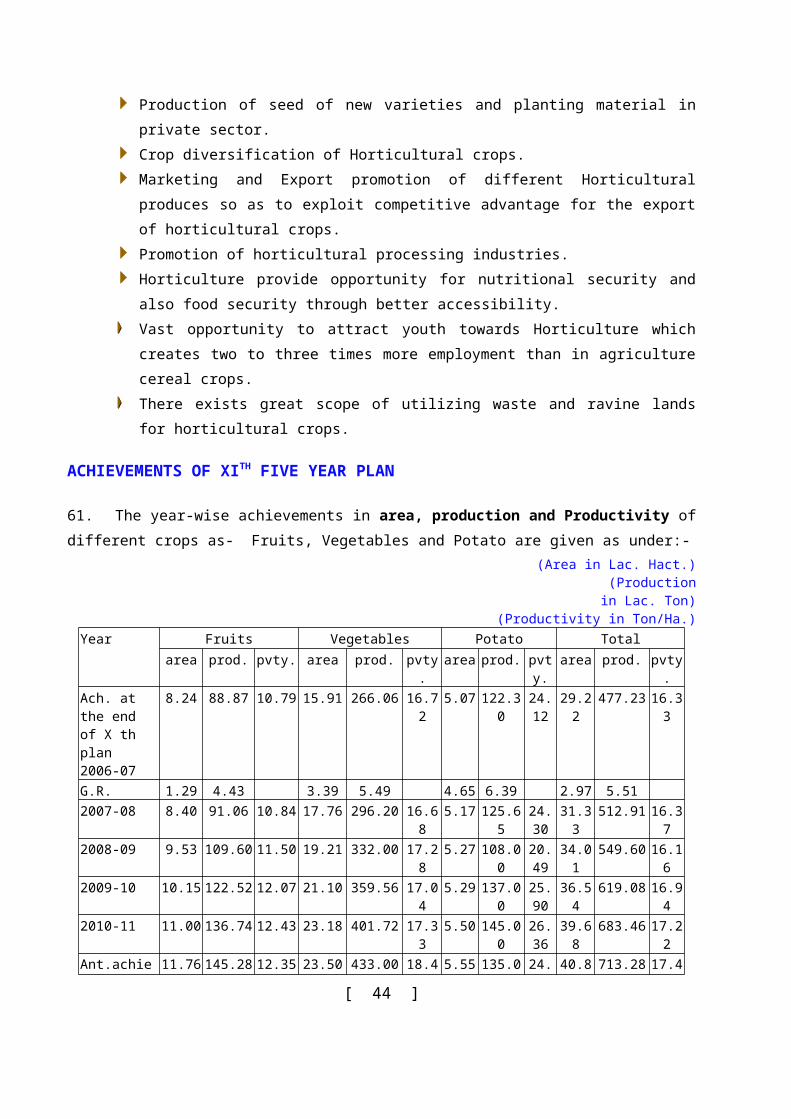
Table 5d reveals that contrary to general opinion, eastern U.P. is getting relatively higher recovery than central and western U.P. except with marginal fluctuation.
Productivity of plant and ratoon crop in different parts of U.P.
100. A deeper analysis of area occupied by plant and ratoon crops and average yield obtained in different part of the state in 11th five year plan will help us in evolving suitable strategies for raising productivity of cane crop in state during 12th five year plan period.
Table-6A Cane area in plant and ratoon crop in diffent parts of U.P.(lakh ha.)
S.N. Year Plant cane area Ratoon cane areaWest Central East West Central East
1 2007-08 3.13 5.51 3.68 4.25 6.77 5.162 2008-09 2.36 3.54 2.00 3.79 5.53 4.183 2009-10 2.46 4.06 2.23 2.82 3.72 2.594 2010-11 2.76 5.27 3.01 2.92 4.43 2.625 2011-12
Table-6B Average yield (Plant & Ratoon) (per ton. ha.) during 11th plan period
S.N. Year Plant cane area Ratoon cane areaWest Central East West Central East
1 2007-08 58.56 55.56 52.86 70.44 54.43 49.762 2008-09 52.56 51.52 45.08 58.96 51.87 44.483 2009-10 61.64 60.36 53.43 69.74 57.44 48.284 2010-11 57.08 57.07 53.64 66.35 54.66 48.895 2011-12
1- Table 6a reveals that some parts of state grow more than one ratoon crop Therefore better ratoon management is very vital for getting higher productivity.
2- Table 6b indicates that eastern U.P. and central U.P. get poor ratoon yield than plant cane while the phenomenon is reverse in case of western U.P. where productivity of ratoon is much higher than plant cane. As a matter of fact the practices of sowing sugar cane after harvesting wheat crop reduces the growth period of the plant cane as far as west U.P. is concerned.
Level of production Technology In 11th plan period
101. Theoretically speaking, where recommended doses of fertilizers is applied, adequate and productive irrigation is provided, quality seed cane is used and plants protection measures are applied when required, the productivity level is bound to increase. However, time of sowing is another important inhibiting factor which increases or otherwise decreases the per hectare yield of the cane crop.
102. Achievement of 11th plan (2007-08 to 2011-12) with regards to distribution of fertilizer, quality seed, and use of plants protection measures is given in table-7.
Table-7 Production of quality seed use of fertilizer and chemical in the 11th planS.N. Programemes Unit Year
2007-08Year
2008-09Year
2009-10Year
2010-11Year
2011-12
[ 44 ]
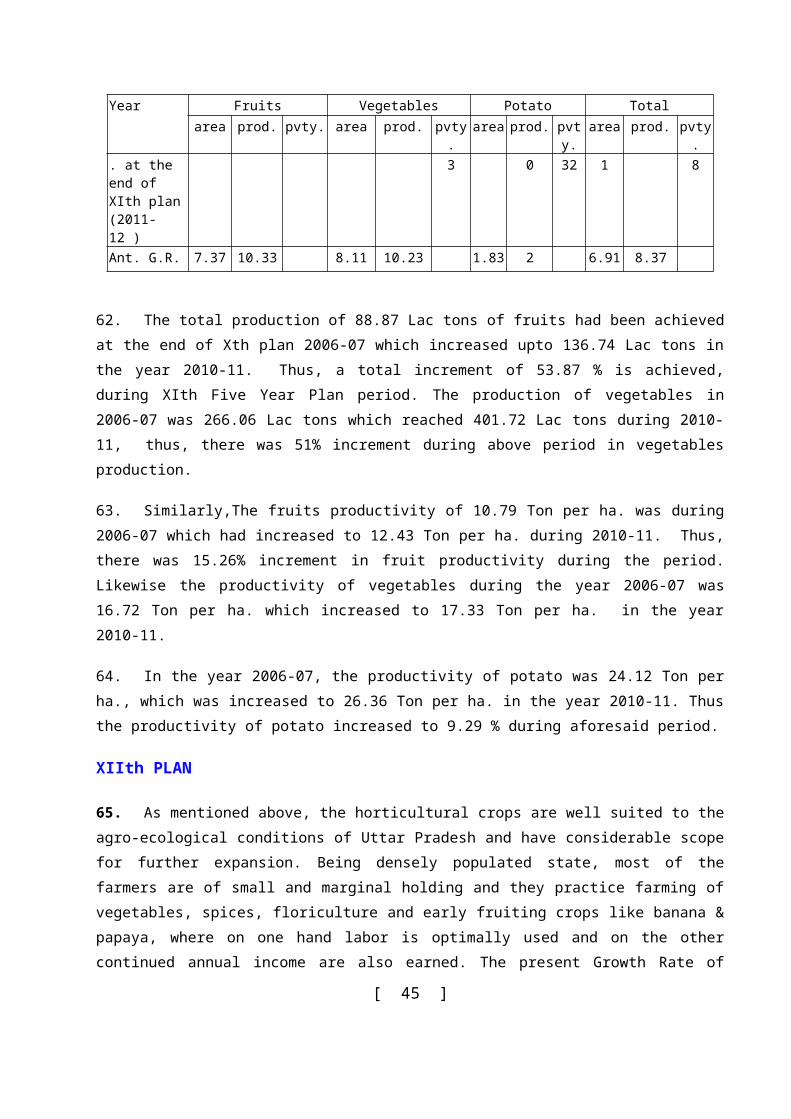
up to Nov.11
1 Laying out of cane seed nurseriesFoundationPrimary
Ha.”
481626347
454628596
435423005
434225416
663769
2 Seed cane Distribution Lac.qtl. 117.30 123.30 180.20 141.91 2.293 Fertilizer distribution
Nitrozon (N)Phosphorus (P)Potash (K)
(1000)MT””
136.4028.896.85
145.8132.048.92
125.4131.168.52
112.0028.1511.10
72.4311.795.04
4 Nitrozon distribution per hectors
KG/Ha. 47.86 68.14 70.14 53.31 -
5 Area to be treated Seed treatmentSoil treatmentUrea spray on ratoon crop
Lac.Ha.””
0.591.711.72
0.481.811.92
0.171.361.87
0.461.501.94
0.040.811.52
103. Table-7 reveals that except in few years, distribution of quality seed, use of fertilizer and use of plant protection chemical were increasing year to year in 11 th plan period. Ratoon management with regards to Urea spray was also on rise. However looking to the magnitude of area occupied by ratoon crop in whole state, urea spray on ratoon crop is very meager.
104. Genetic variability in sugar cane crop varies to a great extent. Sugar cane research stations located in different part of the state grow nucleus seed which is provided to different sugar mills area to raise foundation and primary nursery at farmer’s field to enable them to distribute more quantity of different varieties of cane seeds to the farmers.
105. Table-8 gives detail account of different varieties grown in the state for the two year of the 11 th
plan.Cane area and varietal position in 11th five year plan
Year Cane area (Lac ha.) Percentage Varietal PercentagePlant Ratoon Total Plant Ratoon Total Early Mid late Unsuitable
1 2007-08 12.31 16.19 28.50 43.19 56.81 100 16.60 67.20 16.202 2008-09 7.90 13.50 21.40 36.90 63.10 100 14.90 69.20 15.903 2009-10 8.75 9.13 17.88 48.94 51.06 100 13.30 76.80 9.904 2010-11 11.04 9.97 21.01 52.53 47.47 100 10.60 77.50 11.905 2011-12 10.80 11.71 22.51 48.00 52.00 100 8.90 78.50 12.60
106. From the perusal of the table-8 following inferences are drawn.
Area under total early maturing varieties was 16.60% in year 2007-08 of the total cane area.
Total area under midlate varieties was 78.5% in year 2011-12.
Total area under unsuitable varieties was highest 16.20% in year 2007-08 which has been decreased up to 12.60% in the last year of 11th five year plan.
Vigorous efforts are needed to launch varietals replacement program to minimize the area under unsuitable varieties. Similarly area under early maturing verities has to be increased sufficiently.
[ 45 ]
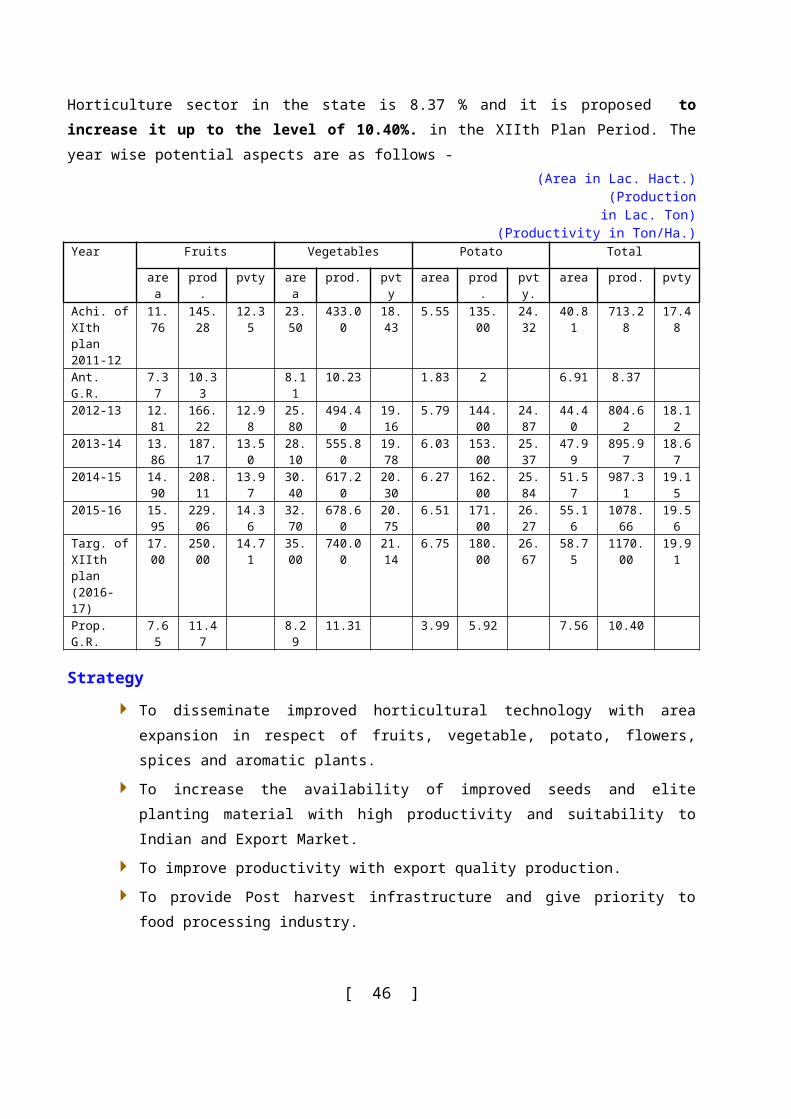
Twelfth Five Year Plan, 2012-17
Scenario
107. In future following issues are likely to occur in sugar cane production technology. Limited availability of per unit area of water for irrigation. Depletion of soil fertility. Increase of prices of fertilizer germicide and pesticide chemical. Price escalation of petroleum products. Limited availability of farm labor. Reduction in cane area due to price increase of other competitive crops. Besides manufacturing of sugar, diversion of cane crop is likely towards other by products like
ethanol etc. Improvement in exiting production Technology of sugar cane.
108. In the changed scenario efforts are to be made to obtain maximum out put per unit of area irrigation water and other inputs. It is expected that there will be increase in cane productivity and sugar cane towards gur and khandsaree will be minimized.
Strategies
To raise the crushing capacity of sugar mills from 7.67 lakh T.C.D. to 8.50 lakh T.C.D.
To make efforts in increasing the productivity of sugar cane instead of allowing the sugar cane area to expand is the target. For that the programs relating to the development of high yielding varieties of sugar cane and modern scientific techniques of sugar cane cultivation would have to be carried out. Arrangement for agricultural inputs for giving effect to increase the sugar cane production will be envisaged. The productivity level is proposed to be raised from almost 60 tons in 2011-12 to 70.00 tons in 2016-17.
Effective implementation of publicity and propaganda work for providing knowledge of modern ad scientific methods of sugar cane cultivation has also been envisaged. The brief of publicity strategies is narrated below.
Making Video film.
Sponsoring spot program through radio station.
Distributing awards to 100 growers in each year getting highest yield in cane crop competition.
Cultural program.
Giving priority to sugar cane research programs to cater the need of total seed required for seed replacement program. It is proposed that 20% plant cane area by improved seeds will be replaced every year. Total plant cane area will be replaced in the five years. To meet the end a rolling plan of nucleus seed required for three year onwards will be prepared.
[ 46 ]
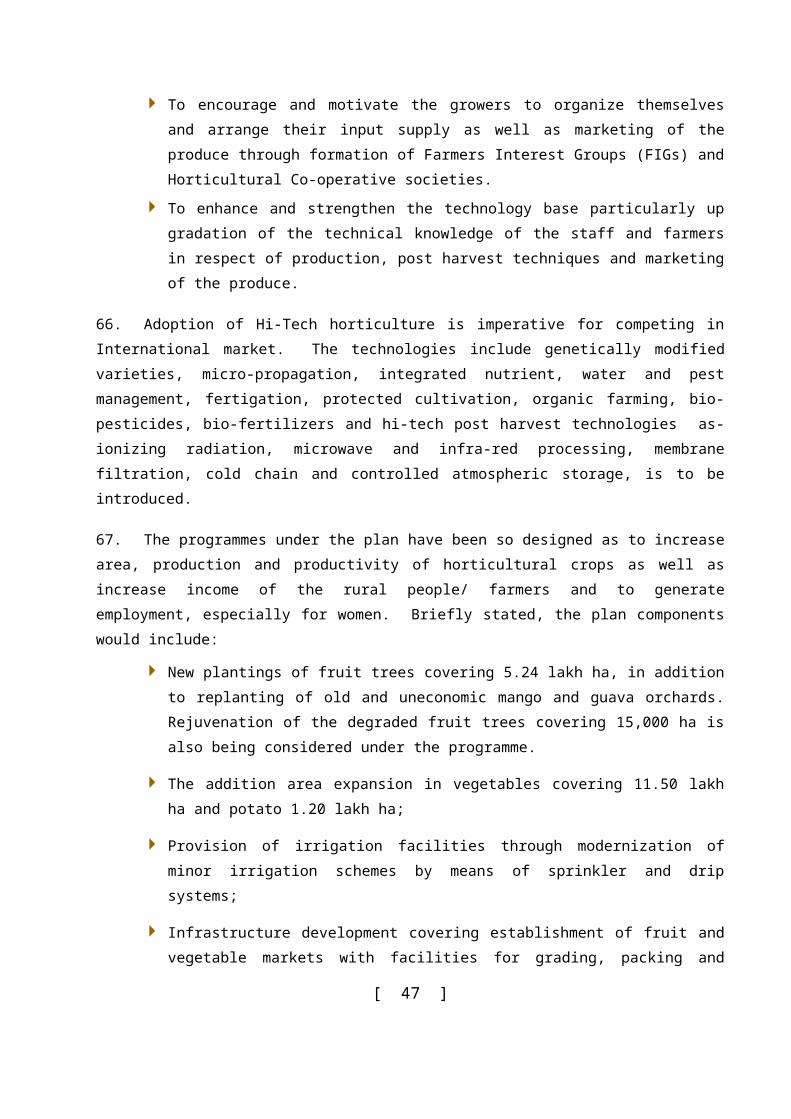
Development of area of such sugar cane varieties which are high yielding and rich in sugar for those sugar factory areas where sugar cane area as per requirement is not available as also to develop the varieties of sugar cane for the different regions according to suitability of soil and climate Development of maturity wise sugar cane verities and conducting of surveys with the help of sugar mills.
For ensuring the participation of sugar mills in the developmental programs and to engage the field staff available with the sugar factories for the development, an action plan for each factory will be prepared and executed. While preparing action plan old and unsuitable varieties will be replaced by early maturing verities so that area under unsuitable varieties is minimized.
In western U.P. sugar cane is commonly sown after harvesting wheat crop. In other part of the state productivity level is hampered because of non availability of productive irrigation. Strategies have been evolved to introduce technique of optimum use of limited water resources.
Reallocation of sugar mill zone areas and providing stability to such reallocated zones will be made. Intensive cane developmental programs will be carried out with the help of sugar mills in there reallocated zones.
Arrangement for drainage for such factory areas where due to excessive rains water logging takes place. Introduction of water logging verities will be made to obtain maximum yield in adverse circumstances.
A sizable chunk of sugar cane is diverted towards gur and khandsari. To minimize its diversion, drawl percentage is proposed to be raised from 55% to 65%, this will enable the growers to get maximum price of the maximum quantity produce.
By strengthening cane union and making them more useful to the grower and also streamlining the activities of cane development council, a sound institutional base will be prepared to impart knowledge along with purchasing physical inputs.
By organizing demonstration plots in the mill area as described below will be laid out.
Mixed farming (Potato, peas, corrigendum, wheat etc.)
Ratoon management.
IPM and IDM.
By distribution of improved agricultural implements suitable strategies will be evolved to save labour.
By introducing integrated pest management including biological method and by introducing integrated nutrient management effort will be made to obtain state average of 70 ton. as envisaged at the terminal year of the plan.
Ratoon management is very much neglected in central eastern U.P. Management of second and third ratoon will get special attention in 12th plan period.
Heat therapy will be popularized amongst the growers to eradicate the menace of grassy shoot and other diseases.
[ 47 ]

Proposed targets
109. The proposal is to keep the target for cane area at lowest possible level i.e. the addition in area be minimum and the cane requirement of the sugar factories be met by increasing the yield per hectare and stepping up the per hectare supplies to the sugar factories. The targets for the terminal year of the plan are proposed as follows.
S.
N.
Particulars Unit Year 2010-11
Year 2011-12
(Anticip.)
Year 2012-13
Terminal year of 12th plan
(2016-17)
1 2 3 4 5 6 7
1 Cane area Lac. Ha. 21.01 22.51 23.00 24.00
2 Average yield Ton/Ha. 56.34 60.00 62.00 70.00
3 Total sugar cane
production
Lac. Ton. 1183.98 1350.60 1426.00 1680.00
4 Drawl% % 54 55 57 65
5 Total cane crushed Lac. Ton. 643.81 742.83 812.82 1092.00
6 No. of sugar factory N0. 125 124 126 128
7 Crushing capacity Lac. Ton. T.C.D.
7.67 7.70 7.80 8.50
8 Sugar recovery % 9.14 9.80 9.90 10.30
9 Total sugar production
Lac. Ton. 58.87 72.80 80.47 112.48
110. Keeping in view the propagation of different kinds of new varieties of sugar cane having higher productivity, the productivity level in western, U.P. is up to the level of 75 M.T./ha. It can be achieved as in this region vast resources are available. As such with the view of developing the modern scientific techniques of cane cultivation, the target of productivity of sugarcane of the state has been proposed to the level of 70.00 M.T./ha. For achieving this target following intervention is proposed to be Introduced during the 12th plan by the means district of sector and state sector.
Foundation nursery
111. The breeder seed is provided from sugar cane research station for foundation seed nursery. The foundation nursery holders/Cane growers aintaining foundation nursery will be provided max. 25 qtl. breeder seed from sugar cane research station. After raising the foundation nursery, about 250 qtl. seed will be available for distribution for raising primary nursery. After seed distributed from foundation nursery, maximum Rs. 12500 will be provided as subsidy to the farmers @ Rs 50/qtl.
112. The detail of the physical and financial requirement of the program is as follows –Year Breeder seed
availability (qtl)Foundation seed produced (qtl)
Rs. of subsidy
Financial requirement (lac
[ 48 ]
(Rs/qtl) Rs)2012-13 20000 200000 50.00 100.002013-14 24000 240000 50.00 120.002014-15 30000 300000 50.00 150.002015-16 32000 320000 50.00 160.002016-17 40000 400000 50.00 200.00
Total 146000 1460000 730.00
Primary seed nursery
113. Seed produces in foundation nursery will be used for raising primary nursery. A Farmer will be provided max. 50 qtl. foundation seed. Thus in primary nursery about 20.00 Lac qtl. seed will be produced for general distribution and Rs. 25/qtl. max. upto Rs. 12500 subsidy per nursery holder will be provided. The detail of the physical and financial requirement of the program is as follows –
Year Primary seed availability (qtl)
Rs. of subsidy (Rs/qtl)
Financial requirement (lac Rs)
2012-13 2000000 25.00 500.00
2013-14 2400000 25.00 600.00
2014-15 3000000 25.00 750.00
2015-16 3200000 25.00 800.00
2016-17 4000000 25.00 1000.00
Total 14600000 3650.00
Soil and seed treatment-
114. Under this programme insecticides, fungicides and germicide are used for controlling soil and seed borne disease, insect and pests. For encouraging germination of cane seed before sowing cane seed are treated with mercurial chemical/compound. At present Rs.1000 per ha. is required for seed and soil treatment subsidy of 50% maximum up to Rs. 500 will be provided. The detail of the physical and financial requirement of the program is as follows –
Year Area to be treated (lac. Ha.)
Rate of subsidy Rs/ha.
Financial requirement in lac Rs
2012-13 1.00 500.00 500.002013-14 2.48 500.00 1240.002014-15 3.00 500.00 1500.002015-16 3.48 500.00 1740.002016-17 4.00 500.00 2000.00
Total 13.96 69800.00
Ratoon management -
115. About 50% area of the sugar cane is covered by ratoon crops. To improve the productivity of cane, proper management of the ratoon crop is very necessary. Improved management of ratoon is also required to augment the sugar recovery. In ratoon management urea plus insecticide is sprayed on ratoon crop. This
[ 49 ]
is very popular agricultural practice in western and central U.P. Farmers generally used pesticide with urea solution. In this scheme 50% cost of pestiside used in urea spray is to being subsidized, max. upto Rs. 150 per ha. The detail of the physical and financial requirement of the program is as follows–
Year Area to be managed (lac. Ha.)
Rate of subsidy Rs/ha.
Financial requirement in lac Rs
2012-13 0.25 150.00 37.502013-14 2.48 150.00 372.002014-15 3.00 150.00 450.002015-16 3.48 150.00 522.002016-17 4.00 150.00 600.00
Total 13.21 1921.50
Transportation and handling of cane seed
116. Nursery seed is to be transported from research stations for raising foundation seed nurseries and from foundation nurseries to primary nurseries. Apart from transportation careful handling, like proper seed set cutting, is also very necessary. Thus Rs. 15 per qtl. for foundation seed and Rs 7.00 per qtl.. for primary seed will be subsidized in this scheme. Ist year (2012-13) about 20000 qtl.. breeder seed will be available and be transported from research station to farmers field. About 2.00 lac qtl.. seed are available in primary nursery all ready produced in on going scheme will be available for distribution. The detail of the physical and financial requirement of the program is as follows –
For breeder seedYear Seed availability (qtl.) Rate of subsidy per
qtl. RsFinancial requirement in lac
Rs2012-13 20000 15.00 3.002013-14 24000 15.00 3.602014-15 30000 15.00 4.502015-16 32000 15.00 4.802016-17 40000 15.00 6.00
Total 146000 21.90
117. The detail of the physical and financial requirement of the program is following –
For foundation seedYear Seed availability (qtl.) Rate of subsidy per
qtl. RsFinancial requirement in lac
Rs2012-13 150000 7.00 10.502013-14 240000 7.00 18.002014-15 300000 7.00 22.502015-16 320000 7.00 24.002016-17 400000 7.00 30.00
Total 1410000 105.00
Use of bio fertilizers/vermi compost
118. Bio fertilizers/vermin compost is a eco friendly and balance fertilizers which give all nutritional element to the crop. Importance of bio fertilizers and vermi composting need no emphasis. About Rs 1250
[ 50 ]
is the cost of bio fertilizers/vermin compost per ha. Thus 50% subsidy upto Rs 600 per ha.. is proposed. The detail of the physical and financial requirement is as follows –
Year Area to be managed (lac. la.)
Rate of subsidy Rs/ha.
Financial requirement in lac Rs
2012-13 0.50 600.00 300.00
2013-14 0.62 600.00 372.00
2014-15 0.75 600.00 450.00
2015-16 0.87 600.00 522.00
2016-17 1.00 600.00 600.00
Total 3.74 2244.00
Animal Husbandry
119. Uttar Pradesh is a vast State with huge livestock population. As per 18th Livestock Census- 2007, there are 190.97 lac cattle, 264.40 lac buffaloes, 14.00 lac sheep, 148.29 lac goats, 19.86 lac pigs and 178.79 lac of poultry in the State. With this huge livestock wealth, Uttar Pradesh is the largest producer of milk in the country with the production of 221.59 lac MT annually in year 2011-12 with the growth rate of 5.53%. Uttar Pradesh is one of the largest meat producing State and share more than 60% of country's meat export. State produces 1139.222 million eggs and 15.63 lac kg. of wool annually.
120. This huge livestock population is distributed in 9 agro-climatic zones varied from semi arid Bundelkhand region to eastern tarai areas. State harbors famous indigenous cattle breeds like Hariyana, Sahiwal, Gangatiri; buffalo breeds like Murrah, Bhadawari and famous goat breeds like Jamunapari and Berbari. In comparison to 2003; in 2007 there is an increment of 3% in cattle, 15.38% in buffaloes and approximately 12% in goats population. There is decline in sheep population due to shrinkage of pasturage and shifting in occupation.
121. Livestock rearing in the State is mainly subsidiary to Agriculture Sector and commonly practiced by resource poor farmers on traditional subsistence pattern. As per the distribution of livestock in the State, approximately 80% of the livestock is reared by small, marginal farmers and landless labourers.
Production and Productivity
122. Uttar Pradesh stands 1st in milk production with the total production 221.59 lac MT annually in 2011-12. As per milk use pattern in the State, 52% of milk is sold as fluid milk, 21.19% as milk products and 26.76% milk is used in household. It is clear that approximately 105 lac MT of milk is sold as fluid milk in which by and large only 5% milk is processed and marketed by organized sector like co-operatives while rest is marketed by local vendors.
[ 51 ]
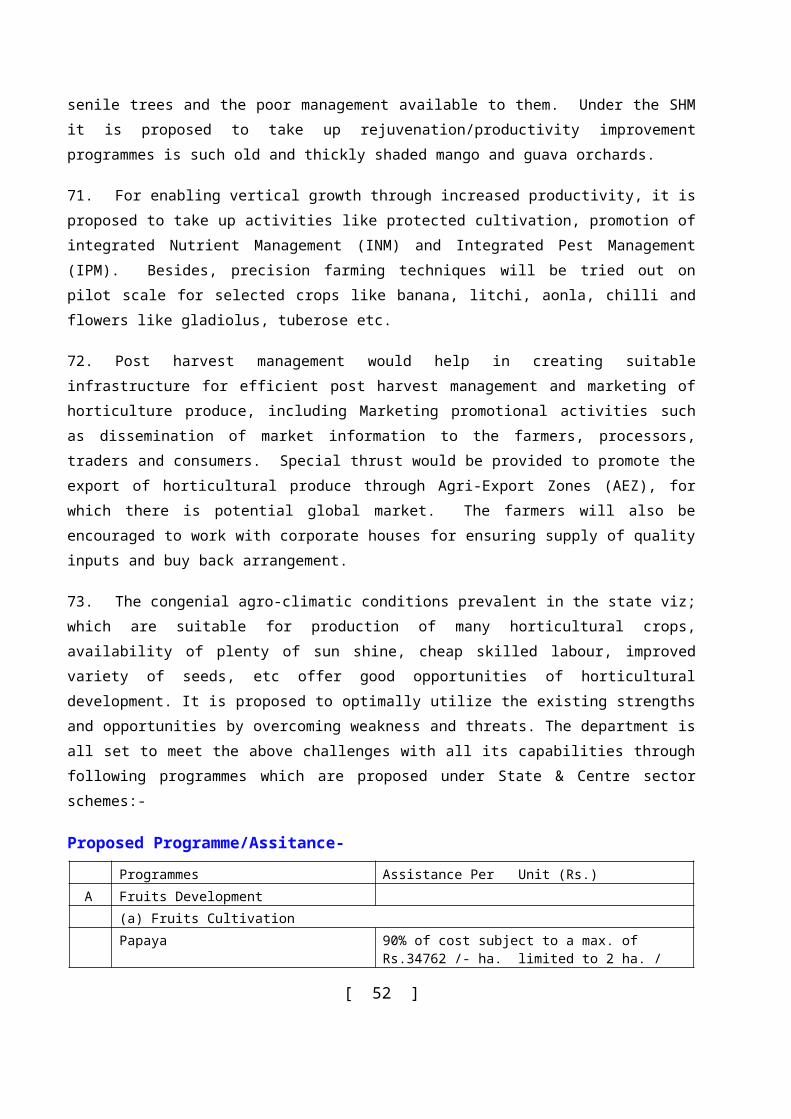
123. State has enormous potential of milk production. The productivity of livestock in the State is low with the average production of 3.00 kg per cow per day and 4.43 kg per buffalo per day. The low productivity is mainly because of poor resources like less coverage of improved breeding, scarcity of feed and fodder; and lack of high production management techniques. The huge livestock population of the State is a boon while its un-organized structure, 1-2 animals average family holding distributed in 10 million villages is a challenge. Therefore, efforts are needed to enhance productivity by massive infrastructural, technical and financial inputs and development of entrepreneurship in dairy, poultry and small animal sector like goat and pig rearing.
124. A part from milk; Uttar Pradesh is one of the largest meat producing State with the contribution of more than 60% in meat export of the country. There are 15 modern integrated abattoirs in the State and 35 meat processing units. There are 317 local bodies registered slaughter houses which produce meat for local consumption. Buffalos, sheep, goats and pigs are the major meat producing animals. However, local bodies' slaughter houses are in poor condition, without proper infrastructure, with lack of hygienic pattern and zoo-sanitary measures. Though, the State is the largest producer and exporter of meat, yet uncontrolled slaughter is posing a serious threat to the livestock population. Therefore, strategic approach is needed in this sector with the emphasis on modernization of slaughter houses on one hand and intensive approach on production of quality meat type livestock on the other.
125. State is endowed with good small animals' population including sheep, goats and pigs. Sheep are reared for wool purposes-mainly carpet wool. There is continuous decline in sheep population due to shrinkage of pasturage, competition with food grain production, shifting of occupation and lack of marketing facilities. Earlier, coarse wool was mainly used in carpet industries of Bhadohi, Varanasi and Mirzapur. Presently, the carpet industry is shrinking due to lack of labour, market and low credit availability. Revival of carpet industry with modern technological inputs can be a boon for development of this sector.
126. There is vast potential in goat sector both as livelihood based small goat units and larger goat units as goat entrepreneurship. Consumption of goat meat is increasing day by day with good returns to goat farmers. Fast kidding in goats, high food conversion, low input and high prolificacy of goats are the major advantage of goat husbandry.
127. In the State, piggery is un-organized and basically practiced on traditional pattern. Lack of marketing facilities including pork processing is the major reason of low growth in this sector.
128. There is a vast potential of poultry development in the State. Approximately, 1 crore eggs daily and 9 crores of broiler chicks annually are imported from other States. Though, back yard poultry is expanding in the State, commercial poultry development is yet to take pace due to un-availability of large scale production units.
129. In the fodder sector, there is deficiency of 31.91% of green fodder, 7.20% of dry fodder and 48.68% of concentrates. Though, the area under fodder coverage is 8 lac hectares per annum, yet it is
[ 52 ]
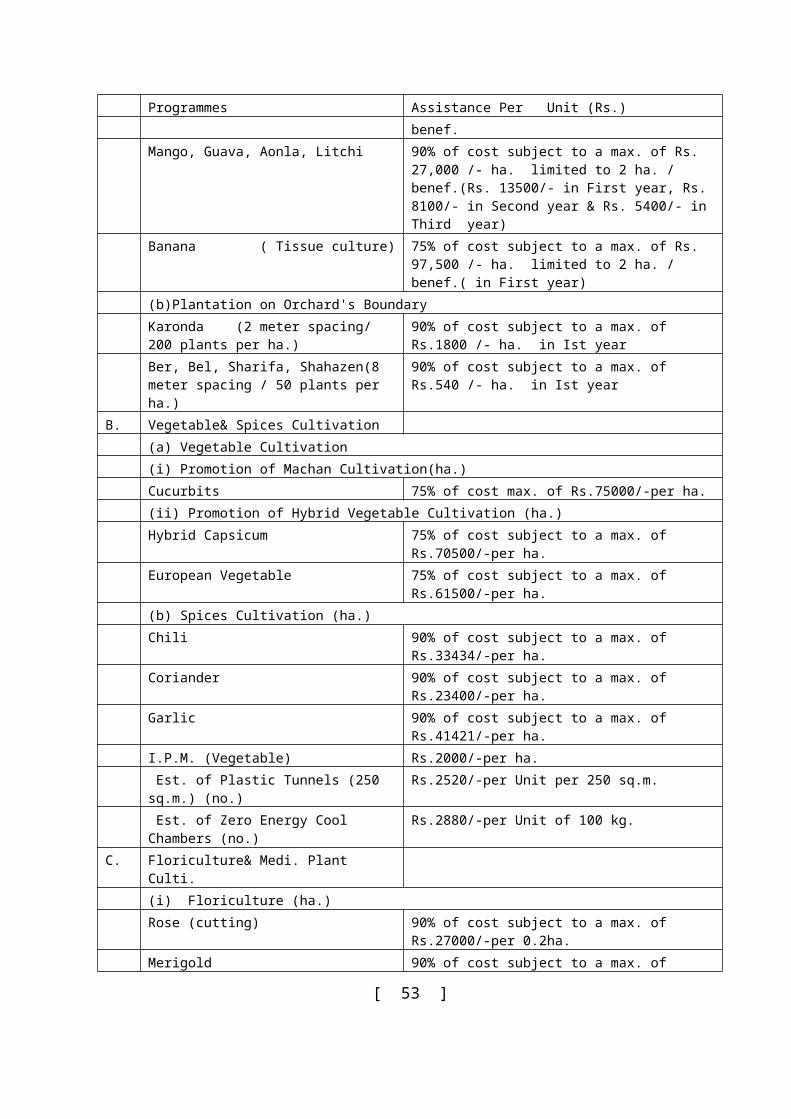
difficult to enhance fodder coverage due to competition with food grain production. Therefore, non-conventional feed and fodder sector needs to be strengthened.
130. Department of Animal Husbandry provides services to the farmers in the areas of improved breeding through Artificial Insemination, wide spread vaccination and treatment as well as availability of quality fodder seeds. These services are provided through veterinary hospitals, A.I. centers, livestock extension centers and dispensaries. The institutional and manpower infrastructures are distributed at district level, regional level and state level.
ACHIEVEMENTS DURING 11TH PLAN ( 2007-12)
131. During the XI plan, the State Animal Husbandry Department has made consistent efforts to improve the different livestock species and their productivity and production. The total production levels of milk, eggs and wool at the end of the XI Plan has reached to 221.95 Lac M. Tons, 1139.223 million and 15.63 lac kg. respectively.
Achievement During 11th Plan : Productionitem unit Achievement in 11th Plan
2007-08 2008-09 2009-10 2010-11 2011-12Achieve-
mentAchieve-
mentAchieve-
mentTarget Achieve-
mentTarget Achieve-
ment2 3 4 5 6 7 8 9 10
Milk Lac MT 188.593 195.370 202.03 267.75 210.33 225.06 221.59Eggs Million
Nos.981.48 1014.14 1059.60 1190.51 1102.12 1291.94 1139.223
Wool Lac kg. 14.81 15.033 15.23 23.29 15.39 23.76 15.63
Achievement During 11th Plan : ServicesProgramme Achievement. 11th Plan
Achie. 2007-08
Achie.2008-09
2009-10Target Achie.
2010-11 Target Achie.
2011-12 Target Achie.
Vaccination ( in lac)
382.79 386.41 686.88 472.94 762.72 608.09 866.26 552.535
Artificial Insem (in lac)
25.82 30.13 43.14 37.10 49.62 43.42 60.00 54.332
Castration(in lac) 7.82 8.28 10.36 9.22 11.40 10.80 12.11 11.989Treatment (in lac) 203.41 219.86 233.71 234.46 243.31 250.33 299.25 281.61Formation S.J.R.Y. Groups (in nos.)
5478 6300 6300 6300 6000 7309 6000 7854
Production of main livestock product
132. Uttar Pradesh is the largest milk producing State in the country for last many years with the contribution of approximately 1/5th of the total production of the country. Buffalo contributes significantly in total milk production of the State with the approximate contribution of 70%.
Category/Animal Total Milk Production in lac M.T.
2011-12 (Tentative)
Average Milk Prod per day per animal (in Kg.)
[ 53 ]
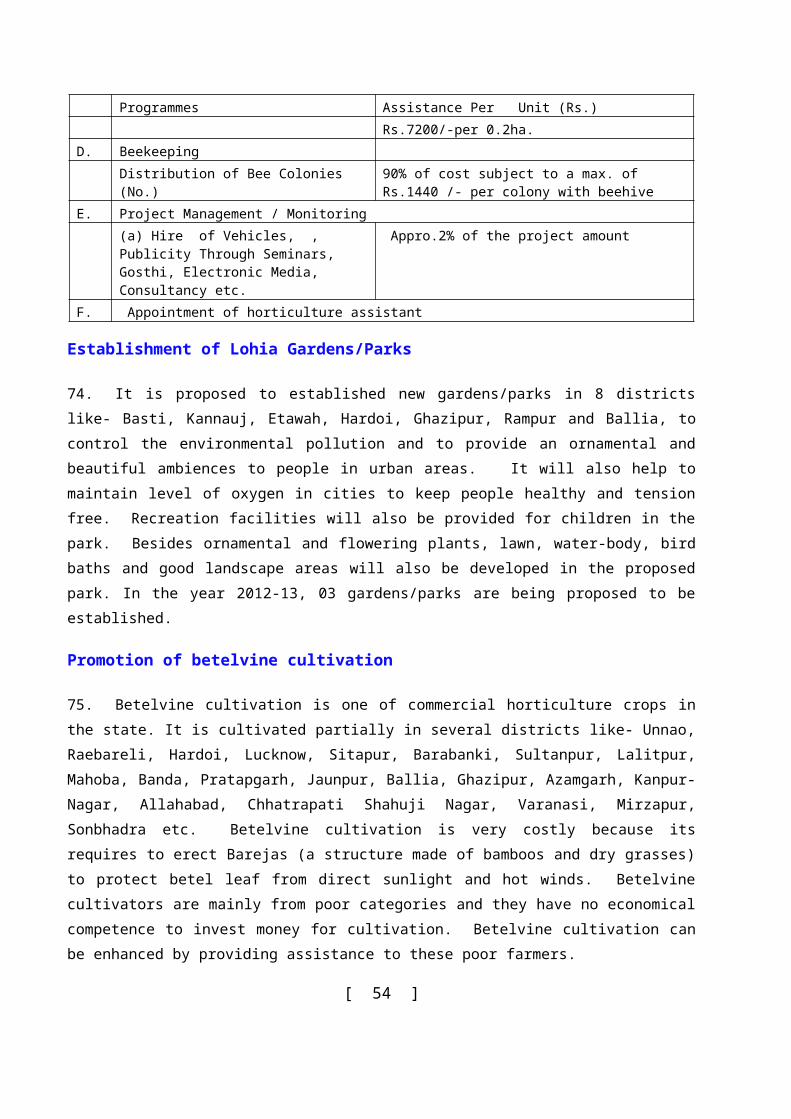
Buffalo 153.68 4.427Cow 56.08 3.155Goat 11.83 0.748Total 221.59
133. Per capita per day availability of milk in U.P. is 303 grams while the National average is 245 grams per day against the minimum requirement of 280grams per day per capita as recommended by ICMR.
134. State plays a vital role in meat production sector in the country. Uttar Pradesh is the largest exporter of processed frozen meat with the export of approximately more than Rs.700 crores annually. Buffalo meat is the main source of meat production and export and upto some extent sheep meat and goat meat also contribute in export average 121.280 kg. meat is produced from one buffalo. Meat production status of U.P. is as under-
Category/Animal Average Meat production (in kg)
Total Meat production (in lac kg) year 2009-10
Buffalo 121.280 1332.114Goat 16.124 343.796Sheep 16.649 56.387
Pig 43.184 147.886Total 1880.183
Breeding Services:
135. There are 5043 A.I. Centers in the State which cater quality Breeding Services to the farmers. Breeding of Non-descript low productive Desi Cows is undertaken through high producing exotic breeds like Holstein Friesian and Jersey Bulls. An elaborate breeding policy is in vogue since year 2002 in the State with the main emphasis on breeding with H.F. Bulls. However, in under developed areas and on small Cow breeds breeding is preferred with Jersey Bulls. Exotic inheritance shall be limited up to the 50% of cross bred level. Simultaneously the emphasis is also given to the breeding of draft purpose breeds and also for the conservation and propagation of indigenous breeds. Breeding in buffaloes is undertaken by the improved native breeds like Murrah and Bhadawari.
136. For catering quality breeding services at the farmers door steps self employed paravets are working in the State. Simultaneously for streamlining breeding inputs supply the State Livestock Development Board is functional. Under improved breeding coverage, Artificial Insemination is conducted through A.I. Centers, LEO Centres, paravets and NGOs along with infertility management through infertility camps.
137. State has three deep frozen semen stations situated at Chakganjaria, Lucknow and Babugarh, Ghaziabad and Majra kheri which produce quality semen straws and maintain quality bulls. For ensuring natural breeding, quality bulls are distributed in the field. Improved breeding services are ensured by Uttar Pradesh Livestock Development Board (UPLDB) established under NPCBB, Govt. of India.
Disease Control
[ 54 ]
138. Disease Control and Animal Health Management services are catered by 2200 Veterinary Hospitals, 2575 Stockman Centers and 268 D Class Dispensaries. Apart from this other supporting diagnostic infrastructure and one biological product institute is also functional in the State.
139. Treatment, Vaccination and other disease control activities are undertaken by Veterinary Hospitals and centers at the village level in districts. Vaccination against deadly livestock diseases viz H.S., B.Q., Foot and mouth disease, PPR, RD,FP etc. is undertaken by the department. Under GOI assisted FMD-CP programme approx. 1.5 crore animals of 17 districts of western Uttar Pradesh are vaccinated within a specified period of time. Under ASCAD vaccination campaign has taken up in 35 districts of U.P. with the extensive coverage of Foot and Mouth disease control programme and PPR eradication programme in 18 districts of the state.
140. For tackling the emerging extensive problem of infertility in livestock, infertility control programme has already been under taken in the state with the organization of 12000 infertility control camps in all the 72 districts of the state. There is one Biological Product Institute in department situated at Lucknow which produces 12 types of vaccines. There are 11 Disease Diagnostic labs, 10 Rabies control units and 9 sterility units for disease diagnosis and surveillance. CADRAD, IVRI Bareilly act as referral labs for the state.
Feed & Fodder development
141. State has a shortage of green fodder, dry fodder and compounded feed to the extent of 31.91%, 7.20% and 48.68% respectively. The livestock mainly depend on green & dry fodder. The area under fodder cultivation is limited to about 8.78 lac hect. and it is not easy to increase the area under fodder since an indirect competition exist between fodder production and cereal production for human consumption. The agricultural crop residues mostly are being utilized for animal feeding.
142. Presently the fodder development programme in the state is limited up to the supply of quality fodder seeds mini-kits, improvement of celluloses waste as fodder and development of silvi-pasture in the state.
143. Fodder seed mini kits are provided by Govt. of India seasonally and distributed to the farmers. Apart from above, Govt. Livestock Farms also produce fodder seeds for distribution to the farmers.
144. Programmes for establishment of fodder banks and fodder block making units have been taken in Bundelkhand Region for ensuring fodder availability in the region during scarcity. Programme of nutritional supplementation is proposed to be taken through out the State.
Poultry Production
[ 55 ]
145. In poultry sector, large & medium sizes of layer and broiler farm are owned mostly in private sector in the State. Near about 1139.22 million eggs are produced annually in the state. In the State, poultry sector is unorganized. No facility/plant is available for processing the poultry produce in the state. Although state have so many big and small broiler hatcheries and layer hatcheries but all are unorganized. State produce are not able to fulfill the demand of egg & chicken meat in the state. So the eggs are imported from other states, like Andhra Pradesh, Hariyana & Punjab. Govt. is running 5 poultry hatchery cum production farm, out of which 2 are having both broiler & layer hatcheries but with a little capacity.
146. Poultry includes fowl, ducks and other domestic birds. Total numbers of poultry in state of UP is 178.79 lac.In spite of large potential, state procures 1 crore eggs daily and 900 lac broiler chicks annually from the other States.
147. For intensifying Poultry Production in the state support in infrastructure buildup, establishment of price support for eggs, promotion of maize cultivation, increase in both area under cultivation and productivity per heqt. and effective disease surveillance system and vaccination support is being developed.
148. In rural area poultry production need birds with a low input and high producing poultry strain. Low input high producing gene strain have been developed at central poultry breeding farm which is to be popularized multiplied & introduced at large scale in rural poultry back yard unit. Marketing structure shall be developed in cooperative sector. Establishment of backyard poultry units through Govt. of India support and under RKVY is being taken on large scale. Apart from backyard poultry, programmes are being taken for development of entrepreneurship in this sector through the schemes of capital assistance to the poultry farmers upto the extent of 30% under RKVY.
Employment Generation
149. To provide self employment and services of Artificial Insemination, vaccination and castration 836 Paravets have been trained through Uttar Pradesh Livestock Development Board and 2358 Paravets have been trained through Uttar Pradesh Diversified Agriculture Support Program. They have been deployed in their own villages and rendering the services of AI timely to the livestock owners at their doorstep. On one hand this has increased the interest of the farmers in animal husbandry and made provision of self-employment to the rural unemployed youths. In the year 2007-08 213 Paravets in 2008-09 1734 Paravets, in 2009-10 963 Paravets, in 2010-11 806 and in 2011-12 446 Paravets, were trained and deployed. These paravets are rendering service of vaccination, castration and fodder development under the supervision of qualified veterinarians of the area.
Twelfth Five Year Plan, 2012-17
[ 56 ]
150. Better and improved animal health care and veterinary services helps in control of livestock diseases, epidemic control as well as improvement in public health through quality assurance of animal origin food and control of zoonotic diseases. Animal health care facilities can only be improved with establishment of more veterinary hospitals, diagnostic centers in every district, proper surveillance and monitoring of livestock diseases and control and containment of diseases of public health importance. The important programmes are as follows-
Assistance To States For Control Of Animal Diseases (Ascad)
151. It is a Centrally Sponsored Scheme being run with 75% assistance of GOI. The major component of scheme is the immunization campaign against Foot & Mouth Disease, H.S. and PPR. PPR immunization campaign is being targeted with the objectives of eradication of dreaded disease of sheep and goat. The PPR vaccination campaign shall continue in the State in year 2012-13. Also 100% vaccination of livestock against Foot & Mouth Diseases shall be taken the State. Under the Scheme all the districts of states shall be covered under H.S. Vaccination campaign. The other components of scheme are organization of awareness campaigns, training programmes for veterinarians and para-veterinarians as well as bird flue control programme.
Rinderpest Eradication Programme
152. The country is free from rinderpest. In spite of freedom from disease, the routine surveillance programme continues which includes village searches and stock route searches and maintenance of vaccine bank. This is an old scheme with 100% central assistance. In the year 2012-13, for ensuring the disease freedom status, continuous vigil has to be maintained as per the mandate and guidelines of Govt. of India.
Foot & Mouth Disease Control Programme
153. This is a continued scheme with 100% central assistance and being run in 17 districts of western Uttar Pradesh viz. Saharanpur, Mujaffarnagar, Bagpat, Meerut, Ghaziabad, Gautambudh Nagar, Bulandshahar, Aligarh, Hathras, Mathura, Agra, Firozabad, Etah, Kashiram Nagar, Badaun, Moradabad and J.P. Nagar with following objectives-
To maintain livestock health through intensive vaccination (up to 100%) in order to prevent the occurrence of F.M.D., this will reduce the economic losses of milk production and reproductive failures.
To ensure production of quality and safe livestock products.
To promote entrepreneurship in Export of meat and meat products.
To create general awareness of the disease ensuring participation in disease reporting system.
To study the impact of vaccination, assessment of field immunity and endemic pattern of such diseases.
[ 57 ]
154. There has been a good result because no FMD incidence has been reported in the area. The health status has improved resulting in the marked increase in livestock productivity in the said districts. In the year 2011-12, 11th round campaign has been completed.
Cattle & Buffalo Development
155. The State has only 30% breeding coverage of the cattle and buffalo population through all sources. Although The State has 5043 A.I. centers, 3 Deep Frozen Semen Production Centers for catering to improved breeding services, yet this infrastructure is not enough for the larger breedable population (189.77 lac) of the State. It is proposed to increase the present breeding coverage upto 40% to achieve the goal-
Disease prophylaxis and better health management with wide parasitic control programme.
In remote areas, quality bulls shall be made available for natural service.
Mobile facilities shall be created at every A.I. Center for delivery of A.I services at Farmer working place.
Integrated efforts for infertility control and management to bring infertile animal (30% of 189 lac breedable cow and buffalo) into milk production.
Formation of breeder association shall be encouraged.
Livestock Insurance shall be taken up in the whole of the State.
Sheep, Goat and Pig Development
Expansion of scheme of Goat rearing on the line of NMPS with Goat
Cluster and assistance of establishment of large Goat units also.
Launching of deworming campaign twice annually covering all Sheep & Goat.
Zone Wise approach for Sheep Development with specific programme for Mirzapur, Allahabad, Jhansi and Varanasi region.
Modernization of Pig Husbandry by ensuring financial assistance to small farmers for healthy Pig Production & propagation of concept of co-operative Pig Farming - discouraging sporadic stray Pig rearing .
Integrated Pig Development through Public/Co-operative/Breeder's Society/ N.G.O.
156. The traditional pig raisers rear them in conventional ways, but introduction of Middle White/Large White Yorkshire breeds make them aware of their qualities and now are more innovative to cross their native stock to grade them up. There prolific nature has attracted other classes of people to raise them on scientific lines even in urban/semi-urban areas. To assist the pig breeders a scheme has been started to organize them un the form of societies for their proper observance, training and planned aid. It has been targeted to establish around 500 such societies, each with 10 members during 2011-12. The society
[ 58 ]
members are being given adequate training and are being assisted for their financial requirements. In turn, all societies will join and work as autonomous units.
Fodder Development
Increasing availability of quality fodder seeds through Govt. Farms with Farmers participation in foundation fodder seed production.
Developments of Silvi- pasture on barren land/waste land. Crop border fodder tree plantation will be popularized.
Assistance to Farmer for more fodder production with financial and input assistance Zone Wise.
Establishment of fodder Bank in the fodder scarcity area. For quality control of feed and concentrate feed, Feed and Fodder Regulation Act shall be enacted and enforced.
157. It is essential that proper fodder and feed be available to the lactating animal to improve milk production. At present out state is deficit in the following: green fodder 31.91% dry fodder 7.20% and grains 48.68% and provision to improve the situation will have an impact to increase milk production.
158. To increase the production of green fodder there have been schemes to increase the cultivated area, induction of better quality seeds etc. if we can reduce the gap between demand and supply of green fodder by 31.91% we will be able to increase the milk production by 6.165 lac metric tonne annually. Under RKVY fodder seed production program has been taken up to reduce the present gap.
159. The state livestock farms are being strengthened to increase production of fodder seed. Under this it is proposed to implement production of 17000 Quintal of foundation seed which is turn by the assistance of the farmers will produce and distribute the certificate seeds. It is expected that the state be provided with 2.00 lac improved seeds mini kits form the center.
160. It is again essential that fodder treatment with urea to provide more nutritious fodder programme be re initiated. To make availability of fodder in each area of the state it is proposed that Compressed fodder blocks be prepared with the assistance of the Government of India
Backyard Poultry Development Programme
161. This scheme is for poor men and women of SC/ST category only and is funded by Samaj Kalyan Vibhag. For the year 2012-13 the target set is the establishment of 625 units per district (total 44375). In this scheme one beneficiary will get 50 chicks of low input technology, 50 kg. poultry feed, Rs. 500/- for housing (Darba), Rs. 200/- for medicine. Provision for transportation and training of the beneficiary has also been made. The cost of one units is Rs. 3000/-. With this scheme the state will get nearly 9,98,43,750 eggs and 1497656 kg. of poultry meat with employment to 44375 individual per year.
[ 59 ]
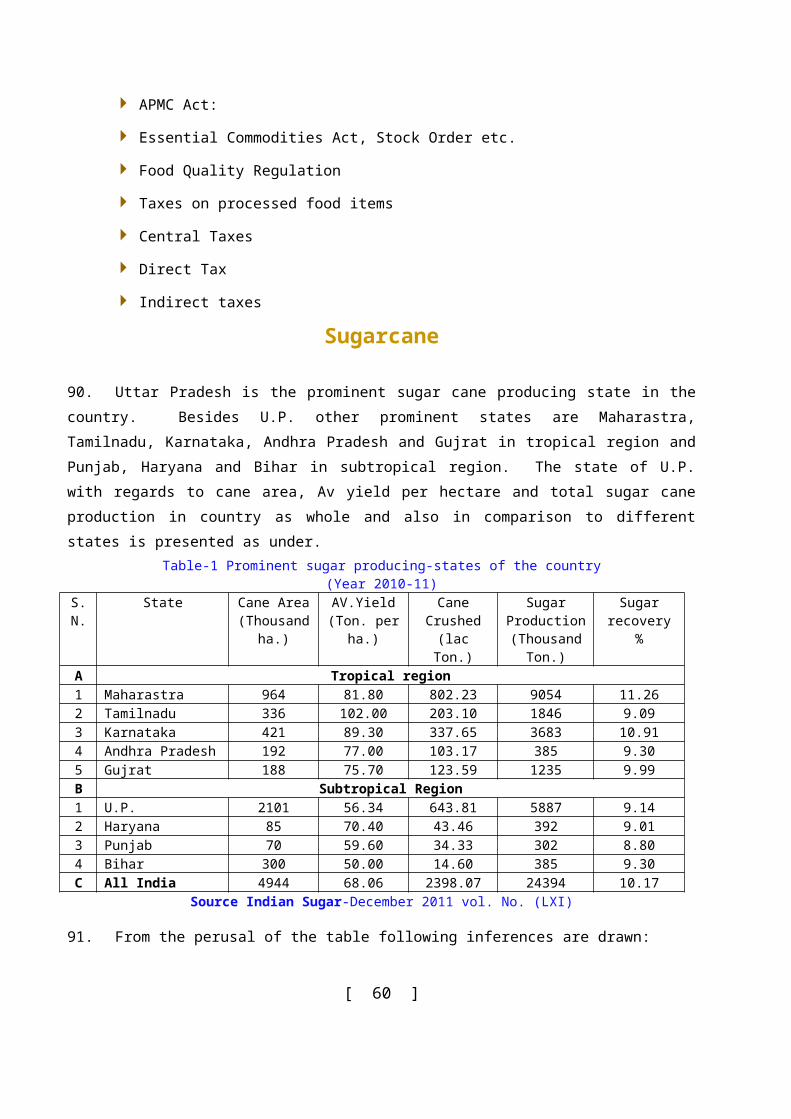
Rural Backyard Poultry Development Programme
162. This is a 100% centrally sponsored scheme for poor men and women of BPL category. In this scheme mother units are established with the objective of rearing day old low input technology chicks upto 28 days and distributing them among beneficiaries through Chief Veterinary Officers of the district in 3 installments of 4 months interval (45 chicks per beneficiary are given in installment of 20:15:10). One beneficiary get Rs.750/- for housing (Darba) and equipment of feeding and watering of chicks. The mother unit owner gets 20% subsidy of Rs. 1.00 lac for construction of poultry house required for rearing chicks upto 28 days and rearing cost of the chicks @ Rs. 30/- per chick. There is also a provision of interest free loan of Rs. 36000/- per mother unit by NABARD provided the mother unit owner has taken loan from the bank. For the year 2012-13 the demand for the establishment of 34 mother units (remainder of year 2011-12) for 10200 beneficiaries has been submitted with the objective of distributing 459000 chicks of 28 days age. For 12th five year plan the demand for the establishment of 150 mother units to benefit 45000 beneficiaries has been submitted.
NEW INITIATIVES
Comprehensive programme for intensive livestock development in selected input supply, fodder production and better livestock management and marketing linkage as a holistic approach.
Increasing approach to farmers by enhancing mobility of services.
Intensive Poultry development by enhancing entrepreneurship through input assistance.
To enhance fodder production through farmer participation and inter departmental cooperation between agriculture, irrigation, forest, panchaytiraj and dairy development department.
Extensive Training and Awareness Programmes & strength of present training center as center of excellence of professional and para-veterinary services.
Strengthening an modernization of livestock farms. Est. of bull mother centers.
Promotion of Breeders Farmers for producing quality livestock.
Establishment of Jan Suvidha Nivaran Kendra
Breeder Farmer Yojna
163. In our state for the establishment of Dairy unit. The farmers are dependant to purchase quality livestock availability from Panjab & Hariyana. In the state govt. farmers Shahiwal, Haryana, Tharparkar cattles and Murrah and Bhadawari buffalo are available in limited numbers.
164. That's why the department has proposed 20 breedable cow/buffalo dairy unit for the same. In the first phase 35 district has been selected and each district establishment of 5 breeder farms. The state will assist the 50% cost of the 20 breedable animals. First year in the establishment 175 breeder farmer unit by which 3500 high quality male/female calf will be available.
[ 60 ]
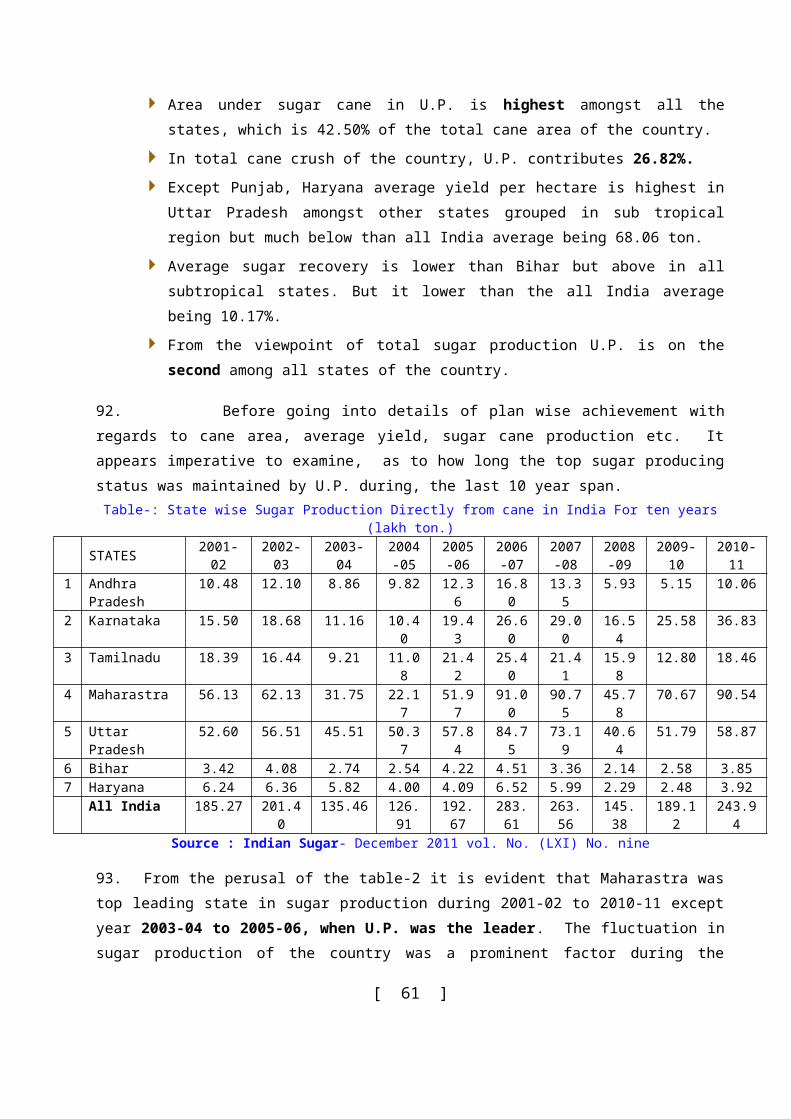
Entrepreneurship in Goat Development
165. Goats are reared mostly for meat purpose. There are 148.29 lakh goats in the State. Goats are also reared for milk. Goat milk contributes nearly 6.34% of total milk production and is confined to specific region of the state. This milk is often for home consumption and do not enter the trade in large quantity. Considerable bias against sheep & goat exist as they are perceived as detrimental to eco-system. But studies on impact of sheep and goat on ecology indicate that sheep & goat do not pose any serious treat to eco-system. Sheep and goat rearing is having a great social and economic relevance in poverty alleviation of socio-economically weaker sections of the society.
166. Making goat industry as a business, goat units of 100 goats each shall be established in each of the districts with the financial assistance as in National Mission for Protein Security (NMPS) under RKVY.
Entrepreneurship in Poultry Development
167. In poultry sector, large & medium sizes of layer and broiler farm are owned mostly in private sector in the State. Near about 11000 lakh eggs are produced per year in the state. In the State, poultry sector is unorganized. No facility/plant is available for processing the poultry produces in the state. One crore eggs are procured from other states daily and 972 lakh poultry chicks are procured annually from other states.
168. Poultry includes fowl, ducks and other domestic birds. Total numbers of poultry in state of UP is 178.00 lakh. The State has enormous potential for poultry production and development of poultry as business venture. Multidimensional approach is needed for the development of poultry sector as Backyard Poultry for nutritional and livelihood security and Commercial Poultry as business venture. Programmes for establishing broiler units under RKVY shall be taken up on larger scale as assistance based scheme. For development of commercial poultry, extensive programme for providing capital assistance upto 30% for establishment of commercial poultry venture above 5000 birds shall be taken up in large scale.
Dairy Development
169. India with an estimated Milk production of 108.5 million MT during the year 2008-09 with about 283.1(2003) million bovine population, India seems to have the largest cattle population in the world. The Dairy sector in our country contributes major share in the agricultural GDP. Country per capita availability of milk has been 273 grams / person /day in feb2012.
Macro Impact The annual value of country’s milk production is estimated to about Rs. 1,430 billion in 2008-
09. Dairy cooperatives generate employment opportunities for around 13.9 million farm families.
[ 61 ]
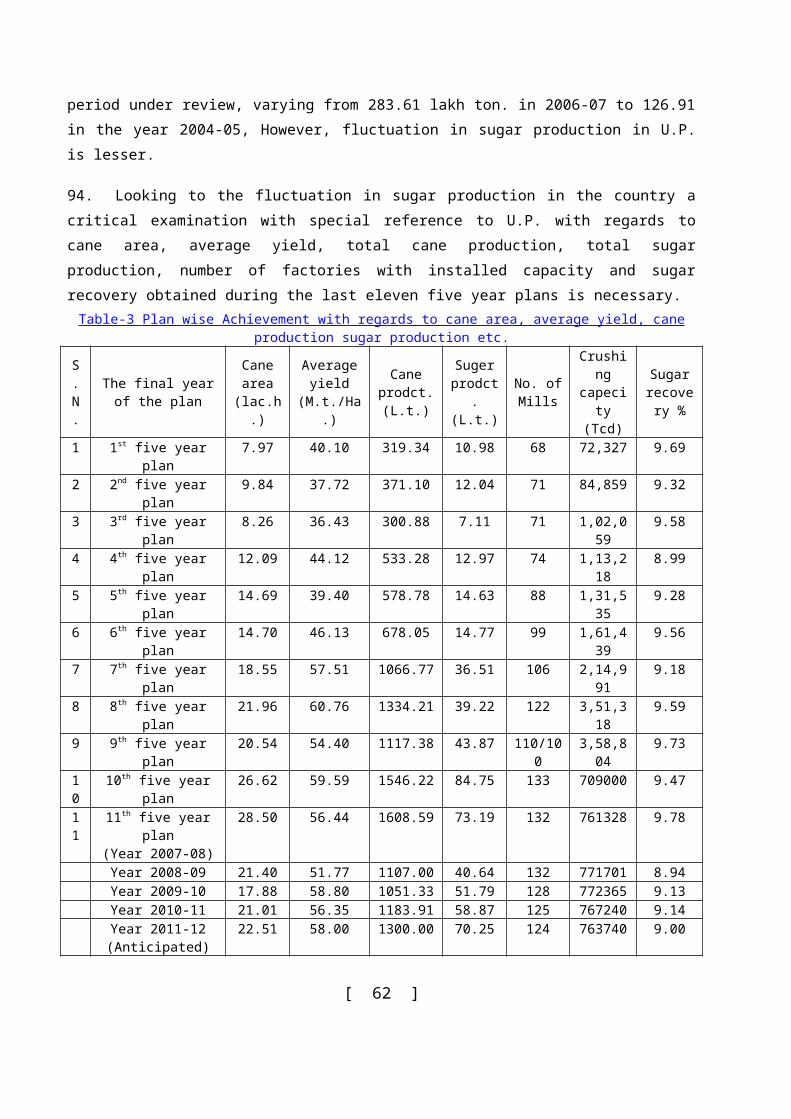
Livestock contributes about 25.6 % to the GDP from agriculture. About 22.45 million people work in livestock sector .which is around 5.8% of the total work
force in the country.Status of Uttar Pradesh V/S Other States(Co-operative sector) Year dec 2010
StateNo. of organized
SocietiesAvg. Milk Proc( lac Kgs/day)
Avg. Milk Sale/ Day(In lac ltr./Day)
Gujrat 13890 90.54 32.04Karnataka 11902 35.65 24.67
Maharashtra 22217 31.51 18.81Rajasthan 15956 16.54 13.65
Uttar Pradesh 21343 5.18 4.02Punjab 6904 9.52 7.23
Haryana 6881 5.22 3.84Courtesy: NDDB.
Progress and Achievement of 11th Plan (‘figures in 000)
Year
Functional Societies
Membership Milk Procurement
(Av. Kg./day)
Milk Sale
(Av. Ltr./day)
Target Ach. Target Ach. Target Ach. Target Ach.
1 2007-08 19.12 13.84 973.00 763.00 1283.00 930.00 1083.00 791.00
2 2008-09 23.10 14.36 1181.00 646.00 1560.00 816.00 1360.00 716.00
3 2009-10 27.07 13.47 1399.00 638.00 1552.00 596.00 695.00 412.00
4 2010-11 32.04 12.58 1614.00 628.00 2141.00 642.00 765.00 408.00
5 2011-12 35.01 13.37 1821.00 614.37 2423.00 649.52 841.00 374.01
12th Five Year Plan
Objectives
To strengthen & revitalize the existing Dairy Coop. & organize New Societies to ensure timely supply of required inputs to the producers & procurement of milk at remunerative prices.
To build up adequate milk processing and storage capacity for its subsequent marketing in the urban areas at reasonable price.
To instill a sense of confidence among milk producers by making the system transparent & objective.
To develop cool chain to maintain quality & minimize losses.
[ 62 ]
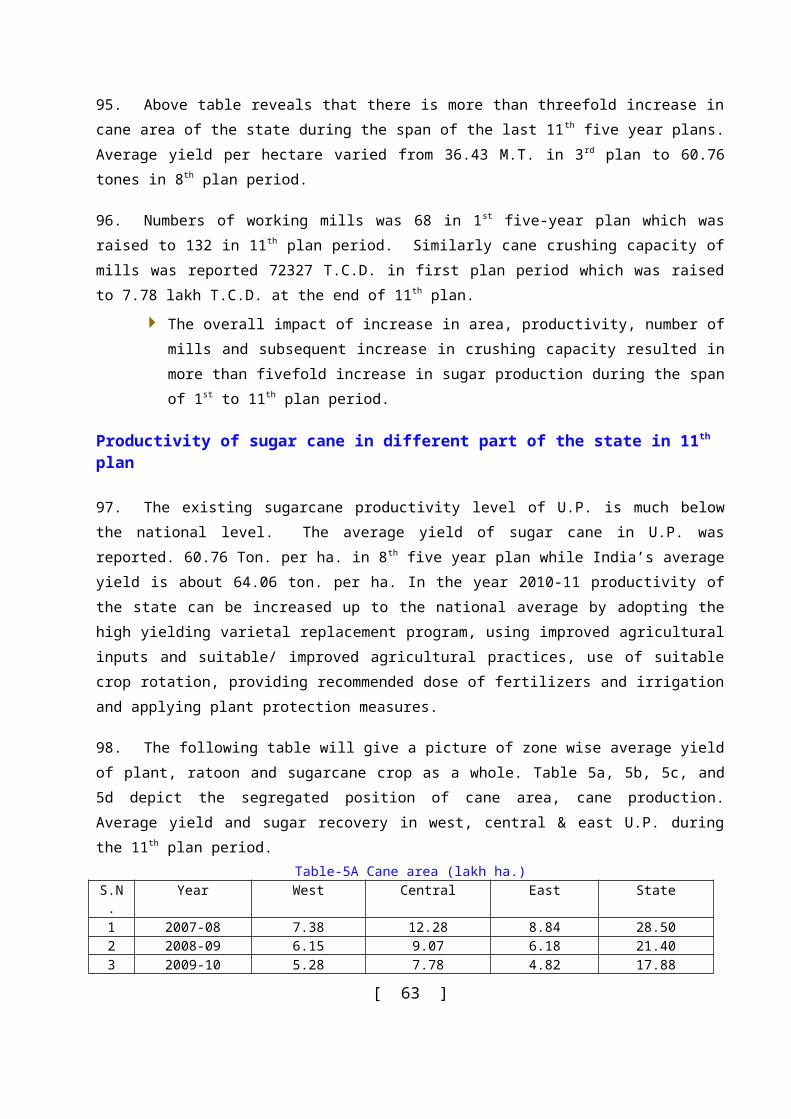
Physical Employment Generation (in lacs)
PARTICULARS END OFX Plan
END OF XIPlan
Growth % (Over the last Plan
Period)
Proposed For XII th
Plan
% Growth over XIth
Plan1.FUNCTIONAL SOCIETIES(000)
15.063 13.344 (-)11.41 25.80 93.35
2.MEMBERSHIP (Lacs)
7.557 6.133 (-)18.84 9.86 60.77
3.AVG. MILK PROCUREMENT
( Lacs Kg/ day)
10.40 6.495 (-)37.50 14.14 117.71
4.AVG. LIQUID MILK SALE
( Lacs Ltr./ day.)
5.04 3.74 (-)25.79 9.69 159.09
Strategies & Thrust Areas:
Additional coverage of rural areas by organizing VDCs.
Strengthening and up gradation of VDCs by Automation & mechanization.
New/ Innovative product development/ Processing & marketing.
Maintaining Cool Chain.
Market development through intensive & extensive coverage under the Consumers Awareness Programme and Brand Promotion.
Modernization of Quality Control Laboratories.
Encouragement & facilitation to private investment in the field of cool chain,
logistics and processing infrastructure.
Community Milk Parlors to be introduced to facilitate milk producers with large number of milch cattle.
Incouraging entrepreneurship under PPP model.
New initiatives
Automation of milk Procurement to ensure transparency objectivity in milk pricing & payment, 35,000 VDCs’ to be provided (Automatic Milk Collection Unit) in XIth plan period.
Establishment of Cool Chain & Logistics to preserve quality of milk by way of Bulk Milk Coolers in cluster of societies.
Aggressive marketing and brand promotion of "Parag" Milk &Milk Products.
Computer Net Working of all dairies for better monitoring and functional convenience.
Emphasis on Technical Input Services & Capacity Building of the Farmers & the Employees to enhance productivity. Intensive Animal Induction of High Breed Quality under Technical Input Programme.
Increase product base to increase economic viability of existing plants
[ 63 ]
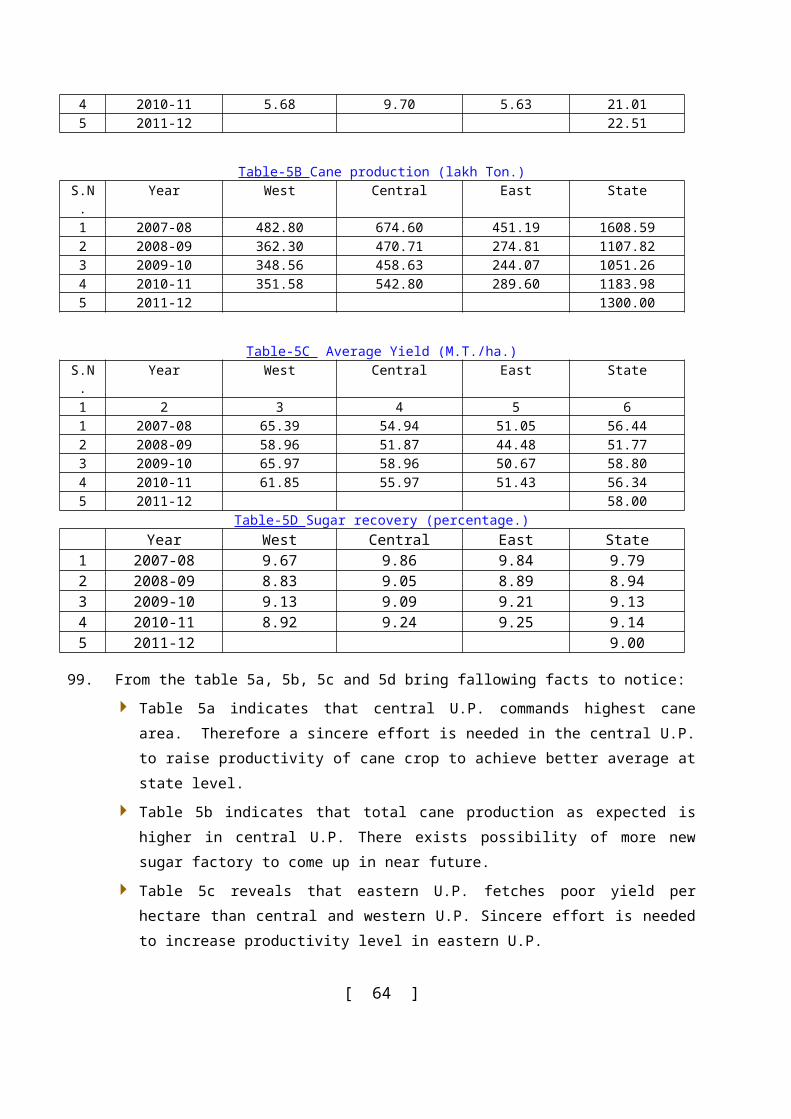
Constraints
Cumbersome procurement process.
Poor financial health of most of the milk unions causing avoidable delay in infrastructure creation and up-gradation schemes.
Unhealthy competition of Private Sector regarding Milk Procurement.
Delay in regular milk price payment to producers due to poor financial condition of milk unions.
Annual Plan 2012-13
Automatic Milk Collection Units:
170. Over a period of time, the milk producers’ faith & trust in cooperative society structure has started eroding from lack of transparency and objectivity in milk pricing and payment . To overcome this and regularize the faith into the system, automation and mechanization of procurement system has been taken up at a vast scale during the 11th Plan. In the 11th five Year plan (2007-12), 4915 AMCUs has been provided and 4667 AMCUs established.
Revitalization/ Consolidation & Expansion of Existing Milk Unions/ Societies
171. Co-operative institutions at all level needs consolidation and revitalization so that the ever-expanding umbrella of Cooperatives is able to serve the very purpose of their existence. To have a deeper penetration in rural areas, additional new societies will be organized. This major head is to cover a whole gamut of expenditures in the area of Modernization of Existing Functional DCS/ Organization of New DCS/ Community Milking Parlors /Managerial subsidy/ Transport Subsidy/ Cans for Procurement & Marketing for the Milk Unions/ and Working Capital for Milk Union.
Encouragement to milk producers and societies for enhancement productivity & production with technical input programme
172. Despite being the largest contribution of milk production and cattle in the country, U.P. is far behind in productivity. Standards as compared to Karnatka, Gujrat, Maharashtra and Rajasthan there are various reasons attributation to this phenomenon mainly – large no. of non descript animals, low rate of genetic breed improvement, poor quality of feed and fodder, micro mineral deficiency, lack of sanitary practices and poor health management. Unless we address their issues in a holistic and comprehensive way, productivity- enhancement will remain distant dream. The State has to reciprocate the national goal of productivity and production of enhancement for national food security. The technical input programmes in the form of extensive and intensive genetic breed improvement through AI and high quality bull natural service, balance feed & fodder and supplementing micro nutrients. Feed to make good for mineral deficiency, better health management and scientific production practices.
[ 64 ]
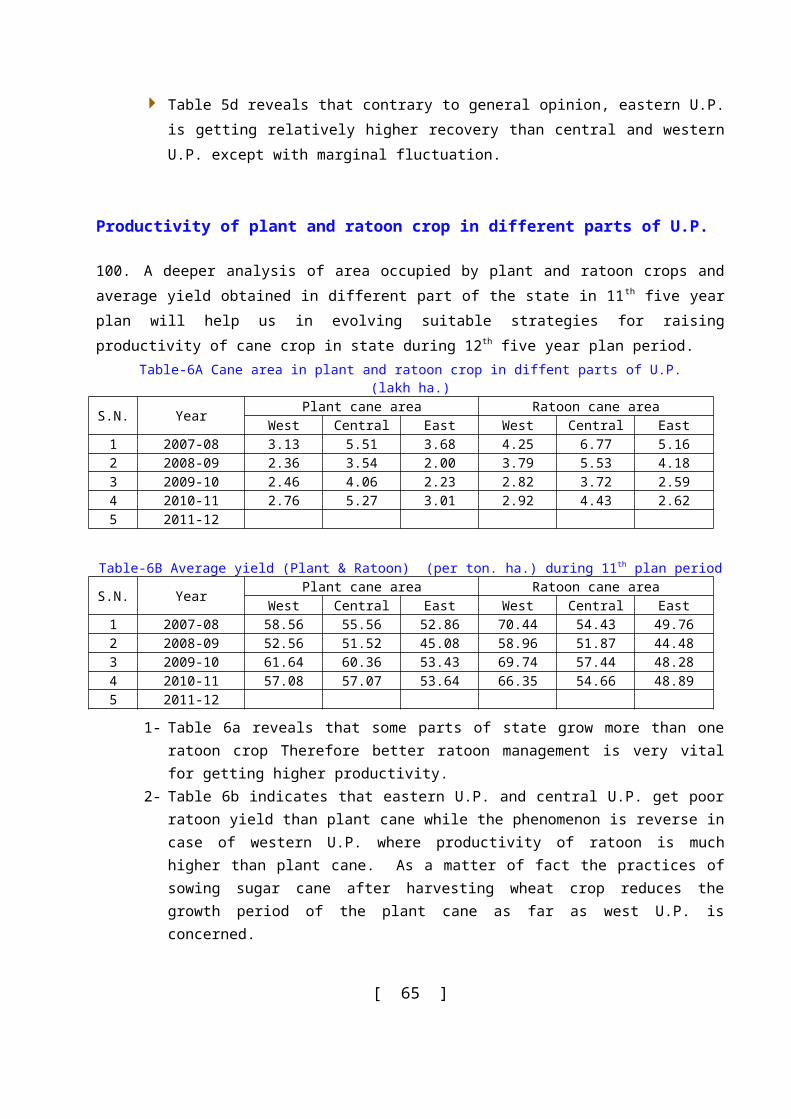
Training of farmers & field staff for capacity enhancement
173. Training of Management Committee Members, Secretaries, AI & FA workers is as essential as other activities to ensure the objective and targets of the whole exercise. Milk Producers will be provided training to keep animals in better sanitary conditions, clean milk production and hygienic conditions. They will be called progressive producers and form an example for others for better & clean milk production. Training will also be provided to Field staff, agents and marketing supervisors in marketing activities to promote business and to understand and provide milk & milk products under hygienic conditions.
Fisheries
174. Fish, the most important global foodstuff enriched with high protein contents, minerals and vitamins, worldwide accepted due to high medicinal & nutritious value. It has got well recognition in our society as symbol of prosperity and good luck. Besides, it has been an important source of employment since time immemorial. Today also most of traditional fishers population extracts their livelihood from it. As a profession, it has tremendous scope as many more people change their feeding habit and opt fish delicacy.
175. U.P. is one of the major landlocked states having the most densely population mostly suffering from malnutrition. U.P. bestowed with plenty of water bodies in the form of ponds, lakes, beels, oxbow lakes, reservoirs, canals, water logged areas and the rich Gangetic riverine system, offers immense potential for fresh water aqua-culture. The details of available water resources & their coverage in 11 th Five year Plan are given below.
STATUS OF U.P. FISHERIES AMONG OTHER INLAND STATES & COUNTRY:
176. The total estimated inland fish production of U.P. at the end of 11th Five year plan is approximately 4.30 lac mt. ton against total national inland production of about 50 lac metric tons. Uttar Pradesh stands third largest inland fish producer after West Bengal and Andhra Pradesh.
National Production 50 Lac M.T.SL. No.
States/UTs Inland Fish Production(in lac tons based on 2010-11)
1 West Bengal 14.502 Andhra Pradesh 10.003 Utter Pradesh 4.174 Bihar 4.005 Orissa 2.506. Assam 2.507 Other states 12.33
[ 65 ]
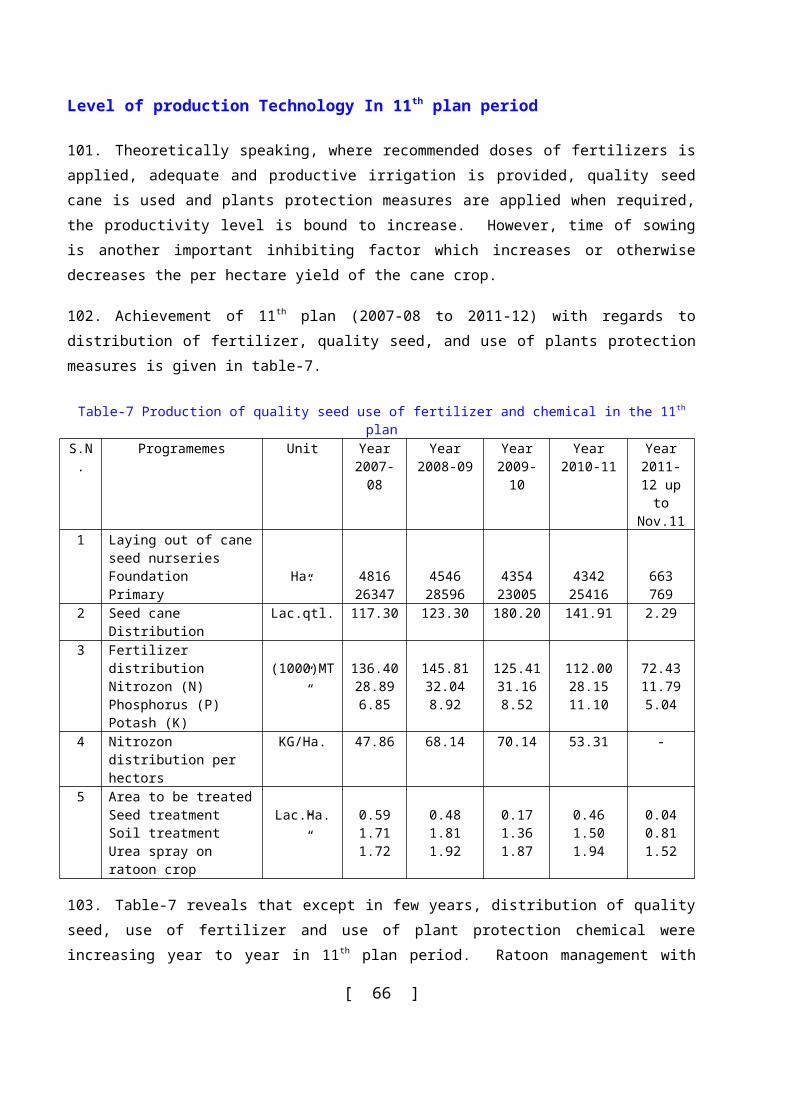
Physical progress of 11th five year plan (2007-12) Item 2007-08 2008-09 2009-10 2010-11 2011-12
Achiev Achiev Achiev Achiev AchievLease of ponds (ha) 10967 6453 6211 5244 4114.29Addl: Water area under fish culture (ha) 6482 6552 5763 4583 5509
Water logged area brought under fish culture (ha) - 40.00 40.00 72.00 359.00
Water area brought under cat fish/prawn culture(ha) - - - 13 13
Establishment of mobile fish parlour (no) - - - 05 05
Insurance of fishermen beneficiaries (No) 100000 102000 108620 110000 120000
Fishermen Houses 1268 1100 857 1107 9Training of fishermen (No) 11237 9542 806 5162 3242Fish seed production (Millions) 1183 1304 1147 1302 1433.70Fish production (Lac M.T.) 3.34 3.49 3.93 4.17 4.30
Fish productivity (kg/ha/yr) 2889 2900 3250 3270 3335
Twelfth Five Year Plan, 2012-17
Priorities Maximum utilization of available water resources for extensive and intensive fish culture to
ensure horizontal expansion of responsible fisheries development. Enhancement in fish production and productivity by dissemination, technology transfer and
awareness. Enhancement in quality fish seed production from public and private sector. Assimilation of Cat fish culture and prawn culture for fisheries diversification. Conservation of natural indigenous fish stock through river ranching. Promotion of Integrated fish farming for additional income generation to fish farmers. Additional employment generation through aqua practices. Special package to fish farmers for sustainable water supply to facilitate fish farming To encourage use of formulated fish feed to ensure sustainable increase in fish production and
productivity. Skill development of fish farmers through training and exposure visit. Social securities to fishermen community by facilitating fishermen houses and accidental
insurance to active fishermen.
Strategies: Execution of lease of ponds vested in gram panchayat through special drives. Emphasis to Renovate existing ponds/Construction of new ponds and tanks in pvt. Sector. Arrangement of first year inputs viz fish seed, feed and fertilizers etc will be insured
[ 66 ]
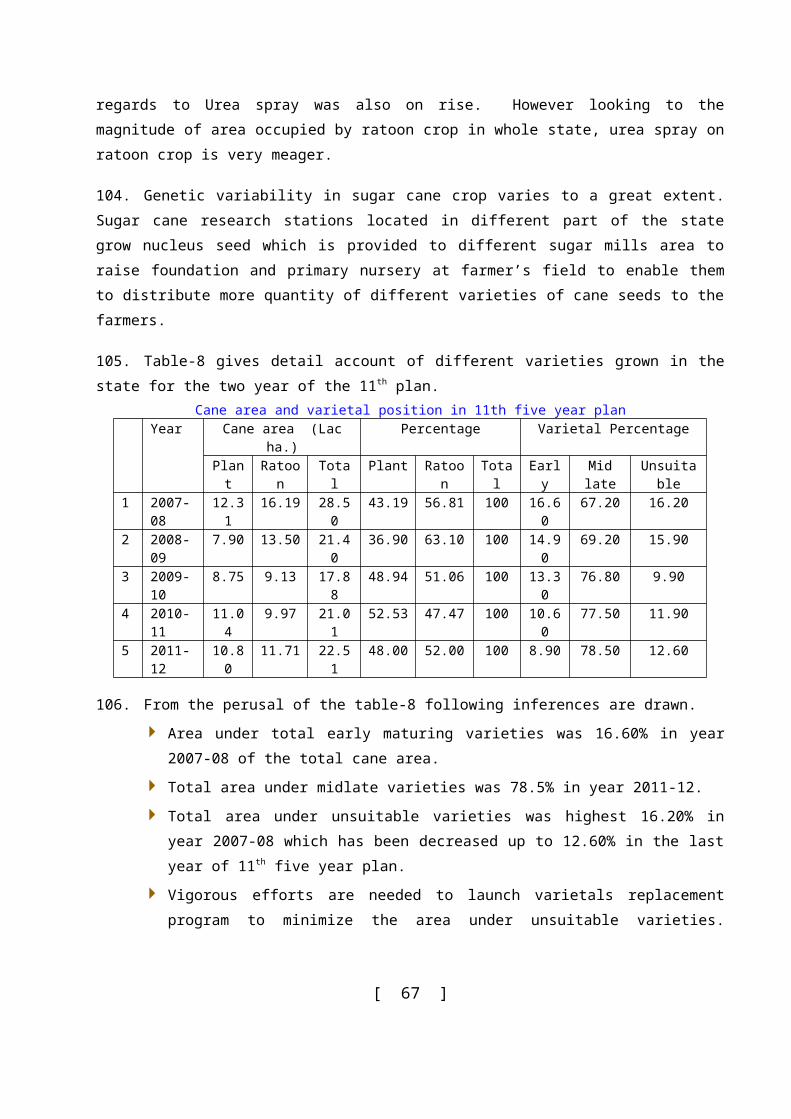
Adequate financial support to the fish farmers through bank loans and proportionate government subsidy.
Active participation of pvt sector in fish seed production will be preferred. Strengthening of existing departmental fish farms for additional fish seed production. Special emphasis will be given to impart training and extension & transfer of technology as
human resource development. To avail maximum GOI. Support to Construct fishermen houses for social securities to the
down trodden fishermen community. Social security to the active fishermen through wide coverage in accidental insurance will be
facilitated. Special package to the fish farmers will be provided for sustainable water supply for
successful execution. Assimilation of Cat fish culture and prawn fish culture for fisheries diversification will be
facilitated. Value addition through establishment of mobile fish parlours will be encouraged
PHYSICAL AND FINANCIAL TARGET OF 12 th FIVE YEAR PLAN :Sl. Item 2012-13 2013-14 2014-15 2015-16 2016-17
1 Pond area lease (ha) 6000 8000 8000 8000 100002 Improvement of ponds (ha) 6000 6000 6000 6000 60003 Construction of new
ponds(ha)1000 1250 1300 1300 1300
4 Development of water logged (ha)
358.99 449.43 477.69 477.69 477.69
5 Fish seed production (crore) 170 200 230 260 2906 Fish seed supply (lac) 160 190 220 250 2807 Establishment of hatcheries 16 16 16 16 168 Training of fishermen (N0) 1000 1250 1300 1300 13009 Fishermen houses 1500 1880 2000 2000 200010 Insured beneficiaries (No) 125000 156000 166000 166000 16600011 Fish Productivity (kg/ha/yr) 3850 4200 4550 4900 525012 Fish production (lac tone) 5.40 6.30 7.20 8.10 9.0013 River Ranching (lac N0) 2 2 2 2 214 Prawn Culture (ha) 8.00 10.00 11.00 11.00 11.0015 Mobile Parlour (unit) 05 06 07 07 0716 Catfish culture (ha) 5.00 6.00 7.00 7.00 7.00
Monitorable targets of 12th plan:
Enhancement in Fish Production from 4.30 lac m.t to 9.00 lac m.t. at the end of 12 th five year plan.
Increase in Fish Productivity level from 3335 kg/ha/yr to the tune of 5250 kg/ha/yr. at the end of 12th Five year plan.
Leasing of additional 40,000 ha water area of community ponds mostly vested in Gram Panchayat.
[ 67 ]
Renovation of 30,000 ha water area of community/pvt sector pond.
Construction of 6150 ha of new ponds in rural areas in private sector.
Financial assistance for Ist year inputs( fish seed, feed & fertilizer etc ) through Bank loan & Govt subsidy for 36,150 ha of water area.
Increase in quality fish seed production from 143.37 crores to 290.00 crores at the end of 12 th
plan.
1764 ha of water logged area to be brought under fish culture.
Establishment of 80 mini hatcheries in private sector.
Training & exposure visits of 6,150 fish farmers.
Conservation of natural fish fauna in major rivers of the state through River Ranching i.e. stocking of 2.00 lac fish seed every year.
Assimilation of cat fish culture & Prawn culture in 83 ha of water area for fisheries diversification.
Establishment of 32 mobile fish parlour for value addition to fish.
Construction of about 9380 fishermen houses for social security to the fishermen community.
Coverage of 1.66 lac active fishers under accident insurance scheme.
Physical targets for 2012-13 Items Unit Proposed target
1 Pond area lease Ha 60002 Improvement of ponds Ha 60003 Construction of new ponds Ha 10004 Development of water logged Ha 358.995 Fish seed production Crore 1706 Fish seed supply Lac 1607 Establishment of hatcheries No 168 Training of fishermen No 10009 Fishermen houses No 150010 Insured beneficiaries No 1250011 Fish Productivity Kg/ha/yr 385012 Fish Production Lac tons 5.4013 River Ranching Lac no 214 Prawn Culture Ha 8.0015 Mobile Parlour Unit 0516 Cat fish culture Ha 5.00
Forest
177. The forests are natural asset of immense value. Unlike its mineral resources including fossil fuels, which in course of time will either get exhausted or their utilization will become uneconomic due to
[ 68 ]
increased cost for obtaining and processing them, the forest, if of adequate extent, ideally dispersed, scientifically managed and judiciously utilized can be kept perpetually productive, confirming many benefits, direct and indirect, on the people.
178. Directly forest meets the need of fuel & fodder, bamboo and variety of other product. They also yield variety of products of commercial and industrial value. They also provide employment to a large population engaged in their protection, tending, harvesting and regeneration. Villages and tribal groups in the vicinity of any forest area depend on forests for almost all aspects of life. The produce of forests is often used for consumption by these local people.
179. Indirectly forests preserve the physical features, check soil run-off, and mitigate floods, makes the climate equitable and have a considerable hygienic and strategic value, conserve wild life and provide pollution free environment.
180. The premium on forest can be understood by recognizing them as the primary producers and protectors of several natural resources. As long as the economic benefits in terms of climate control, pollution abatement, and wild life maintenance are not satisfactorily calculated, timber and pulp are regarded the chief economic products of forests.
181. Human, especially those living in and around forests were earlier using natural resource just for sustenance and not for commercial purposes. With modern civilization being consumption-oriented, our natural resources and particularly forests had to bear the brunt of indiscriminate use. With increasing human and development activities forests have been severely fragmented and at many places degraded, causing threat of local extinction to many wild species of plant and animals. Therefore, the functions with respect to conservation of soil, water and biodiversity are vital for the welfare of present and future generations.
Statistical profile1. Population 166.10 Million (16.15% of country’s Population)2. Geographical Area 240928 Sq. km (7.3% of country’s Geographical area)3. Recorded Forest Area 16583 Sq. km (6.88% of state Geographical area)a. Reserved Forest 11660 Sq. kmb. Protected Forest 1420 km2c. Unclassed Forest 3503 Sq. km4. Forest Cover 14338 Sq. km (5.95% of state’s Geographical area)a. Very Dense Forests 1626 Sq. km b. Moderately Dense Forests 4559 Sq. km c. Open Forests 8153 Sq. km6. Tree Cover 7382 Sq. km (3.06% of state’s Geographical area)7. Forest & Tree Cover 21720 Sq. km (9.01% of state’s Geographical area)
8. Wildlife Sanctuaries 24.
[ 69 ]
FOREST COVER OVER THE YEARSYear % of state’s geographical area
1 21997 4.4621999 4.4642001 5.7052003 5.8602005 5.8602009 5.9522011 5.950
Source: State of Forest Reports as per Forest Survey of India
PHYSICAL ACHIEVEMENTS
PlantationYear Department Target Achievement
Ha. No. of plants planted
(Plants in lakh)
Ha. No. of plants planted (Plants in lakh)
2007-08 Forest 50000 0.00 47186 0.00
Other 0.00 21.00 0.00 10.00Total- 50000 21.00 47186 10.00
2008-09 Forest 55000 357.50 94427 1008.23
Other 0 21.00 0 17.82Total- 55000 378.50 94427 1026.05
2009-10 Forest 40300 261.95 80597 812.81
Other 14700 95.55 15765 122.50Total- 55000 357.50 96362 935.31
2010-11 Forest 40300 261.95 67427 646.86
Other 14700 95.55 15465 132.69Total- 55000 357.50 82892 779.55
2011-12 Forest 41000 266.50 74181.85 564.72
Other 14600 94.90 15765.19 140.20Total- 55600 361.40 89947.04 704.92
UP NRMPAP (JICA ) Progress
Plantations in Departmental Mode : 20200 ha
Plantations in JFM mode :10168 ha
Constitution of JFMCs: 558
Constitution of EDCs: 131
Declaration of Village forests for JFMCs : 77373 ha
Departmental Nurseries Renovation: 118 nurseries
Construction of Field level buildings: 384
Children forest Program : 6 districts (200 schools)
[ 70 ]
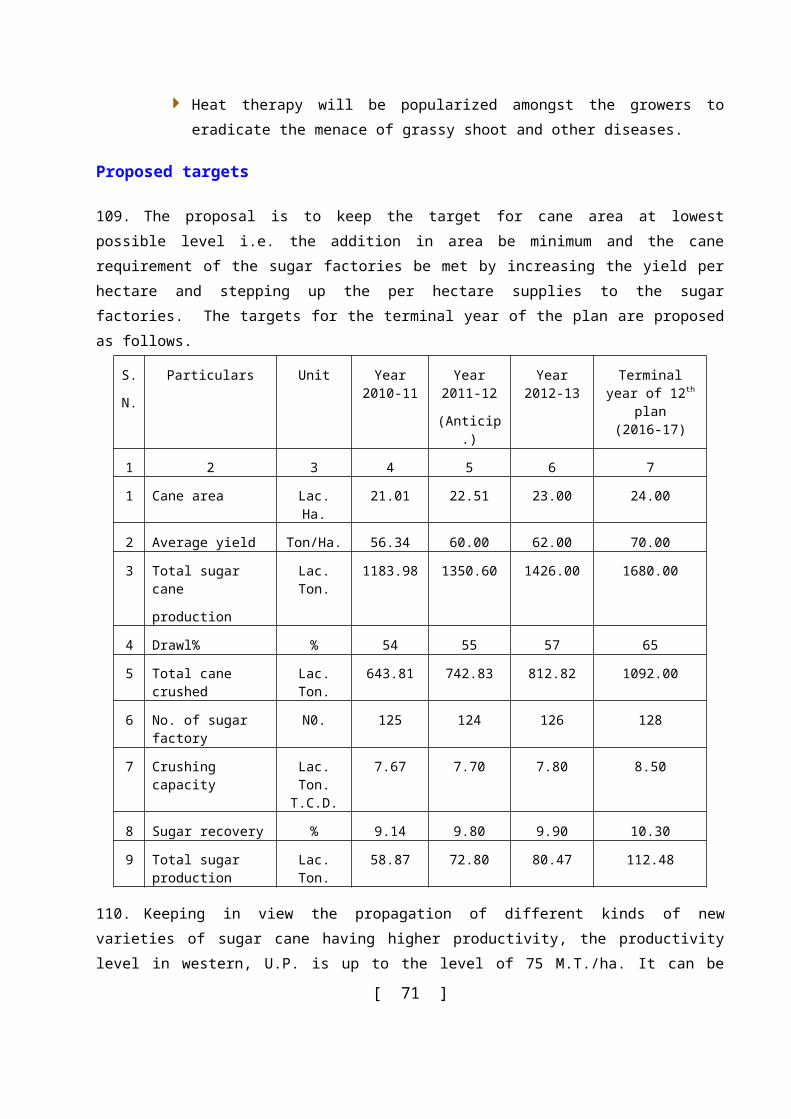
GOALS
To protect, manage and improve the natural forests on sustainable basis
Management of afforested areas on sustainable basis
Soil and water conservation measures to reduce the soil erosion as well as impact of flood and drought, especially in catchment areas
To reduce poverty through natural resource conservation, reforestation and sustained community participation
Increase in Forest Cover/Tree Cover
Enhancement in Forest Productivity through intensive R&D Programmes
Protection and conservation of bio-diversity and wild life in protected areas
Management of wild life outside protected areas
Capacity Building of Forest Personnel
Forest settlement, survey, demarcation, boundary fixation and mapping of forest areas through remote sensing
Development of Forest Management Information System and upgradation of technology
Infrastructure development
Sustainable use of Non Wood Forest Produce (NWFP)
Modernization of forest extension centers
PRIORITIES
Nursery Management
To reduce poverty through natural resource conservation
Increase in forest and tree cover
Community participation in forestry activities.
Conservation of wildlife and bio-diversity in and outside protected areas
Forest Settlement
Capacity building of forest personnel.
NEW INITIATIVES
Wildlife Management and Conservation in and outside protected areas
Forest Settlement
Forest Management Information System
Ornithological Research on Wetlands
Community participation in forestry activities
Joint Forest Management mode to be extended
[ 71 ]
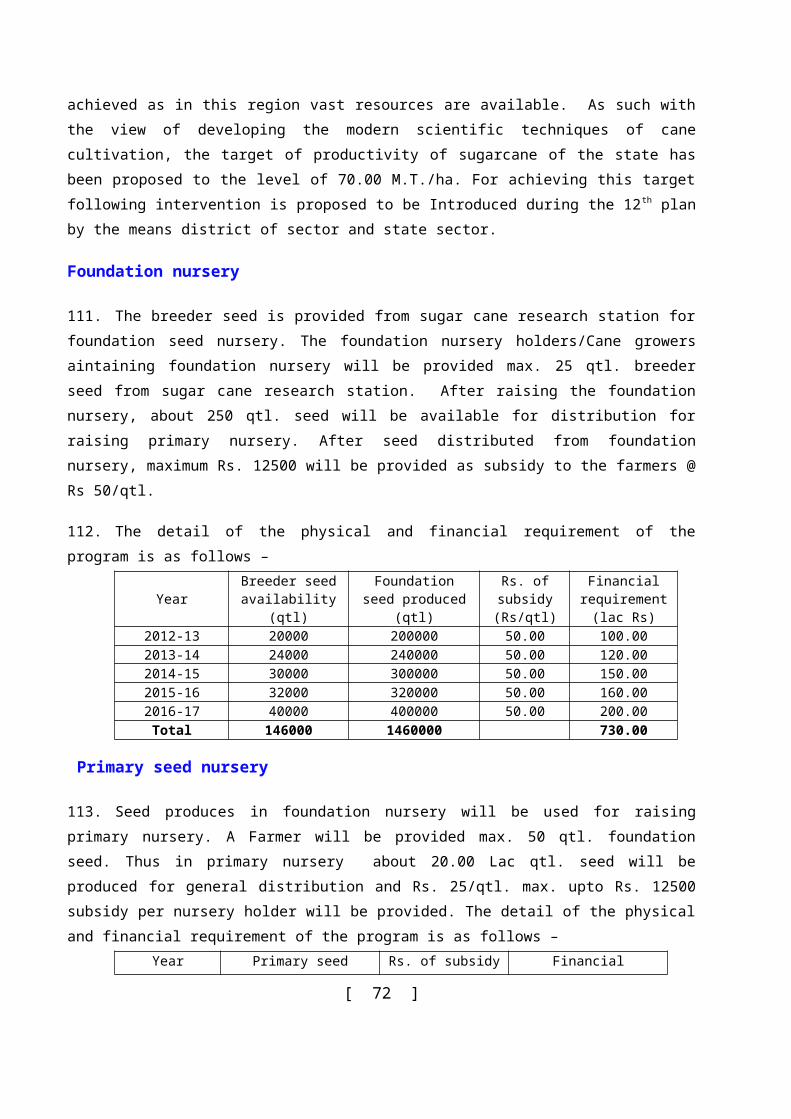
Cooperation
182. Cooperatives play a vital role to develop socio-economic condition of the people through democratic way with limited resources. Presently activities of cooperatives are limited in the following fields:-
Short term & Long term credit to the farmers.
Providing inputs (Fertilizers, seeds, pesticides etc.) to the farmers through
PACS and other cooperatives.
Purchase of wheat & paddy under price support scheme.
Integrated cooperative development programme (I.C.D.P.)
Cooperative Education & Training programme.
Cooperative consumer programme.
Present Status: Eleventh Plan-financial/physical progress.
Cooperatives cater essentially the requirement of short term credits through its three tier credit structure consisting of 7479 primary agricultural cooperative societies (PACS) at Nyaya panchayat level, 50 District/Central cooperative Banks with 1323 branches and apex cooperative Bank (U.P.C.B.)
Long term credit through U.P. Sahkari Gram Vikas Bank Ltd. With its 323 branches.
Cooperatives play a vital role in augmenting the rural economy with 30%, Contribution in fertilizer distribution, 30% share in short term loan and 60% in long term loan distribution.
Small and marginal farmers constitute about 80% of the cooperative membership.
At present contribution of cooperatives in purchasing wheat and paddy farm produce under Govt. price support is nearly 40%.
N.C.D.C. have also provided Rs. 5207.98 lac. in form of loan/subsidy under I.C.D.P. scheme through State Govt. in XIth five year plan
Under recommendation of Vaidyanathan Committee Rs. 623.41 cr. from G.O.I. through NABARD and Rs. 299.94 cr. from State Govt. have been provided in XIth five year plan for cleansing the balance sheets of PACS and District cooperative banks. Rs. 922.28 cr. is still to be provided by the G.O.I
Progress (Physical)
[ 72 ]
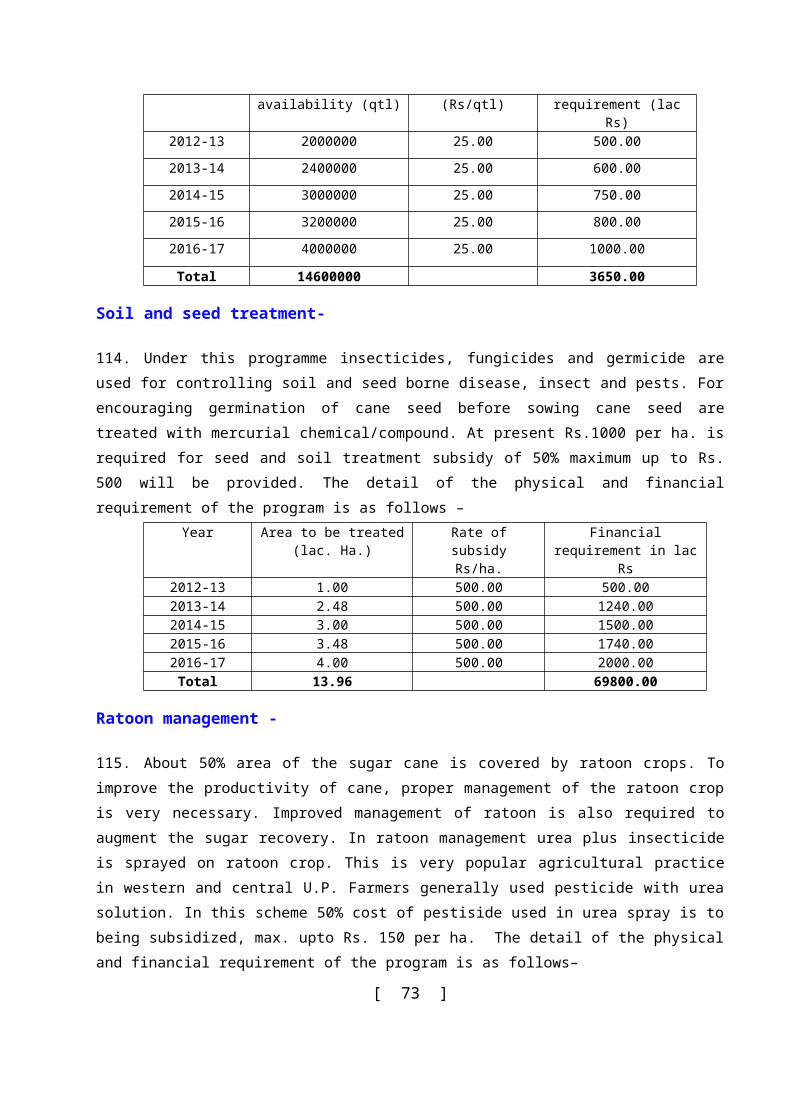
183. In XIth five year plan disbursement of Short term and Long term credit are as follows (Rs. In crore)
S.No. Year Short term Long termTarget Achievement Target Achievement
1 2007-08 2500 2241.71 425.00 388.892 2008-09 2600 2041.53 500.00 488.463 2009-10 2600 2571.20 645.28 702.894 2010-11 2800 3262.34 570.00 728.225 2011-12 3900 3339.91* 901.55 480.00 *
*( Achievement up to 31.12.2011 )Distribution of Fertilizer and seeds in XIth plan are given below
(Unit in lac M.T.)
S.No. Year Kharif RabiTarget Distribution Target Distribution
1 2007-08 13.33 12.53 21.53 20.932 2008-09 13.83 14.43 23.05 21.433 2009-10 14.09 14.17 22.68 21.704 2010-11 14.22 12.93 23.58 22.545 2011-12 14.22 13.52 23.89 17.51
Seed Targets and distribution (Unit in thousand Qtl.)
S.No. Year Kharif RabiTarget Distribution Target Distribution
1 2007-08 42.77 31.14 562.36 522.542 2008-09 32.92 28.17 690.12 658.693 2009-10 30.62 20.52 666.73 596.024 2010-11 63.25 34.04 703.73 732.175 2011-12 29.70 15.55 703.73 804.44
Goals
Increase ST loans from 3900 cr. to 7200 cr.
Increase LTloan from 900 cr. to 1800 cr.
Increase Fertilizer distribution from 35.47 lac MT to 40.73 lac MT.
Increase seed distribution from 7.33 lac qtl to 9.20 lac qtl.
Enhance warehousing capacity from 22.15 lac MT to 29.24 lac MT.
Major targets and monitorable targets.
184. For the XIIth five year plan targets of different schemes are being proposed as follows:- Short term & Long term credit disbursement (Rs. In cr.)
S.No. Year TargetsShort term Long term
1 2012-13 4265.00 1200.002 2013-14 4915.00 1350.003 2014-15 5500.00 1500.004 2015-16 6330.00 1650.005 2016-17 7200.00 1800.00
Fertilizer Distribution
[ 73 ]
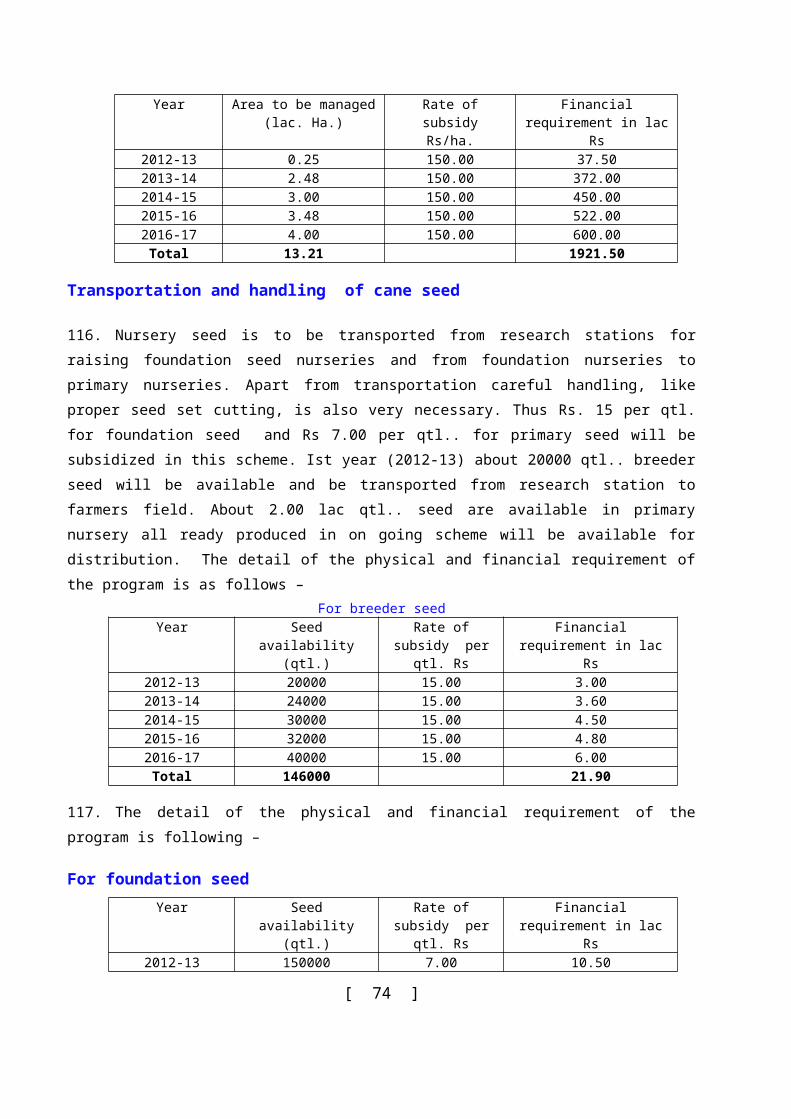
(Unit In lac. M.T..)
YearKharif RabiTarget Target
2012-13 13.93 21.532013-14 14.48 22.222014-15 15.05 22.922015-16 15.65 23.672016-17 16.28 24.45
Seed Distribution(Unit In thousand Qtl.)
YearKharif RabiTarget Target
2012-13 30.00 730.00 2013-14 31.50 765.00 2014-15 33.00 800.00 2015-16 35.00 840.00 2016-17 37.50 882.00
Twelfth Five Year Plan, 2012-17
185. At present scheme of subsidy /Interest free loan in ratio of 50:50 is in existence for several years in which Rs. 100, (Rs. 50 as subsidy and Rs. 50 as interest free loan) is being given to SC/ST to purchase the share of PACS. By this share money of Rs. 100.00 only Rs. 2000.00 (Twenty times of share money) as a loan can be given to such SC/ST member of the PACS. At present this amount is very small and inadequate to fulfill their need of agriculture inputs and other agricultural activities.
186. In present context for SC/St class revised amount Rs.500.00 per member (Rs. 250.00 as subsidy and Rs. 250.00 as interest free loan) is proposed as a share money for sc/st members . By this amount of Rs. 500.00 (5 shares @ 100.00) short term crop loan amounting Rs. 10,000 (maximum twenty times of share money) can be given to such member of SC/ST class.
187. Interest subvention for providing crop loan to farmers through PACSat the maximum rate of 7% (1% additional rebate by the State Govt. plus rebate given by G.O.I. from time to time on timely payment of S.T. loan.)
188. Under the modified interest subvention scheme loan up to 3.00 lac will be provided to farmers @ 7%. Losses incurred by the cooperative credit institutions due to implementation the scheme will be reimbursed by the state government in the form of interest subvention. In addition to this if repayment of entire loan is made on or before the due date then such farmers will get additional benefit of 1% on the rate of interest- this rebate will be in addition to the rate announced by G.O.I. from time to time. Therefore under interest subvention scheme for XIIth five year plan & for Annual plan 2012-13 financial assistance were required as given below
Rs. In Cr.Year Crop No. of Requirement of interest subvention on proposed crop laon
[ 74 ]
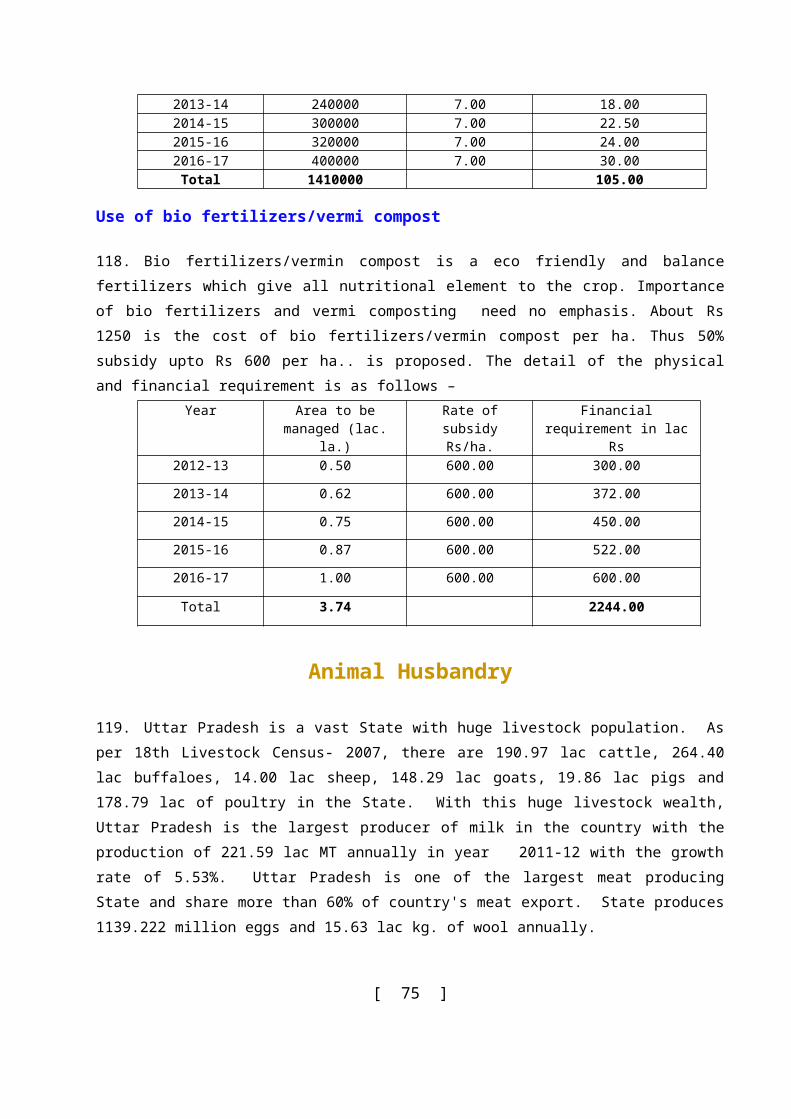
Loan
mem-bers(In
Lac.)
Normal Prompt Payee
StateGovt. GoI
StateGovt.
(@ 1%)
GoI(@ 3%)
Total Grand Total
(9+10)StateGovt. GoI
2 3 4 5 6 7 8 9 10 112012-13 4365.00 40 69.62 19.21 15.60 46.81 85.22 66.02 151.242013-14 4915.00 42 78.39 21.63 17.57 52.71 95.96 74.34 170.302014-15 5555.00 44 88.60 24.44 19.86 59.58 108.46 84.02 192.482015-16 6330.00 46 100.96 27.85 22.63 67.89 123.59 95.74 219.33
2016-17 7200.00 48 114.84 31.68 25.74 77.22 140.58 108.90 249.48Total: 28365.00 452.41 124.81 101.40 304.21 553.81 429.02 982.83
Interest subvention on conversion of Short Term crop loan into Medium Term loan
189. Due to natural calamities, recovery of crop loan from farmers is suspended and loan is converted into medium term. As a result of this, instead of payment of interest for one year the farmers have to pay interest for three years to PACS. In the above backdrop, farmers have to pay 12 months interest on first installment, 24 months interest on second installment and 36 months interest on third installment.
190. Total loan disbursed, the loan which will be converted into medium term loan, and proposed additional interest on one third portion as assistance to be provided to the farmers under the above scheme are placed below:-
(Rs. In Cr.)
Managerial subsidy to weak PACS.
191. Out of 7479 PACS number of PACS below 50 lac business per annum is 5500.These PACS are not working properly and therefore, they are neither able to pay full salaries of their employees nor they serve properly to farmers. As per the recommendation of high power committee of the Government in 2007 Rs. 6000 per PACS per month was proposed as salary to the employees of the concerned PACS. Since then due to rise in the cost of living and inflation it is proposed that these PACS should be provided financial assistance for managerial subsidy Rs. 10,000=00 per PACS per month till it achieve Rs. 50 lac business per annum under condition as follows:-
ACS to whom finance will be provided will have to increase its business minimum 15% per annum.
After achieving the business of 50 lac, PACS will cease to get subsidy.
Year Target of crop loan
disbursement
5% failure of crops due to
natural calamities
Financial assistance to farmers to meet extra interest burden due to conversion of short term
loan to medium tern conversion loanState Govt. (@ 4.7%)
GoI (@ 3%)
Total(5+6)
1. 2012-13 4365.00 218.25 3.42 2.18 5.602. 2013-14 4915.00 245.75 3.85 2.45 6.303. 2014-15 5555.00 277.75 4.35 2.78 7.134. 2015-16 6330.00 316.50 4.96 3.17 8.135. 2016-17 7200.00 360.00 5.64 3.60 9.24
Total: 28365.00 1418.25 22.22 14.18 36.40
[ 75 ]
192. Along with creation of new district namely Prabudh Nagar, Panchsheel Nagar and Bheem Nagar was also created . For the smooth running of departmental activities, and supervision of schemes, different type of posts as well as establishing an office in the District head quarter is required for which an outlay to tune of Rs. 64.92 lac as recurring and non-recurring expenditure will be needed in year 2012-13
Irrigation and Flood Control
193. Uttar Pradesh is primarily an agricultural based economy with approximately 80% of total geographical area under agriculture. Due to increasing population there is tremendous pressure on land and water resources. Therefore major, medium & minor irrigation projects are being constructed using natural water resources. At present, there are approximately 74000 Km of canals, 28 Major & Medium lift canals, 245 Minor Lift Canals, 65 Reservoirs/ Bundhis and 29016 running state tube wells.
194. Uttar Pradesh is divided into 4 economic zones 1- Bundel khand 2. Eastern 3- Central 4- Western. Each economic zone has its characteristic economic, environmental and population criteria.
195. The irrigation potential created upto Xth Plan is 120.73 Lakh ha. During XIth Plan 5.42 Lakh ha. potential is likely to be created. Hence the total potential created upto XIth Plan will be 126.15 Lakh ha.
REGIONWISE IMPORTANT INDICATORSDetails Bundel khand
(7 Distt.)Eastern
(28 Distt..)Central
(10 Distt..)Western
(30 Distt..)Total (U.P.)
1 Total Population, (In Lakh) Year 2001
82.33 666.12 301.58 611.95 1661.98
2 % of State Population (2001) 4.95 40.08 18.15 36.82 100.003 Geographical Area (In Lakh
Ha.) 29.42 85.85 45.83 79.80 240.93
4 Culturable Area (In Lakh Ha.) 23.15 63.82 35.62 65.29 187.885 Net Sown Area (In Lakh Ha.
2009.10). 20.13 55.22 30.02 60.52 165.89
6 Area Sown more than once (In Lakh Ha. 2009.10).
7.64 29.05 15.24 36.57 88.50
7 Gross Cropped Area (In Lakh Ha. 2009.10).
27.77 84.27 45.26 97.09 254.39
8 Cropping intensity (9/7 x 100) 137.98 152.61 150.77 160.43 153.359 Net Irrigated Area (In Lakh
Ha. 2009.10). 10.43 42.14 25.40 55.87 133.84
10 Area Irrigated more than once (In Lakh Ha. 2009.10).
0.55 17.88 11.01 30.26 59.70
11 Total Irrigated Area (In Lakh Ha. 2009.10).
10.98 60.02 36.41 86.13 193.54
12 % of Total Irrigated Area to Total Sown Area (11/7x100)
39.54 71.22 80.45 88.71 76.08
-Agricultural Data (2009-10) of U.P. (Agriculture Department)
REGION WISE IRRIGATED AREA (2009-10) (Th. Ha.)
[ 76 ]
Sl.No.
Name of Zone Total Sown Area
Net Irrigated Area to Sown
Area(%)
Irrigated Area (% of Sown Area )Canal Govt. Tube
well Private Tube
wellOthers
1 2 3 4 5 6 7 81 Bundelkhand 2013 1043 (51.81) 413
(20.52)43 (2.14) 230 (11.42) 357 (17.73)
2 Eastern 5522 4214 (76.31) 906 (16.41) 228 (4.13) 2956 (53.53) 124 (2.24)3 Central 3002 2540 (84.61) 516 (17.19) 37 (1.23) 1978 (65.89) 9
(0.30)4 Western 6052 5587 (92.32) 722 (11.93) 86 (1.42) 4056 (67.02) 723 (11.95)
196. Water Resources Organization, Government of India has made an assessment of water resources of the state based on 75% dependability, the flow of major rivers of the state as measured at terminal sites is as below.
197. The quantum of surface water available for irrigation in the state assessed from above observations will be say around 99.06 MAF only which is much lower than the above figure of 145.10 MAF. This is due to the fact that provisions are to be made for sharing of water by other states by way of u/s and d/s demands and obligations. In addition about 32 MAF water are being harnessed by u/s project in operations. Thus the total surface water resource which can be developed by state including Uttarakhand is about 131 MAF. The Uttarakhand share of surface water is about 4.80 MAF. Thus the net water available for irrigation is about 126.20 MAF for state share. The detail of water resources of state is as below:-
WATER RESOURCES OF UTTAR PRADESH1. Total available surface water 126.20 MAF 2. Reserve for drinking, industrial and other uses 20.00 MAF 3. Flood waste (which can not be arrested during monsoon) 35.00 MAF 4.Quantum of surface water available for irrigation 71.20 MAF 5. surface water available for irrigation(a) For Major & Medium irrigation(b) For Minor Surface irrigation
67.40 MAF3.80 MAF
6. Quantum of water available for major & medium irrigation 67.40 MAF 7.Anticipated utilization through completed and ongoing projects up to XI plan . 61.15 MAF 8.Balance for New Projects during XII Plan & onward 6.25 MAF 9. New Projects included in XII Plan (2012-2017) 1.75 MAF
(MAF- Million acre feet)GROUND WATER RESOURCES OF UTTAR PRADESH
Name of River Discharge observation site
Annual inflow(MAF)
12345
GangaGandakGhaghra
SoneGomti
VaranasiValmiki Nagar
TurtiparChopanNaighat
54.4926.7550.599.274.00
Total 145.10
[ 77 ]
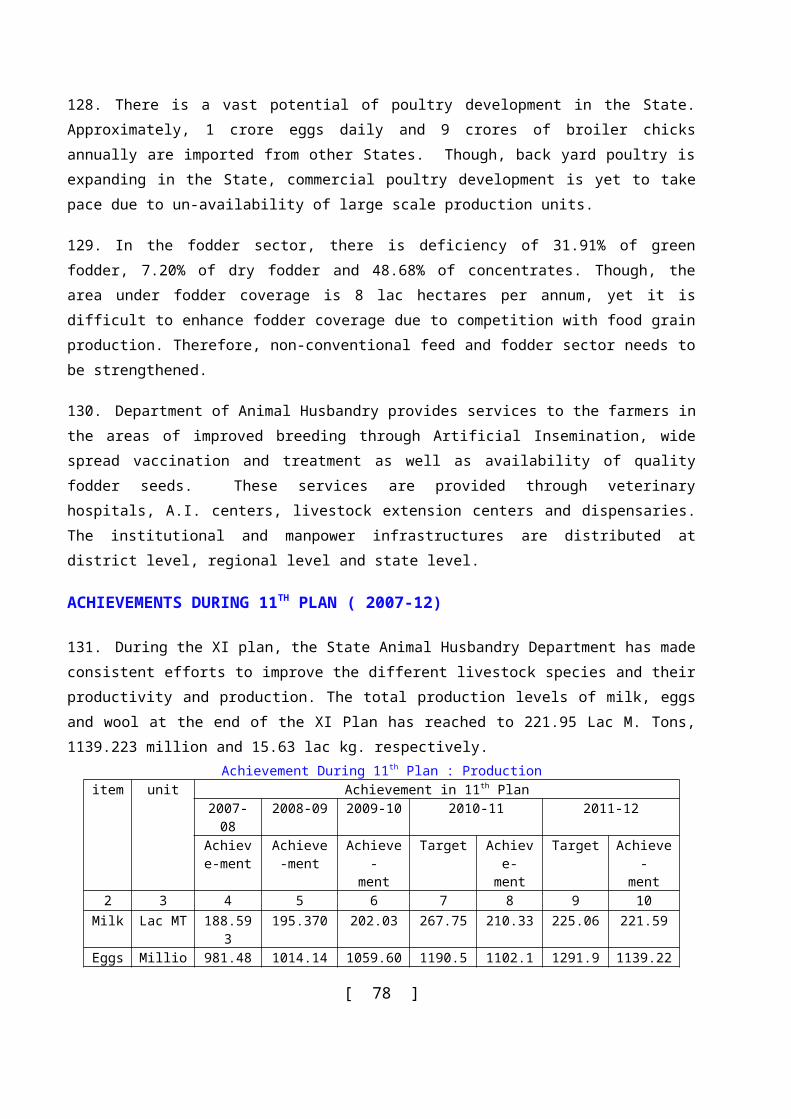
(MAF- Million acre feet)
198. The total surface water which can be exploited by state is about 126.20 MAF. It is estimated that out the total surface water available only 71.20 MAF can be utilised for irrigation purpose as 20 MAF shall have to earmark for drinking, ecology and industrial uses. Out of this 67.40 MAF of water has to be utilised through major and medium irrigation projects including the reservoirs and multipurpose projects located in Uttarakhand state and 3.80 MAF through minor surface scheme.
Progress during Eleventh Five Year Plan:-
199. 61.15 MAF of surface water has been utilised through ongoing and completed major and medium irrigation projects up to XIth Five Year Plan. Out of remaining 6.25 MAF of surface water 1.75 MAF water is proposed to be utilised through major and medium irrigation projects during XII Five Year Plan. Total 121.54 Lakh Ha. potential can be created through major and medium irrigation projects and 6.28 Lakh Ha. Through minor irrigation projects i.e. total 128.36 Lakh Ha. irrigation potential can be created through available 71.20 MAF of surface water.
Irrigation potental through major & medium irrigation projectsPotential in Lakh Hectare
Item Total Pot. Created1 potential created by the end of X plan 83.192 Likely creation during XI plan (2007-2012) 2.18
Total (1+2) 85.373(a)
(b)potential to be created through ongoing major and medium projects in XII plan.Balance potential of ongoing projects after XII plan
8.01-
Total- 3 8.01potential Total (1+2+3) 93.38
4 (a)
(b)
potential to be created through new identified schemes in XII Plan potential to be created through new identified schemes in U.P. in XIII and Subsequent Plan
0.4814.48
Total- 4 14.96Total (1+2+3+4) 108.34
5 To be created through schemes located in Uttarakhand. 13.20Total (1+2+3+4+5 ) 121.54
1. Total available ground water 68.12 MAF
2.Un utilized water 6.81 MAF
3.Utilizable water resource 61.31MAF
4. Share of Uttar Pradesh 56.93 MAF
5. Reserved water for drinking 8.52 MAF
6. Water available for irrigation 48.42 MAF
7. Water utilized in irrigation 36.82 MAF
8. Balance for future irrigation 11.60 MAF
[ 78 ]
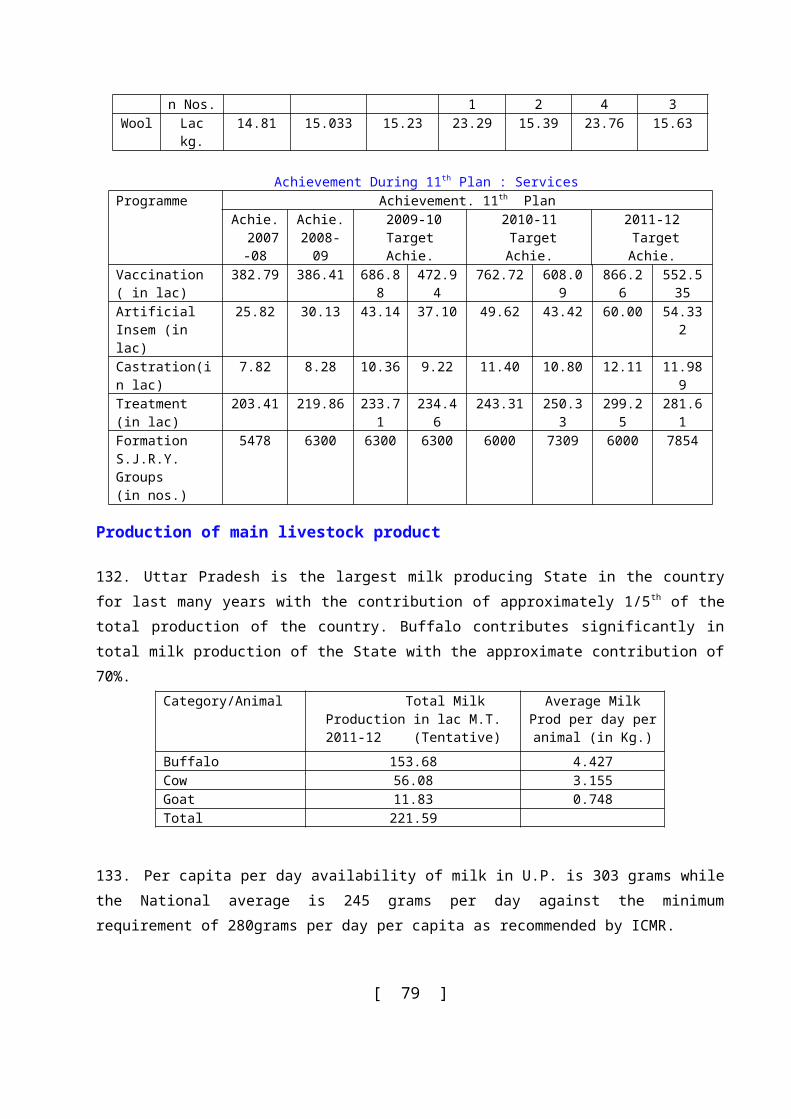
200. 86.61 lakh Ha. irrigation potential through Major and medium irrigation projects and 39.54 lakh Ha. irrigation potential through minor irrigation Projects i.e. total of 126.15 lakh Ha. irrigation potential is likely to be created by the end of XIth Plan.
201. To provide irrigation facilities to non irrigated areas of the state a target of irrigation potential creation was fixed as 1170.13 Th. Ha. through major and medium irrigation projects with an outlay of Rs.13506.92 crore during XI Five Year Plan, but only 218.58 Th. Ha. irrigation potential could be created. The projects that could not be completed during XI Plan will be completed in XII Plan.
XII Five year Plan
202. In XII Five Year Plan in addition to ongoing projects e.g. Bansagar Projects, Saryu Canal Project, Madhya Ganga Canal Stage-II, Kachnauda Dam, Arjun Sahyak, Lahchura Dam, Kanhar irrigation Scheme, Lower Rohani Dam, Utari Dam, Jamrar Dam, Pahari Dam, Bhaurat Dam etc. and new proposed projects e.g. Virat Sagar Dam, Panchnad Dam, Sukhanai Barrage, Bhagen Dam, Dhurwara Dam, Bhawani Dam, Hanthanikund Link channel stage-II, Sharda Shayak stage-II are also proposed to be completed.
203. Some projects eg Kanhar irrigation project, Badaun irrigation scheme, and restoration of Gandak canal system have been sent to Central Goverment for funding under A.I.B.P. are also proposed to be completed during XII th Plan
204. Similarly Nabard funded ongoing projects in which main projects like, Lower Roiani Dam, Utari Dam, Jamrar Dam, Pahari Dam, Raj Ghat canal stage-II, I/C of Bhupaoli Pump canal, restoration Ch.Ch. Singh Yamuna pump canal, remodelling of Gyan pur pump canal, restoration of Sone pump canal, restoration of Dalmau-B pump canal, restoration of Chillimal pump canal are proposed to be completed within time and new projects like Bandhai dam,Bhawani dam are proposed to be completed during XII Five Year Plan.
205. Thus, during XIIth Plan potential creation of 9.49 Lakh Ha. is envisaged by completing nearly 25 irrigation projects. By completion of these projects irrigation facilities will be developed in new Khaki areas.
206. Ongoing capacity restoration projects, e.g. restoration of Hardoi Branch, restoration of Sharda Shayak, I/C of Bhupaoli Pump canal, Yamuna Pump Canal, Gyan pur Pump Canal, Son Pump Canal,Dalmau-B Pump Canal, Chillimal Pump Canal,Tanda Pump Canal, Upper Ganga Canal, restoration of Azamgarh and Shahganj Branch, Dohri ghat Pump Canal,Deokali Pump Canal, Zamania Pump Canal, Saryu Pump Canal,Kwano Pump Canal etc. are proposed to be completed during XII Plan. By completing all these projects potential restoration of 1958.88 Th.Ha. will be achieved. This will minimize the gap between potential creation and its utilization.
[ 79 ]
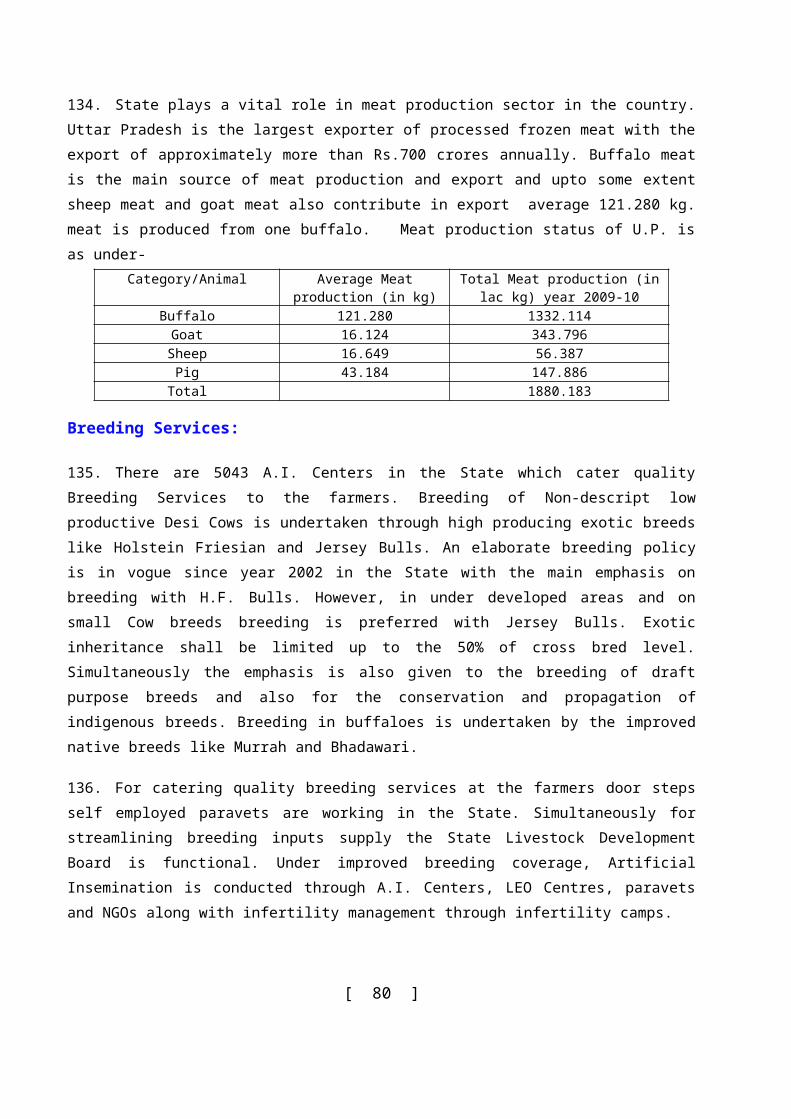
U.P. Water Sector Restructuring Project
207. Some of irrigation systems are very old. Their performance efficiency has continuously deteriorated due to reduction in their conveyance, deferred maintenance and non-existence of modern management tools. Besides, modernization of canals system, modern discharge measurement equipments, modernization of regulation gates etc. have not been taken up. The main objective of U.P. water sector restructuring project is modernization of canal system and also to promote automation works as in other parts of the world.
208. Project Report & Implementation Plan of U.P. water sector Restructuring Project Stage –II has been prepared for above works. Approx. cost of the project is Rs.4643.00 crore . The benefitted districts in this project are as under:-
Ghaghra-Gomti Basin-Barabanki, Raibareli, C.SJM.Nagar, Sultanpur, Azamgarh, Faizbad, Mau, Jaunpur and Ghazipur.
The development work has been proposed in 9.04 Lakh ha. area of Haidergrah Branch (km.22.98 to tail), Dariyabad branch & Sultanpur branch system.
Bundelkhand Region-Banda, Hamirpur, Mahoba, Chitrakoot Dham and Lalitpur
The development work proposed in 7.35 Lakh ha. Area of Ken canal system, birma sub basin,Barua dam canal system, Jamini dam canal system.
DETAILS OF GRANT RELEASED BY GOI UNDER AIBP TO UTTAR PRADESH (Rs in Crores)
Year Budget Provision Required Grant Grant received Total balanceGrant
1 2005-06 674.2033 168.5508 133.1280 35.42282 2006-07 850.9400 212.7330 162.8152 49.91783 2007-08 871.1900 217.7975 131.6200 86.17754 2008-09 1001.1242 278.9537 253.5972 25.35655 2009-10 932.4600 275.9810 238.5240 37.45706 2010-11 1876.2915 599.0554 432.7382 166.31727 2011-12 1424.1600 537.6313 208.9685 346.6628
Total 7630.3690 2290.7000 1561.3911 747.3116
Irrigation potential creation and its utilization
209. Till March 2011 irrigation potential created through major & medium and minor irrigation projects is 124.31 lakh ha., whereas actual irrigation recorded in the year 2010-11 is 58.15 Lakh ha.
210. Thus there is gap of 66.16 Lakh ha. in irrigation potential created and utilized. Some of the important reasons for underutilization and actual irrigation are given below-
Some of the major canal system of the state like Upper Ganga Canal, Eastern Yamuna Canal, Agra Canal, Lower Ganga Canal, Gandak Canal System, Sarda Canal and Belan Canal System are approximately 60 to 100 year old. Because of inadequate maintenance, these systems have deteriorated considerably. The actual irrigation on these systems is therefore going down.
[ 80 ]
The cropping pattern as envisaged in the original project is not being adopted in the field. This is resulting in inequitable water consumption in tail portion of canals. The actual cropping pattern is different from that adopted in the project report so utilization of the irrigation potential is not realistic. More water consuming crops are adopted especially in head reaches, the command area in tail reaches are deprived of their due share of irrigation.
Out of 60 main dams in the state, 10 dams are 50 years old and have been distressed due to different reasons. The storage capacity of the reservoirs are being reduced resulting in less availability of water in canals which adversely affect the irrigation.
The efficiency of electric motors is reduced due to its long usage in major pump canals. The electric motors cannot run continuously since the electric supply is not stable with required voltage.
In some cases the system were originally designed for protective irrigation, where as now a day’s adoption of high yielding variety of seeds require more water depths resulting in reduction in irrigated area. Changes in land use pattern have also resulted in command areas and consequently the irrigated area has also got reduced.
The distributaries and minors are cut by the farmers, unauthorized outlets and bunds are fixed in smaller channel resulting in drawl of more water and also wastage of water in upper reaches rendering the tail reaches completely dry.
It is being observed that additional irrigation potential is created through ongoing major and medium irrigation projects. But guls are not constructed by CADA (Command Area Development Authority) in time simultaneous with creation of potential. Thus there is a gap in new potential created and its utilization.
The irrigation projects are planned on 75% dependability of designed irrigation supplies. Thus it is in built that for 25% of the period(in one hundred sequence) the water requirement for full irrigation potential will not be met and even if designed cropping pattern are followed there will be a lag in unutilized potential irrespective of the extent of field channels.
Due to unavoidable circumstances water supply for industrial requirement have to be made on priority basis from irrigation schemes and therefore cause curtailment in irrigation supplies and results in reduced irrigated area.
Water conservation through lining of canals
211. Surface water in the canals of the state is limited. Most of the storage dam sites on rivers are in Nepal. Construction of such reservoirs is not possible without consent of Nepal. So due to limited availability of water in canals of the state it is important to save water for further use. For this in the first stage Rs.300.00 crore has been proposed for lining of 60 km. Canals, Schemes of water conservation through lining of canals will also continue in the subsequent years.
[ 81 ]
Regional Imbalance
212. To reduce regional imbalance 20 projects in Eastern region, 20 projects in Bundelkhand Region, 2 projects in Central region and 9 projects in Western Region have been proposed of which main projects are as follows:-
Eastern Region
213. In this region Bansagar project, Saryu canal, I/c of Bhopauli pump canal restoration of Sarda sahayak project, Sone pump canal, Azamgarh & Shahganj branch, Tanda pump canal, Dohri ghat pump canal, Deokali pump canal, Zamania pump canal, Tons pump canal, Saryu pump canal and Kwano pump canals are in progress. Kanhar irrigation scheme and restoration of Gandak canal system are proposed for funding under AIBP .
Bundelkhand Region
214. In this region Kachnauda dam, , Arjun Sahyak project, Lahchura Dam, Lower Rohani Dam, Utari Dam, Jamrar Dam, Pahari Dam, Bhaurat Dam, are in progress. Virat sagar dam,Panchand dam, Ken Betwa link project, Sukhnai Barrage,Baghen dam,Dhurawara dam,Bandai dam, Bhawani dam are proposed. Restoration of Chillimal pump canal and Augasi pump canal which are in progress are proposed to be completed during XII Plan.
Central Region
215. In this region 2 projects namely restoration of Dalmau-B pump canal and restoration of Hardoi branch are proposed to be completed during XII Plan .
Western Region
216. In this region Madhya Ganga canal stage-II, Badaun irrigation scheme, Panchand dam, new Jasrana canal project, modernization of Agra canal stage-II, Hathni Kund Link channel stage-II, restoration of Lower Ganga canal, raising and restoration of right bank of upper Ganga canal from km.30.00 to 165.00 parallel Hindan cut projects have been proposed to be completed during XII Plan .
Participation of Private Sector
217. For participation of private sector in irrigation projects “Participatory water management set, 20 Feb. 2009” has been prepared. In the second stage operation and maintenance works will be transferred to water user associations who will also be responsible for water tariff and revenue collection.
[ 82 ]
Private Minor Irrigation
218. Water is the principal resource determining, agriculture, horticulture, animal husbandry, dairy, drinking, and industrial production. Development of irrigation facilities is the only alternative to optimally utilize the land after rainy season. During, the last three decades there has been enhanced pace of development of irrigation facilities through minor irrigation schemes by mainly exploiting ground water resource. These schemes provide assured irrigation which is essential to grow high yielding varieties, have very low gestation period, require less, capital investment, easy maintenance without any govt. expenditure on repair and maintenance.
219. As per statistical data 2010 the status of irrigation through various sources in the state as on 31.3.09 is as follows;
Sl.No. Sources Lakh Hect. Percentage
(a) Canals 26.67 19.85(b) State Tube Wells (Govt. Tubewell) 3.70 2.76(c) Private Tube Wells/ Boring 92.33 68.72(d) Other Sources 11.65 8.67 Total (Net Irrigated Area) 134.35 100.00
220. Other sources include Tank, Ponds, Dug wells which are the sources of private Minor irrigation itself. Hence total net irrigation by private minor irrigation is 103.98 lakh hect. which is 77.39 percent of the total net irrigated area of the State. Therefore private minor irrigation works are contributing more than three-fourth of the net irrigated area of the State. Minor irrigation sources provide assured and timely irrigation to the agricultural land of farmers because of being fully under their control. The installation project cost is less and also their operational and maintenance cost is comparatively lower which does not cause any burden on state exchequer. These sources do not cause problem of displacement of inhabitants during the course of their construction and are not normally affected by natural calamities such as water logging and flood etc. Minor irrigation projects take less time in their construction, installation, make better use of local resources, cause lesser water loss because of being closer to non irrigated area and above all they are an excellent example of public private partnership.
221. As far as inception of minor irrigation programme is concerned, it begins with the general body meeting of village panchayat and the work is undertaken on the basis of proposals passed by this panchayat. The programme is implemented for all needy farmers, who are eligible and there is no discrimination as regards caste, creed, religion, faith, sex etc. Thus minor irrigation programme starts from the root level, draws its strength from grassroots and servers all sections of agrarian society.
222. The irrigation potential through M.I schemes proposed to be achieved during XI th five year plan was 24.33 lac. ha.. However the likely achievements during XIth plan is 22.22 lac ha. out of which 0.27 lac.ha.is from surface water schemes and 21.96 lac.ha. from ground water schemes. Surface water schemes include mainly small tanks, check dam. Ground water schemes include privately owned dug wells, dug cum bore wells, shallow and deep/medium tube wells.
[ 83 ]
223. At present the ground water recharge is one of the important activity of Minor irrigation Programme. Minor irrigation Department also conducts Census of Minor irrigation works at five-seven years interval. This scheme is centrally sponsored. First Census was done in 1987, the second in 1994, the third in 2001, the fourth Census of MI works (base year 2006-07) has been completed, the result is awaited. The statistics of shallow tubewells constructed under private minor irrigation programme as per last census report and thereafter are following-
{Nos.in lac} Year No.of Shallow
Tubewellscumulative N0s.
2000-01 - 35.252001-02 0.67 35.922002-03 0.72 36.642003-04 0.54 37.182004-05 0.58 37.762005-06 0.61 38.372006-07 0.58 38.952007-08 0.67 39.622008-09 0.50 40.122009-10 0.25 40.372010-11 0.42 40.792011-12 0.55 41.34
Status of Private Minor Irrigation
224. At the onset of the first five year plan 14.44 lakh hectare irrigation potential was available through different private minor irrigation sources. At the end of X th five year plan 170.59 lakh hect. irrigation potential was created and during XI th plan 22.23 lakh.hectare is likely to be achieved. In the state, plan wise achievement of irrigation potential is tabulated below:-
Sl. No.
Plan Period
irrigation potential Created (In Lakh hectares)
During Plan Period
Depreciation @ 1%
Net
(i) 2000-01 - - 158.97
(ii) 2001-02 3.61 1.58 161.00
(iii) 2002-03 3.83 1.61 163.22
(iv) 2003-04 2.92 1.63 164.51
(v) 2004-05 3.41 1.64 166.28
(vi) 2005-06 3.65 1.66 168.62
(vii) 2006-07 4.00 1.68 170.59
(viii) 2007-08 4.94 1.71 173.82
(ix) 2008-09 3.73 1.74 175.81
(x) 2009-10 2.40 1.76 176.45
(xi) 2010-11 4.56 1.78 179.25
(xii) 2011-12 6.51 1.79 183.97
[ 84 ]
225. Statistics of different existing Private Minor irrigation works in the state as on March, 2011 is tabulated below:-Sl. No. Item Unit Total 1. Dug Wells Cum Bore well Nos. 128075 2. Pump set on Surface Water ‘’ 27908 3. Shallow Tube well " 4079074 A. Electric Shallow Tube Well ‘’ 490289 B. Diesel Shallow Tube well ‘’ 3487294 C. Others " 101491 4. Deep Tube Wells ‘’ 25198 5. Medium Deep Tube well " 25730 6. Artisan Well ‘’ 846 7 . Checkdam 2149 8. Community Blast Well ” 442 9. Dr. Bhim Rao Ambedkar Tubewell ” 1370 10. Dr. Ambedkar Community ” 542
Facilities extended to the farmers during XITH Plan
226. To promote the minor irrigation development, there has always been some kind of assistance from Government in the form of subsidy, financial and technical assistance from the concerned departments. Apart from providing technical expertise following financial assistance were also provided to the farmers.
In free boring scheme subsidy on boring construction for small, marginal and SC/ST farmer is being provided @ of Rs. 5000, Rs. 7,000 and Rs. 10,000 respectively.
Subsidy is provided for installation of pumpset based on unit cost of Pump set (Rs. 18,000 as per NABARD norms) in following manner.
Small farmers- 25% or upto a limit of Rs. 4,500/-,
Marginal farmers. 331/3% or up to a limit of Rs. 6,000/-
SC/ST farmers- 50% or upto limit of Rs. 9,000/-
Achievement
Subsidy is being provided for the construction of Deep Tube well by heavy rigs in hard and deep strata of U.P. @ 50 % of project cost or a maximum limit of Rs. 1,00,000 per tube well. In the case of failure of boring only 10 % or a maximum of Rs. 1000 whichever is less is charged from the cultivators and rest is borne by the Govt.
Subsidy is being provided for the construction of Medium Deep Tube well by small rigs/mechanized units in U.P.@ 50% of project cost or a maximum limit of Rs. 85000/- per tube well. In the case of failure of boring only 10 % or a maximum of Rs. 1000 whichever is less is charged from the cultivators and rest is borne by the Govt.
In Jalaun, Agra, Mainpuri and Etawah districts, subsidy at the rate of 50% up to the maximum of Rs. 5,000 and Rs. 15,000 is admissible on Artesian wells constructed by hand boring sets and rig machines respectively.
[ 85 ]
In hard & rocky areas of Jhansi, Banda, Lalitpur, Hamirpur, Agra, Allahabad, Mirzapur, Sonebhadra and Chandauli districts subsidy at the rate of 50% up to a maximum of Rs. 7,500 is admissible for the constructions of Tubewells by inwell Rigs. In case of failure of boring only 10% subject to a maximum of Rs. 400/- is charged from the cultivators and rest is borne by the Govt.
In hard rock areas of Bundelkhand division & Allahabad, Varanasi, Sonebhadra, Agra and Mirzapur districts subsidy @ 50 % subject to a maximum of Rs. 5,000 is admissible on construction of blast wells and 50 % subject to maximum of Rs. 20 per hole is provided on deepening of wells.
All category of farmers of hard rock areas of Allahabad and Bundelkhand area are given 25% subsidy for installation of Pump set/Tube wells subject to a maximum limit of Rs. 3,000.
Subsidy on Community Tube well scheme to a maximum limit of Rs. 4.28 lakh under Dr. Bhim Rao Ambedker and 50% i.e. to a limit of Rs. 2.14 lakh under Dr. Ambedker Community Tubewell schemes.
Community Blast Well (under RIDF-XV) are being constructed in rocky blocks of & districts upto a limit of Rs. 5.585 lakh.
Checkdams are being constructed as community work in which 100% assistance is being provided.
Status of Ground Water Development
227. Region wise details of ground water balance are given below:-Region Net GW
availability for all uses
(ha-m)
Annual draft for all uses (ha0mm)
Net GW availability for future
irrigation (ha-mm)
Stage of Development (%)
Present After 5 years
1 Western 2578525.47 2048924.55 520600.92 79.46 89.462 Central 1456433.52 957849.35 498584.17 65.77 75.773 Eastern 2541031.07 1679114.28 861916.79 66.08 76.084 Bundelkhand 442299.91 192548.08 249751.83 43.53 53.535 Total 7018289.97 4878436.26 2139853.71 * 69.51 79.51
* Out of this 1.95 million ha-m is available for irrigation purpose.
228. It is projected that the future development will be at the rate of 2 percent and after five year the stage of development will be 79.51 percent. The above table also indicates that level of ground water development in Bundelkhnad region is comparatively low. Thus there is sufficient scope of ground water development barring over exploited /critical and semi critical blocks. Out of 821 blocks in the state, 37 blocks are in over exploited, 13 in critical category and 88 blocks are in semi critical category. The noteworthy feature is that out of 37 over-exploited blocks, 35 fall in western U.P. Most of the critical and semi critical blocks are located in western and central U.P.
[ 86 ]
Shallow Tubewells (Free Boring)
229. State’s statistics goes on to show that there are 216.68 lakh operational holdings in the state out of which there are 166.59 lakh marginal (76.8%) and 30.87 lakh (14.2%) small holdings, These small & marginal holdings constitute about 61.3% of total area. To cater to the need of these farmes, It is proposed to execute 8,31,863 borings during 12th Five Year Plan including 2,06,875 borings for SC/ST farmers.
Deep Tube Well
230. This scheme is for all category of farmers in regions where strata is deep & hard/tough. The depth of water strata is more than 60m. It is proposed to construct 6,250 Deep Tube Wells in areas having deep and tough/difficult strata for all categories of farmers during 12 th Five Year Plan. It is also proposed to increase subsidy under this scheme to 1.78 lakh as the same has not been revised since 1998.
Medium Deep Tube Well
231. This scheme is for all category of farmers in regions where water bearing strata is from 31-60m. It is proposed to construct 31,250 Farmer will be benefitted during the plan. Medium deep tube wells in alluvial areas where ground water aquifer is between 31-60 m is for all categories of farmers during 12 th
Five Year Plan. It is also proposed to raise subsidy to Rs. 1.53 lakh under this scheme as the same has not been revised since 2004-05.
Surface Pump Set
232. This scheme is for the benefit of all category of farmers in Bundelkhand Region and trans Yamuna blocks of Allahabad District. It is proposed to benefit 2100 cultivators all over the state to exploit surface water sources. It is proposed to provide subsidy @ Rs. 9000/- to 200 SC/ST farmers and @ Rs. 6000/- to 1900 general category farmers.
Boring Godown
233. The following 19 District Head Quarter have no Godown for boring tools equipment and pipe etc. In these 19 districts boring godowns are required to be constructed – Bagpat, Gautam-Budha Nagar, Mahamaya Nagar (Hathrash), J.P. Nagar, Auraiya, Kannuj, Kaushmbi, Chandauli, Sonebhadra, Sant Ravidas Nagar, Ambedker Nagar, Balrampur, Shravasti, Kushinagar, Sant Kabir Nagar, Sidhrth Nagar, Prabhudh Nagar, Panchsheel Nagar and Bhim Nagar.
Ground Water Recharging / Checkdams
234. This scheme is in vogue in rocky & problematic areas, which serves dual purpose of irrigation as well as recharging of groundwater. In such areas for harnessing surface water besides ground water recharging. It is proposed that 920 check dams will be constructed during 12 th Five Year Plan, which will irrigate about 18400 hect. of cultivated land and recharge the deficient aquifers to nearly 4500 ha-m.
Monitorable Target:
[ 87 ]
235. It is proposed to create additional irrigation potential of 17.90 lakh hectare during 12 th Five Year plan while the tentative cumulative achievement at the end of 11th Five Year Plan is 183.97 lakh hect.
The proposed investment of Rs. 9347.25 crore in this 12 th Five Year plan will add Rs. 4393.55 Crore additional income to farmers by way of additional agricultural production during 12 th
Five Year Plan.
The additional food gain production will be 40.00 lakh M.T. during 12 th Five Year plan and that of fodder will be 40.00 lakh M.T.
The employment generation from private Minor irrigation schemes is about 666.57 lakh mandays during 12th Five Year Plan.
Private Investment
236. Private Minor irrigation Works are maintained and owned by cultivators themselves, Subsidy is provided to them as a catalyst agent. The main programme of Private Minor irrigation is, installation of Shallow Tube Wells for which about 1/3rd is provided as subsidy hence 2/3rd investment is done by cultivators themselves in cash or through Institutional Finance. The detail of private investment in each programme is given below:-
Item Per Unit Rate 12th Five Year Plan
Total Cost
Subsidy (in Rs)
Private Investment
(in Rs)
Total Targat
Private Investment (Lakh Rs)
1- Small & Marginal farmers Programme (Free Boring Scheme) General category (boring)
10000 7000 3000 800000 24000
I Gen. H.D.P.E Pipe Distribution 6000 3000 3000 200000 6000Ii General categary(pump set) 22000 6000 16000 200000 32000Iii S.C.P/T.S.P(boring) 10000 10000 0 200000 0
Iv S.C./S.T. H.D.P.E Pipe Distribution
6000 3000 3000 40000 1200
V S.C.P/T.S.P(pump set) 22000 9000 13000 40000 5200
Total Small & Marginal farmers Programme
68400
2- Deep Tube Well 488000 178000 310000 30000 930003- Medium Tube Well 396000 153000 243000 80000 1944004- Inwell Boring 50,000 25000 25000 1000 2505- Surface Pump set 22,000 9000 13000 20000 26006- Dr. Ambedakar Community Tube
well Schemes500000 500000 0 5000 0
7- Dr. Bhimarao Ambedakar Tube well Schemes
500000 250000 250000 5000 12500
Total 371150
Strategy of XIIth Plan
[ 88 ]
237. India is one of the countries that will be adversely affected because of climate change. The approach to the Twelfth Five Year Plan suggests co-ordinated and synergized actions of all relevant sectors.
238. An effort has been made to initiate programmes under National Action Plan for Climate Change (NAPCC) consisting of eight missions. The department's endeavor under two of its Missions may be summarized as below-
National Mission for Enhanced Energy Efficiency
239. The Mission covers many aspects on Enhanced Energy Efficiency. The improvement in the field of pumping efficiency is one sector in which the department can contribute favorably in the National Mission. There were 40.79 lakh Tubewells in the State till March'2011, 87% of them diesel operated, which have low efficiency. All out efforts will be made to increase overall efficiency in this sector by way of suitable selection of agricultural pumpsets, suction & delivery pipes, foot valves, refluxe-valves, bends elbows and so on. Training programmes will be organized at department's training centre of Minor irrigation and Water Use. The Training programme will also be organized at district level. The electrically driven tubewells/pumpsets are more efficient as compared to those run by diesel. With this in view, separate provision @0.68 lakh per tubewell on deep and medium deep Tubewell is being made in the plan so that earmarked amount could be utilized for energisation and the project is completed in time and delivers its committed benefits.
National Water Mission
240. The National Water Mission aims to promote the integrated management of water resources and increase water use efficiency by 20%. Water losses are too many in kachcha channels used by farmers, for irrigation from tubewells and on the field. It has been decided to take appropriate steps to overcome the problem of water losses and to enhance end-use efficiency by at least 20%. With this in view, separate provision for conveyance system (HDPE pipe) has been made on tubewell constructed on shallow/deep boring. This will certainly help in bridging the gap between irrigation potential created viz a viz utilized.
The main features are-
Creation of additional irrigation facility /infrastructure through Pvt. MI programmes based on PPP model.
Attracting substantial private investment by providing financial assistance as an catalyst for the construction of these schemes.
To overcome ground water depletion, construction of checkdam and Artificial recharge project are proposed to be taken up by which aquifer will be recharged with about 5100 Ha-m water annually.
Reducing gap between irrigation potential creation and utilization by providing pipe water distribution system.
[ 89 ]
To execute special programme of Minor irrigation works in the areas which are deprived of irrigation facilities on account of difficult geological conditions and topography of the area such as Rocky and Ravinous areas of the State. In the areas suitable Minor irrigation Works will be constructed.
Minor irrigation schemes are assisted by Government in the form of subsidy. The subsidy provided by the Government is about 50% of the cost of project. The subsidy rates are not revised at present cost for the last many years. Therefore it is essential to revise subsidy rates. The details of subsidy in different Minor irrigation schemes are given below. The present subsidy rate is also mentioned in col.-3, which is under consideration of the Government. The revised rates have been taken in to consideration for 12th Five Year Plan.
Subsidy on energization of Deep & Medium Deep Tubewells
Energization of tubewells not only results in saving in their operational cost, increased overall efficiency of pumping system, enhancement in agriculture production and eco-friendly environment.
241. The benefit may be summarized as below-
The cost of running a diesel tubewell even in a conservative note is about 6 times that of a electrical Tubewell.
A diesel tubewell emitts about 375KG Carbon-di-oxide and about 1500 KG Sulphur-di-oxide causing pollution level to rise
Reduction in the import bill of costly crude oil and saving in the form of precious foreign exchange.
Existing and Proposed Subsidy Rate of Different Minor irrigation SchemesSchemes Present Cost
(in Rs.)Present
Subsidy Rate (in Rs.)
Proposed Subsidy Rates
(in Rs.)1 Shallow Tube Well General Farmer
(i) Shallow Tube Well(Free Boring) 10000.00 7000.00 7000.00(ii) H.D.P.E. Pipe Water Distribution System 6000.00 0.00 3000.00(iii) Pump Set Installation 22000.00 6000.00 6000.00
SC/ST Farmer (i) Shallow Tube Well(Free Boring) 10000.00 10000.00 10000.00(ii) H.D.P.E. Pipe Water Distribution System 6000.00 0.00 3000.00(iii) Pump Set Installation 22000.00 9000.00 9000.002 Deep Tubewell (i) Deep Tube well 400000.00 100000.00 100000.00(ii) H.D.P.E. Pipe Water Distribution System 20000.00 0.00 10000.00(iii) Energisation 68000.00 0.00 68000.003 Medium Deep Tubewell (i) Medium Deep Tube well 308000.00 75000.00 75000.00
[ 90 ]
Schemes Present Cost (in Rs.)
Present Subsidy Rate
(in Rs.)
Proposed Subsidy Rates
(in Rs.)(ii) H.D.P.E. Pipe Water Distribution System 20000.00 10000.00 10000.00(iii) Energisation 68000.00 0.00 68000.00
4 Dr. Ram Manohar Lohia Tubewell (SCP) 500000.00 428000.00 500000.00
5 Dr. Ram Manohar Lohia Tubewell(General) 500000.00 214000.00 392000.006 Surface Pump set 25000.00 3000.00 9000.00(SC)
6000.00(Gen)
Deep Tube well- At Present subsidy rate is Rs. 1,00,000/- per T/W (since 1982) and Proposed subsidy rate for 12th Five Year Plan is Rs. 1,78,000/- in which Rs. 10,000/- for distribution pipe & Rs. 68,000/- electrification.
Medium Deep Tube well- At Present subsidy rate is Rs. 85,000/- per T/W (since 2004) and Proposed subsidy rate for 12th Five Year Plan is Rs. 1,53,000/- in which Rs. 68,000/- for electrification.
Dr. Ram Manohar Lohia Tubewell (SCP)- At present subsidy rate is Rs. 4,28,000/- per tubewell (since 2008) and Proposed subsidy rate for 12th Five Year Plan is Rs. 5,00,000/- per tube well.
Dr. Ram Manohar Lohia Tubewell (GEN)- At present subsidy rate. Rs. 2,14,000/- per tubewell (since 2008) and Proposed subsidy rate for 12th Five Year Plan is Rs. 3,92,000/- per tube well.
Surface Pumpset- At Present subsidy @ Rs.6000/- per set for General and @ Rs. 9000/- per set for(SC) farmar.
Tubewell By Inwell Boring – At Present subsidy rate is Rs.7500/- per well and Proposed subsidy for 12th Five Year Plan for construction of Tubewell by Inwell boring is Rs. 25,000/-
State Minor Irrigation
242. Under the state minor irrigation, State tubewells are the area’s assured means of irrigation where construction of gravity canals is not feasible and in areas left out of command of such canals. Tubewells may also be used for conjunctive use of surface and ground water to increase intensity of cropping and productivity of different crops. Construction of tubewells takes short gestation period, provide quick irrigation facilities to area under their command. As per policy of the State Government, tubewells are constructed in the areas belonging to SC/ST , minority community and marginal farmers, who are not capable of constructing their own source of irrigation. State Minor Irrigation works can broadly be classified as follows:-
State Tubewells, Minor Lift Canals and Other Minor irrigation works such as Bundhies, Check Dams, Small bandhs.
[ 91 ]
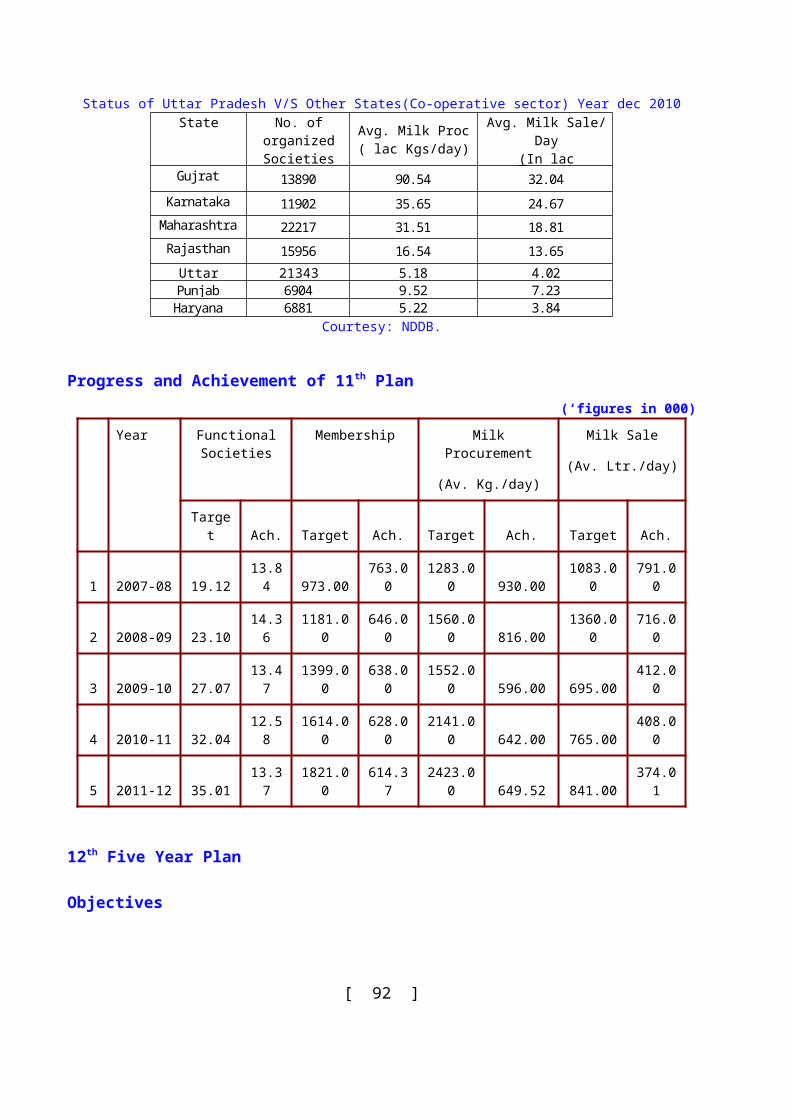
Present Status
243. The total irrigation potential created in the state through State Minor irrigation works, in the pre-plan period was 4.82 lac hectares. The state continued to lay stress on developing the irrigation potential through State Minor irrigation works during different plan periods. As a result, the irrigation potential through State Minor irrigation works increased from 4.82 lac hectares to 39.55 lac hectares at the end of Eleventh Five Year Plan. Thus during the plan periods i.e. upto Eleventh Five Year Plan, irrigation potential by State Minor irrigation works has increased by 820 percent.
Creation Of Irrigation Potential In Twelfth Plan
244. An outlay of Rs 2933.36 Crores for Twelfth Five Year Plan is proposed. Against the above outlay, the corresponding creation of irrigation potential is 2.29lac(PPA) hectares.
Restoration Of Irrigation Potential In Twelfth Plan
245. In proposed outlay, the thrust is now being given on the restoration of existing infrastructure of State Minor irrigation works. In view of the above, priority is being given to improve/ modernise the distribution system on State Tubewells, reconstruction of failed tubewells, renovation of derelict guls of state tubewells and replacement of wornout equipments on the tubewells and use of latest technology for suopervision and data acquisition of state tubewells. Accordingly, projects are being got to-be sanctioned from NABARD for the restoration of existing irrigation system. In the Twelfth Five Year Plan 3.04 lac(P.P.A.) hectares of restoration of irrigation potential shall be achieved.
Status Of Ground Water Development
246. The present exploration of Ground Water in the state is about 70%. There is still a lot of scope of Ground Water exploration in the state. However the level of Ground Water Development is not same through out in the state. It is therefore necessary that the ground water development should be carefully planned and ground water recharge should be strengthened. Artificial recharge projects are also required to be given priority such as check dams, small bandhs, bandhis, roof top rain water harvesting schemes and storing redundand water of gravity flow canal, which is passed in drains,.
Conjunctive Use Of Water Resources
247. It is high time now that serious thinking is to be given for the conjunctive use of surface and ground water resources for optimum benefits on the basin wise or sub basin wise schemes. There are conflicting demands of water resources by its various users. The highest priority is required to be given to drinking water followed by irrigation and industry. Therefore, it has become necessary that the allocation of water resources to various users are done on the basis of their future assessments. The coordination between various users of water regarding exchange of basic data, pilot studies research & development,
[ 92 ]
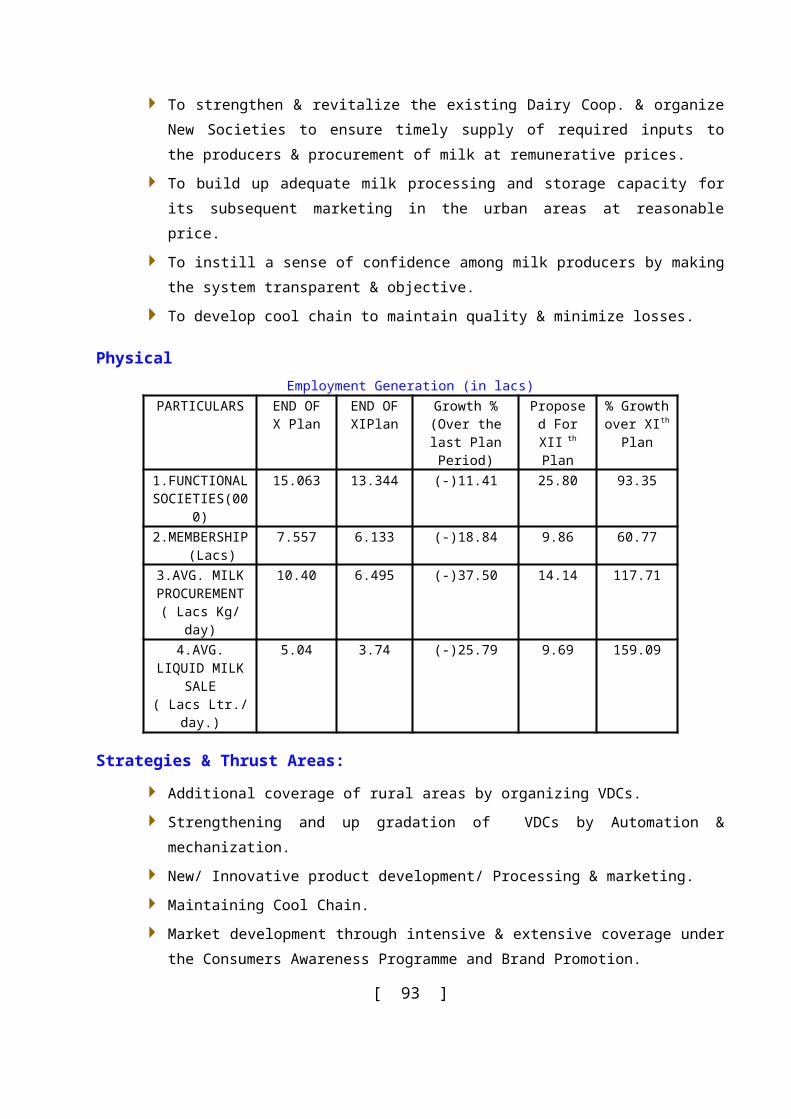
training, sustainable management of Ground Water etc., is all the more necessary. The state has recently constituted a “ State Water Resources Regulatory Authority “ which will play a key role in this matter.
Strategy For Twelfth Five Year Plan, 2012-2017
During Twelfth Five Year Plan an outlay of Rs. 2933.36 Crores has been proposed for completion of irrigation schemes.
Creation of 2.29 lac hectares (PPA) of irrigation potential has been proposed.
Emphasis has been given to restoration of already created irrigation potential during Twelfth Plan. restoration of 3.04 lac hectares (PPA) of irrigation potential has been proposed.
To increase the area under irrigation, restoration and upgradation of the already created assets have been proposed to be completed during Twelfth Plan.
Schemes have been proposed almost in all regions of the State especially in backward area to reduce regional imbalance.
Use of latest IT Technology like SCADA( Supervisory Control and Data Acquisition System) to opimize the use of existing infra structure.
During Twelfth Five Year Plan (2012-17) balance seven ongoing projects are likely to be completed. Besides this thirteen new projects have been proposed to be included in Twelfth Five Year Plan (2012-17) and are likely to be completed during the Plan period.
Construction of 5000 nos New State Tubewells
248. An Out Lay of Rs 1174.19 Crores is funded by Nabard for construction of 5000 New tubewells Projects each of 1 cusec capacity in during the Twlefth Plan creating 200.00 th. hectares of irrigation potential. These tubewells are of low cost, more beneficial to farmers and having 40 hectares of C.C.A. and it will be completed in year 2016-17.
Modernisation of 2400 failed State Tubewells
249. An outlay of Rs. 590.12 crores is financed by Nabard for reconstruction/ modernisation of 2400 State Tubewells under Dr Ram Manohar Lohia State Tubewell Reconstruction Projects during Eleventh plan. About 144.00 thousand hectares of irrigation potential is likely to be restored.
Modernisation of 14000 State Tubewells
250. An outlay of Rs. 1304.53 crores is financed by Nabard for modernisation of 8000 State Tubewells Projects during Twelfth plan. About 59.90 thousand hectares of irrigation potential is likely to be restored.
Construction of Saugai Pump Canal(10cusecs)
[ 93 ]
251. Total cost of Rs. 4.19Crores has been proposed for the construction of SAUGAI Pump Canal, capacity 10 cusecs, in District Chandauli. An irrigation potential of 0.272 thousand hectares t is likely to be created after completion of the project.
Construction of Dhan Kuwari Pump Canal 50 Cusec (funded by NABARD)
252. Total cost of Rs. 20.14 Crores has been proposed for construction of Dhan Kuwari Pump Canal 50 cusec is situated in district Chandauli. During Twelfth Five Year Plan and creation of 1.936 thousand hectares of irrigation potential is proposed.
GROUND WATER
253. Ground water is a vital resource, providing 80 to 90 % of drinking water supplies and almost all the industrial needs of the State. Growing dependence and unregulated use of ground water has eventually put an adverse impact on the resource domain in the form of unsustainable over-extraction and subsequent lowering of ground water levels in both rural and urban areas. Besides widespread depletion of aquifers, two more issues have emerged over the last two decades. In canal commands, reverse situation of rising water levels/subsurface water logging has emerged largely affecting the agricultural productivity. The other serious issue is ground water quality/ contamination which is posing new threat for potable water supplies and irrigation water.
National scenario
254. In India, net annual ground water resource availability (as on 31st March,2009) has been estimated as 396.06 bcm, while the annual ground water draft (withdrawl) has been estimated as 243.32 bcm with ground water development reaching to a stage of 61% in comparison to 58% as estimated on 31 st
March,2004. Based on the above estimation,802 Blocks/Talukas have been categorized as Over-exploited,169 as Critical and 523 as Semi-critical.
State Ground water Scenario:
The ground water development has increased from 69% in 2004 to 72% in 2009, crossing the threshold limit of 70%. As such, ground water stressed areas are continuously increasing. In 2004, stressed blocks were 138, which increased to 215 in 2009, with 76 blocks categorized as Over-exploited, 32 as Critical and 107 as Semi-critical.
The severity of ground water situation can be assessed from the fact that 629 out of 820 blocks are witnessing decline in ground water level. Situation in urban areas is still more grim, where water level is declining at much faster rate.
12th FIVE YEAR PLAN (2012-17)
[ 94 ]
Priorities and Goals:
Development of Ground water Regulatory Mechanism in the State.
Advanced approaches for resource study / investigation.
Mapping of Aquifers and Aquifer management.
Developing Area-specific technological inputs and formulation of comprehensive ground water recharge schemes for implementation in stressed blocks/cities.
Data management and development of Ground Water Information System.
Setting up of Ground water Recharge Scheme feasibility assessment Cell.
Development of Information, Education and Communication (IEC) skills / Capacity building for ground water conservation and management in stressed areas with assistance of NGO, RWA, academic Institutions.
Strengthening of ground water research and development sector in the State in project mode.
Major thrust areas :
Finalization and Implementation of Ground Water (Management and Regulation) Bill in U.P.
Effective Monitoring of Rain Water Harvesting and Ground Water Recharging
Other thrust areas
Validation of GW norms and formulation of Urban norms.
Formulation and Implementation of Comprehensive Recharge Projects.
District Ground water reports.
Development of Ground water estimation and strengthening of Ground water survey
Resource Monitoring and Assessment
Monitoring of ground water level on Hydrograph Stations.
Block wise estimation of Ground water resource (as per GEC -97 norms) with periodicity of 02 years.
Refinement/improvement of ground water draft norms.
Remote Sensing application to provide/refine the inputs. Isotope application for recharge studies.
Studies for evolving Urban ground water estimation norms.
[ 95 ]
Strengthening of Hydrograph Stations (both rural and urban)
Integration and preparation of Ground water Quality database/ mapping (both rural and urban)
Preparation of District Ground Water Reports for sustainable resource management
Ground water resource awareness and Development of IEC skills & Capacity building
Institutional and infrastructural strengthening of Ground Water Department
Ground Water legislation.
Procurement of Softwares/digital data & Technical upgradation.
Rain water Harvesting and Recharging
255. The priority areas for ground water recharge shall be 76 over-exploited blocks and 32 critical blocks categorised as stressed blocks, based on the 2009 ground water assessment data.
Review and updation of ground water recharge guidelines.
Formulation of Comprehensive Recharge projects for the stressed areas.
State level Monitoring of Rain Water Harvesting and Ground Water recharge Schemes.
Comprehensive strengthening of the department as Nodal Agency and formation of one Rain Centre, along with setting up of ground water recharge schemes feasibility assessment cell.
Impact Assessment of Rain water harvesting/recharging Schemes.
Preparation of G.I.S. based maps
Analysis and GIS based Ground water Mapping.
Establishing GWIS.
Aquifer mapping and Aquifer parameter tests
Aquifer mapping & preparation of Aquifer Management plans for stressed areas.
Aquifer Parameter tests: Aquifer Parameters tests on unconfined aquifers are proposed to be carried out to validate/refine various norms like specific yield/storativity, transmissivity etc. prevailing in different hydrogeological settings in collaboration with academic/ research institutes-
Flood Control
[ 96 ]
256. Uttar Pradesh has a geographical area of 240.93 lacs hactare, out of which flood prone area is 73.06 lacs. hactare. The protectable area is about 58.72 lacs. ha only which can be protected from flood and drainage congestion by construction of various flood management works. Financial input and physical out come during different plan periods may be seen in the following table :-
Marginal Embank-ments
Drains (Km.)
City protection works (no.)
No. of villages Raised
Land Protected (lac ha.)
Upto end of 4th five year plan 989 41 4500 6.165th five year plan 1389 12433 58 4500 11.566th five year plan 1666 12748 64 4500 13.677th five year plan 1811 23929 14.878th five year plan 1878 13015 15.409th five year plan 1918 13183 64 4511 15.7910th five year plan 2065 13496 65 4511 18.2911th five year plan 2973 14105 66 4511 21.1412th five year plan (Anticipated) 3708 14910 25.07
Note- All the figures are cummulative.
257. During the Eleventh Plan an Outlay of Rs. 1844.26 Crore was sanctioned against which an expenditure of Rs. 1572.18 Crore was incurred. During the Eleventh Plan. 263 km/ 645 km of Embankments were Constructed/ Restored, 609 km was Constructed/ Restored and 1274 Anti-Erosion works were completed. For the 12th Plan an Outlay of Rs. 6031.25 Crores has been proposed against which a target of 185 km/ 550 km Construction/ restoration of Embankments, 185 km/ 620 km of Construction /restoration of Drains and 924/790 construction/restoration of Anti Erosion works and 3.93 lac Hectare land is to be protected against flood and water logging. An outlay of Rs. 875 Crores has been sanctioned for the Annual Plan 2012-13.
258. Area affected due to flood in different states of the countryFlood affected area lacs of hect. protected area lacs
of hect.Balance area Percentage
India 346.16 186.39 54% 159.77 46%Uttar Pradesh 73.36/ 58.72
(Protected area)21.14 36% 37.58 64%
Bihar & Jharkhand 64.61/ 42.60 (Protect able area)
58%
Punjab 37.00 76%Rajasthan 32.60 -Haryana 32.50 77.6%West Bengal 37.66 76.50%Assam 31.50
259. From the above table, it is observed that the ratio of the protected area in U.P. is less in comparison to other States. In view of the growing population, it is essential to reclaim additional land for
[ 97 ]
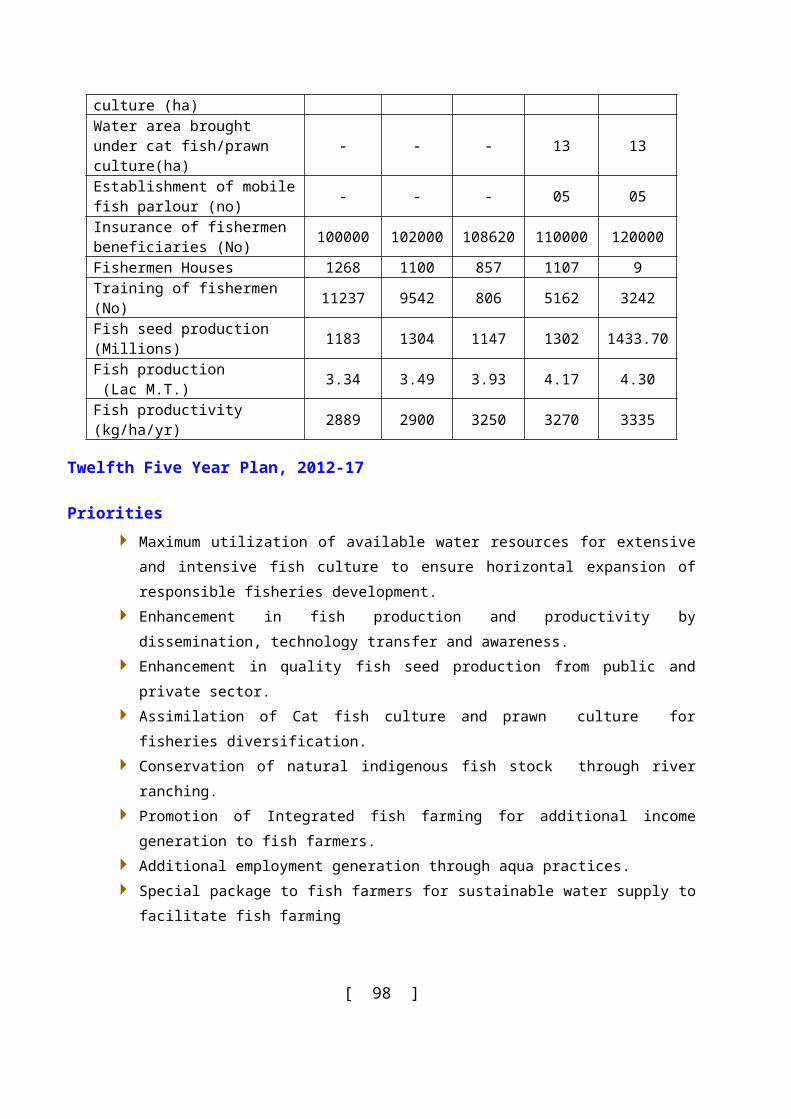
agriculture purposes by adopting protective measures against water logging and flood. On an average approximately 26.89 lacs hectare land is affected by flood every year and there is a total loss of Rs. 600 Crores (approx.) in U.P state due to loss of human life, cattle life and crops every year.
260. It is estimated that an amount of Rs. 15000.00 crore is required for flood management up to 2023. This estimate has been prepared on the comprehensive plan of Ganga basin prepared by Ganga Flood Control Commission and records available.
Name of Works Total CostConstruction of 5000 km. marginal embankment. 5500Anti-erosion works 4000Strengthening & Raising of old M.E. 2000Protection of old M.E 1500Remodeling of trunk drains 500Remodeling of other drains 1500
Total 15000
Command Area Development
261. In the early seventies, it was felt that there was a big gap between irrigation potential created and utilized and even in utilized areas the productivity , obtained under the irrigated areas were lower comparison to other countries . The main reason for low productivity was realized to be the lack of coordinated approach in irrigation water utilization at farm level. So as to attain optimum production from irrigated land. Keeping in view the problem, a centrally sponsored CADWM was initiated during 1974-75 in Uttar Pradesh .. The programme is being take up as a scheme on a sharing basis 50:50 between the Central & State Govt.
262. The main objective of Command Area Development Programme are as follows:-
To develop channels/field channels
Field intermediate & Link Drains
Reclamation of water logged area /drains/biomass
Renovation of canals of the capacity of 150 cusec and below
Formation of Water Users Association
Carry out adaptive trails and demonstration
IEC activities
Monitoring & Evaluatioin
263. Besides the above proportionate distribution of available water is being ensured by State Govt. through Osarabandi in Kulaba areas, which needs Central Assistance.
264. This programme is presently being operated by Central and State Govt. on the basis of 50:50 ratio But there is a need to request Govt of India to change the funding rate per hect. Rs. 20000 from the
[ 98 ]
present 15000 per hect. so that the percentage of pucca work is increased to at least 40% of the total area covered . There is no central assistance in Osrabandi but it is fully borne by the State Govt.
265. During the 12th Five Year Plan period (2012-17) the following works are proposed to be completed. Beneficiaries farmers participation will be ensured in planning so as to reflect their factual needs. Farmers have been made responsible for long use of created assets. Created assets are also being entered in revenue records. Osarabandi programmes are also being operated for Optimum and proper management of the water channels and field drains under the CADWM programme each and every field under the Kulaba Command area has been covered with the irrigation water and because of this increase in productivity has been possible and the irrigated area has also been increased by providing additional irrigation facility. As a result of proper utilization of chemical fertilizer and high yielding of seeds being used by the cultivators and multi cropping habits, cropping pattern has also changed. Evaluation studies of CADWM has shown the benefits in agricultural production and productivity are being ensured continuously under the CADWM Programme.
[ 99 ]