chapter - v profile of co-operative …shodhganga.inflibnet.ac.in/bitstream/10603/74278/13/13...118...
TRANSCRIPT

118
CHAPTER - V
PROFILE OF CO-OPERATIVE SPINNING MILLS OF
KHANDESH
5.1 Introduction
The researcher now is briefly describing the history of Khandesh region
and gives references of Marathi author Prof. Dr. Shashikant Sonawane who has
beautifully described the art, culture, tradition and socio-economic conditions
along with folk traditions. Here the researcher is also giving brief profiles of all the
five mills that are working in this area.
5.2 Cultural aspects of khandesh
Khandesh is a well known region for its prehistoric and rich heritage. Its
culture is not only ancient but also multifaceted. Many communities are happily
residing in the lap of this region. According to the book written by author: Prof.
Dr. Shashikant Sonawane, Pratap College, Amalner (Marathi article) and
translated by: Prof. Ravindrasingh A. Patil, Jalgaon into English the following
data related to cultural aspects of Khandesh has been described below.
5.2.1 Unified amalgamation of Arya, Non-arya and Mughal cultures----
Khandesh exhibits a homogeneous mixing of different cultures of Arya,
Non-arya, Buddha, and Mughals. Adivaasis (primeval tribes) inhabiting in and at
the foot-hills of Satpuda hills have retained their original customs and traditions
even today. Theirs is an ancient original culture and is older than the Arya invasion
in this country. A group of brave and nomadic tribe of Aryas called Ahir/Abhir
settled in this region and the subgroups of this tribe like Gurjar, Ahir, and Gavali
people changed the scenario of Khandesh for betterment.
119
The Mughal rulers-Akbar1, Jahangir, Shahajahan, Aurangzeb and Danial
and Farukhi Kings have left imprints of their culture and rule on Khandesh.
Satvahan rulers who were much impressed by Buddhist philosophy and the caves
and frescoes carved by them at Pitalkhore near Chalisgaon town of Jalgaon district
indicate the seamless amalgamation of cultures in this province.
5.2.2 Different theories of nomenclature of Khandesh (Source: History of
Khandesh region)
There exists difference of opinions about the nomenclature of this province
as Khandesh. Some of them are described as below;
I) Khandesh is the region of Ahirs who were devotees of Lord Krishna, who is
fondly called 'Kanha' by his devotees. They referred to this as country (desh) of
Kanha hence Kanhadesh which in due course of time became 'Khandesh'.
II) According to another view, Kanbai (Kandevi) is the deity of many
communities of this region. Hence country of Kandevi hence Kandesh which
further metamorphosed into 'Khandesh'. ----
III) Still some have different view as for many years this region was under control
of Muslim rulers who were known by the name 'Khan', therefore the country was
named as khandesh.-------------------------------------------------------------------------
IV) One more view states that as this region was the mine (locally called khan) of
human gems and jewels and mineral resources. Therefore it is named as
'Khandesh'.
Ref 1: Prof. Dr. Shashikant Sonawane – “History & Cultural Aspects of Khandesh”
and translated by: Prof. Ravindrasingh A. Patil,

120
5.2.3 Tribes, communities and dialects of Khandesh1
Tribes-Since remote past, pretty diverse kinds of tribes and communities
have been living very happily together in this land of Khandesh. Scheduled tribes
include Gond, Bhil, Konkana, Pavara, Gavit, Pardhi, Tadvi; Vimukta Jaties include
Kaikadi, Kanjarbhat, Gorbanjara, Lamani, Jogi, Pardeshi Bhamta, Ramoshi Vadar,
Chhapparband; Nomadic tribes include Gosavi, Bairagi, Sanyasi, Beldar,
Kingarivale, Ghisadi, Gopal, Dombari, Dhelari and other backwards include
Gavali, Kongadi, Rangari, Tambat, Sonar (Smiths), Bhavsar, Sutar, Pinajara,
Tamboli and Schedule castes include the people belonging to Mahar, Mang,
Chambhar, Mehatar (Scavengers) Jangam, Mochi, Dhor, Khatik, Garudi, Meghwal
communities. Along with them, the advanced communities too have been dwelling
since remote past.
Dialects-Major dialect of this region is the language (= wani) of Ahirs
called Ahir-wani which further abbreviated to 'Ahirani'. It is also known as
'Akkadibhasha'. Ahirani is represented by different sub-dilaects of different shades
such as Leva patidari, Gujarau, Bagalani etc.
Primeval dialects include Pavri, Dehwali, Bhili, Tadvi, and Warali. Other
lesser spread dialects include Vanjari, Bhavsari, Pardeshi, Beldari, Mehatari,
Panchali, Dhori, Mahari, Mangi, etc.
5.2.4 Aadivaasi (primeval) cultures of Khandesh
Roots of Aadivaasi cultures have gone deep in this soil. The need for
creation of Nandurbar as a special Aadivaasi district reflects this very fact. The
aadivaasis residing in the hills of Satpuda are the surviving successors of Mohenjo
Daro and Hadappa cultures.
Ref 1: Prof. Dr. Shashikant Sonawane – “History & Cultural Aspects of Khandesh”
and translated by: Prof. Ravindrasingh A. Patil

121
Their life style reflects their relationship with the very original culture of
this country. "Dab" in the Satpuda is the cultural capital of these aadivaasis. The
small paadas (= colonies, basti) located at remote places in Navapur, Nandurbar,
Dhadgaon, Saakri, Yawal, Raver, Chopada, are replicas of ancient cultures. Gonds
and Bhils are major residents. They include sub tribes such as Rajgond, Maharaja
Gonds, Pachhashi Gonds, Bada Gonds, Pavaras, Gavit, Tadvi, and Barelas. They
worship different deities like Devmogara Mata, Ganda Thaakur, Raja Fanay,
Mandhar Mata, Ravan, Meghnaath, Hirava Deva, Motha Dev, Waagh dev,
Kanasari mata, Holika. By worshiping natural icons of theses deities, they offer
prayers to the 'Mother Nature'. Even in the extreme conditions of famine or
calamities, they very enthusiastically celebrate Holi, Divali, Gandi Divali, Navai,
and Pola. Being mother dominated family culture, women's equality and freedom
is a highly valued characteristic.
5.2.5 Cultural Heritage of Khandesh1
Cultural and historical places in Khandesh region are the living flag posts
of Indian culture. Their preservation and conservation is the immediate need of the
time.
These include the deteriorating frescoes and caves of Pitalkhore near
Chalisgaon, Shendurni of Sindurasur; fort of Parola- the home place of freedom
fighter Rani Lakshmibai; Akrani Mahal of Dhadgaon; Hemadpant style temple of
Mudhaladevi at Vaghali; Padmalaya near Erandol; Swinging tower of Farkande,
Erandol; Hot water spring at Unapdev near Chopada; collection of articles used by
Sane Guruji placed in Pratap College, Amalner;
Ref 1: Prof. Dr. Shashikant Sonawane – “History & Cultural Aspects of Khandesh”
and translated by: Prof. Ravindrasingh A. Patil

122
Internationally famous art gallery of Keki Moose at Chalisgaon; Wooden
house of Bahinaabai Chaudhari at Asoda village are the living legends of rich
cultural heritage of Khandesh which need immediate attention for their
conservation.
5.2.6 Folk arts and artists of Khandesh1
Khandesh is a fond lover region of folk arts. Many Art loving groups are
scattered in this region. Large groups of Mahar and Mang communities inherit the
inborn spirit of traditional arts. It is aptly said in Khandesh- "Singing and dancing
(is found) at Mahar's house and reading, writing at Brahmin's". Recent times have
modified the aims and means of arts, but richness of traditional arts is still visible
in their homes. Now a day Mang, Mahar communities exhibit singing, dancing,
music playing, acting, through different folk arts such as folk plays, Tamashas
(traditional stage acts), orchestra, band party and banjo groups. This fact is evident
from the groups of Bhika Bhima Sangvikar and Anand Loknatya Mandal. Fugadi
dance of women in probably all communities, Bhillau dance of Bhill, and Viroba
dance of Dhanagars (Shepherds) are quite popular among the people.
5.2.7 Un-comparable mourning (sorrowful) Songs1
This is one more unique characteristic of Khandesh. These songs are very
rarely sung elsewhere. They are sung particularly by women. They are very
sensitive and heart touching.. When a woman is emotionally struck very severely
at heart such as the death of some near and dear one, her grief flows out
spontaneously in the form of a very touching song. This mourning song is not
printed or readily available in the market, but instant outburst of the sorrow of that
woman. It is effective enough to make a listener weep howsoever distantly related
or unrelated he or she may be.
Ref 1: Prof. Dr. Shashikant Sonawane – “History & Cultural Aspects of Khandesh”
and translated by: Prof. Ravindrasingh A. Patil
123
These songs are unique, wording is personalized and describe the noble
memories of the dead and also her intimate relationship with the dead one.
5.2.8 Some customs and traditions of Khandesh2
Most of the communities in Khandesh observe some traditions and
customs. Some of them are- playing Akhaji on the Akshayya-tritiya; to arrange
gondhal- jagaran during the marriage ceremony; munja (unmarried young boys)
bhojan; to arrange a marriage of frogs and procession of dhondi for praying rain
showers to pour down; festivals of gramdevatas like Mari mata, Khandoba; to beg
for holi; fixing of annual labour contracts for farming etc. Through these acts,
Khandesh culture sweetly whispers its past and present in our ears.
5.3 Political history of Khandesh
Khandesh District is a former administrative division of British India,
which included the present-day Jalgaon, Dhule and Nandurbar districts and a
portion of Nashik District in Maharashtra.
In the 18th and early 19th centuries, Khandesh was part of the Maratha
Confederacy, and was ruled by the Maratha Peshwa2. The district was annexed to
British India at the conclusion of the Third Anglo-Maratha War in 1818. A
southern portion of the district was detached to form Nashik District in 1869. In
1906 the district was divided into East Khandesh and West Khandesh districts,
with their capitals at Jalgaon and Dhulia (Dhule), respectively. East Khandesh was
later renamed Jalgaon District, and West Kandesh, later renamed Dhule District,
was split in Dhule and Nandurbar districts in 1998.
Ref 2: Prof. Dr. Shashikant Sonawane – “History & Cultural Aspects of Khandesh”
and translated by: Prof. Ravindrasingh A. Patil

124
5.3.1 Agriculture1.2
Major crops produced in this district are banana(In Maharashtra Jalgaon
ranks no.1 in banana production and most hector area of banana in Jalgaon 32,000
hector , cotton, sorghum, wheat, millet, lime, groundnut and sugarcane. jalgaon is
also known for its gold quality.
5.3.2 Demographics
According to the 2001 census Jalgaon district has a population1
of
4,224,442, roughly equal to the Republic of the Congo or the US state of
Kentucky. This gives it a ranking of 46th in India (out of a total of 640 ). The
district has a population density of 359 inhabitants per square kilometer
(930 /sq mi). Its population growth rate over the decade 2001-2011 was 14.71%.
Jalgaon has a sex ratio of 922 females for every 1000 males, and a literacy rate of
79.73%.
Jain Irrigation Systems is a multinational company, manufacturer of
Irrigation, Pipe, Plastic Sheet, Solar Energy Systems.
Supreme Pipes Ltd.
Raymond
Emco Transformers
Dal mills
Gold Ornaments- Well Known For Purity of Gold.
Ref 1: Gazette of Government of Maharashtra 2010 - 11
Ref 2: Gazette of Government of Maharashtra 2010 - 11

125
5.3.3 Demographics of Nandurbar district
As of 2001 India census, Nandurbar District had a population of
1,309,135, being 50.62% male and 49.38% female. Nandurbar District has an
average literacy rate of 46.63%: male literacy is 55.11%, and female literacy is
37.93%.
5.3.4 Languages
Languages spoken include Ahirani, a Kandeshi tongue with approximately
780 000 speakers, similar to Marathi and Bhili.; and Bareli Pauri, a Bhil language
with approximately 175 000 speakers, written in the Devanagari script. Others are:
Marathi, Hindi, Bhili, Gujar/Gujrathi and Kokani.
(Ref 1 & 2 : Census Report - 2011 – Government of India)
5.3.5 Industries
Total Registered Factories :346
Total Registered & running Factories :346
Cooperative Sugar Factories :3
Total Spinning Mills :2
Total Cooperative Societies 1400
Primary Agricultural Credit Societies Total :159
Members :47448
Cooperative Milk Societies :392
5.3.6 Agriculture
Main Crops Jawar, Wheat, Rice, Toor, Groundnuts, Chilly
Annual Crops Sugarcane, Cotton
Area Under Cultivation :2,53,413 Ha
Crop Pattern Kharif (approx. 800 villages), Rabi (approx. 130 villages)
Fruits :Mango, Sitaphal, Banana

126
5.3.7 Demographics
According to the 2011 census Nandurbar district has a population of
1,646,177, roughly equal to the nation of Guinea-Bissau or the US state of Idaho.
This gives it a ranking of 304th in India (out of a total of 640). The district has a
population density of 276 inhabitants per square kilometre (710 /sq mi) . Its
population growth rate over the decade 2001–2011 was 25.5%. Nandurbar has a
sex ratio of 972 females for every 1000 males.
5.1 Map shows location of Spinning Mills in Khandesh area
Source : Google Maps
The above map shows various talukas of three main districts of
Khandesh. On the north border of Khandesh, the states of Madhya Pradesh and
Gujarat are located. In the south Marathwada region of Maharashtra, on the
east the state of Andhra Pradesh is located while on the west the districts of
Nasik and Thane are bordering the Khandesh.
1
2
5
3
4

127
1. Jawahar Sahakari Soot Girni Dhule
2. Loknayak Jayaprakash Narayan Sahakari Soot Girni
3. Priyadarshini Sahakari Soot Girni Shirpur
4. J. T. Mahajan Sahakari Soot Girni Yawal (Bhusawal)
5. Deendayal Sahakari Soot Girni Pimpalner
5.3.8 Economy
In 2006 the Ministry of Panchayati Raj named Dhule one of the country's
250 most backward districts (out of a total of 640). It is one of the twelve districts
in Maharashtra currently receiving funds from the Backward Regions Grant Fund
Programme (BRGF).
5.3.9 Demographics of Dhule District
According to the 2011 census Dhule district has a population of 2,048,781,
roughly equal to the nation of Botswana or the US state of New Mexico. This
gives it a ranking of 223rd in India (out of a total of 640). The district has a
population density of 285 inhabitants per square kilometre (740 /sq mi) . Its
population growth rate over the decade 2001-2011 was 19.96%. Dhule has a sex
ratio of 941 females for every 1000 males, and a literacy rate of 74.61%.
5.3.10 Languages
Languages spoken include Ahirani, a Kandeshi tongue with approximately
780 000 speakers, similar to Marathi and Bhili; Bhilali, with 1 150 000 speakers;
and three mutually unintelligible Bareli languages: Bareli Palya, a Bhil language
with approximately 10 000 speakers centred in Madhya Pradesh Bareli Pauri, with
approximately 175 000 speakers, written in the Devanagari script; and Bareli
Rathwi, with approximately 64 000 speakers.
Major Agricultural Products: Groundnut, cotton, jowar, chillies, sugarcane.

128
5.4 Brief Profiles of Co-operative Spinning Mills of Khandesh
5.4.1 Jawahar Shetkari Sahakari Soot Girni Ltd.
Jawahar Spinning Mills is a large unit having 88704 spindles till date which
was established in 1985 with an initial capacity of 25000 spindles. This mill has
been awarded with a Gold Medal for outstanding performance this year by
Maharashtra State Co-op. Textile Federation Ltd. Company produce 100% cotton
Ring Spun Yarn in Carded and Combed variety suitable for both Knitting as well
as for Weaving. The company also exports to various parts of the world like
Europe, South East, Middle East and Far East Asia. The products manufactured
with our yarns ensure the consumer's satisfaction as regards comfort, easy-care,
elegance, lightness, durability and performance in extreme conditions. Our
company is focused on meeting our customer's individual needs. We exist to
provide superior customer satisfaction - developing solid, long-term relationships
with our customers.
Chairman : Shri . Kunal Rohidas Patil
Vice- Chairman : Shri. Yuvraj Tulsiram Choudari
Managing Director : Shri. Ashok Nanna
General Manager : Shri. B.K. Murlidhara
Production Manager : R. V Indapure
Manager (Prod. &Maint.) : S.S. Jankar
Spinning Superintendent : A. B. Zope
5.4.2 Products
The company produces 100% cotton Ring Spun Yarn in Carded and
Combed variety suitable for both Knitting as well as for Weaving. Both varieties
are available in Single and Double yarn form. In the year 2005, this mill started
producing slub yarn and fancy yarn. Within such a short span of time the special
quality slub yarn has created a niche‟ for itself in the market.

129
• Autoconed single & TFO Double Yarn ranging from NE 16S to 42 S for
Kintting as well as Weaving.
• Slub Yarn (MCE) ranging from NE 8 S to 40 S for Weaving.
5.4.3 Production Capacity:
At present Jawahar Shetkari Sahakari Soot Girni Ltd. Produces 55000
kgs./day out of which 35000 kgs. is Combed yarn and rest is Carded yarn. Total
Combed yarn production is 1050 tons/month.
5.4.4 Current Spindle & Production Capacity:
Present installed spindle capacity - 88704 Spindles. --------
Present Production - 1050 Tons/month.
The year 1985 saw the commencement of a Spinning Mill called Jawahar
Shetkari Sahakari Soot Girni Ltd., Dhule which was destined for steady and
consistent growth in the years to come. Jawahar Shetkari Sahakari Soot Girni Ltd;
was awarded First Prize for Accumulated Profit for the year 2008-09 by Chief
Minister of Maharashtra State Hon. Pritviraj Chavan.
This was the consecutive fifth Gold Prize for Girni. After inception in 1985
the mill worked on only carded yarns for the local markets. After 3 to 4 years the
mill planned for expansion in terms of spindleage increase and as well going for
multiple counts of yarn in both carded and combed. There was good response even
for export of the yarns to European, South East Asia and Neighboring countries.

130
5.5 Growth of capacity installation of spindles from 2002-03 to
2011-2012
Table 5.1 showing increased in Installed capacity from 2002 -03 to
2011-2012 in Jawahar Shetkari Sahakari Soot Girni Ltd.
Sr.no. Year Installed capacity
1 2002 – 03 32000
2 2003 – 04 32000
3 2004 – 05 36000
4 2005 – 06 45000
5 2006 -07 50000
6 2007 – 08 54000
7 2008 – 09 58000
8 2009 – 10 74000
9 2010 - 11 80000
10 2011 - 12 88000
Source : Annual Reports of the Mill
From 2002 – 03 to 2011 – 12 the mill has shown considerable increase in
spindleage capacity which increased from 32000 spindles to 88000 spindles.

131
Graph 5.1 showing increased in Installed capacity from 2002 -03 to 2011-2012
in Jawahar Shetkari Sahakari Soot Girni Ltd.
The mill which started in 1985 had a capacity of 25000 spindles, then
slowly the mill increased its spindleage year by year after 2002 – 03. In 2002 – 03
the total spindleage capacity was 32000. By the end of 2011 -12 the spindleage had
increased to 88000. So, from 2002 -03 to 2011 -112 the increase in spindleage was
more than 250%. Jawahar Sahakar Sooth Girni is one such mill which went for
expansion as per the requirement of production in the market. From the above table
and graph we see a disciplined growth in spindleage and so this mill exhibits
profitable potential over the research period.
0
10000
20000
30000
40000
50000
60000
70000
80000
90000
2002 – 03
2003 – 04
2004 – 05
2005 – 06
2006 -07
2007 – 08
2008 – 09
2009 – 10
2010 -11
2011 -12
Graph shows increased installed capacity from 2002 -03 to
2011 -12
Inst
all
ed C
ap
aci
ty
Year

132
Table 5.2 Shows Total production of yarn over ten years period from 2002 –
03 to 2011 – 2012 in Jawahar Shetkari Sahakari Soot Girni Ltd in kgs.
Sr.no. Year Total Production/day in kgs
1 2002 – 03 6800
2 2003 – 04 7800
3 2004 – 05 8500
4 2005 – 06 11600
5 2006 -07 14000
6 2007 – 08 16800
7 2008 – 09 28000
8 2009 – 2010 38000
9 2010 - 2011 42000
10 2011 - 2012 50000
Source : Annual Reports of the Mill
Graph 5.2 Shows Total production of yarn over ten years period from 2002 –
03 to 2011 – 2012 in Jawahar Shetkari Sahakari Soot Girni Ltd.
0
5000
10000
15000
20000
25000
30000
35000
40000
45000
50000
2002 – 03
2003 – 04
2004 – 05
2005 – 06
2006 -07
2007 – 08
2008 – 09
2009 – 2010
2010 -2011
2011 -2012
Graph showing Total Production/day in kgs from 2002
-03 to 2011-2012
Pro
du
ctio
n
Year

133
The production over the ten years period of yarn has increased multiple
times due to the multiple spin plan programs of the mill. Initially there were only
two or three carded yarns spun (mainly 34S and 35
S) which effected in low
production of only 6800 kg per day. From 2004 – 05 the mill adopted two different
lines for producing combed and carded yarns respectively. The combed yarns were
coarser in counts mainly 16S, 18
S and 20
S and the carded yarns were 10
S, 13
S, 16
S
and 20S. So, we see the production going up in terms of kgs. In 2007 – 08 third line
of production started for combed hosiery counts namely 26S, 10
S, 20
S and 30
S. So,
the production jumped from 16800 kgs to 28000 kgs. With modernization and
increase in spindleage capacity the production also increased to 42000 kgs in 2009
– 10 and 50000 kgs per day in 2010 – 11. The mill which started spinning medium
range counts slowly shifted to coarser counts with combing and hosiery types to
fulfill the export obligation successfully for which the mill was awarded the best
co-operative spinning mill in Marashtra state by Maharashtra State Co-operative
Spinning Mill Federation.
Table 5.3 shows cotton consumption for carded yarns and combed yarns over
ten yrs period 2002 – 03 to 2011 – 12 in kgs per day of Jawahar Shetkari
Sahakari Soot Girni Ltd.
Year Cotton for
carded
yarn
Cotton for
combed
yarn
Total cotton
consumed
Yarn
realization
Waste
percentage
2002 – 03 8500 - 8500 84% 16%
2003 – 04 9750 - 9750 85% 15%
2004 – 05 10625 - 10625 86% 14%
2005 – 06 14500 - 14500 84% 16%
2006 -07 12250 5250 17500 80% 20%
2007 – 08 12600 8400 21000 80% 20%
2008 – 09 17500 17500 35000 78% 22%
2009 – 10 19000 28500 47500 78% 22%
2010 - 11 21400 31100 52500 79% 21%
2011 - 12 18750 43750 62500 78% 22%
Source : Annual Reports of the Mill

134
The mill after inception in 1985 continued to produce cotton carded yarns
only up to 2005 – 06. After modernization the mill started slowly increasing
combed yarn production along with carded yarn production as shown above.
5.5.1 Production of process waste
As the production of yarn increased over the ten year period the
consumption of cotton also increased. As this mill concentrated on quality of yarn
there was no comprise on the norms of SITRA on waste percentage or yarn
realization for producing quality yarns. The yarn realization for carded yarns was
maintained at 88% while for combed yarns it was 78%.The distribution of
production of carded and combed was based on demand from the market for
particular counts.
As per the data available from 2004 – 05 when the mill actually went for
active modernization and expansion the distribution of production of combed yarn
and carded yarn was 60:40. When we look into the total production of the mill
from 2002 – 03 to 2011 – 12the production can be easily bifurcated into 60%
combed yarn and 40% carded yarn. From the above discussion the cotton
consumption can be calculated from the total production of combed and carded
yarns. So on and average the realization on total production is calculated to be
around 80%. So, the mill had 20% of process waste produced over the 10 years
period.

135
Table 5.4 shows total waste produced with category of wastes per day of
Jawahar Spinning Mills Dhule in kgs
Year B/R
droppings
Flat
strips
Comber
noil
Fan
wastes
Hard
waste
Total
2002 – 03 383 210 - 60 115 768
2003 – 04 439 419 - 65 155 1078
2004 – 05 478 422 - 62 163 1125
2005 – 06 652 584 - 72 195 1503
2006 -07 787 623 26 68 186 1690
2007 – 08 945 906 48 70 210 2179
2008 – 09 1560 1425 72 75 196 3328
2009 – 10 2135 1860 125 82 260 4462
2010 - 11 2362 1920 340 85 325 5032
2011 - 12 2812 2210 475 92 360 5949
Source : Annual Reports of the Mill
5.6 Loknayak Jayprakash Narayan Shetkari Sahakari Soot Girni
Ltd. Shahada
It was Registered in the year 1979, in Shahada (Maharashtra). Under the
Chairmanship of Shri Annasaheb P. K. Patil, the company has established its base
all over the world. The company majorly deals in Serbia, Croatia, Israel, Portugal,
Belgium, Bangladesh, China, Europe, etc. Furthermore, the company is known as
the prime Manufacturer, Exporter and Supplier of Cotton Yarn and Raw Cotton in
India.
5.6.1 Company Profile
Incepted in the year 1979, Loknayak Jayaprakash Naryan Sahakari Soot
Girni Ltd. (LJNSSGL) has carved a niche in the competitive yarn manufacturing
industry by manufacturing and supplying quality yarn material. Initially LJNSSGL
was commissioned in the year 1985-86 with 9576 spindles. They progressively
increased the spindles capacity to 33660 spindles.

136
Moving forward LJNSSGL has also established a new unit for the capacity
of 24480 Spindles with State of Art machineries from Rieter Spinning System and
Oerlikon Autoconers. Today the total Installed Capacity of Mills is 58140 Spdls
with a Production Capacity of 38MT/Day or 1140 MT / Month .
Its expertise and success in the industry is an outcome of our strict
adherence to uncompromising quality standards and a determination to offer our
clients with the high level of satisfaction. Our product array includes some of the
highly reliable yarn products that are globally known for their finest quality,
competitiveness and durability in garmenting. With functional reliability, the mill
is well equipped with machineries in their pursuit of quality excellence.
Under the able leadership of our mentor, Mr. P. K. Anna Patil, founder &
chairman LJNSSGL has geared to leave their footprints through technologically
advanced & clientele satisfaction. The success of LJNSSGL is attributed to sheer
business acumen and professional expertise of personnel‟s involved in all levels of
the production.
5.6.2 Management
Mr. P. K. Anna Patil. : Founder & Chairman of LJNSSGL aged 89 years
mills still actively participate in all the day today activities of organization and
motivated and guides their team members of LJNSSGL through his vast
experience. Still he has many dreams in his eyes that‟s have to become truth in
near future. Mill is established and progressed under dynamic leadership of
founder chairman.
In endeavor to provide the valuable clientele in textile with a quality range
of products and superlative services, LJNSSGL is enthusiastically lead by mentor
Mr. P. K. Anna Patil with his immense knowledge and accomplished leadership
qualities that serve as the guiding light for the team with prime focus on business
policies and ethical practices to deal with the clients.

137
Mr. R. D. Patil : Managing Director is qualified degree holder in B.Sc. &
MBA (Marketing) an dynamic & energetic leader with more than 22 years
experience as Managing Director is participating actively at various functions and
contributed total 30 years for the development of organization on day to day basis.
His sharp leadership, dynamic administrative power, foresights, thorough
market analysis and strong team building capacity provide firm foundation to the
organization. His personal relationship with all employees and supplier &
customers creates a family atmosphere in the organization. ----
5.6.3 Machinery Maintenance
A well qualified & experienced team of machine maintenance staff take
cares of all machineries & equipments through well planned preventive
maintenance activities and followed the schedules as suggested by machine
manufactures or SITRA. Moreover mill is equipped with all the necessary
maintenance tools & instruments required for in-house maintenance activity. All
maintenance fitters are well trained in their work and mill has arranged training
program in-house or outside as required for them.
5.6.4 Quality Assurance –
“A Planned and systematic pattern of all actions necessary to provide
adequate confidence that the Product optimally fulfills customers‟ expectations, i.e.
it is problem free and well able to perform the task it was designed for”.
LJNSSGL‟s in-house quality control department is well installed with
sophisticated and advanced technology based quality testing equipment. This
enables their yarn produced undergo rigorous quality tests on well-defined
parameters to ensure maximum benefits of the clients as under:
Concentrates on identifying various processes
Their interactions and sequence

138
Defining the objectives of each process
Identify the key results area and measures the results
Establishing the procedures for getting required results
Educating the people to implement the right procedures
Preparing SOP‟s to guide the people on work spot
Monitoring & measuring the performance
Taking suitable actions on deviations and continuously improving the
systems.
Team continuously monitor & measure the input and output of each
processes and product quality to achieve the desired results and whenever
it‟s deviate it‟s segregated as “Non-confirm” product and allowed to go
with fresh material.
5.6.5 Vision and Mission
Our mission is to offer total customer satisfaction and achieve leadership in
markets, providing value added services to our clients and assuring the quality and
integrity keeping clear focus on speed, efficiency and quality and hence we are
completely set and sound to take comprehensive challenges of future.
Name of Chairman : Shri Annasaheb P. K. Patil
Year of Establishment : 1979
Nature of Business : Manufacturer, Exporter & Supplier of cotton yarn
Market Covered : Serbia, Croatia, Israel, Portugal, Belgium,
Bangladesh, China & Worldwide
5.6.6 Cotton Yarn
Now-a-days cotton cloths are preferred over synthetic fabric because it is
environment friendly and comfortable to wear. The same way, we are also
reckoned as the prime Manufacturer, Exporter and Supplier of Organic Cotton
Yarn in India, under the brand name “JAY SOOT". Our Cotton Yarn is available in
20 to 60 types of variety, suitable for diverse industrial applications

139
5.6.7 Raw Cotton
The company is known as the major Manufacturer, Exporter and Supplier
of the premium Raw Cotton in India. Our Raw Cotton is carefully processed by the
expert professionals, with the help of latest technology. Furthermore, our Raw
Cotton is offered at the market leading prices to the global clients.-
Table 5.5 shows increased in Installed capacity of spindles from 2002 -03 to
2011-2012 in Loknayak Jayprakash Narayan Shetkari Sahakari Soot Girni
Ltd.
Sr.no Year Installed capacity
1 2002 – 03 33660
2 2003 – 04 33660
3 2004 – 05 33660
4 2005 – 06 33660
5 2006 -07 36400
6 2007 – 08 38200
7 2008 – 09 39300
8 2009 – 10 42400
9 2010 - 11 46160
10 2011 - 12 56880
Source : Annual Reports of the Mill

140
Graph 5.3 shows increased in Installed capacity of spindles from 2002 -03 to
2011-2012 in Loknayak Jayprakash Narayan Shetkari Sahakari Soot Girni
Ltd.
The mill which started in 1979 with a capacity of 9576 spindles, then
slowly the mill increased its spindleage to 33660 by the year 2002 – 03. In 2002 –
03 the total spindleage capacity was 33660. By the end of 2011 -12 the spindleage
had increased to 56880. So, from 2002 -03 to 2011 -12 the increase in spindleage
was more than 75%.
0
10000
20000
30000
40000
50000
60000
2002 – 03
2003 – 04
2004 – 05
2005 – 06
2006 -07
2007 – 08
2008 – 09
2009 – 2010
2010 -2011
2011 -2012
Graph showing increased in Installed capacity from 2002 -03
to 2011 -2012
Inst
all
ed C
ap
aci
ty
Year

141
Table 5.6 shows Total production of yarn over ten years period from 2002 – 03 to
2011 – 2012 in Loknayak Jayprakash Narayan Shetkari Sahakari Soot Girni Ltd. In
kgs
S.no Year Total Production/day in kgs
1 2002 – 03 6400
2 2003 – 04 7600
3 2004 – 05 9800
4 2005 – 06 11600
5 2006 -07 16000
6 2007 – 08 21800
7 2008 – 09 28000
8 2009 – 10 32000
9 2010 - 11 38000
10 2011 - 12 38500
--Source : Annual Reports of the Mill
Graph 5.4 shows Total production of yarn over ten years period from 2002
– 03 to 2011 – 2012 in Loknayak Jayprakash Narayan Shetkari Sahakari
Soot Girni Ltd. In kgs
0
5000
10000
15000
20000
25000
30000
35000
40000
2002 – 03
2003 – 04
2004 – 05
2005 – 06
2006 -07
2007 – 08
2008 – 09
2009 –
2010
2010 -2011
2011 -12
Graph showing Total Production/day in kgs from 2002 -03 to
2011-2012
Pro
du
ctio
n
Year
142
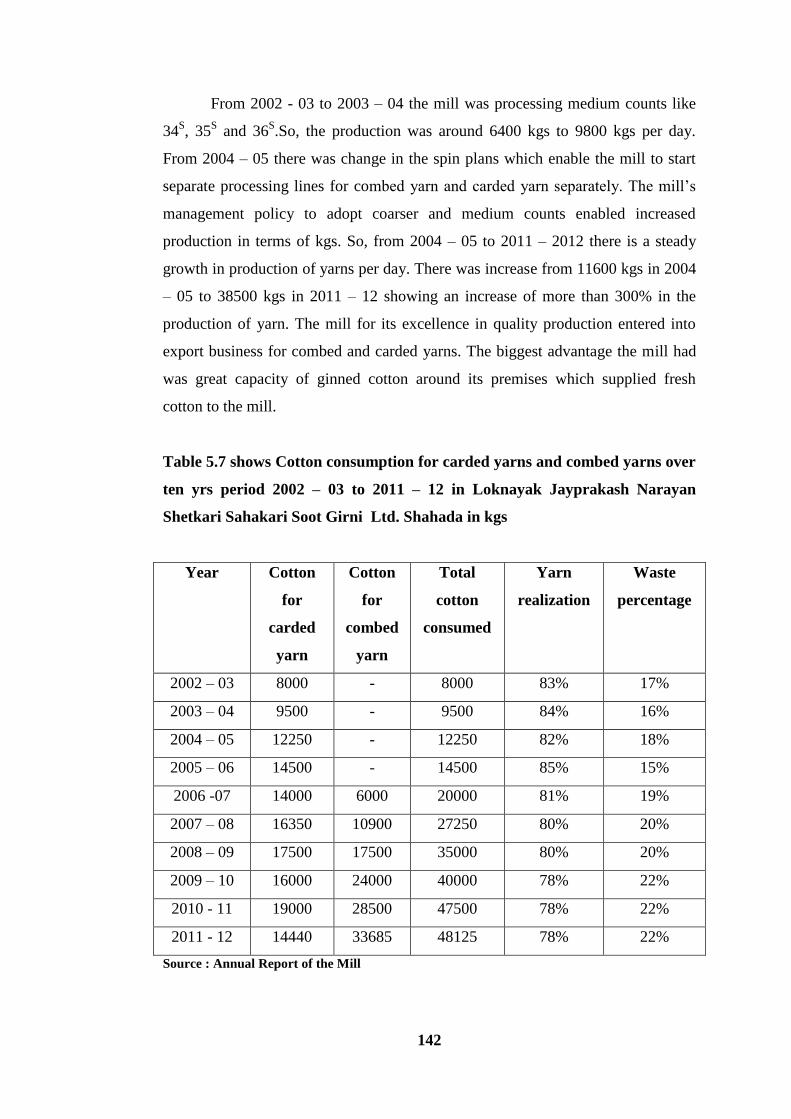
From 2002 - 03 to 2003 – 04 the mill was processing medium counts like
34S, 35
S and 36
S.So, the production was around 6400 kgs to 9800 kgs per day.
From 2004 – 05 there was change in the spin plans which enable the mill to start
separate processing lines for combed yarn and carded yarn separately. The mill‟s
management policy to adopt coarser and medium counts enabled increased
production in terms of kgs. So, from 2004 – 05 to 2011 – 2012 there is a steady
growth in production of yarns per day. There was increase from 11600 kgs in 2004
– 05 to 38500 kgs in 2011 – 12 showing an increase of more than 300% in the
production of yarn. The mill for its excellence in quality production entered into
export business for combed and carded yarns. The biggest advantage the mill had
was great capacity of ginned cotton around its premises which supplied fresh
cotton to the mill.
Table 5.7 shows Cotton consumption for carded yarns and combed yarns over
ten yrs period 2002 – 03 to 2011 – 12 in Loknayak Jayprakash Narayan
Shetkari Sahakari Soot Girni Ltd. Shahada in kgs
Year Cotton
for
carded
yarn
Cotton
for
combed
yarn
Total
cotton
consumed
Yarn
realization
Waste
percentage
2002 – 03 8000 - 8000 83% 17%
2003 – 04 9500 - 9500 84% 16%
2004 – 05 12250 - 12250 82% 18%
2005 – 06 14500 - 14500 85% 15%
2006 -07 14000 6000 20000 81% 19%
2007 – 08 16350 10900 27250 80% 20%
2008 – 09 17500 17500 35000 80% 20%
2009 – 10 16000 24000 40000 78% 22%
2010 - 11 19000 28500 47500 78% 22%
2011 - 12 14440 33685 48125 78% 22%
Source : Annual Report of the Mill

143
5.6.8 Applications
Apparel industry
Textile industry
Clothes manufacturing industries
5.6.9 Production of process waste
As the production of yarn increased over the ten year period the
consumption of cotton also increased. As this mill concentrated on quality of yarn
there was no comprise on the norms of SITRA on waste percentage or yarn
realization for producing quality yarns. The yarn realization for carded yarns was
maintained at 88% while for combed yarns it was 78%.The distribution of
production of carded and combed was based on demand from the market for
particular counts.
As per the data available from 2004 – 05 when the mill actually went for
active modernization and expansion the distribution of production of combed yarn
and carded yarn was 60:40. When we look into the total production of the mill
from 2002 – 03 to 2011 – 12 the production can be easily bifurcated into 60%
combed yarn and 40% carded yarn. From the above discussion the cotton
consumption can be calculated from the total production of combed and carded
yarns. So on and average the realization on total production is calculated to be
around 80%. So, the mill had 20% of process waste produced over the 10 years
period.
144
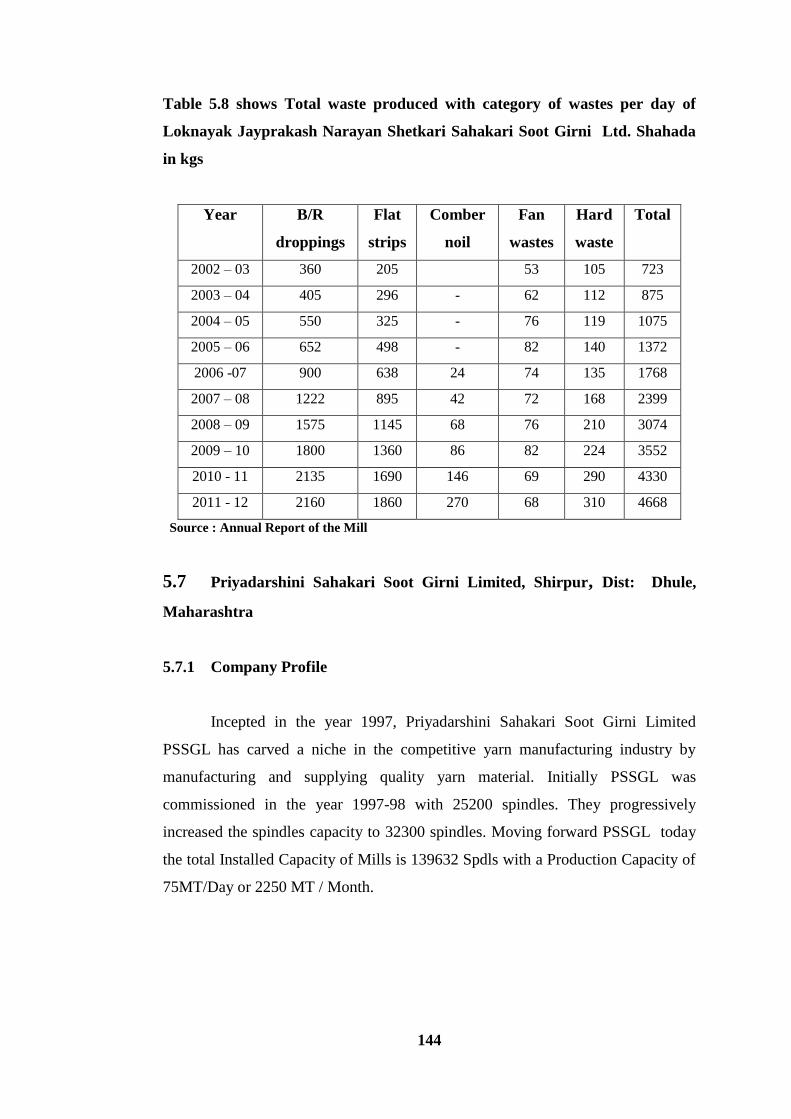
Table 5.8 shows Total waste produced with category of wastes per day of
Loknayak Jayprakash Narayan Shetkari Sahakari Soot Girni Ltd. Shahada
in kgs
Year B/R
droppings
Flat
strips
Comber
noil
Fan
wastes
Hard
waste
Total
2002 – 03 360 205 53 105 723
2003 – 04 405 296 - 62 112 875
2004 – 05 550 325 - 76 119 1075
2005 – 06 652 498 - 82 140 1372
2006 -07 900 638 24 74 135 1768
2007 – 08 1222 895 42 72 168 2399
2008 – 09 1575 1145 68 76 210 3074
2009 – 10 1800 1360 86 82 224 3552
2010 - 11 2135 1690 146 69 290 4330
2011 - 12 2160 1860 270 68 310 4668
Source : Annual Report of the Mill
5.7 Priyadarshini Sahakari Soot Girni Limited, Shirpur, Dist: Dhule,
Maharashtra
5.7.1 Company Profile
Incepted in the year 1997, Priyadarshini Sahakari Soot Girni Limited
PSSGL has carved a niche in the competitive yarn manufacturing industry by
manufacturing and supplying quality yarn material. Initially PSSGL was
commissioned in the year 1997-98 with 25200 spindles. They progressively
increased the spindles capacity to 32300 spindles. Moving forward PSSGL today
the total Installed Capacity of Mills is 139632 Spdls with a Production Capacity of
75MT/Day or 2250 MT / Month.

145
5.7.2 Products
Cotton Knitting Yarns , Cotton Ware, Cotton Weaving Yarns, Cotton Yarn
and Knities . Manufacturer and exporter of cotton weaving yarns, cotton knitting
yarns etc.
5.7.3 Fact Sheet
Year of Establishment : 1997
Nature of Business : Manufacturer, Exporter
Legal Status of Firm : Limited Liability/Corporation (Listed Company)
Number of Employees : 3500 People
Turnover : Upto US$ 0.25 Million (or upto Rs. 1 Crore Approx.)
Table 5.9 shows Total installed capacity of spindles over ten years period from
2002 – 03 to 2011 – 2012 in Priyadarshini Sahakari Soot Girni Limited,
Shirpur.
Source : Annual Reports of the Mill
S.no Year Installed capacity
1 2002 – 03 32300
2 2003 – 04 44300
3 2004 – 05 56400
4 2005 – 06 68500
5 2006 -07 80600
6 2007 – 08 92700
7 2008 – 09 104000
8 2009 – 10 116100
9 2010 - 11 124500
10 2011 - 12 139600

146
Graph 5.5 shows Total installed capacity over ten years period from 2002 – 03
to 2011 – 2012 in Priyadarshini Sahakari Soot Girni Limited, Shirpur.
The mill which was started in 1997 had a capacity of 25200 spindles. After
six months one ring frame of 1008 spindles and after another four months 12096
spindles were increased. By 2001 – 02 the mill had the capacity of 32300 spindles.
By the end of 2010 – 11 the spindleage capacity had increased to 139600. So, over
the ten year period the increased installed capacity of the mill is more than 400%.
This is also one of the leading and highly performing co-operative spinning mill in
Northern Maharashtra. This increase in installed capacity was due to
encouragement by the demand for yarn in the domestic and international markets.
0
20000
40000
60000
80000
100000
120000
140000
2002 – 03
2003 – 04
2004 – 05
2005 – 06
2006 -07
2007 – 08
2008 – 09
2009 –
2010
2010 -2011
2011 -2012
Graph showing increased in Installed capacity from 2002 -03 to
2011-2012
Inst
all
ed C
ap
aci
ty
Year

147
Table 5.10 shows Cotton consumption for carded yarns and combed yarns
over ten yrs period 2002 – 03 to 2011 – 12 Priyadarshini Sahakari Soot Girni
Limited, Shirpur in kgs,
Year Cotton
for
carded
yarn
Cotton
for
combed
yarn
Total
cotton
consumed
Yarn
realization
Waste
percentage
2002 – 03 8250 - 8250 84% 16%
2003 – 04 11000 - 11000 85% 15%
2004 – 05 12625 - 12625 84% 16%
2005 – 06 18250 - 18250 85% 15%
2006 -07 14350 6150 20500 82% 18%
2007 – 08 24450 16300 40750 80% 20%
2008 – 09 30000 30000 60000 80% 20%
2009 – 10 28000 42000 70000 79% 21%
2010 - 11 32000 48000 80000 78% 22%
2011 - 12 29440 68685 98125 78% 22%
Source : Annual Report of the Mill

148
Table 5.11 shows Total production of yarn over ten years period from 2002 –
03 to 2011 – 2012 in Priyadarshini Sahakari Soot Girni Limited, Shirpur in
kgs.
S.no Year Total Production/day in kgs
1 2002 – 03 6600
2 2003 – 04 8800
3 2004 – 05 10100
4 2005 – 06 14600
5 2006 -07 16400
6 2007 – 08 32600
7 2008 – 09 48000
8 2009 – 10 56000
9 2010 - 11 64000
10 2011 - 12 78500
Source : Annual Reports of the Mill
Graph 5.6 shows Total production of yarn over ten years period from 2002 –
03 to 2011 – 2012 in Priyadarshini Sahakari Soot Girni Limited, Shirpur in
kgs.
0
20000
40000
60000
80000
2002 – 03
2003 – 04
2004 – 05
2005 – 06
2006 -07
2007 – 08
2008 – 09
2009 – 2010
2010 -2011
2011 -2012
Graph showing Total Production/day in kgs from 2002 -03 to
2011- 12
Pro
du
ctio
n
Year

149
In the initial years from 1997 -98 to 2005 – 06 the mill was processing only
carded medium count yarns for the local markets so, the production was ranging
from 6600 per day to 16400 kgs per day. After 2005 – 06 the mill management
adopted different types of spin plans and started combed yarns along with carded
yarns depending on the demand from the yarn market. This change in policy for
producing combed coarser yarns enabled the mill to increase its production per day
to 32600 kgs. From 2006 -07 to 2011– 12 there is constant rise in production of
yarn per day. In 2011 – 12 the production per day was 78500 kgs., which is more
than 200% from 2006 – 07 production.
5.7.4 Production of process waste
As the production of yarn increased over the ten year period the
consumption of cotton also increased. As this mill concentrated on quality of yarn
there was no comprise on the norms of SITRA on waste percentage or yarn
realization for producing quality yarns. The yarn realization for carded yarns was
maintained at 88% while for combed yarns it was 78%.The distribution of
production of carded and combed was based on demand from the market for
particular counts. As per the data available from 2004 – 05 when the mill actually
went for active modernization and expansion the distribution of production of
combed yarn and carded yarn was 60:40. When we look into the total production
of the mill from 2002 – 03 to 2011 – 12the production can be easily bifurcated into
60% combed yarn and 40% carded yarn. From the above discussion the cotton
consumption can be calculated from the total production of combed and carded
yarns. So on and average the realization on total production is calculated to be
around 80%. So, the mill had 20% of process waste produced over the 10 years
period.

150
Table 5.12 shows Total waste produced with category of wastes per day of
Priyadarshini Sahakari Soot Girni Limited, Shirpur in kgs.
Year B/R
droppings
Flat
strips
Comber
noil
Fan
wastes
Hard
waste
Total
2001-02 -
2002 – 03 370 209 - 56 110 745
2003 – 04 495 329 - 66 125 1015
2004 – 05 568 419 - 78 145 1210
2005 – 06 820 695 86 190 1791
2006 -07 920 815 26 79 210 2050
2007 – 08 1835 1426 98 192 314 3865
2008 – 09 2700 2345 410 195 425 6075
2009 – 10 3150 2985 690 220 530 7575
2010 - 11 3600 3225 825 310 675 8635
2011 - 12 4416 3826 960 435 760 10397
Source : Annual Report of the Mill
5.8 J.T. Mahajan Co-operative Spinning Mills Yawal
5.8.1 Company Profile
This mill was started in the year 1993, J.T. Mahajan Co-operative Spinning
Mills Yawal started with 12500 spindles in 1993 and increased the spindleage to
25000 by the year 2000. This mill concentrated on cotton yarns of 34s and 36s for
supplying to local markets like Ichalkarnji, Bhiwandi, Malegaon and Burhanpur
(M.P.) From 2002 – 03 to 2011 – 12 the average production of yarn per day was 3
to 3.5 MT.
The company was started by Shri. J.T. Mahajan, well known political
personality who held ministerial positions in government of Maharashtra. This
mill did not take up modernization due to financial problems and during the
research study period of 2001 -02 to 2010 – 11 the mill was working under
conventional systems of machineries. The machineries were completely supplied
by LMW Coimbatore.

151
The waste collection methods in this mill were conventional and automatic
in nature. By 2010 – 11 the mill had 25000 spindles capacity with 3 to 3.5 MT per
day.
Table 5.13 shows Total installed capacity of spindles over ten years period
from 2002 – 03 to 2011 – 2012 in J.T. Mahajan Co-operative Spinning Mills
Yawal
S.no Year Installed capacity
1 2002 – 03 25000
2 2003 – 04 25000
3 2004 – 05 25000
4 2005 – 06 25000
5 2006 -07 25000
6 2007 – 08 25000
7 2008 – 09 25000
8 2009 – 10 25000
9 2010 – 11 25000
10 2011 - 12 25000
Source: Annual Reports of the Mill
This mill was started in the year 1993, J.T. Mahajan Co-operative Spinning
Mills Yawal started with 12500 spindles in 1993 and increased the spindleage to
25000 by the year 2000. The mill installed capacity of spindles was constant up to
2011 -12. There was no attempt to increase the spindleage capacity because the
management found difficult to manage and work full capacity of 25000 spindles
and get full production capacity.

152
Table 5.14 shows Total production of yarn over ten years period from 2002 –
03 to 2011 – 2012 in J.T. Mahajan Co-operative Spinning Mills Yawal
S.no Year Total Production/day in kgs
1 2002 – 03 2600
2 2003 – 04 2400
3 2004 – 05 2800
4 2005 – 06 2900
5 2006 -07 3100
6 2007 – 08 3300
7 2008 – 09 3600
8 2009 – 10 3000
9 2010 - 11 2600
10 2011 - 12 2400
Source : Annual Reports of the Mill
Graph 5.7 shows Total production of yarn over ten years period from 2002 –
03 to 2011 – 2012 in J.T. Mahajan Co-operative Spinning Mills Yawal in kgs
0
500
1000
1500
2000
2500
3000
3500
4000
2002 – 03
2003 – 04
2004 – 05
2005 – 06
2006 -07
2007 – 08
2008 – 09
2009 –
2010
2010 -2011
2011 -2012
Graph showingTotal production of yarn over ten years
period from 2002– 03 to 2011 – 2012
Pro
du
ctio
n

153
Over the ten years period from 2002 – 03 to 2011 – 12 the production of
the mill has been fluctuating from 2200 kgs per day to 3600 kgs of peak production
in 2007 – 08 and again falling down to 2400 kgs per day in 2011 – 12 This low
profile production is due to the management policy of producing single count of
medium range for supplying to local market. The other factors which contributed
low production were non-availability of raw material, labor and surplus capital for
purchase of raw material.
5.8.2 Production of process waste
As this mill did not undergo any modernization programs over the ten year
period the waste collected was very conventional in nature with labors employed in
various departments to collect the wastes from the machines. The yarn realization
in this mill was 80% to 82% and the process waste produced was 18% to 20% on
the total consumption of cotton.
Table 5.15 shows Total waste produced with category of wastes per day of J.T.
Mahajan Co-operative Spinning Mills Yawal in kgs
Year B/R
droppings
Flat
strips
Roving
waste
Fan
wastes
Hard
waste
Total
2002 – 03 140 120 32 18 26 289
2003 – 04 120 95 30 16 28 391
2004 – 05 190 115 35 19 32 391
2005 – 06 175 180 42 22 42 461
2006 -07 195 162 40 26 48 471
2007 – 08 220 182 46 30 62 54
2008 – 09 226 196 48 42 80 592
2009 – 10 195 165 39 38 76 513
2010 - 11 160 147 38 29 64 438
2011 - 12 180 153 37 32 62 464
Source : Annual Reports of the Mill
154
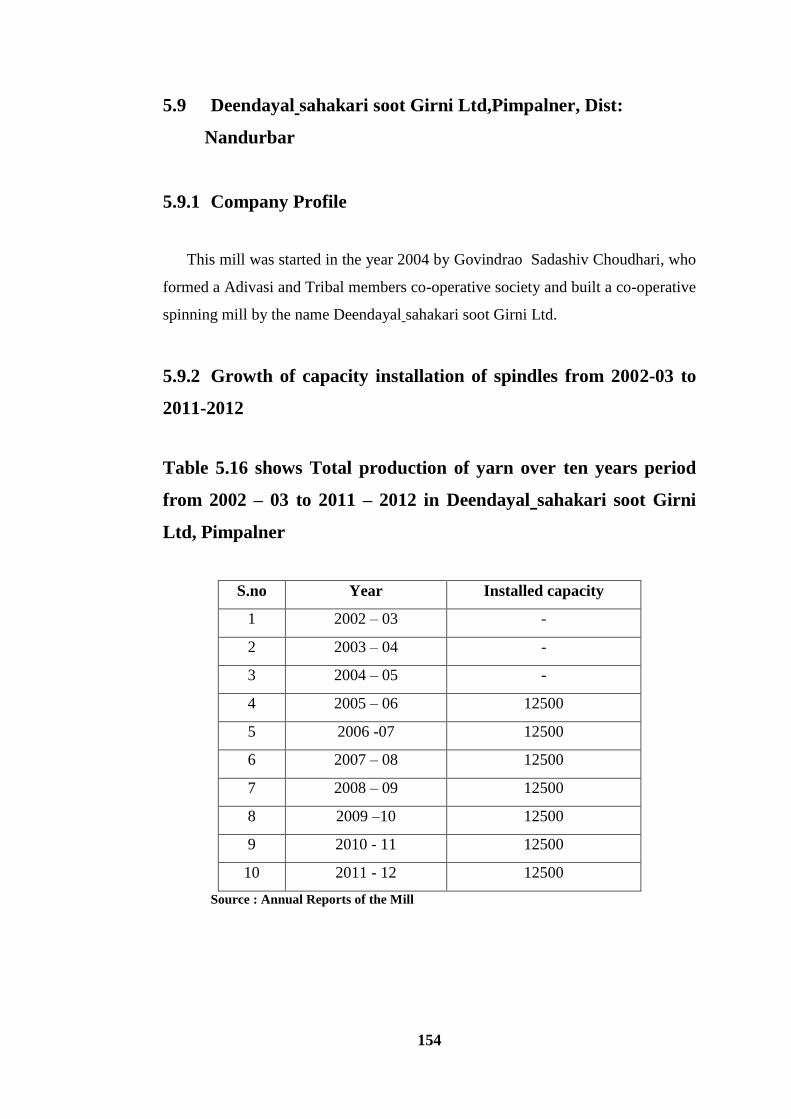
5.9 Deendayal sahakari soot Girni Ltd,Pimpalner, Dist:
Nandurbar
5.9.1 Company Profile
This mill was started in the year 2004 by Govindrao Sadashiv Choudhari, who
formed a Adivasi and Tribal members co-operative society and built a co-operative
spinning mill by the name Deendayal sahakari soot Girni Ltd.
5.9.2 Growth of capacity installation of spindles from 2002-03 to
2011-2012
Table 5.16 shows Total production of yarn over ten years period
from 2002 – 03 to 2011 – 2012 in Deendayal sahakari soot Girni
Ltd, Pimpalner
S.no Year Installed capacity
1 2002 – 03 -
2 2003 – 04 -
3 2004 – 05 -
4 2005 – 06 12500
5 2006 -07 12500
6 2007 – 08 12500
7 2008 – 09 12500
8 2009 –10 12500
9 2010 - 11 12500
10 2011 - 12 12500
Source : Annual Reports of the Mill

155
Table 5.17 shows Total production of yarn over ten years period
from 2002 – 03 to 2011 – 2012 in in Deendayal sahakari soot Girni
Ltd,Pimpalner in kgs
S.no Year Total Production/day in kgs
1 2002 – 03 -
2 2003 – 04 -
3 2004 – 05 1200
4 2005 – 06 1000
5 2006 -07 1100
6 2007 – 08 1300
7 2008 – 09 -
8 2009 –10 -
9 2010 - 11 -
10 2011 - 12 -
Source : Annual Reports of the Mill
Deendayal sahakari soot Girni Ltd,Pimpalner Started its production only in
2004 – 05. After a period of four years the mill found difficulty in continuing the
process due to various reasons such as feasibility, funds and raw material suppliers.
Over these four years the mill worked with 12500 spindles to produce 1000 kgs to
1300 kgs of medium count yarn namely 35S.
5.9.3 Production of process waste
As this mill did not undergo any modernization programs over the ten year
period the waste collected was very conventional in nature with labors employed in
various departments to collect the wastes from the machines. The yarn realization
in this mill was 80% to 82% and the process waste produced was 18% to 20% on
the total consumption of cotton.

156
Table 5.18 shows Total waste produced with category of wastes per
day of Deendayal sahakari soot Girni Ltd,Pimpalner in kgs.
Year B/R
droppings
Flat
strips
Roving
waste
Fan
wastes
Hard
waste
Total
2001-02 - - - - - -
2002 – 03 - - - - - -
2003 – 04 - - - - - -
2004 – 05 90 76 22 15 26 199
2005 – 06 86 62 20 12 24 204
2006 -07 90 72 20 12 28 222
2007 – 08 120 80 26 18 32 276
2008 – 09 - - - - - -
2009 – 10 - - - - - -
2010 - 11 - - - - - -
2011 - 12
Source : Annual Reports of the Mill
----------+++-----------