chapter%201%20 examples 2 2
TRANSCRIPT

Chapter 1Linear Functions Table of Contents
1.1 Solving Linear Equations
1.2 Using Data to Create Scatterplots
1.3 Fundamentals of Graphing and Slope
1.4 Intercepts and Graphing
1.5 Finding Equations of Lines
1.6 Finding Linear Models
1.7 Functions and Function Notation

Review of Linear Equations
What to expect
• In this chapter we are going to translate word problems into equations of lines
• We will then graph those lines and find useful properties of those lines
• We will then use those properties to analyze what is happening in the physical situation to give the numbers meaning

Golf Carts To Go sells refurbished golf carts in south Florida. The company has fixed costs of $26,000 per month for rent, salary and utilities. They can buy used carts and refurbish them for an average of $1,400 each. They sell the carts for an average price of $2500 each. Golf Carts To Go can only refurbish 55 carts a month.
a. Write an equation for the monthly cost of refurbishing n carts.
b. Write an equation for the monthly revenue from selling golf carts.
c. Write an equation for the monthly profit the company makes if they refurbish and sell n carts.
d. What is the profit of refurbishing and selling 25 golf carts?
1.1-24 Back to Table of Contents

Golf Carts To Go sells refurbished golf carts in south Florida. The company has fixed costs of $26,000 per month for rent, salary and utilities. They can buy used carts and refurbish them for an average of $1,400 each. They sell the carts for an average price of $2500 each. Golf Carts To Go can only refurbish 55 carts a month.
e. what is the fewest number of golf carts that the company can physically or reasonably make?
f. What is the most golf carts that the company can physically or reasonably make?
1.1-25 Back to Table of Contents

Equations for Business Models
• Costs = Variable Costs + Fixed Costs
– variable cost increase as I make/buy more of something
• cost of $.5 per phone case made
– fixed costs do not change no matter how much is made/bought
• rent, utilities, wages [sometimes], loans, ect.

Equations for Business Models
• Revenue = Price * Quantity
– this is how much money comes in from sales
– gross reciepts
Equations for Business Models
• Profit = Revenue – Cost
• Profit = Revenue – Variable Cost – Fixed Cost
– this is what is left over for the business
– how much was actually made

An equation for the total cost, C, in dollars for purchasing L lunch coolers is .
a. Create a table of points that satisfy this equation.Use 0, 50, 100, & 150.
1.3-29 Back to Table of Contents
45 3C L
Lunch Coolers Cost

An equation for the total cost, C, in dollars for purchasing L lunch coolers is .
b. Create a graph for the equation using your points. Label your graph with units.
1.3-2
45 3C L
10 Back to Table of Contents

Use the graph to estimate the slope of the line and determine if the line is increasing or decreasing.
y=x y=-x
11Back to Table of Contents

Use the graph to estimate the slope of the line and determine if the line is increasing or decreasing. Determine if it is “steeper” or “flatter”.
y=4x y= ¼ x
12Back to Table of Contents

Use the graph to estimate the slope of the line and determine if the line is increasing or decreasing. Determine if it is “steeper” or “flatter”
y=3x y= -⅓x
13Back to Table of Contents

Determine if the points given in the table all lie on a line.a.
1.3-514 Back to Table of Contents
x y
6 11
10 16
12 18.5
22 31
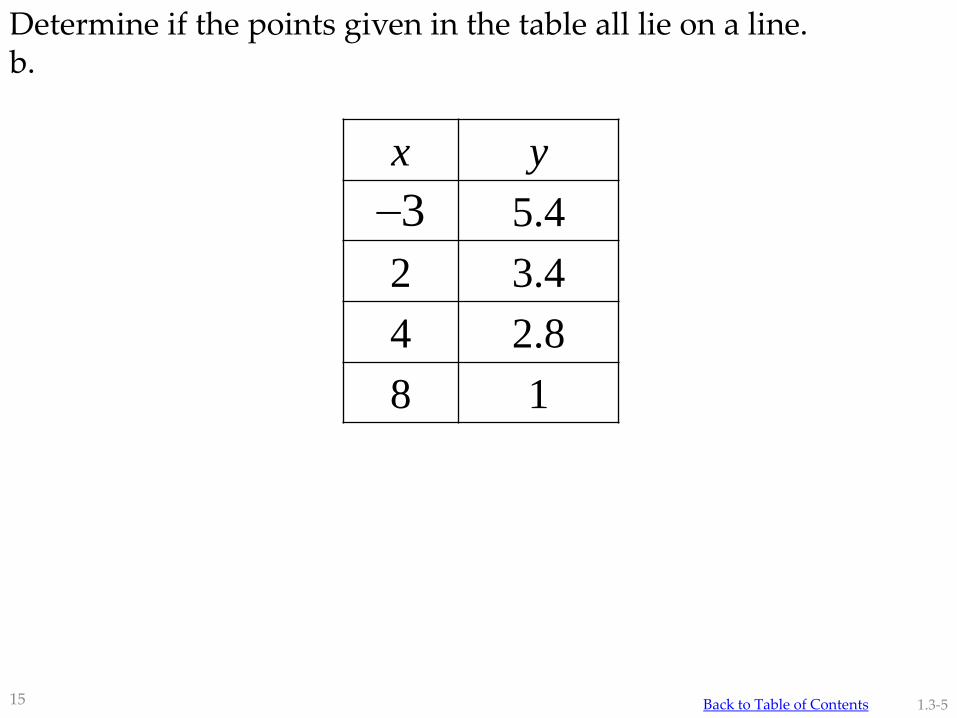
Determine if the points given in the table all lie on a line.b.
1.3-5
x y
5.4
2 3.4
4 2.8
8 1
3
15 Back to Table of Contents

1.3-616 Back to Table of Contents

Let be the total cost in dollars to produce p pizzas a day at a local pizzeria.
a. describe “C”
b. describe 4.5
c. describe “p”
d. describe 1200
1.3-7
4.5 1200C p
17 Back to Table of Contents

Let be the total cost in dollars to produce p pizzas a day at a local pizzeria.
e. Now that you now the Cost what might you ask?
f. How could you model it?
g. What math should you now perform to answer important questions
1.3-7
4.5 1200C p
18 Back to Table of Contents
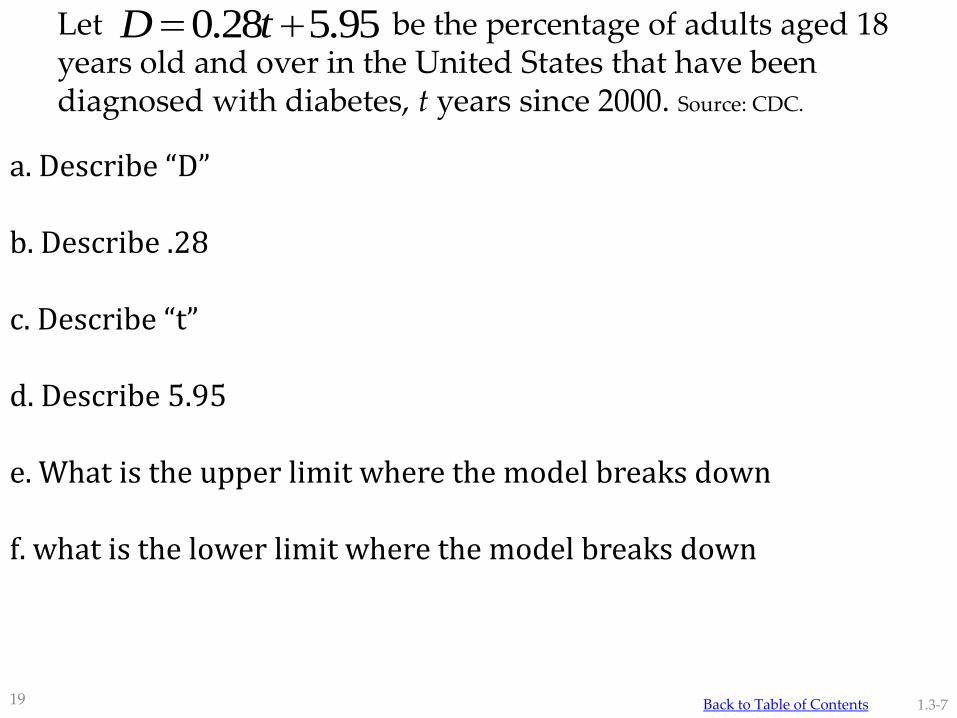
Let be the percentage of adults aged 18 years old and over in the United States that have been diagnosed with diabetes, t years since 2000. Source: CDC.
a. Describe “D”
b. Describe .28
c. Describe “t”
d. Describe 5.95
e. What is the upper limit where the model breaks down
f. what is the lower limit where the model breaks down
1.3-7
0.28 5.95D t
19 Back to Table of Contents
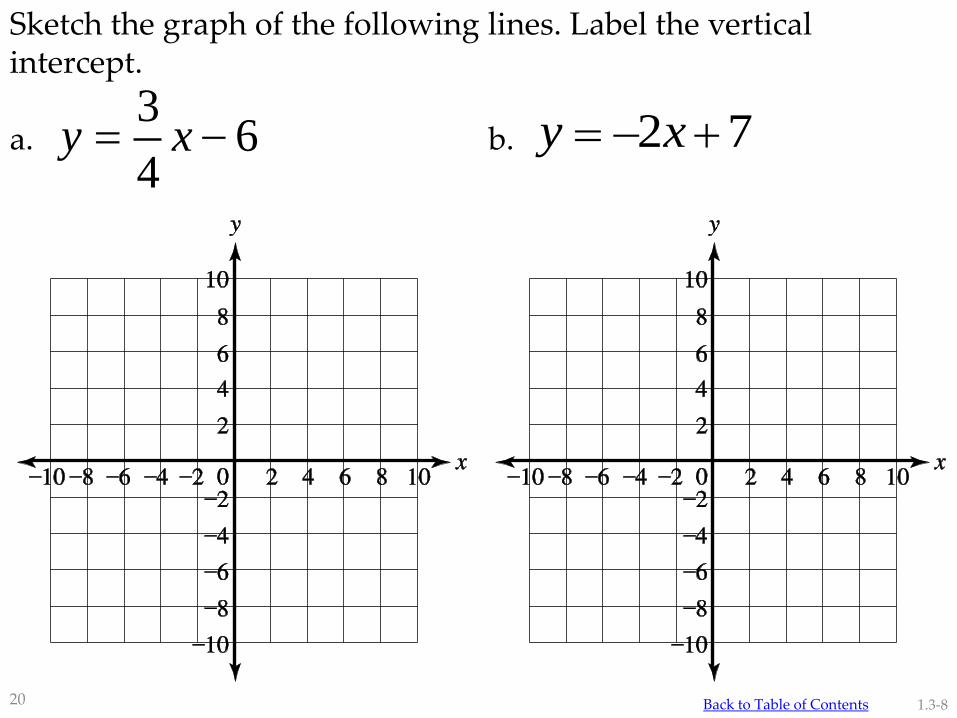
Sketch the graph of the following lines. Label the vertical intercept.
a. b.
1.3-8
36
4y x 2 7y x
20 Back to Table of Contents

Find the intercepts and graph the line
1.4-4
2 3 18x y
21 Back to Table of Contents
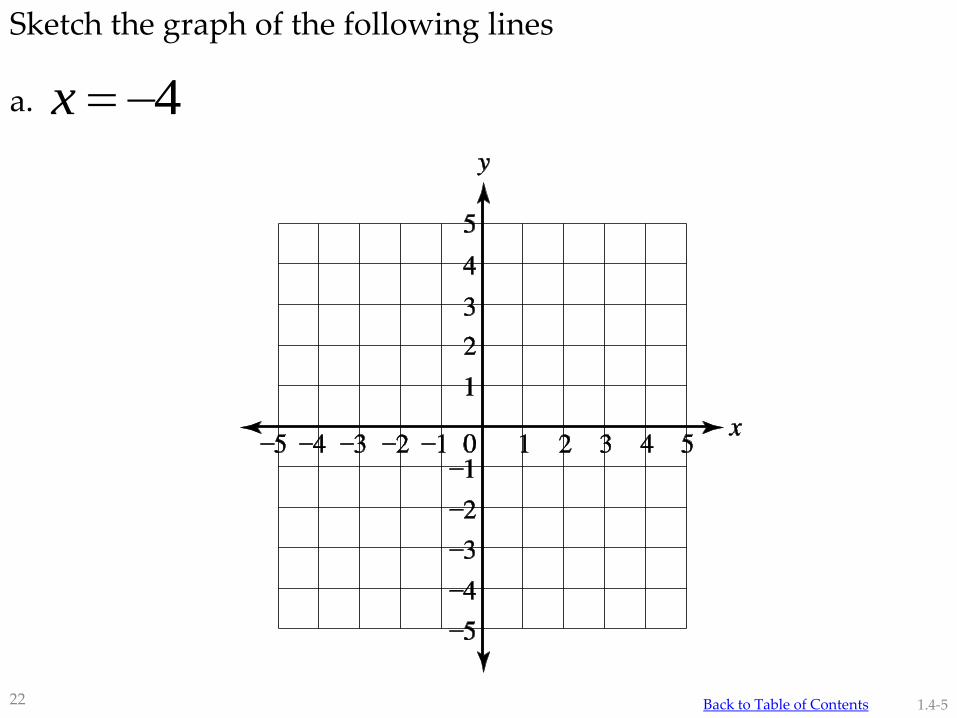
Sketch the graph of the following lines
a.
1.4-522 Back to Table of Contents
4x
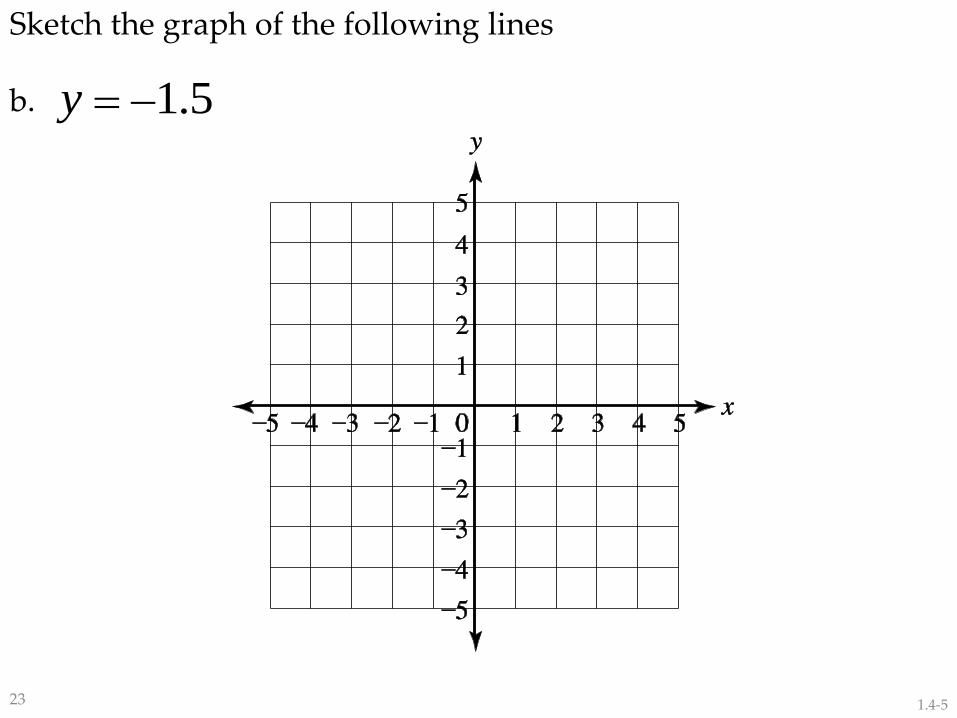
Sketch the graph of the following lines
b.
1.4-5
1.5y
23

A business purchased a production machine in 2005 for $185,000. For tax purposes, the value of the machine in 2011 was $129,500. If the business is using straight line depreciation, write the equation of the line that gives the value of the machine based on the age of the machine in years.
1.5-224 Back to Table of Contents
Using the value of the production machine equation we found earlier, answer the following:
a. What is the slope of the equation? What does it represent in regards to the value of the machine?
b. What is the vertical intercept of the equation? What does it represent in this situation?
1.5-7
9250 185,000v a
25 Back to Table of Contents

Using the value of the production machine equation we found earlier, answer the following:
c. What is the horizontal intercept of the equation? What does it represent in this situation?
1.5-726 Back to Table of Contents
9250 185,000v a
According to www.childtrendsdatabank.org the number of newly diagnosed AIDS cases for adolescents 13-19 years old in the United States was 310 in 2000 and 458 in 2003. Assume that the number of cases is growing at a constant rate, and write an equation to represent this situation.
1.5-327 Back to Table of Contents

Using the AIDS equation found in classroom example 3, answer the following:
a. What is the slope of the equation? What does it mean in this situation?
b. What is the vertical intercept for the equation? What does it represent in this situation?
1.5-828 Back to Table of Contents
49.3 310C t
There were 44.1 million major home appliances shipped in the United States in 2007. In 2009 only 36.7 million were shipped. Source: Association of Home Appliance Manufacturers.
a. Write an equation for the number of major home appliances shipped in the US t years since 2000.
b. What is the slope of the equation found in part a? What does it represent?
1.5-929 Back to Table of Contents
There were 44.1 million major home appliances shipped in the United States in 2007. In 2009 only 36.7 million were shipped. Source: Association of Home Appliance Manufacturers.
c. What is the vertical intercept for the equation you found in part a? What does it represent?
1.5-9
3.7 70A t
30 Back to Table of Contents
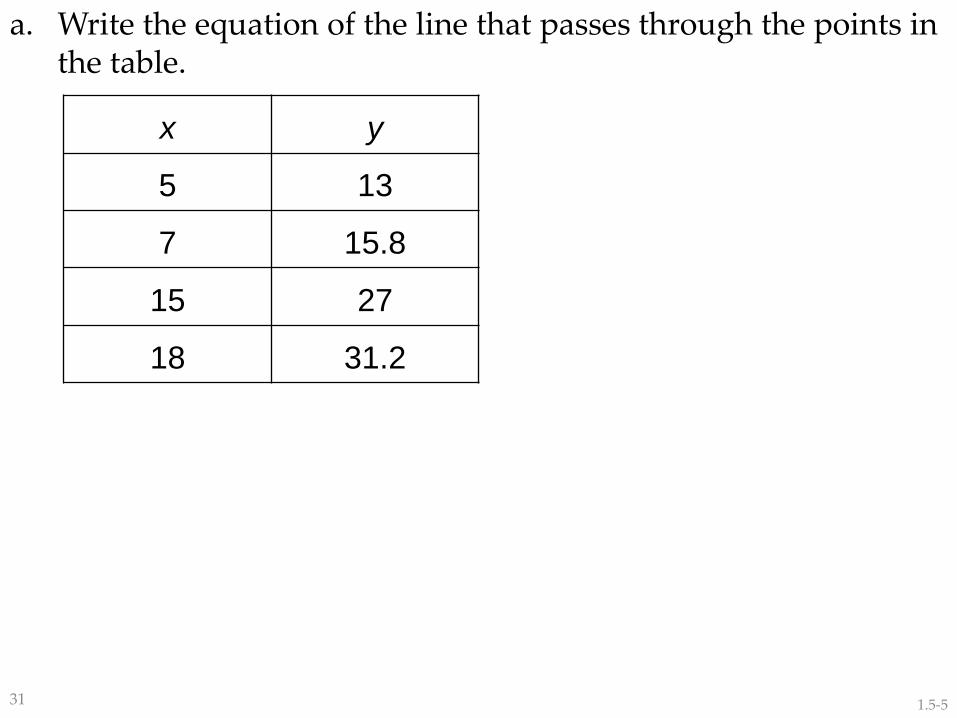
a. Write the equation of the line that passes through the points in the table.
1.5-5
x y
5 13
7 15.8
15 27
18 31.2
31

b. Write the equation of the line shown in the graph.
1.5-532 Back to Table of Contents

Special Types of Lines
Parallel Perpendicular
33

Special Types of Lines
Parallel Perpendicular
34
a. Write the equation of the line that goes through the pointand is perpendicular to the line .
1.5-6
4 23y x( 12,8)
35 Back to Table of Contents

b. Write the equation of the line that goes through the point (8,11) and is parallel to the line .
1.5-6
5 2 30x y
36 Back to Table of Contents

Create a scatter plot on your graphing calculator for the population data for North Carolina given in the table.
Source: Population Division, U.S. Census Bureau
Find an equation for a model of the population of North Carolina data given earlier.
1.6-1
YearPopulation
(millions)
2003 8.41
2004 8.52
2005 8.66
2006 8.85
2007 9.04
2008 9.22
37 Back to Table of Contents

38

The total revenue for GE is given in the table.
Source: GE 2008 annual report
a. Find an equation for a model of these data.
1.6-3
YearRevenue
(billions $)
2004 124
2005 136
2006 152
2007 172
2008 183
39 Back to Table of Contents

The total revenue for GE is given in the table.
b. Using your model estimate GE’s revenuein 2010.
c. What is the slope of your model? What does it mean in regards to GE’s revenue?
d. Determine a reasonable domain and range for the model.
1.6-3
Year Revenue (billions $)
2004 124
2005 136
2006 152
2007 172
2008 183
40
14.75 65R t
Back to Table of Contents

Determine whether the following descriptions of relations are functions or not.
a. The set
b.
c. Weekly salaries during the mth month of the year.
1.7-1
(2,5), (4,8), (10,8), (20,15)A
Day of week Monday Wednesday Saturday Monday
Temperature
degrees
Fahrenheit
90 88 91 93
41 Back to Table of Contents

a. Is the equation a function or not?
b. Is the equation a function or not?
1.7-2
7 20y x
2 24 16y x
42 Back to Table of Contents

c. Does the graph represent a function?
1.7-243 Back to Table of Contents

= The height of a toy rocket in feet t second after launch is given by
H(t) = 100t – 4.9 t2
Interpret the following mathematical statements:
a. H(0)
b. H(4)
c. H(6)
1.7-3
( )H t
44 Back to Table of Contents

Let
Find the following.
a.
1.7-5
2( ) 7 2 ( ) 1.25 14 ( ) 2 10f x x g x x h x x
(3)f
45 Back to Table of Contents

Let
Find the following.
b.
1.7-5
2( ) 7 2 ( ) 1.25 14 ( ) 2 10f x x g x x h x x
(5)h
46 Back to Table of Contents

Let
Find the following.
c. x such that
1.7-5
2( ) 7 2 ( ) 1.25 14 ( ) 2 10f x x g x x h x x
( ) 15g x
47 Back to Table of Contents

Use the graph to estimate the following.
a.
b. x such that
1.7-6
(2)f
( ) 5f x
48 Back to Table of Contents

What is Domain and Range for a Model?Domain
• the smallest value that is reasonable is the beginning of the Domain– avoid making negative objects
– avoid losing money
• the largest possible value that is reasonable is the end of the Domain– avoid making infinite objects
– avoid making infinite money
• If you are given data, do not stray to far away
Range
• Enter the smallest value from the Domain and that gives you one endpoint of the Range
• Enter the largest value from the Domain and that is the other endpoint of the Range
49

!WARNING!• The Domain and Range of a Line are
DIFFERENT than the Domain and Range of a Model!
– A Line is a mathematical object without physical meaning or constraint
– A Model uses a mathematical object to assist in analysis that has physical meaning and constraints
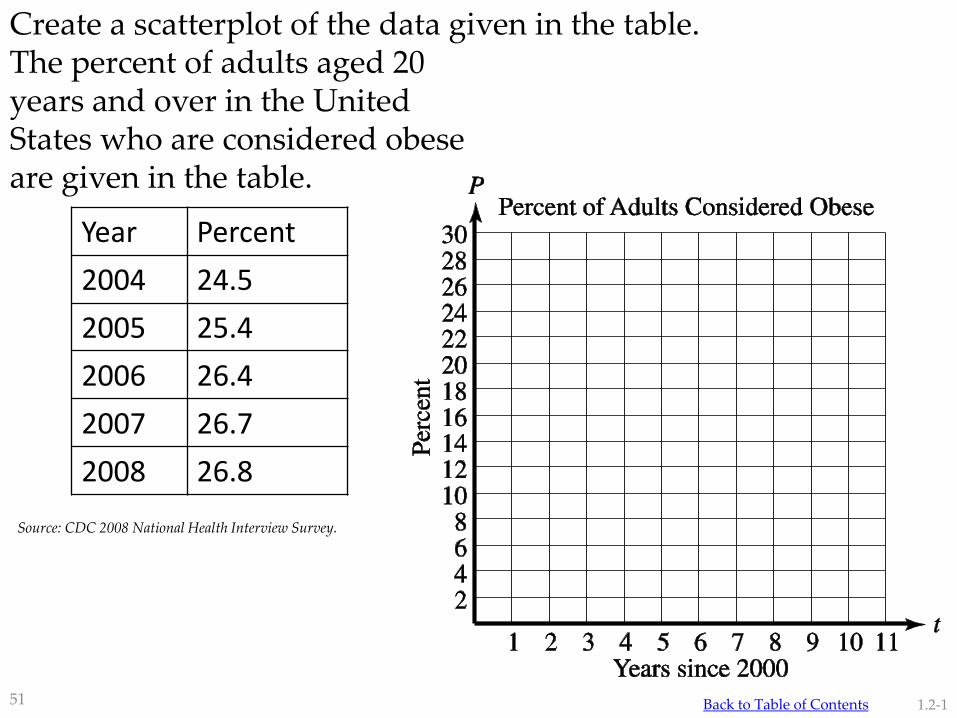
Create a scatterplot of the data given in the table.The percent of adults aged 20 years and over in the UnitedStates who are considered obeseare given in the table.
Source: CDC 2008 National Health Interview Survey.
1.2-1
Year Percent
2004 24.5
2005 25.4
2006 26.4
2007 26.7
2008 26.8
51 Back to Table of Contents

a. Using the scatterplot of the obesity data from before, draw an “eyeball best fit” line through the data.
1.2-252 Back to Table of Contents

1.2-1
b. Using your eyeball best-fit line, make a prediction for the percentage of adults in the United States who were considered obese in 2010.
53 Back to Table of Contents

Determine a reasonable domain and range for the graphical model found for the obesity data.
1.2-454 Back to Table of Contents

Use the graph to answer the following questions a. Estimate the vertical
intercept.
b. Estimate the horizontal intercept.
1.2-355 Back to Table of ContentsBack to Table of Contents
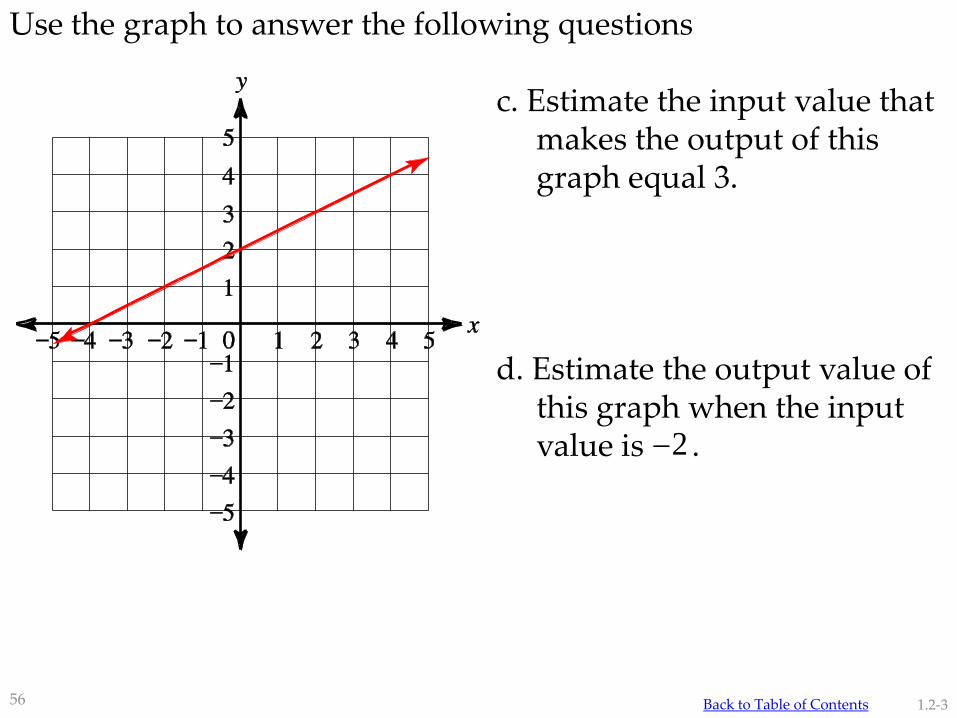
Use the graph to answer the following questions
c. Estimate the input value that makes the output of this graph equal 3.
d. Estimate the output value of this graph when the input value is .
1.2-3
2
56 Back to Table of Contents

The percentage of students in twelfth grade who report smoking daily is given in the table. Source: www.monitoringthefuture.org
a. Create a scatterplot for these data and draw an “eyeball best fit” line through the data.
1.2-5
Year Percent
2000 20.6
2001 19.0
2002 16.9
2003 15.8
2004 15.6
2005 13.6
2006 12.2
57

Answer: t = years since 2000. P = percent of twelfth grade students who report smoking daily.
1.2-558 Back to Table of Contents
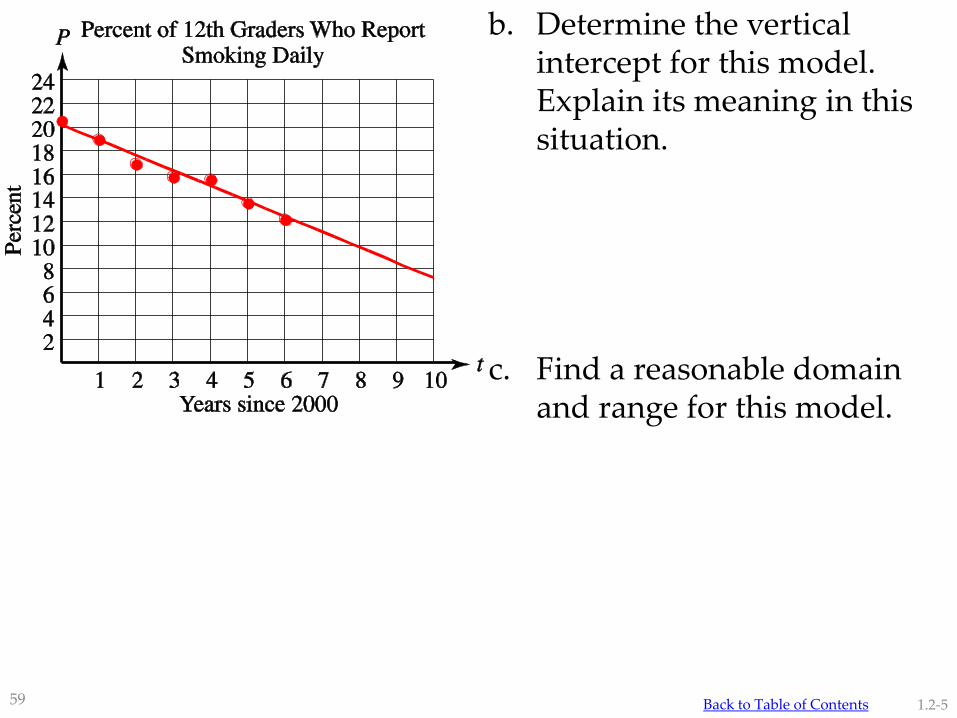
b. Determine the vertical intercept for this model. Explain its meaning in this situation.
c. Find a reasonable domain and range for this model.
1.2-559 Back to Table of Contents
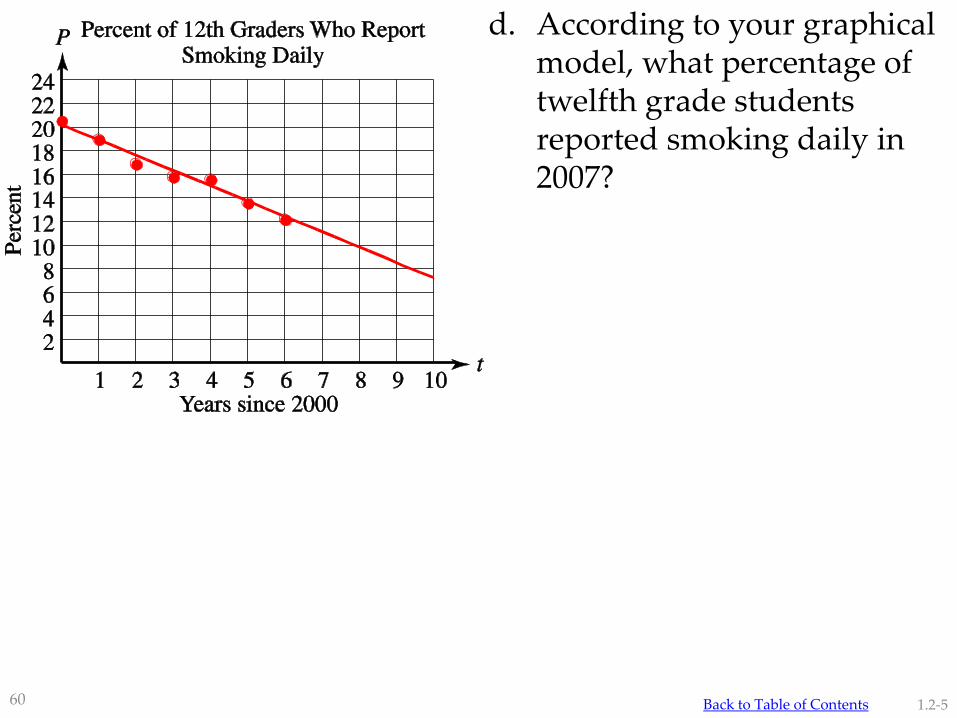
d. According to your graphical model, what percentage of twelfth grade students reported smoking daily in 2007?
1.2-560 Back to Table of Contents

Determine the domain and range of the following functions
a.
b.
1.7-7
( ) 3 7f x x
( ) 8g x
61 Back to Table of Contents
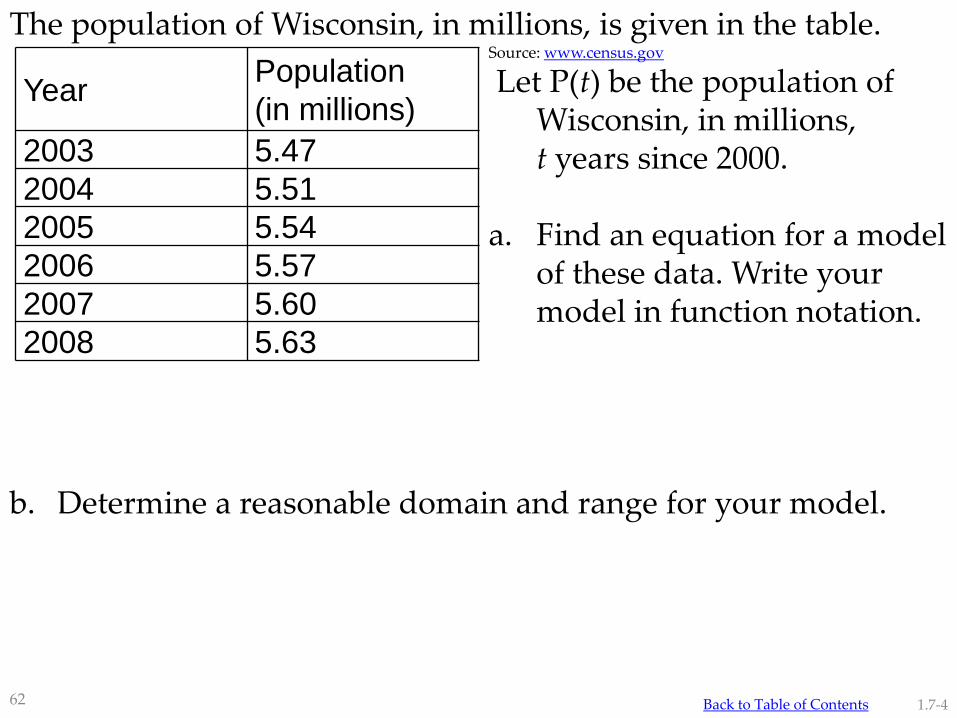
The population of Wisconsin, in millions, is given in the table.Source: www.census.gov
Let P(t) be the population of Wisconsin, in millions,t years since 2000.
a. Find an equation for a model of these data. Write your model in function notation.
b. Determine a reasonable domain and range for your model.
1.7-4
YearPopulation
(in millions)
2003 5.47
2004 5.51
2005 5.54
2006 5.57
2007 5.60
2008 5.63
62 Back to Table of Contents
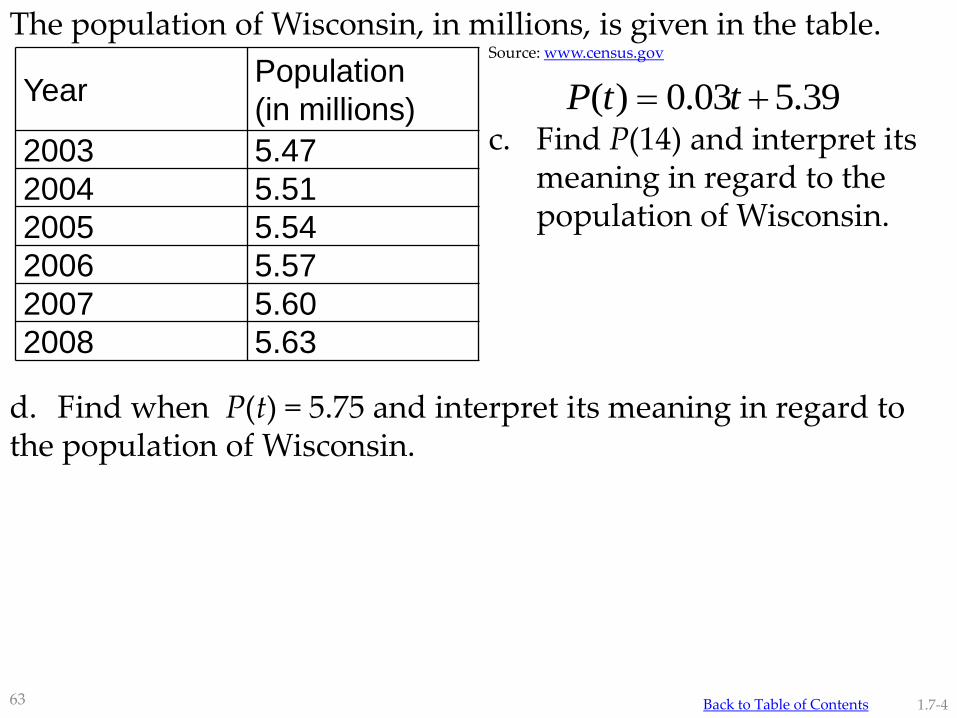
The population of Wisconsin, in millions, is given in the table.Source: www.census.gov
c. Find P(14) and interpret its meaning in regard to the population of Wisconsin.
d. Find when P(t) = 5.75 and interpret its meaning in regard to the population of Wisconsin.
1.7-4
YearPopulation
(in millions)
2003 5.47
2004 5.51
2005 5.54
2006 5.57
2007 5.60
2008 5.63
63
( ) 0.03 5.39P t t
Back to Table of Contents