chapters four & five identifying & analyzing attractive markets
TRANSCRIPT

Chapters Four & Five
Identifying & Analyzing Attractive Markets
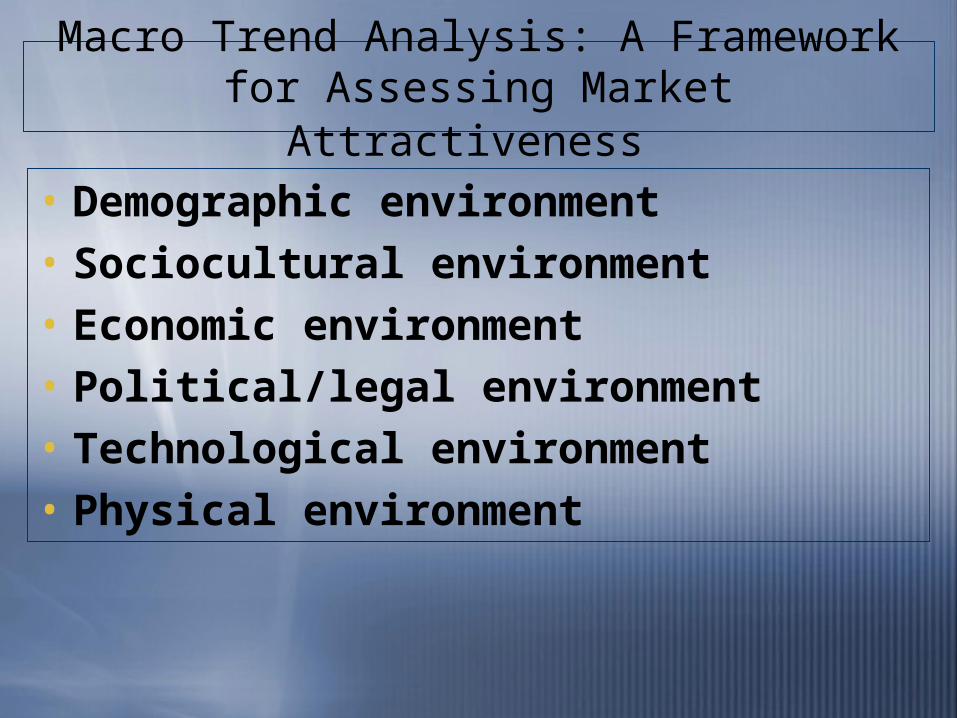
Macro Trend Analysis: A Framework for Assessing Market Attractiveness
• Demographic environment
• Sociocultural environment
• Economic environment
• Political/legal environment
• Technological environment
• Physical environment
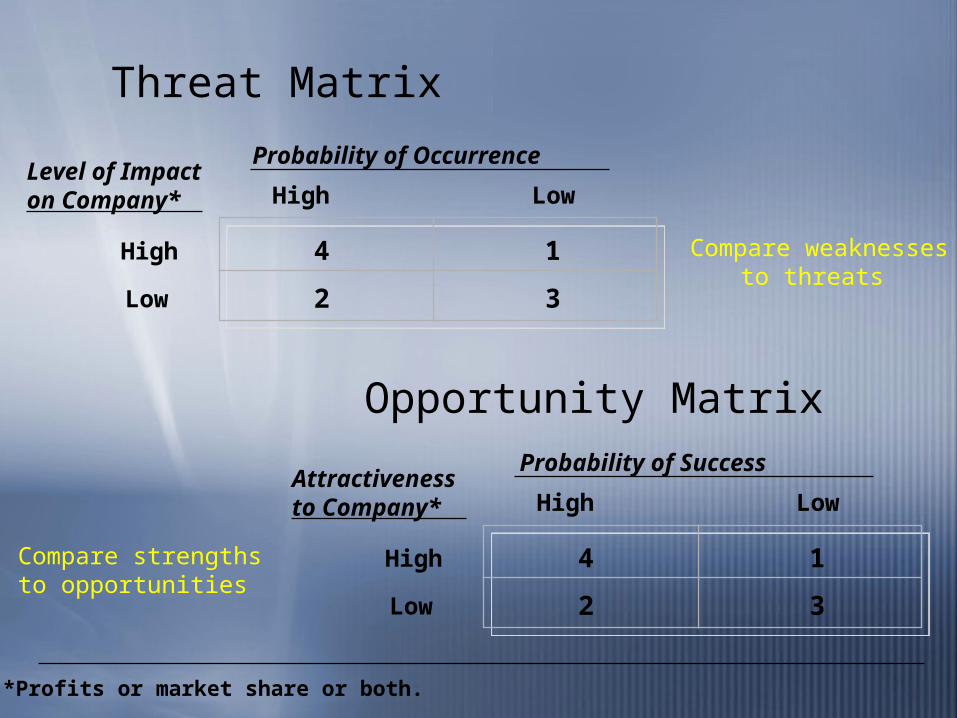
Threat Matrix
Probability of Occurrence
High LowLevel of Impacton Company*
High
Low
4
2
1
3
*Profits or market share or both.
Probability of Success
High LowAttractivenessto Company*
High
Low
4
2
1
3
Opportunity Matrix
Compare strengthsto opportunities
Compare weaknessesto threats

Exhibit 5.2
The Major Forces that Determine Industry Attractiveness
Rivalry among Rivalry among existing industry existing industry
firmsfirms
Threat of substitute Threat of substitute productsproducts
BargainingBargainingpowerpower
of buyersof buyers
Bargaining Bargaining powerpower
of suppliersof suppliers
Source: Adapted from Michael E. Porter, “Industry Structure and Competitive Strategy: Keys to Profitability,” Financial Analysts Journal, July-August 1980, p. 33.
Threat of newThreat of new entrantsentrants

Segment Rivalry
• The industry is less attractive if:– numerous strong competitors– stable or declining market– large capacity increments– high fixed costs– high exit barriers
Threat of Substitutes
• The industry is less attractive if:– numerous current substitutes– numerous potential substitutes
Supplier Power
• The industry is less attractive if:– suppliers are concentrated or organized – suppliers are few in number– providing critical component– high switching costs exist– forward integration is easy
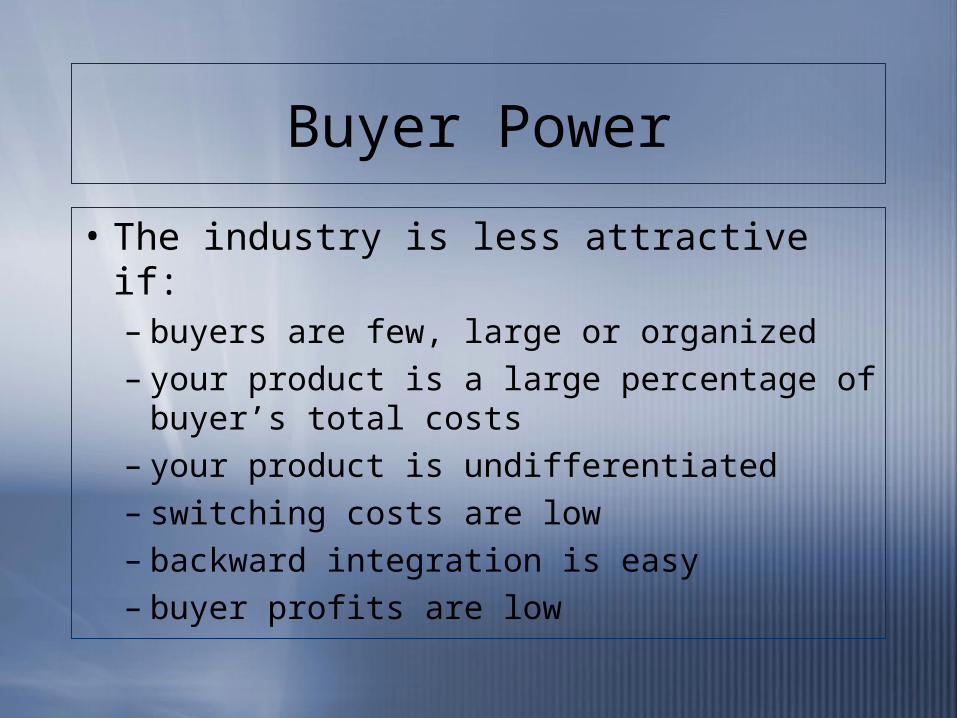
Buyer Power
• The industry is less attractive if:– buyers are few, large or organized– your product is a large percentage of buyer’s
total costs– your product is undifferentiated– switching costs are low– backward integration is easy– buyer profits are low
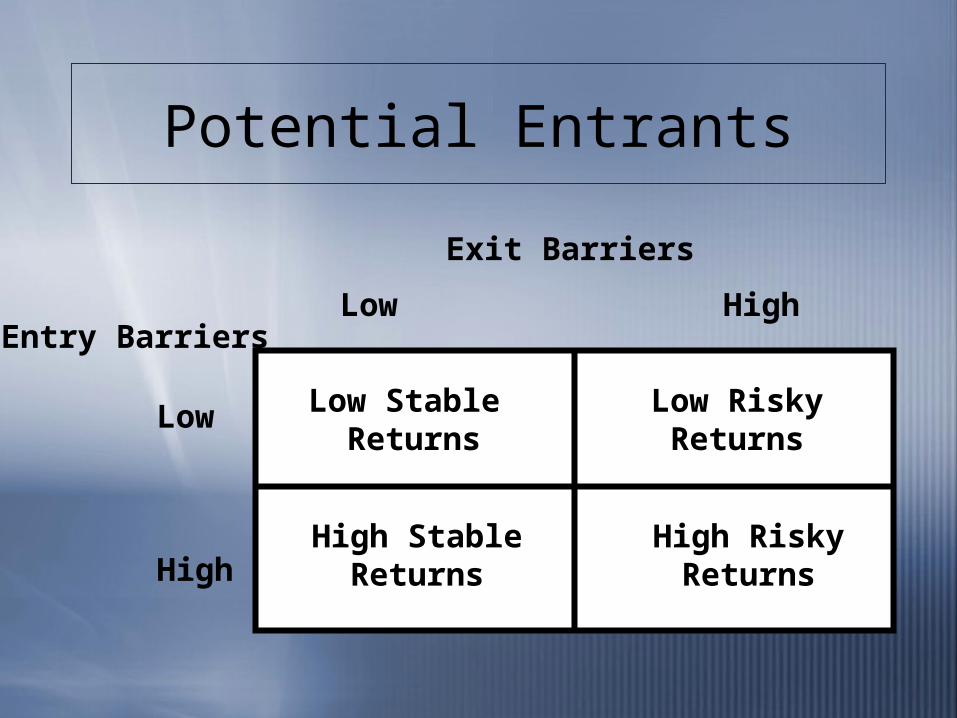
Potential Entrants
Low Stable Returns
Low RiskyReturns
High StableReturns
High RiskyReturns
Entry Barriers
Exit Barriers
Low
High
Low High

If alternative fuel vehicles are a major opportunity for the auto industry, how
fast will customers adopt?
Earlymajority34%
Latemajority34%
Earlyadopters13.5% 16%2.5%
Innovators
Laggardsand nonadopters
Source: Adapted with permission from Marketing, 11/e, Acetate 8-8, by Michael J. Etzel, Bruce J. Walker, and William J. Stanton. The McGraw-Hill Companies, Inc. © 1997. All rights reserved.

Exhibit 5.8
Generalized Product Life Cycle
Source: Reprinted with permission from p. 60 of Analysis for Strategic Marketing Decisions, by George Day. Copyright © 1986 by West Publishing Company. All rights reserved.
Pro
du
ct c
ateg
ory
sal
es(r
eal
do
llar
s)P
rofi
t p
er u
nit
(rea
l d
oll
ars)
Profit/unitSales
Life cycleextension
GrowthCompetitiveturbulence
Maturity Decline orextension
Time (years)
Introduction

Exhibit 5.9
Common Product Life-Cycle Curves
Source: Adapted from J.E. Swann and D.R. Rink, “Effective Use of Industrial Product Life Cycle Trends,” in Marketing in the ‘80s (New York, American Marketing Association, 1980), pp. 198-99.
Unitsales
Unitsales
Unitsales
Unitsales
Time Time
Time Time
I. Growth-decline-plateau II. Cycle-recycle
IV. ClassicalIII. Innovative-maturity
Intr
o. Gro
wth
Mat
uri
ty
Dec
lin
e

Competitive Analysis
• Identify & assess existing and potential competitors at all levels of competition – product market: SUV’s (for all important segments)
– product category: Family Cars– generic product: Automobiles– budget category: Transportation