characterisation of crude oils and their fouling deposits...
TRANSCRIPT
CHARACTERISATION OF CRUDE OILS AND THEIR FOULING DEPOSITS USING A
BATCH STIRRED CELL SYSTEM
Andrew Young*
1, Silvia Venditti
2, Cesur Berrueco
2, Mengyan Yang
1
Andrew Waters1, Haddy Davies
1, Simon Hill
1, Marcos Millan
2 and Barry Crittenden
1
1Department of Chemical Engineering, University of Bath, Bath, UK, BA2 7AY
2Department of Chemical Engineering, Imperial College London, UK, SW7 2AZ
*corresponding author: [email protected]
ABSTRACT
A small (1 litre) batch stirred cell system has been
developed to study crude oil fouling at surface temperatures
up to 400oC and pressures up to 30 bar. Fouling resistance-
time data are obtained from experiments in which the
principal operating variables are surface shear stress, surface
temperature, heat flux and crude oil type. The oils and
deposits are characterised and correlated with the
experimental heat transfer fouling data to understand better
the effects of process conditions such as surface temperature
and surface shear stress on the fouling process. Deposits are
subjected to a range of qualitative and quantitative analyses
in order to gain a better insight into the crude oil fouling
phenomenon. Thermal data which can be obtained relatively
quickly from the batch cell provide fouling rates, Arrhenius
plots, and apparent activation energies as a function of
process variables. The experimental system, supported by
CFD studies, allows fouling threshold conditions of surface
temperature and shear stress to be identified relatively
quickly in the laboratory. The data also contribute to
existing knowledge about the compensation plot.
INTRODUCTION
Various methods have been adopted to study the
complex problem of fouling in crude oil preheat exchangers.
Research using actual plant data is slow, subject to a variety
of logistical and operational requirements which do not lend
themselves well to fundamental scientific studies
(Crittenden et al., 1992), and can create difficulties in the
interpretation of the thermal data (Takemoto et al., 1999). A
number of laboratory methods have been developed to study
liquid phase fouling (Epstein, 1981; Chenoweth, 1988)
including for crude oils use of the stirred batch cell (Eaton
and Lux, 1984), or use of a recycle flow loop with either a
tubular cross section (eg Crittenden et al., 2009) or an
annular cross section (eg Wilson and Watkinson, 1995;
Bennett et al., 2009).
Whilst laboratory studies can eliminate the principal
practical disadvantages of studying fouling on refinery
exchangers they, in turn, introduce their own disadvantages,
the principal one being that the crude oil is not exposed to
the time-temperature-flow history of the crude in the oil
refinery. Accordingly, concerns are that crucial fouling
precursors might become depleted in extended running of
both batch cells and recycle flow loops, and that flow
structures are not typical of industrial practice. Nevertheless,
laboratory-scale studies can be made with precise operating
conditions and can provide excellent access to the heat
transfer surface, its deposits and the fluids from which the
fouling originates. Laboratory-scale methods also allow
study of the effects of the heat transfer surface (its material,
morphology, enhancement, etc) as well as devices which
might be used to simultaneously improve heat transfer and
reduce fouling (eg Crittenden et al., 1993).
In the current research a batch stirred cell has been
designed to operate under conditions close to those found in
crude oil preheat trains, namely a maximum pressure of 30
bar and a maximum surface temperature of around 400oC.
The cell design following closely that of Eaton and Lux
(1983, 1984) was chosen since it offers extraordinary
flexibility. Crude oils can be changed easily, as can the
fouling fluid chemistry (eg by adding asphaltenes, metal
salts, etc). The cell can be sparged with various gases, eg
oxygen and nitrogen, and the heat transfer surface is easily
inspected and changed. Computational fluid dynamics
(CFD) software also allows the thermal and fluid flow
characteristics of the complex batch stirred cell geometry to
be predicted and validated (Yang et al., 2009a).
APPARATUS AND EXPERIMENTAL METHOD
Apparatus
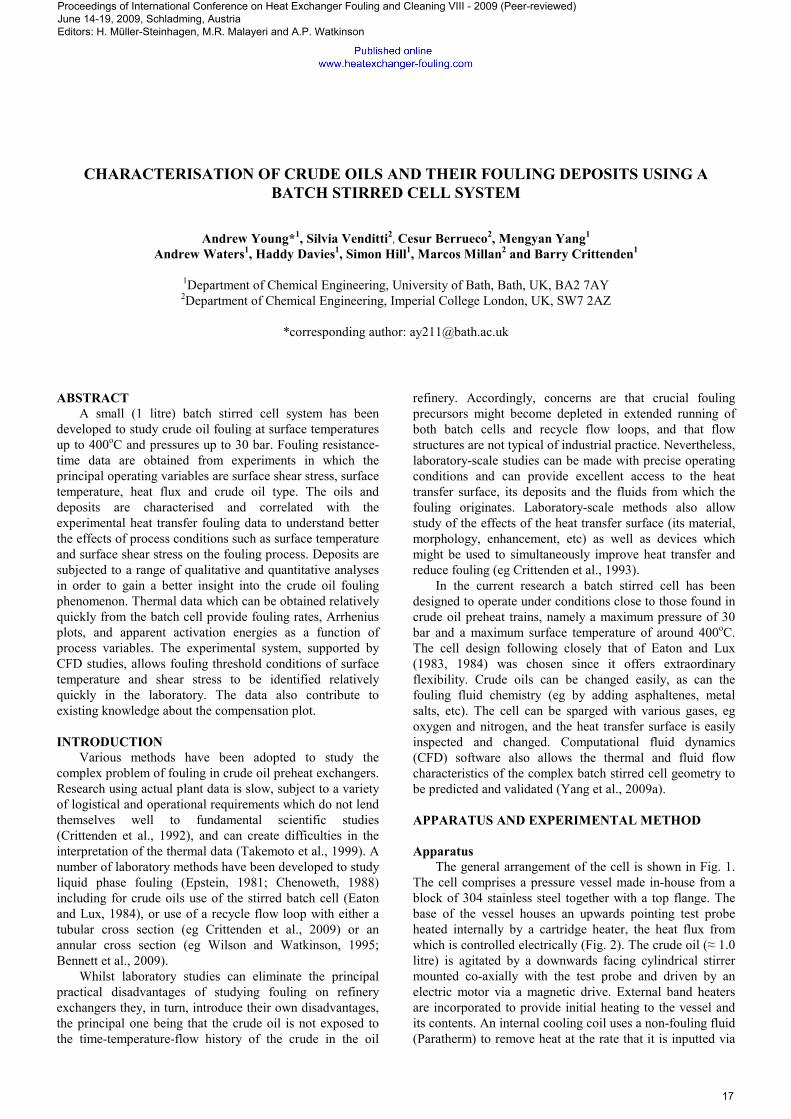
The general arrangement of the cell is shown in Fig. 1.
The cell comprises a pressure vessel made in-house from a
block of 304 stainless steel together with a top flange. The
base of the vessel houses an upwards pointing test probe
heated internally by a cartridge heater, the heat flux from
which is controlled electrically (Fig. 2). The crude oil (≈ 1.0
litre) is agitated by a downwards facing cylindrical stirrer
mounted co-axially with the test probe and driven by an
electric motor via a magnetic drive. External band heaters
are incorporated to provide initial heating to the vessel and
its contents. An internal cooling coil uses a non-fouling fluid
(Paratherm) to remove heat at the rate that it is inputted via
Proceedings of International Conference on Heat Exchanger Fouling and Cleaning VIII - 2009 (Peer-reviewed) June 14-19, 2009, Schladming, Austria Editors: H. Müller-Steinhagen, M.R. Malayeri and A.P. Watkinson
17
the cartridge heater during the fouling run. The vessel is
fitted with a pressure relief valve and there is a single
thermocouple to measure the crude oil bulk temperature.
t wb t ws
t bulk
© 2008 University of Bath, England
t wm
Fil Level
Fig. 1 The batch stirred cell
Heated test probes are manufactured in-house from low
carbon steel with a material specification similar to that of a
standard A179 heat exchanger tube. Each probe fits tightly
over the cartridge heater supplied by Watlow Ltd. A
coherent light scanning probe (Scantron Industrial Products,
Taunton, England) is used to obtain the initial surface
roughness Ra. Three test probes have been made (denoted A,
B and C). Probes A and B have relatively high Ra values of
≈10µm. Probe C had a similar surface characterization to
that of a standard mild steel heat exchanger tube (A179).
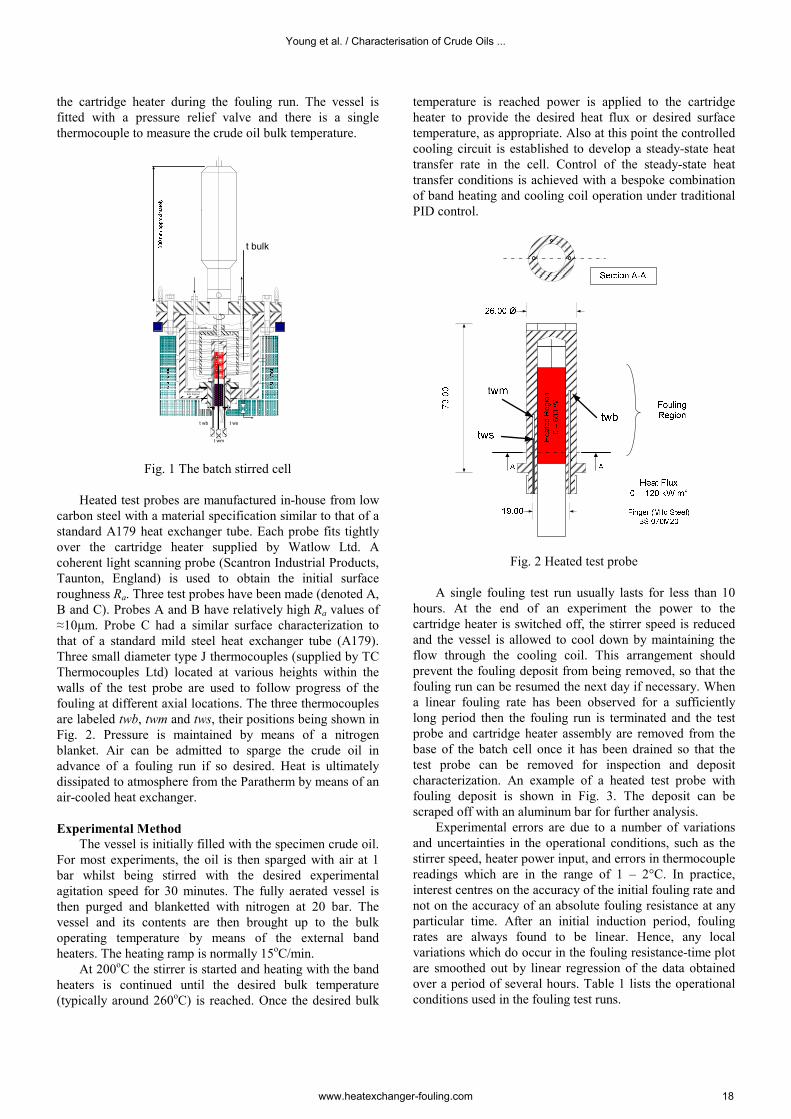
Three small diameter type J thermocouples (supplied by TC
Thermocouples Ltd) located at various heights within the
walls of the test probe are used to follow progress of the
fouling at different axial locations. The three thermocouples
are labeled twb, twm and tws, their positions being shown in
Fig. 2. Pressure is maintained by means of a nitrogen
blanket. Air can be admitted to sparge the crude oil in
advance of a fouling run if so desired. Heat is ultimately
dissipated to atmosphere from the Paratherm by means of an
air-cooled heat exchanger.
Experimental Method
The vessel is initially filled with the specimen crude oil.
For most experiments, the oil is then sparged with air at 1
bar whilst being stirred with the desired experimental
agitation speed for 30 minutes. The fully aerated vessel is
then purged and blanketted with nitrogen at 20 bar. The
vessel and its contents are then brought up to the bulk
operating temperature by means of the external band
heaters. The heating ramp is normally 15oC/min.
At 200oC the stirrer is started and heating with the band
heaters is continued until the desired bulk temperature
(typically around 260oC) is reached. Once the desired bulk
temperature is reached power is applied to the cartridge
heater to provide the desired heat flux or desired surface
temperature, as appropriate. Also at this point the controlled
cooling circuit is established to develop a steady-state heat
transfer rate in the cell. Control of the steady-state heat
transfer conditions is achieved with a bespoke combination
of band heating and cooling coil operation under traditional
PID control.
Fig. 2 Heated test probe
A single fouling test run usually lasts for less than 10
hours. At the end of an experiment the power to the
cartridge heater is switched off, the stirrer speed is reduced
and the vessel is allowed to cool down by maintaining the
flow through the cooling coil. This arrangement should
prevent the fouling deposit from being removed, so that the
fouling run can be resumed the next day if necessary. When
a linear fouling rate has been observed for a sufficiently
long period then the fouling run is terminated and the test
probe and cartridge heater assembly are removed from the
base of the batch cell once it has been drained so that the
test probe can be removed for inspection and deposit
characterization. An example of a heated test probe with
fouling deposit is shown in Fig. 3. The deposit can be
scraped off with an aluminum bar for further analysis.
Experimental errors are due to a number of variations
and uncertainties in the operational conditions, such as the
stirrer speed, heater power input, and errors in thermocouple
readings which are in the range of 1 – 2°C. In practice,
interest centres on the accuracy of the initial fouling rate and
not on the accuracy of an absolute fouling resistance at any
particular time. After an initial induction period, fouling
rates are always found to be linear. Hence, any local
variations which do occur in the fouling resistance-time plot
are smoothed out by linear regression of the data obtained
over a period of several hours. Table 1 lists the operational
conditions used in the fouling test runs.
Young et al. / Characterisation of Crude Oils ...
www.heatexchanger-fouling.com 18
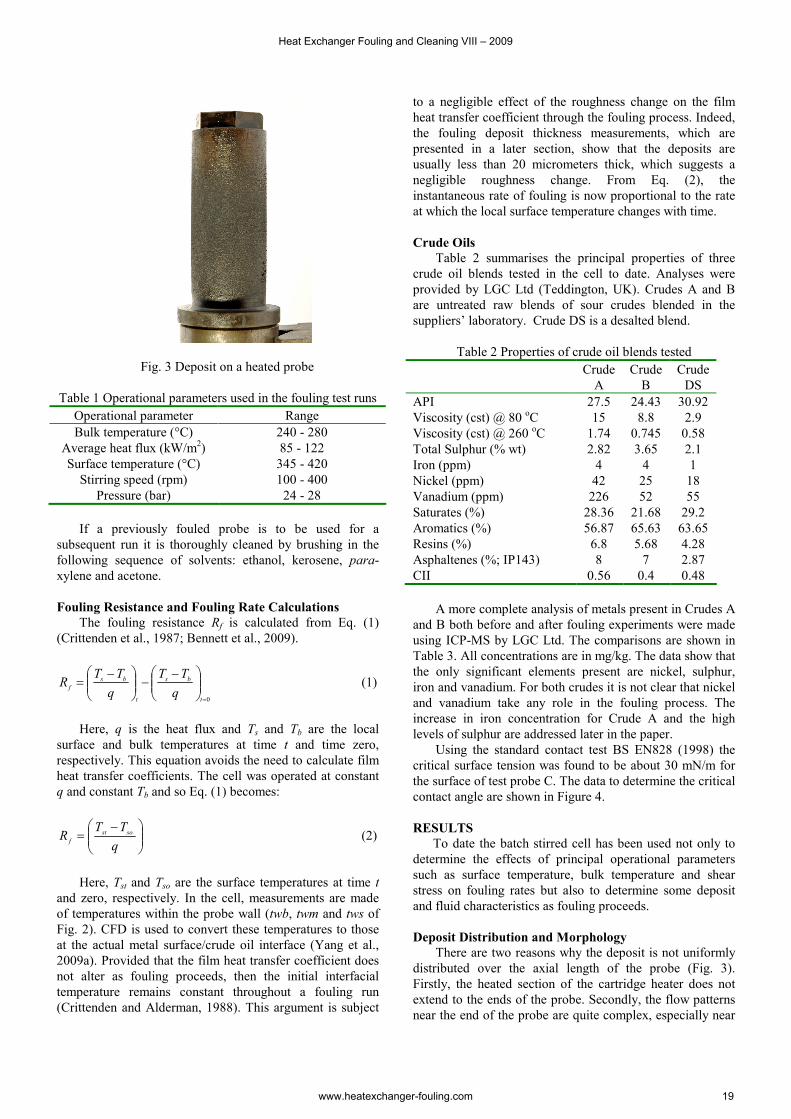
Fig. 3 Deposit on a heated probe
Table 1 Operational parameters used in the fouling test runs
Operational parameter Range
Bulk temperature (°C) 240 - 280
Average heat flux (kW/m2) 85 - 122
Surface temperature (°C) 345 - 420
Stirring speed (rpm) 100 - 400
Pressure (bar) 24 - 28
If a previously fouled probe is to be used for a
subsequent run it is thoroughly cleaned by brushing in the
following sequence of solvents: ethanol, kerosene, para-
xylene and acetone.
Fouling Resistance and Fouling Rate Calculations
The fouling resistance Rf is calculated from Eq. (1)
(Crittenden et al., 1987; Bennett et al., 2009).
0=
−−
−=
t
bs
t
bs
fq
TT
q
TTR (1)
Here, q is the heat flux and Ts and Tb are the local
surface and bulk temperatures at time t and time zero,
respectively. This equation avoids the need to calculate film
heat transfer coefficients. The cell was operated at constant
q and constant Tb and so Eq. (1) becomes:
−=
q
TTR sost
f (2)
Here, Tst and Tso are the surface temperatures at time t
and zero, respectively. In the cell, measurements are made
of temperatures within the probe wall (twb, twm and tws of
Fig. 2). CFD is used to convert these temperatures to those
at the actual metal surface/crude oil interface (Yang et al.,
2009a). Provided that the film heat transfer coefficient does
not alter as fouling proceeds, then the initial interfacial
temperature remains constant throughout a fouling run
(Crittenden and Alderman, 1988). This argument is subject
to a negligible effect of the roughness change on the film
heat transfer coefficient through the fouling process. Indeed,
the fouling deposit thickness measurements, which are
presented in a later section, show that the deposits are
usually less than 20 micrometers thick, which suggests a
negligible roughness change. From Eq. (2), the
instantaneous rate of fouling is now proportional to the rate
at which the local surface temperature changes with time.
Crude Oils
Table 2 summarises the principal properties of three
crude oil blends tested in the cell to date. Analyses were
provided by LGC Ltd (Teddington, UK). Crudes A and B
are untreated raw blends of sour crudes blended in the
suppliers’ laboratory. Crude DS is a desalted blend.
Table 2 Properties of crude oil blends tested
Crude
A
Crude
B
Crude
DS
API 27.5 24.43 30.92
Viscosity (cst) @ 80 oC 15 8.8
2.9
Viscosity (cst) @ 260 oC 1.74 0.745
0.58
Total Sulphur (% wt) 2.82 3.65 2.1
Iron (ppm) 4 4 1
Nickel (ppm) 42 25 18
Vanadium (ppm) 226 52 55
Saturates (%) 28.36 21.68 29.2
Aromatics (%) 56.87 65.63 63.65
Resins (%) 6.8 5.68 4.28
Asphaltenes (%; IP143) 8 7 2.87
CII 0.56 0.4 0.48
A more complete analysis of metals present in Crudes A
and B both before and after fouling experiments were made
using ICP-MS by LGC Ltd. The comparisons are shown in
Table 3. All concentrations are in mg/kg. The data show that
the only significant elements present are nickel, sulphur,
iron and vanadium. For both crudes it is not clear that nickel
and vanadium take any role in the fouling process. The
increase in iron concentration for Crude A and the high
levels of sulphur are addressed later in the paper.
Using the standard contact test BS EN828 (1998) the
critical surface tension was found to be about 30 mN/m for
the surface of test probe C. The data to determine the critical
contact angle are shown in Figure 4.
RESULTS
To date the batch stirred cell has been used not only to
determine the effects of principal operational parameters
such as surface temperature, bulk temperature and shear
stress on fouling rates but also to determine some deposit
and fluid characteristics as fouling proceeds.
Deposit Distribution and Morphology
There are two reasons why the deposit is not uniformly
distributed over the axial length of the probe (Fig. 3).
Firstly, the heated section of the cartridge heater does not
extend to the ends of the probe. Secondly, the flow patterns
near the end of the probe are quite complex, especially near
Heat Exchanger Fouling and Cleaning VIII – 2009
www.heatexchanger-fouling.com 19

the bottom. Hence, distributions of shear stress, surface
temperature and heat flux over the cell’s probe surface are
modelled for each fouling experiment using the Comsol
CFD package (Yang et al., 2009a). For any given agitation
speed, bulk temperature and heat flux, the surface stress is
found to be virtually constant along the surface of the probe
except for a reduction at the very bottom (Yang et al.,
2009a). The CFD simulation results are validated against the
measured temperature data at various axial positions within
the probe (Yang et al., 2009a). The readings from the three
thermocouples are different. Indeed, the temperature is not
intended to be constant along the height of the probe. Hence
each thermocouple reads the temperature at its own
particular location. The thermocouples were calibrated using
a standard calibration method. Basically, the CFD-predicted
surface temperature reaches its maximum at the middle of
the height of the probe, and gradually decreases towards
both the top and bottom. This distribution is in good
agreement with the readings from the thermocouples.
Table 3 Element concentrations in the crude oils tested
Crude A Crude B Analysis
before after before after
Silver 4 <2 <2 <2
Aluminium <1 <5 <1 <1
Boron <2 <2 <2 <2
Barium <1 <1 <1 <1
Calcium <2 <2 <2 <1
Chromium <1 <1 <1 <1
Copper <1 <1 2 <1
Iron <1 23 4 2
Potassium <2 <2 <2 <2
Magnesium <2 <2 <2 <2
Manganese <1 <1 <1 <1
Molybdenum 3 <5 <1 <1
Sodium <10 <2 <2 <2
Nickel 46 47 25 26
Phosphorus <2 <2 <2 <2
Lead <2 <2 <2 <2
Sulphur 28,000 27,800 36,500 37,000
Silicon <1 <1 5 <1
Tin <2 <1 <1 <1
Titanium <1 <1 <1 <1
Vanadium 230 241 52 57
Zinc <1 <1 <1 <1
After a fouling run, the cell is drained of crude oil,
dismantled and the probe removed. After drying in a
vacuum oven overnight at 100oC, the deposit thickness
along and around the probe is measured using a laser and
coherent light scanning procedure (Proscan 2000, Scantron
Industrial Products Ltd, Taunton, UK). An example screen-
shot of a Proscan 2000 surface profile is shown in Fig. 5, the
peak deposit thickness being about 15 µm.
The deposit thickness profile along the heated surface
reveals a maximum near the middle of the heated test probe
surface. The CFD-predicted surface temperature profiles are
strikingly similar in shape (Yang et al., 2009a). This
resemblance between deposit thickness and surface
temperature profiles is to be expected since the effect of
surface temperature on a crude oil fouling rate is strong
(Crittenden et al., 2009). It is now possible to correlate, for a
fixed surface shear stress, the local fouling rate against the
local surface temperature, and hence to obtain an Arrhenius
plot from a single experimental run (Yang et al., 2009a).
Since the shear stress can be varied by changing the speed
of rotation of the cell’s cylindrical stirrer, the effect of shear
stress on fouling behaviour can be studied as well.
Fig. 4 Critical surface tension test
Fig. 5 Example Proscan deposit thickness profile
Fouling Resistance and Rate
In virtually all experiments to date, the fouling
resistance has been found to vary linearly with time (eg Fig.
6). An induction period is usually seen when a well-cleaned
probe is used. Conversely, an induction period is not
normally observed when a test probe is left in situ in the cell
between runs. A relatively simple lumped parameter model
has been developed to account for the growth in fouling
resistance including the induction period (Yang et al.,
2009b). The fouling rate used in all Arrhenius plot
calculations is that after completion of the induction period.
Photomicrographs and Scanning Electron Microscopy
Figure 7 shows a photomicrograph of a deposit formed
from Crude DS (not sparged with air) at a surface
temperature of 380oC, bulk temperature of 280
oC, heat flux
Critical Surface Tension Test - 10/7/08
0
0.1
0.2
0.3
0.4
0.5
0.6
0.7
0.8
0.9
1
20 30 40 50 60 70 80
Surface Tension (mN/m)
Cos(theta)
Finger C
HEX Tube Sample
Linear (Finger C)
Linear (HEX Tube Sample)
Glycerol
Formamide
DMSO
Water
Critical Surface
Tensions
Young et al. / Characterisation of Crude Oils ...
www.heatexchanger-fouling.com 20

of 110 kW/m2 and stirrer speed of 100 rpm, which
corresponds to a shear stress of 0.2 Pa at the probe surface.
The photograph was taken at the location of thermocouple
twb. It is clear that the deposit surface is rough, in
accordance qualitatively with the scan shown in Fig. 5.
-0.02
0
0.02
0.04
0.06
0.08
0.1
0.12
0 1 2 3 4 5 6 7
Time (hour)
Rf (Km2/kW)
Rf = 0.0177 t - 0.0185
Fig. 6 Typical fouling curve for Crude B
Fig. 7 Photomicrograph of deposit from Crude DS
Figure 8 shows the test probe fitted with a small coupon
removeable for inspection by scanning electron microscopy.
The SEM picture which is also shown in Fig. 8 reveals that
the deposit formed on the surface is striated in a manner
very similar to that found previously by Wilson and
Watkinson (1995, 1996) in their hydrocarbon autoxidation
fouling studies. The individual particle sizes seen in Fig. 8
seem to be of the order of 100 µm.
Fig. 8 Left: Probe fitted with test coupon held by a thin wire;
Right: SEM of test coupon surface
(The white line represents 1 mm length)
Thermogravimetric Analysis
Thermogravimetric analysis (TGA) in nitrogen/air was
carried out at Imperial College London on a deposit
obtained in the batch stirred cell with Crude B. Prior to
TGA, the deposit was dried overnight in a vacuum oven at
100oC in an attempt to remove as much free crude oil as
possible. As can be seen in Fig. 9, the deposit lost an
appreciable weight (about 27%) as the temperature was
ramped from about 200 to 450oC. Almost certainly this loss
was due to the removal of free crude oil up to a temperature
which was not too far above the maximum surface
temperature the deposit experienced in the batch cell.
0
20
40
60
80
100
0 50 100 150 200
Time (min.)
Wei
ght
(%)
0
100
200
300
400
500
600
700
800
900
1000
Tem
per
atu
re (
°C)
BD
Fig. 9 TGA analysis of deposit from Crude B
A further weight loss (about 4%) occurred as the
temperature was ramped further from 450 to 870oC, which
was almost certainly due to pyrolysis of the deposit. Finally,
air was introduced into the apparatus to burn remaining
combustible elements (about 13%) and the final weight was
that of the ash in the deposit, namely about 56%.
Size Exclusion Chromatography and UV-Fluorescence
An initial characterisation of deposit samples by
chromatography did not show significant differences
between them and the feed material. This led to the use of
different solvents to fractionate the sample in order to make
the identification easier via the isolation of different classes
of compounds. Deposit samples were separated into
heptane-soluble (HS) and heptane-insoluble (HI) fractions.
Solubility in the mixture N-methylpyrrolidone
(NMP)/CHCl3 (6:1) was finally estimated due to the use of
this eluent in the SEC system. Only the soluble fraction of
the samples is analysed by this technique. Results are shown
in Table 4. The observed changes in the solubility class of
significant amounts of material strongly suggest that
chemical reactions are taking place within these samples.
Table 4 Solubility test results for Crude B
Solubility (%) BPre BD BPost
HS 90.8 16 98
HI 8.61 84 1.8
NMP/CHCl3 (6:1) - -
Heat Exchanger Fouling and Cleaning VIII – 2009
www.heatexchanger-fouling.com 21
Overall, Table 4 shows decreasing proportions of HI-
material in the BPost sample (1.8 %) in comparison with the
feed crude, BPre (8.61 %) as the deposit precipitated. It is
also interesting to note the high percentage of HI in the
deposits recovered (84 %).
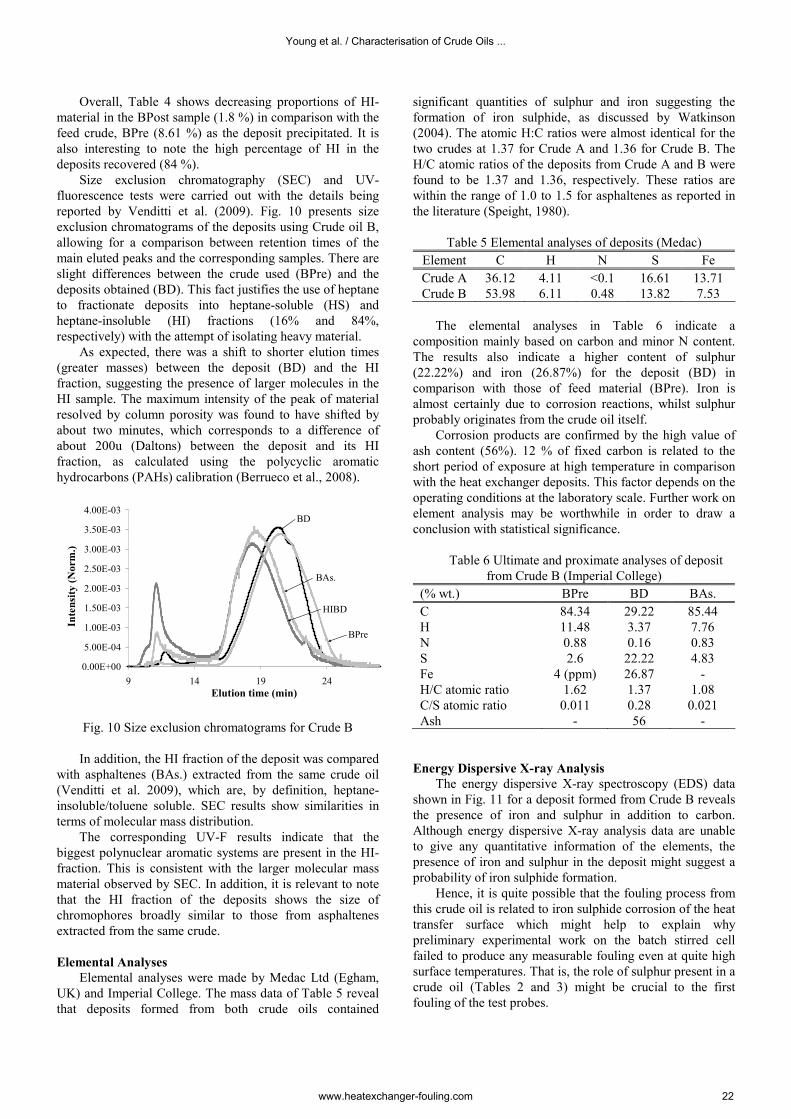
Size exclusion chromatography (SEC) and UV-
fluorescence tests were carried out with the details being
reported by Venditti et al. (2009). Fig. 10 presents size
exclusion chromatograms of the deposits using Crude oil B,
allowing for a comparison between retention times of the
main eluted peaks and the corresponding samples. There are
slight differences between the crude used (BPre) and the
deposits obtained (BD). This fact justifies the use of heptane
to fractionate deposits into heptane-soluble (HS) and
heptane-insoluble (HI) fractions (16% and 84%,
respectively) with the attempt of isolating heavy material.
As expected, there was a shift to shorter elution times
(greater masses) between the deposit (BD) and the HI
fraction, suggesting the presence of larger molecules in the
HI sample. The maximum intensity of the peak of material
resolved by column porosity was found to have shifted by
about two minutes, which corresponds to a difference of
about 200u (Daltons) between the deposit and its HI
fraction, as calculated using the polycyclic aromatic
hydrocarbons (PAHs) calibration (Berrueco et al., 2008).
0.00E+00
5.00E-04
1.00E-03
1.50E-03
2.00E-03
2.50E-03
3.00E-03
3.50E-03
4.00E-03
9 14 19 24
Elution time (min)
Inte
nsi
ty (
Norm
.)
BD
BAs.
HIBD
BPre
Fig. 10 Size exclusion chromatograms for Crude B
In addition, the HI fraction of the deposit was compared
with asphaltenes (BAs.) extracted from the same crude oil
(Venditti et al. 2009), which are, by definition, heptane-
insoluble/toluene soluble. SEC results show similarities in
terms of molecular mass distribution.
The corresponding UV-F results indicate that the
biggest polynuclear aromatic systems are present in the HI-
fraction. This is consistent with the larger molecular mass
material observed by SEC. In addition, it is relevant to note
that the HI fraction of the deposits shows the size of
chromophores broadly similar to those from asphaltenes
extracted from the same crude.
Elemental Analyses
Elemental analyses were made by Medac Ltd (Egham,
UK) and Imperial College. The mass data of Table 5 reveal
that deposits formed from both crude oils contained
significant quantities of sulphur and iron suggesting the
formation of iron sulphide, as discussed by Watkinson
(2004). The atomic H:C ratios were almost identical for the
two crudes at 1.37 for Crude A and 1.36 for Crude B. The
H/C atomic ratios of the deposits from Crude A and B were
found to be 1.37 and 1.36, respectively. These ratios are
within the range of 1.0 to 1.5 for asphaltenes as reported in
the literature (Speight, 1980).
Table 5 Elemental analyses of deposits (Medac)
Element C H N S Fe
Crude A 36.12 4.11 <0.1 16.61 13.71
Crude B 53.98 6.11 0.48 13.82 7.53
The elemental analyses in Table 6 indicate a
composition mainly based on carbon and minor N content.
The results also indicate a higher content of sulphur
(22.22%) and iron (26.87%) for the deposit (BD) in
comparison with those of feed material (BPre). Iron is
almost certainly due to corrosion reactions, whilst sulphur
probably originates from the crude oil itself.
Corrosion products are confirmed by the high value of
ash content (56%). 12 % of fixed carbon is related to the
short period of exposure at high temperature in comparison
with the heat exchanger deposits. This factor depends on the
operating conditions at the laboratory scale. Further work on
element analysis may be worthwhile in order to draw a
conclusion with statistical significance.
Table 6 Ultimate and proximate analyses of deposit
from Crude B (Imperial College)
(% wt.) BPre BD BAs.
C 84.34 29.22 85.44
H 11.48 3.37 7.76
N 0.88 0.16 0.83
S 2.6 22.22 4.83
Fe 4 (ppm) 26.87 -
H/C atomic ratio 1.62 1.37 1.08
C/S atomic ratio 0.011 0.28 0.021
Ash - 56 -
Energy Dispersive X-ray Analysis
The energy dispersive X-ray spectroscopy (EDS) data
shown in Fig. 11 for a deposit formed from Crude B reveals
the presence of iron and sulphur in addition to carbon.
Although energy dispersive X-ray analysis data are unable
to give any quantitative information of the elements, the
presence of iron and sulphur in the deposit might suggest a
probability of iron sulphide formation.
Hence, it is quite possible that the fouling process from
this crude oil is related to iron sulphide corrosion of the heat
transfer surface which might help to explain why
preliminary experimental work on the batch stirred cell
failed to produce any measurable fouling even at quite high
surface temperatures. That is, the role of sulphur present in a
crude oil (Tables 2 and 3) might be crucial to the first
fouling of the test probes.
Young et al. / Characterisation of Crude Oils ...
www.heatexchanger-fouling.com 22

Fig. 11 EDS analysis of a deposit formed from Crude B
Effect of Shear Stress
The shear stress at the surface of the heated probe was
determined using CFD (Yang et al., 2009a). The stirred cell
flow structure becomes turbulent at relatively low cell
Reynolds numbers (Smith and Townsend, 1982; Mullin et
al., 1983).
Re for tube f low is equivalent to 0.6329 Re for sw irl f low
0
5000
10000
15000
20000
25000
30000
0 5000 10000 15000 20000 25000 30000 35000 40000
Re (Swirl flow, 100 - 600rpm)
Equivalent Re (Tube flow)
-0.5
0
0.5
1
1.5
2
2.5
0 5000 10000 15000 20000 25000 30000 35000 40000
Shear stress (Pa)
Re Shear Stress (Pa) Linear (Re )
Fig. 12 Equivalent Reynolds numbers
For refinery applications, the relationship between the
stirred cell Reynolds number and the tubular flow Reynolds
number which gives the same surface shear stress is shown
in Fig. 12. Here, the tube internal diameter was 14.8 mm
and the crude oil viscosity and density were 0.0008 Pa s and
760 kg/m3, respectively. The stirred cell Reynolds number is
defined by Re = ρND2/µ where N is the rotational speed of
the stirrer of diameter D, and µ and ρ are the viscosity and
density of the bulk crude oil, respectively.
The effect of stepping up for a short period the stirrer
speed and hence the shear stress on the fouling rate of Crude
B is shown in Fig. 13. This shows that the fouling rate for all
the three probe thermocouple locations was constant over a
three hour period when the surface shear stress was kept
constant at 0.75 Pa. The stirrer speed was then increased
from 200 rpm to 550 rpm such that the surface shear stress
was increased to 2.5 Pa for a short period of time. The
stirrer speed was then reduced back to 200 rpm such that the
surface shear stress was reduced back to its original value of
0.75 Pa. Fig. 13 shows that the fouling rates more-or-less
resumed their original values, albeit at somewhat lower
fouling resistances. The results from this experiment provide
evidence therefore that an increase in surface shear stress
can lead to the removal of a crude oil fouling deposit.
Sample A ( Shear Stress Stepped 0.75 Pa to 2.5 Pa )
370
372
374
376
378
380
382
384
386
388
390
3.00 4.00 5.00 6.00 7.00 8.00 9.00
Hrs
Surface Temperature oC
150
200
250
300
350
400
450
500
550
600
Rpm
0.93
0.88
0.73
1.32
0.9
0.92
360 Watts - 200 rpm - t bulk 280 Deg C
Fig. 13 Effect of stirrer speed and hence of shear stress
Effect of Surface Temperature
The stirred cell can also be used to show how the
surface temperature affects the fouling rate. Preliminary
experiments had shown that the batch stirred cell could be
used to obtain a long-time fouling run by shutting down the
apparatus overnight and resuming the experiment later on
without cleaning the test probe surface. No changes in
fouling rates were found by operation in this manner
provided that the same stirrer speed and cartridge heater
power were used. This property of the system was then
exploited in the study of the effect of surface temperature.
For a given stirrer speed the surface temperature can be
changed quickly by changing the power supplied to the
cartridge heater. This change manifests itself in a change in
the difference between the probe and bulk temperatures.
Figure 14 shows such changes for Crude B stirred at 200
rpm. The initial values of twb and tws were 390oC and
380oC, respectively. It can be seen that the probe-bulk
temperature difference increases with an increase in power
supplied. It can also be seen that the fouling rate (which is
proportional to the slope of the temperature difference plot)
increases as well, as expected.
120
130
140
150
160
170
180
190
0 2 4 6 8 10 12 14 16
Consecutive Run Time (hours)
Delta Temperature (deg C)
1.419 o
C hr-1
1.87 o
C hr-1
2.018 o
C hr-1
0.85 o C hr
-1
1.13 o C hr-1
1.4 o C hr
-1
Fig. 14 Effect of changing cartridge power for Crude B
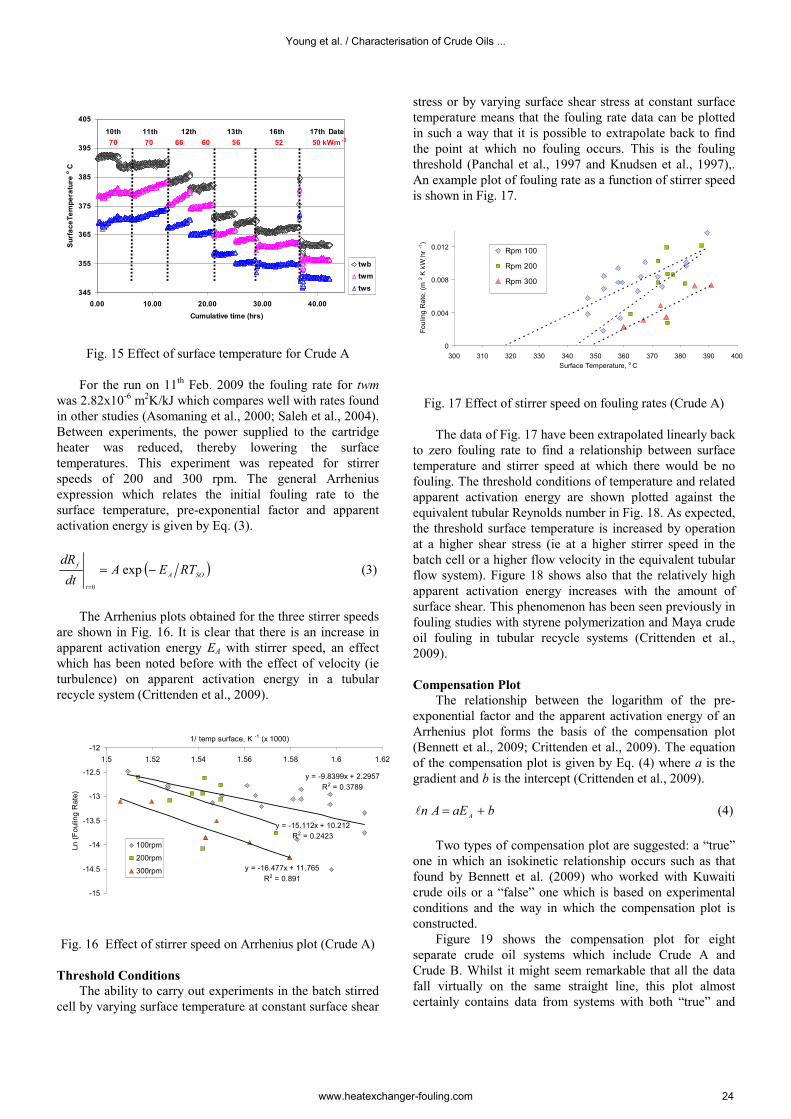
Figure 15 shows the change in probe temperatures (twb,
twm and tws) as a function of the cumulative run time for
Crude A for a fixed stirrer speed of 100 rpm. Six runs were
carried out consecutively on the same test probe without
cleaning in between runs.
Heat Exchanger Fouling and Cleaning VIII – 2009
www.heatexchanger-fouling.com 23
345
355
365
375
385
395
405
0.00 10.00 20.00 30.00 40.00
Cumulative time (hrs)
SurfaceTemperature o C
twb
twm
tws
10th 11th 12th 13th 16th 17th Date
70 70 66 60 56 52 50 kWm -2
Fig. 15 Effect of surface temperature for Crude A
For the run on 11th Feb. 2009 the fouling rate for twm
was 2.82x10⁻⁶ m
2K/kJ which compares well with rates found
in other studies (Asomaning et al., 2000; Saleh et al., 2004).
Between experiments, the power supplied to the cartridge
heater was reduced, thereby lowering the surface
temperatures. This experiment was repeated for stirrer
speeds of 200 and 300 rpm. The general Arrhenius
expression which relates the initial fouling rate to the
surface temperature, pre-exponential factor and apparent
activation energy is given by Eq. (3).
( )SOA
t
fRTEA
dt
dR−=
=
exp
0
(3)
The Arrhenius plots obtained for the three stirrer speeds
are shown in Fig. 16. It is clear that there is an increase in
apparent activation energy EA with stirrer speed, an effect
which has been noted before with the effect of velocity (ie
turbulence) on apparent activation energy in a tubular
recycle system (Crittenden et al., 2009).
y = -9.8399x + 2.2957
R2 = 0.3789
y = -15.112x + 10.212
R2 = 0.2423
y = -16.477x + 11.765
R2 = 0.891
-15
-14.5
-14
-13.5
-13
-12.5
-12
1.5 1.52 1.54 1.56 1.58 1.6 1.62
1/ temp surface, K -1 (x 1000)
Ln
(F
oulin
g R
ate
)
100rpm
200rpm
300rpm
Fig. 16 Effect of stirrer speed on Arrhenius plot (Crude A)
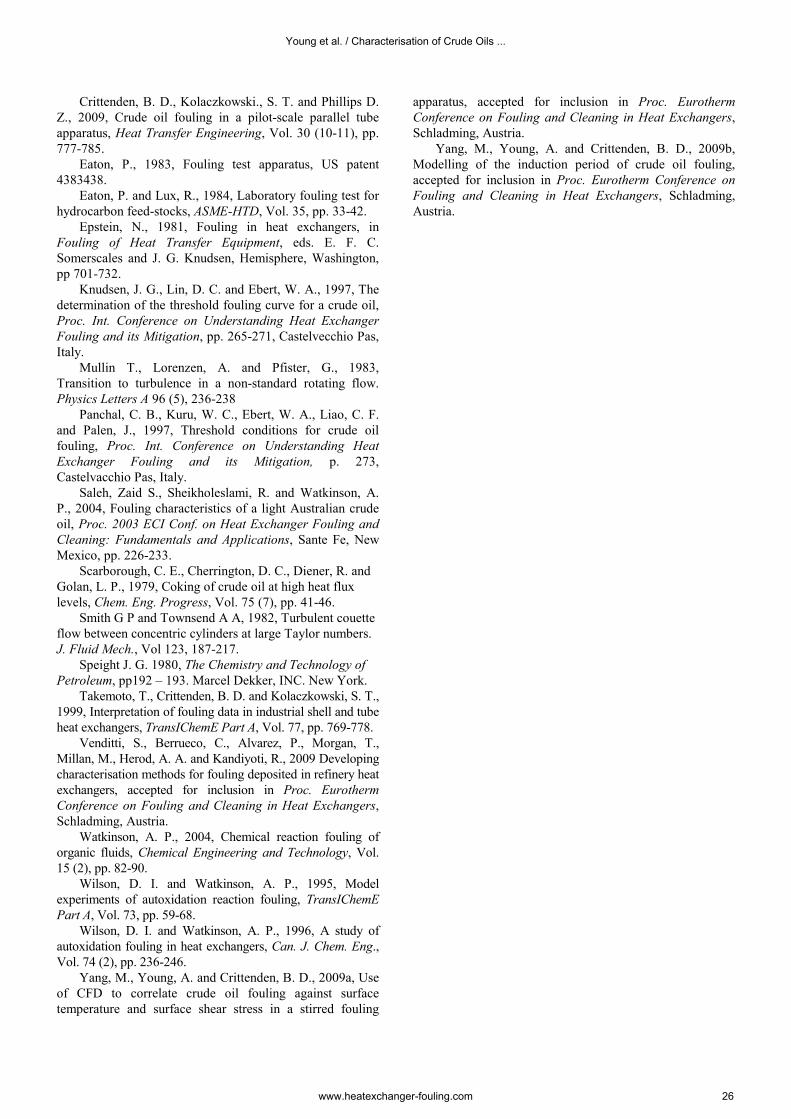
Threshold Conditions
The ability to carry out experiments in the batch stirred
cell by varying surface temperature at constant surface shear
stress or by varying surface shear stress at constant surface
temperature means that the fouling rate data can be plotted
in such a way that it is possible to extrapolate back to find
the point at which no fouling occurs. This is the fouling
threshold (Panchal et al., 1997 and Knudsen et al., 1997),.
An example plot of fouling rate as a function of stirrer speed
is shown in Fig. 17.
0
0.004
0.008
0.012
300 310 320 330 340 350 360 370 380 390 400
Surface Temperature, o C
Fo
ulin
g R
ate
, (m
2 K
kW
hr
-1)
Rpm 100
Rpm 200
Rpm 300
Linear (100
Fig. 17 Effect of stirrer speed on fouling rates (Crude A)
The data of Fig. 17 have been extrapolated linearly back
to zero fouling rate to find a relationship between surface
temperature and stirrer speed at which there would be no
fouling. The threshold conditions of temperature and related
apparent activation energy are shown plotted against the
equivalent tubular Reynolds number in Fig. 18. As expected,
the threshold surface temperature is increased by operation
at a higher shear stress (ie at a higher stirrer speed in the
batch cell or a higher flow velocity in the equivalent tubular
flow system). Figure 18 shows also that the relatively high
apparent activation energy increases with the amount of
surface shear. This phenomenon has been seen previously in
fouling studies with styrene polymerization and Maya crude
oil fouling in tubular recycle systems (Crittenden et al.,
2009).
Compensation Plot
The relationship between the logarithm of the pre-
exponential factor and the apparent activation energy of an
Arrhenius plot forms the basis of the compensation plot
(Bennett et al., 2009; Crittenden et al., 2009). The equation
of the compensation plot is given by Eq. (4) where a is the
gradient and b is the intercept (Crittenden et al., 2009).
baEAnA+=l (4)
Two types of compensation plot are suggested: a “true”
one in which an isokinetic relationship occurs such as that
found by Bennett et al. (2009) who worked with Kuwaiti
crude oils or a “false” one which is based on experimental
conditions and the way in which the compensation plot is
constructed.
Figure 19 shows the compensation plot for eight
separate crude oil systems which include Crude A and
Crude B. Whilst it might seem remarkable that all the data
fall virtually on the same straight line, this plot almost
certainly contains data from systems with both “true” and
Young et al. / Characterisation of Crude Oils ...
www.heatexchanger-fouling.com 24

“false” types. The potential value of the compensation plot
is described elsewhere (Crittenden et al., 2009).
300
310
320
330
340
350
360
370
380
390
400
0 2000 4000 6000 8000 10000 12000 14000
Equivalent Tube Re Number
Th
resh
old
Su
rfa
ce
Te
mpe
ratu
re,
oC
0
20000
40000
60000
80000
100000
120000
140000
160000
Activation Energy (J / mol)
■: Apparent activation energy; �: Threshold temperature
Fig. 18 Threshold plot for Crude A
-20
-10
0
10
20
30
40
50
0 50 100 150 200 250 300
EA (kJ mol-1)
ln[A(m2 K / kJ)]
Crude ACrude BMaya crude oil (Crittenden et al. 2009)Kuwaiti crude oil (Bennett et al. 2009)Desalted crude oil (Knudsen et al. 1999)Shell Westhollow crude oil (Panchal et al. 1999)Exxon refinery crude oil (Scarborough et al. 1979)Shell Wood River crude oil (Panchal et al. 1999)
Fig. 19 Compensation plot for a range of crude oils
CONCLUSIONS
A batch cell stirred cell system has been developed
which allows relatively fast studies to be made of the effect
of key operating parameters on crude oil fouling and
facilitates characterization of deposits formed and
feedstocks used. The experimental system, supported by
CFD studies, also allows fouling threshold conditions of
surface temperature and shear stress to be identified
relatively quickly in the laboratory. Because of the limited
number of crude oils tested to date, it is not yet possible to
reach any conclusions about the relationship between the
activation energy of fouling and fluid properties.
Nevertheless, the experimental system is able to generate
further data to be used in the construction of a generic
compensation plot for all crude oils. The effects of bulk
temperature, oxygen concentration, and pressure will also be
the subject of further study. Indeed, analysis of the crude
oils before and after fouling might reveal whether the
autoxidation mechanism is important in the fouling process.
ACKNOWLEDGMENTS
The authors are grateful to the UK’s Engineering and
Physical Sciences Research Council (EPSRC) for the award
of a research grant (EP/D506131/1) to study the role of
asphaltenes in crude oil fouling. The authors are grateful
also to their project partners at the University of Cambridge,
and to ExxonMobil and Petronas.
NOMENCLATURE
a gradient of linear plot of Eq. (4), mol/kJ
A pre-exponential factor in Arrhenius equation, m2K/W
b intercept of linear plot of Eq. (4)
D stirrer diameter, m
EA apparent activation energy, kJ/mol
N stirrer speed, Hz
q heat flux, kW/m2
R gas constant, kJ/molK
Ra probe surface roughness, µm
Re batch stirred cell Reynolds number
Rf fouling resistance, m2K/W
Tb bulk temperature, K
Ts surface temperature, K
Tso initial (clean) surface temperature, K
Tst surface temperature at time t, K
t time, h
µ viscosity, Pa s
ρ density, kg/m3
REFERENCES
Asomaning, S., Panchal, C. B., and Liao, C. F., 2000,
Correlating field and laboratory data for crude oil, Heat
Transfer Engineering, Vol. 21 (3), pp. 17-23.
Bennett, C. A., Kistler, R. S., Nangia, K., Al-Ghawas,
W., Al-Hajji, N. and Al-Jemaz, A., 2009, Observation of an
isokinetic temperature and compensation effect for high
temperature crude oil fouling, Heat Transfer Engineering,
Vol. 30 (10-11), pp. 794-804.
Berrueco, C., Venditti, S., Morgan, T. J., Alvarez, P.,
Millan-Agorio, M., Herod, A. A. And Kandiyoti, R., 2008,
Calibration of size-exclusion chromatography columns with
1-methyl-2-pyrrolidinone (NMP)/chloroform mixtures as
eluent: applications to petroleum-derived samples, Energy
and Fuels, Vol. 30 (10-11), pp. 3265-3274.
Chenoweth, J. M., 1988, Liquid fouling monitoring
equipment, in Fouling Science and Technology, eds. L. F.
Melo, T. R. Bott and C. A., Kluwer Academic Publishers,
Dordrecht, pp. 49-65.
Crittenden, B. D., Hout, S. A. and Alderman, N. J.,
1987, Model experiments of chemical reaction fouling,
TransIChemE Part A, Vol. 65, pp. 165-170.
Crittenden, B. D. and Alderman, N. J., 1988, Negative
fouling resistances: the effect of surface roughness, Chemical
Engineering Science, Vol. 43, pp. 829-838.
Crittenden B. D., Kolaczkowski, S. T. and Downey, I. L.,
1992, Fouling of crude oil preheat exchangers, Trans IChemE
Part A, Vol. 70, pp. 547-557.
Crittenden, B. D., Kolaczkowski, S. T. and Takemoto, T.,
1993, Use of in-tube inserts to reduce fouling from crude oils,
AIChE Symp Series, Vol. 89, No. 295, pp. 300-307.
Heat Exchanger Fouling and Cleaning VIII – 2009
www.heatexchanger-fouling.com 25
Crittenden, B. D., Kolaczkowski., S. T. and Phillips D.
Z., 2009, Crude oil fouling in a pilot-scale parallel tube
apparatus, Heat Transfer Engineering, Vol. 30 (10-11), pp.
777-785.
Eaton, P., 1983, Fouling test apparatus, US patent
4383438.
Eaton, P. and Lux, R., 1984, Laboratory fouling test for
hydrocarbon feed-stocks, ASME-HTD, Vol. 35, pp. 33-42.
Epstein, N., 1981, Fouling in heat exchangers, in
Fouling of Heat Transfer Equipment, eds. E. F. C.
Somerscales and J. G. Knudsen, Hemisphere, Washington,
pp 701-732.
Knudsen, J. G., Lin, D. C. and Ebert, W. A., 1997, The
determination of the threshold fouling curve for a crude oil,
Proc. Int. Conference on Understanding Heat Exchanger
Fouling and its Mitigation, pp. 265-271, Castelvecchio Pas,
Italy.
Mullin T., Lorenzen, A. and Pfister, G., 1983,
Transition to turbulence in a non-standard rotating flow.
Physics Letters A 96 (5), 236-238
Panchal, C. B., Kuru, W. C., Ebert, W. A., Liao, C. F.
and Palen, J., 1997, Threshold conditions for crude oil
fouling, Proc. Int. Conference on Understanding Heat
Exchanger Fouling and its Mitigation, p. 273,
Castelvacchio Pas, Italy.
Saleh, Zaid S., Sheikholeslami, R. and Watkinson, A.
P., 2004, Fouling characteristics of a light Australian crude
oil, Proc. 2003 ECI Conf. on Heat Exchanger Fouling and
Cleaning: Fundamentals and Applications, Sante Fe, New
Mexico, pp. 226-233.
Scarborough, C. E., Cherrington, D. C., Diener, R. and
Golan, L. P., 1979, Coking of crude oil at high heat flux
levels, Chem. Eng. Progress, Vol. 75 (7), pp. 41-46.
Smith G P and Townsend A A, 1982, Turbulent couette
flow between concentric cylinders at large Taylor numbers.
J. Fluid Mech., Vol 123, 187-217.
Speight J. G. 1980, The Chemistry and Technology of
Petroleum, pp192 – 193. Marcel Dekker, INC. New York.
Takemoto, T., Crittenden, B. D. and Kolaczkowski, S. T.,
1999, Interpretation of fouling data in industrial shell and tube
heat exchangers, TransIChemE Part A, Vol. 77, pp. 769-778.
Venditti, S., Berrueco, C., Alvarez, P., Morgan, T.,
Millan, M., Herod, A. A. and Kandiyoti, R., 2009 Developing
characterisation methods for fouling deposited in refinery heat
exchangers, accepted for inclusion in Proc. Eurotherm
Conference on Fouling and Cleaning in Heat Exchangers,
Schladming, Austria.
Watkinson, A. P., 2004, Chemical reaction fouling of
organic fluids, Chemical Engineering and Technology, Vol.
15 (2), pp. 82-90.
Wilson, D. I. and Watkinson, A. P., 1995, Model
experiments of autoxidation reaction fouling, TransIChemE
Part A, Vol. 73, pp. 59-68.
Wilson, D. I. and Watkinson, A. P., 1996, A study of
autoxidation fouling in heat exchangers, Can. J. Chem. Eng.,
Vol. 74 (2), pp. 236-246.
Yang, M., Young, A. and Crittenden, B. D., 2009a, Use
of CFD to correlate crude oil fouling against surface
temperature and surface shear stress in a stirred fouling
apparatus, accepted for inclusion in Proc. Eurotherm
Conference on Fouling and Cleaning in Heat Exchangers,
Schladming, Austria.
Yang, M., Young, A. and Crittenden, B. D., 2009b,
Modelling of the induction period of crude oil fouling,
accepted for inclusion in Proc. Eurotherm Conference on
Fouling and Cleaning in Heat Exchangers, Schladming,
Austria.
Young et al. / Characterisation of Crude Oils ...
www.heatexchanger-fouling.com 26