characterisation of dirt, dust and volcanic ash: a study ... that cover the elemental and melting...
TRANSCRIPT

UNCLASSIFIED
UNCLASSIFIED
Characterisation of Dirt, Dust and Volcanic Ash: A Study on the Potential for Gas Turbine Engine Degradation
Christopher A. Wood, Sonya L. Slater, Matthew Zonneveldt, John Thornton, Nicholas Armstrong and Ross A. Antoniou
Aerospace Division
Defence Science and Technology Group
DST-Group-TR-3367
ABSTRACT Airborne dust and volcanic ash particulates ingested by aircraft gas turbine engines can have deleterious effects on engine performance and function. Degradation mechanisms, such as compressor erosion and the deposition of molten material in turbines, are influenced by the physical and chemical characteristics of the ingested materials. This study characterised a selection of dirt, dust and volcanic ash samples in order to assess their potential for causing engine degradation. All the samples examined contained silicate-based material of sufficient hardness to erode compressor components. A significant proportion of most samples consisted of low melting point materials that may deposit in the turbines of current Australian Defence Force (ADF) engines. Such deposition on turbine components can lead to the degradation of engine components and their protective coatings. It is likely that future ADF engines, with higher turbine inlet temperatures, will be susceptible to deposition of molten material from a wider range of particulate material compositions. This may cause higher maintenance costs and/or impacts on aircraft availability. Increased knowledge on the effects of particulate ingestion on the performance and degradation of aircraft gas turbine engines will enable aircraft operators to make better informed decisions about operations in environments that contain high levels of airborne particulates.
RELEASE LIMITATION Approved for Public Release
UNCLASSIFIED
UNCLASSIFIED
Produced by Aerospace Division Defence Science Technology Group 506 Lorimer Street Fishermans Bend, Victoria, 3207, Australia Telephone: 1300 333 362 Commonwealth of Australia 2017 May 2017 AR-016-865
APPROVED FOR PUBLIC RELEASE
UNCLASSIFIED
UNCLASSIFIED
Characterisation of Dirt, Dust and Volcanic Ash:
A Study on the Potential for Gas Turbine Engine Degradation
Executive Summary The Australian Defence Force (ADF) operates gas turbine aero-engines in a variety of environments, both domestically and abroad. Operation of gas turbines in environments that feature elevated concentrations of airborne particulates, such as dust and volcanic ash, can have deleterious effects on both the function and performance of the engines.
This report characterises the properties of a range of dirt/dust and volcanic ash particulate samples in order to identify their potential to cause engine degradation issues. Properties characterised included size, morphology, chemical composition, mineralogy, melting point, and hardness of particulates.
The study determined that, while ground-sampling is useful for identifying the minerals present at a location, sampling of actual airborne particulates provides for more realistic samples in terms of what may be ingested by an aircraft engine.
It was found that eight chemical elements made up the compositions of all of the dirt/dust and volcanic ash samples in this study, and that while all samples were mineralogically quite different, they were very similar in terms of their chemical compositions.
Across all the samples, silicate minerals were the most abundant, with quartz (silicon dioxide) being the major phase in all samples. Most silicate minerals are harder than common engine alloys, and are therefore capable of causing erosion to engine blades and vanes.
The melting points of the various mineral constituents in the dirt/dust and volcanic ash samples spanned a wide range of temperatures. With the exceptions of the high melting point phases of silicon dioxide, all of the minerals were found to have melting points below the Turbine Inlet Temperatures (TITs) of the highest operating temperature of some current ADF engines. This indicated that a significant fraction of ingested fine particles can be melted within the current ADF engines with the highest TITs, and then deposited on the downstream turbine components, where they have the potential to cause significant physical and chemical degradation. Such an event has been observed in a current engine type employed by the ADF. These molten deposits are commonly referred to as ‘CMAS’ (Calcium-Magnesium-Alumino Silicate), the elements that are commonly found in dirt, sand and dust deposits on turbine components.
Hence, it is anticipated that turbine component degradation by CMAS will become a more significant issue in future ADF engine fleets due to the combination of the prevalence of quartz and the move towards hotter TITs. It is likely that in future, high performance ADF engines will be able to more readily melt naturally occurring quartz (impure silicon
UNCLASSIFIED
UNCLASSIFIED
dioxide), which will lead to increased degradation, higher than expected operating costs and/or impacts on availability.
Recommendations from this study include:
1. that thermodynamic modelling of particulates in gas turbine engines be undertaken to gain a quantitative understanding of the factors that affect melting and subsequent deposition
2. that consideration be given to the development of a set of standard particulate compositions that cover the elemental and melting ranges found in dirt/dust and volcanic ash samples, rather than the single standard composition that is frequently used to assess degradation of engine components and their protective coatings
3. that Defence Science Technology Group develop a burner rig to perform controlled particulate melting and deposition experiments, with particular emphasis on ascertaining whether naturally occurring quartz will deposit in the F135 engine.
Increased knowledge on the effects of particulate ingestion on the performance and degradation of aircraft gas turbine engines will enable aircraft operators to make more informed decisions on the conduct of operations in environments that contain high levels of airborne particulates.

UNCLASSIFIED
UNCLASSIFIED
Authors
Christopher A. Wood Aerospace Division Chris obtained a Bachelor of Science (Honours) in Materials Science in 1996, followed by a PhD in Materials Engineering in 2001, both from Monash University. Chris joined DST Group Aerospace Division as a Research Scientist in 2002. He is currently a Senior Materials Scientist in the Airframe Forensic & Metallic Technologies Group of Aerospace Division’s Airframe Technology & Safety Branch. Chris’s work experience includes gas turbine engine and component failure analysis, engine durability research focused on dust and volcanic ash ingestion, ultra-high temperature materials development for hypersonic applications, and aircraft accident investigation. Additionally, in 2012-13 Chris spent five months in the MEAO as a deployed operations analyst with HQ JTF633
____________________ _________________________________________________________
Sonya L. Slater Aerospace Division Sonya graduated from the University of New South Wales in 1997 after obtaining a Bachelor of Engineering (Ceramic Engineering) with first class honours. She commenced work for DST Group in 1998 in Aerospace Division within Aircraft health and Safety Branch. Over the past 19 years Sonya’s work has included aero-engine lifing; fatigue crack growth modelling; engine material behaviour; development of ultra-high temperature ceramics; ingestion effects of dirt/dust and ash on gas turbine engines; and failure analysis of gas turbine engines including numerous aircraft accident investigations.
____________________ _________________________________________________________
Matthew Zonneveldt Aerospace Division Matthew is a member of the Engine and Fuels Integrity group in Aerospace Division. Since 2010, he has been working as an engineer investigating the behaviour of materials in gas turbine engines. He holds a Bachelor of Engineering in Materials Engineering from Monash University.
____________________ _________________________________________________________
UNCLASSIFIED
UNCLASSIFIED
John Thornton Aerospace Division John has worked in the fields of X-ray astronomy, semi-conductor processing, ion beam and X-ray optics, gas turbine engine life extension and thin films and coatings. He has 34 publications in refereed journals. He has also served on advisory panels for new scientific instruments at national facilities and was chairperson for the Victorian Branch of the Australian Institute of Physics. John joined DST Group in 1990 and is currently the Science Team Leader for Engine Durability
____________________ _________________________________________________________
Nicholas Armstrong Aerospace Division Nicholas obtained his PhD is 2000 from the University of Technology Sydney (UTS). Nicholas has successfully completed a number of postdoctoral and visiting fellowships in Australia, United States and Italy. He has also held a number of senior research positions in academia and the finance industry. His research interests include, mathematical and theoretical physics, modelling stochastic processes, data analysis and Bayesian statistics. Nicholas joined Aerospace Division at DST Group in 2011 and is a senior defence scientist in risk and reliability, and materials science related research for the Engine and Fuel Integrity Group.
____________________ _________________________________________________________
Ross A. Antoniou Aerospace Division Dr Ross Antoniou is currently Head of Engines and Fuels Integrity in DST Group. He joined ARL in 1990 and has worked in the areas of performance of advanced materials; development of coatings for transmission and propulsion systems; fatigue, fracture and fretting-fatigue behaviour; and tribological behaviour. Ross also has responsibility for risk assessment and probabilistic analysis of engines.
____________________ _________________________________________________________
UNCLASSIFIED DST-Group-TR-3367
UNCLASSIFIED
Contents
1. INTRODUCTION ............................................................................................................... 1 1.1 Cold-End Degradation Effects ................................................................................ 1 1.2 Hot-End Degradation Effects .................................................................................. 1 1.3 Engine Flame-out Effects ......................................................................................... 3 1.4 Particulate Properties and Characterisation ......................................................... 3
2. PARTICLE SIZE ANALYSIS ............................................................................................ 5 2.1 Experimental Method ............................................................................................... 5 2.2 Dirt and Dust Analysis ............................................................................................ 5 2.3 Volcanic Ash Analysis ............................................................................................. 6 2.4 Consolidated Data .................................................................................................... 7
3. PARTICULATE MORPHOLOGIES .............................................................................. 12 3.1 Experimental Method ............................................................................................. 12 3.2 Dirt and Dust Analysis .......................................................................................... 13 3.3 Volcanic Ash Analysis ........................................................................................... 26
4. ELEMENTAL ANALYSES .............................................................................................. 31 4.1 Dirt and Dust Analyses.......................................................................................... 31 4.2 Volcanic Ash Analyses........................................................................................... 32 4.3 Comparison of Dirt/Dust and Volcanic Ash Samples ..................................... 33
5. PHASE ANALYSES .......................................................................................................... 35 5.1 Experimental Procedure ......................................................................................... 35
5.1.1 X-ray Diffraction Data Collection ........................................................ 35 5.1.2 X-Ray Diffraction Specimen Preparation ........................................... 35 5.1.3 Phase Analysis ....................................................................................... 35
5.2 XRD Results ............................................................................................................. 37 5.2.1 Dirt and Dust Analysis ......................................................................... 37 5.2.2 Volcanic Ash Analysis .......................................................................... 38
5.3 Physical Properties of the Particulates ................................................................ 40 5.3.1 Evaluation of Erosive Potential ........................................................... 40 5.3.2 Evaluation of Deposition Potential ..................................................... 41
6. DISCUSSION .................................................................................................................... 45
7. CONCLUSIONS ................................................................................................................ 49
8. RECOMMENDATIONS .................................................................................................. 51
9. REFERENCES .................................................................................................................... 52
10. ACKNOWLEDGEMENTS .............................................................................................. 55

UNCLASSIFIED DST-Group-TR-3367
UNCLASSIFIED
This page is intentionally blank.
UNCLASSIFIED DST-Group-TR-3367
UNCLASSIFIED
Glossary
ADF Australian Defence Force
CMAS Calcium-Magnesium-Alumino Silicate
DTA (NZ) Defence Technology Agency (New Zealand)
DST Group Defence Science and Technology Group
EAPS Engine Air Particle Separator
EDS Energy Dispersive (X-Ray) Spectroscopy
LPSA Laser Particle Size Analysis
MEAO Middle East Area of Operations
PSD Particle Size Distribution
SEM Scanning Electron Microscopy
S/N Serial Number
TBC Thermal Barrier Coating
f Liquidus Temperature
Tm Melting Temperature
TIT Turbine Inlet Temperature
XRD X-Ray Diffraction

UNCLASSIFIED DST-Group-TR-3367
UNCLASSIFIED
This page is intentionally blank.
UNCLASSIFIED DST-Group-TR-3367
UNCLASSIFIED 1
1. Introduction
The Australian Defence Force (ADF) operates gas turbine aero-engines in a variety of environments, both domestically and abroad. Operation of gas turbines in environments that feature elevated concentrations of airborne particulates, such as dust and volcanic ash, can have deleterious effects on both the performance and function of gas turbine engines [1]. Ingested particulates can affect both the cold (fan and compressor) and hot (combustor and turbine) sections of gas turbine aero-engines.
1.1 Cold-End Degradation Effects
Ingestion of airborne particulates can cause erosion of fan and compressor blades and vanes, which leads to changes in geometry and increased clearances. These changes reduce compressor efficiencies and decrease stall margins [1]. Smaller, high-rpm engines, such as those found on rotary wing aircraft, are particularly susceptible to compressor erosion and subsequent performance loss. In a worst case scenario, erosion damage can lead to engine failure. The ADF experienced an erosion-related engine failure in 2004, when the RR250 engine of an ADF Kiowa suffered a fatigue failure of one of its cantilevered second stage compressor vanes, resulting in a complete loss of engine power [2]. The fatigue crack initiated after erosion had thinned the root of the vane airfoil.
Current mitigation strategies for limiting the ingestion of airborne particulates for rotary wing aircraft engines include engine air particle separators (EAPS) and mesh screens. These systems are employed to reduce the amount of both large and small particulates ingested by engines. However, such systems are not 100% effective at removing airborne particulates, and they are not practical for fixed wing aircraft.
1.2 Hot-End Degradation Effects
Particulates entrained in an engine’s gas stream can have a more complicated effect on hot-end engine componentry. Due to the high temperatures of the components and the gas stream in turbine engines, the ingestion of particulates can result in significant physical and chemical degradation of hot-end engine componentry which can cause reduced engine performance and durability. In extreme cases it can lead to component and engine failure.
In terms of the physical effects, entrained particulates can cause mechanical erosion of hot-end components and their coatings and protective oxide films. Cooling air that is bled off from the compressor can also contain entrained particulates that can agglomerate inside the cooling passages of hot turbine components which may lead to component overheating and component degradation [3].
In terms of the chemical effects, ingestion of sulphur bearing compounds, salts and dirt, can lead to sulphidation and hot corrosion of turbine components. This degradation may be accelerated if the ingested material also decreases the engine cooling efficiency. Nitridation of engine alloys also results from the synergistic effects of erosive media and
UNCLASSIFIED DST-Group-TR-3367
UNCLASSIFIED 2
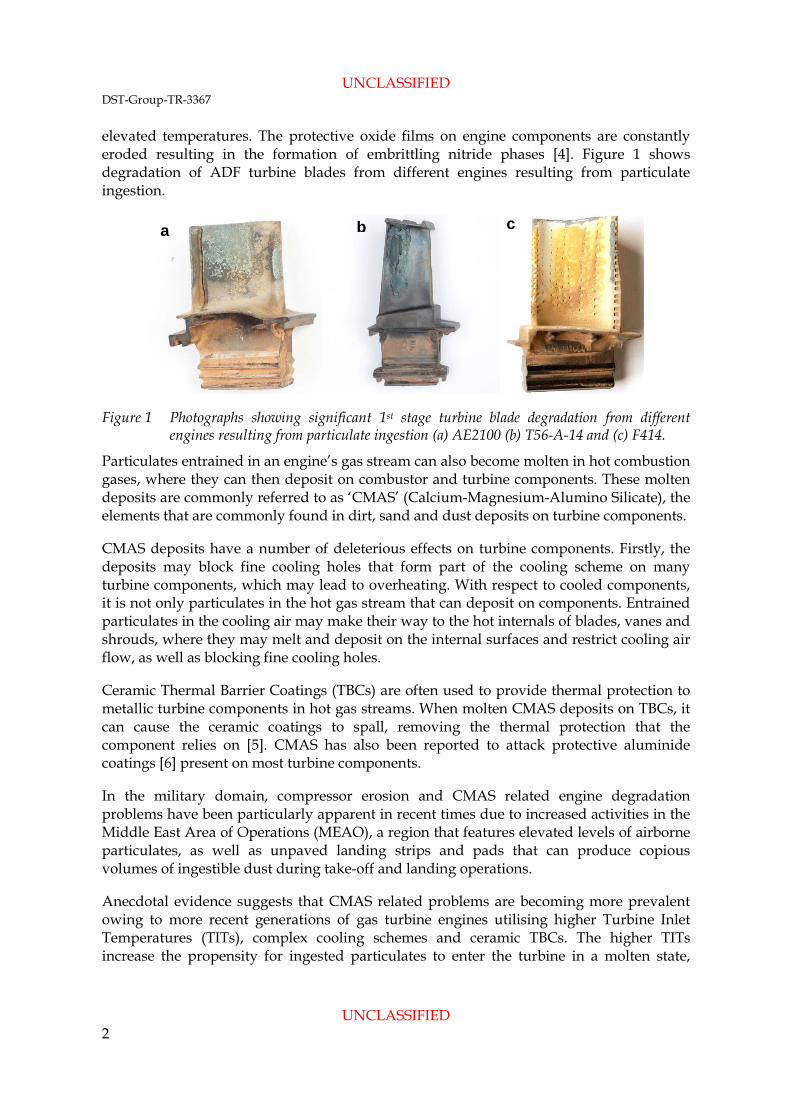
elevated temperatures. The protective oxide films on engine components are constantly eroded resulting in the formation of embrittling nitride phases [4]. Figure 1 shows degradation of ADF turbine blades from different engines resulting from particulate ingestion.
Figure 1 Photographs showing significant 1st stage turbine blade degradation from different engines resulting from particulate ingestion (a) AE2100 (b) T56-A-14 and (c) F414.
Particulates entrained in an engine’s gas stream can also become molten in hot combustion gases, where they can then deposit on combustor and turbine components. These molten deposits are commonly referred to as ‘CMAS’ (Calcium-Magnesium-Alumino Silicate), the elements that are commonly found in dirt, sand and dust deposits on turbine components.
CMAS deposits have a number of deleterious effects on turbine components. Firstly, the deposits may block fine cooling holes that form part of the cooling scheme on many turbine components, which may lead to overheating. With respect to cooled components, it is not only particulates in the hot gas stream that can deposit on components. Entrained particulates in the cooling air may make their way to the hot internals of blades, vanes and shrouds, where they may melt and deposit on the internal surfaces and restrict cooling air flow, as well as blocking fine cooling holes.
Ceramic Thermal Barrier Coatings (TBCs) are often used to provide thermal protection to metallic turbine components in hot gas streams. When molten CMAS deposits on TBCs, it can cause the ceramic coatings to spall, removing the thermal protection that the component relies on [5]. CMAS has also been reported to attack protective aluminide coatings [6] present on most turbine components.
In the military domain, compressor erosion and CMAS related engine degradation problems have been particularly apparent in recent times due to increased activities in the Middle East Area of Operations (MEAO), a region that features elevated levels of airborne particulates, as well as unpaved landing strips and pads that can produce copious volumes of ingestible dust during take-off and landing operations.
Anecdotal evidence suggests that CMAS related problems are becoming more prevalent owing to more recent generations of gas turbine engines utilising higher Turbine Inlet Temperatures (TITs), complex cooling schemes and ceramic TBCs. The higher TITs increase the propensity for ingested particulates to enter the turbine in a molten state,
b a c
UNCLASSIFIED DST-Group-TR-3367
UNCLASSIFIED 3
while the complex cooling schemes and TBCs increase the likelihood that the CMAS deposits will cause problems, such as overheating.
In the civilian sector, concerns about the effects of airborne particulates on gas turbine engines were brought into focus during the 2010 eruption of Iceland’s Eyjafjallajökull volcano, an event that closed large sectors of European airspace over a number of days owing to airborne ash particulates [7]. A lack of understanding as to what constituted a ‘safe’ concentration of airborne particulates for airliners to operate exacerbated this issue.
1.3 Engine Flame-out Effects
The deleterious effects of particulate ingestion on gas turbine engines typically arise from the long-term exposure to low-to-moderate airborne particulate concentrations. However, other significant effects can arise from short-term exposures to very-high airborne particulate concentrations; specifically, situations where aircraft fly through very-high-concentration clouds of volcanic ash. In these cases, ingested ash particulates can cause rapid erosion of compressor airfoils and, further downstream, can melt and build up in the turbine in a process known as accretion. Rapid ash build-up in the turbine on components like nozzle guide vanes can be of such a magnitude that airflow is restricted to the point that the engine surges and flames out. While not a common occurrence, this happened to British Airways Flight 9 in 1982 while flying over Indonesia. In this case, all four engines of the Boeing 747-236B surged and flamed out when the aircraft hit a dense ash cloud. The aircraft was able to glide for approximately 13 minutes before it exited the ash cloud and the engines were progressively restarted successfully [8]. A similar four-engine flame out happened to KLM Flight 867 over Anchorage, Alaska in 1989 when it flew into an ash cloud [9].
1.4 Particulate Properties and Characterisation
The potential for ingested particulates to cause physical and chemical damage and/or generate CMAS deposits is dependent on a range of properties that the particulates possess. For example, the hardness and geometry of particulates will affect their erosive potential, while chemical composition, temperature and particle size affect their ability to chemically degrade the component (hot corrosion etc.). Additionally, factors such as melting point, viscosity, particle size, heat capacity and reflectance will affect the likelihood that a particulate will melt and adhere to a turbine component.
This report characterises the properties of a range of dirt/dust and volcanic ash samples, and discusses their potential for causing engine degradation issues. Properties characterised include the size, morphology, chemical composition, mineralogy, melting point and hardness of particulates.
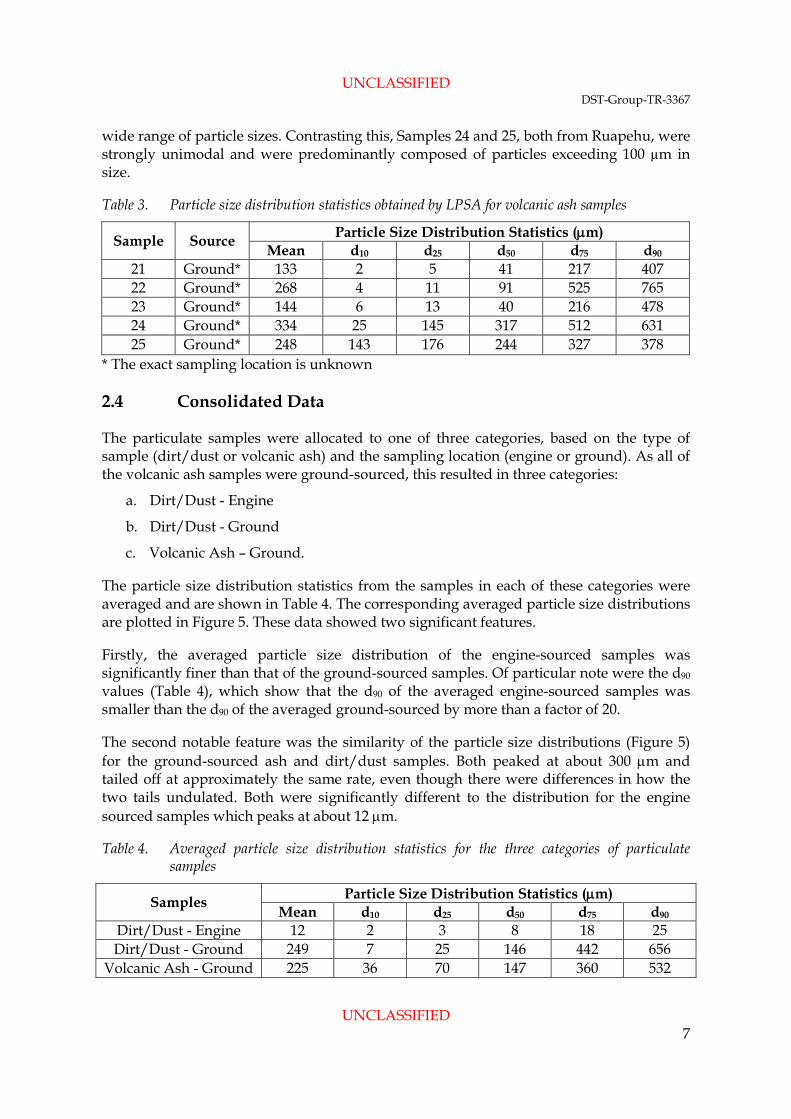
The mineralogy of the ingested particles is geographically dependant. In order to characterise the properties of a range of different environments, samples of dirt/dust and volcanic ash were collected from different parts of world. A total of 21 samples are characterised in this work. These samples and their origins are presented in Table 1. In total 16 dirt/dust samples and five volcanic ash samples were collected for analysis.
UNCLASSIFIED DST-Group-TR-3367
UNCLASSIFIED 4
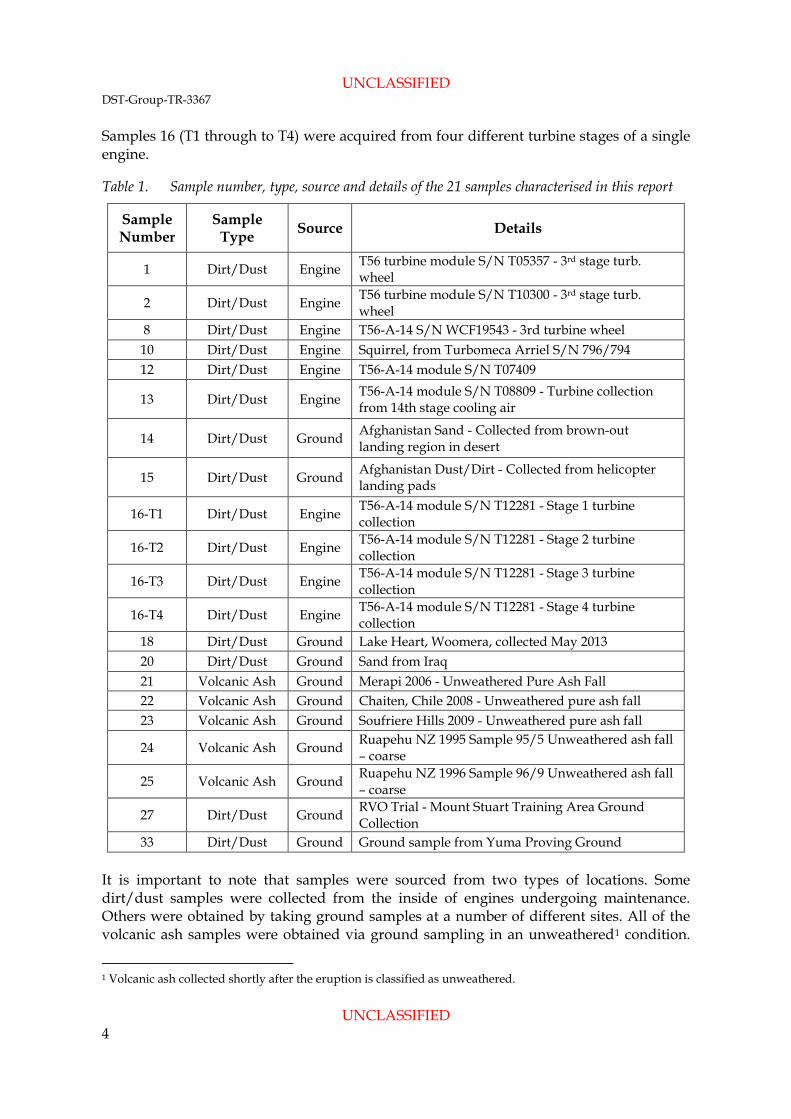
Samples 16 (T1 through to T4) were acquired from four different turbine stages of a single engine.
Table 1. Sample number, type, source and details of the 21 samples characterised in this report
Sample Number
Sample Type Source Details
1 Dirt/Dust Engine T56 turbine module S/N T05357 - 3rd stage turb. wheel
2 Dirt/Dust Engine T56 turbine module S/N T10300 - 3rd stage turb. wheel
8 Dirt/Dust Engine T56-A-14 S/N WCF19543 - 3rd turbine wheel 10 Dirt/Dust Engine Squirrel, from Turbomeca Arriel S/N 796/794 12 Dirt/Dust Engine T56-A-14 module S/N T07409
13 Dirt/Dust Engine T56-A-14 module S/N T08809 - Turbine collection from 14th stage cooling air
14 Dirt/Dust Ground Afghanistan Sand - Collected from brown-out landing region in desert
15 Dirt/Dust Ground Afghanistan Dust/Dirt - Collected from helicopter landing pads
16-T1 Dirt/Dust Engine T56-A-14 module S/N T12281 - Stage 1 turbine collection
16-T2 Dirt/Dust Engine T56-A-14 module S/N T12281 - Stage 2 turbine collection
16-T3 Dirt/Dust Engine T56-A-14 module S/N T12281 - Stage 3 turbine collection
16-T4 Dirt/Dust Engine T56-A-14 module S/N T12281 - Stage 4 turbine collection
18 Dirt/Dust Ground Lake Heart, Woomera, collected May 2013 20 Dirt/Dust Ground Sand from Iraq 21 Volcanic Ash Ground Merapi 2006 - Unweathered Pure Ash Fall 22 Volcanic Ash Ground Chaiten, Chile 2008 - Unweathered pure ash fall 23 Volcanic Ash Ground Soufriere Hills 2009 - Unweathered pure ash fall
24 Volcanic Ash Ground Ruapehu NZ 1995 Sample 95/5 Unweathered ash fall – coarse
25 Volcanic Ash Ground Ruapehu NZ 1996 Sample 96/9 Unweathered ash fall – coarse
27 Dirt/Dust Ground RVO Trial - Mount Stuart Training Area Ground Collection
33 Dirt/Dust Ground Ground sample from Yuma Proving Ground It is important to note that samples were sourced from two types of locations. Some dirt/dust samples were collected from the inside of engines undergoing maintenance. Others were obtained by taking ground samples at a number of different sites. All of the volcanic ash samples were obtained via ground sampling in an unweathered1 condition.
1 Volcanic ash collected shortly after the eruption is classified as unweathered.
UNCLASSIFIED DST-Group-TR-3367
UNCLASSIFIED 5
An important distinction between these two types of samples is that engine-sourced samples are representative of particulates ingested by engines in-service, whereas ground-sourced samples are not necessarily representative of what may be ingested by an aircraft engine. For example, particles with large sizes collected in a ground sample will not remain airborne for a significant time and thus would not be ingested by an engine under normal circumstances. Nevertheless, ground samples may be representative in terms of the mineralogy of airborne particulates present at the particular location.
2. Particle Size Analysis
2.1 Experimental Method
Laser Particle Size Analysis (LPSA) was used to ascertain the particle size distribution of the dirt, dust and volcanic ash samples. Seventeen of the 21 samples were analysed by this method2. Prior to LPSA, samples were sieved to separate out any particles and organic matter with a diameter greater than 1 mm (except for Samples 27 and 33, which were analysed earlier and were sieved with a 2 mm sieve). The sieved samples were dispersed in reverse osmosis purified water and sonicated3 for approximately two minutes prior to the commencement of the LPSA. The LPSA results were provided in terms of volume fraction, as opposed to mass fraction that is normally specified when doing particle sizing by mechanical sieving.
2.2 Dirt and Dust Analysis
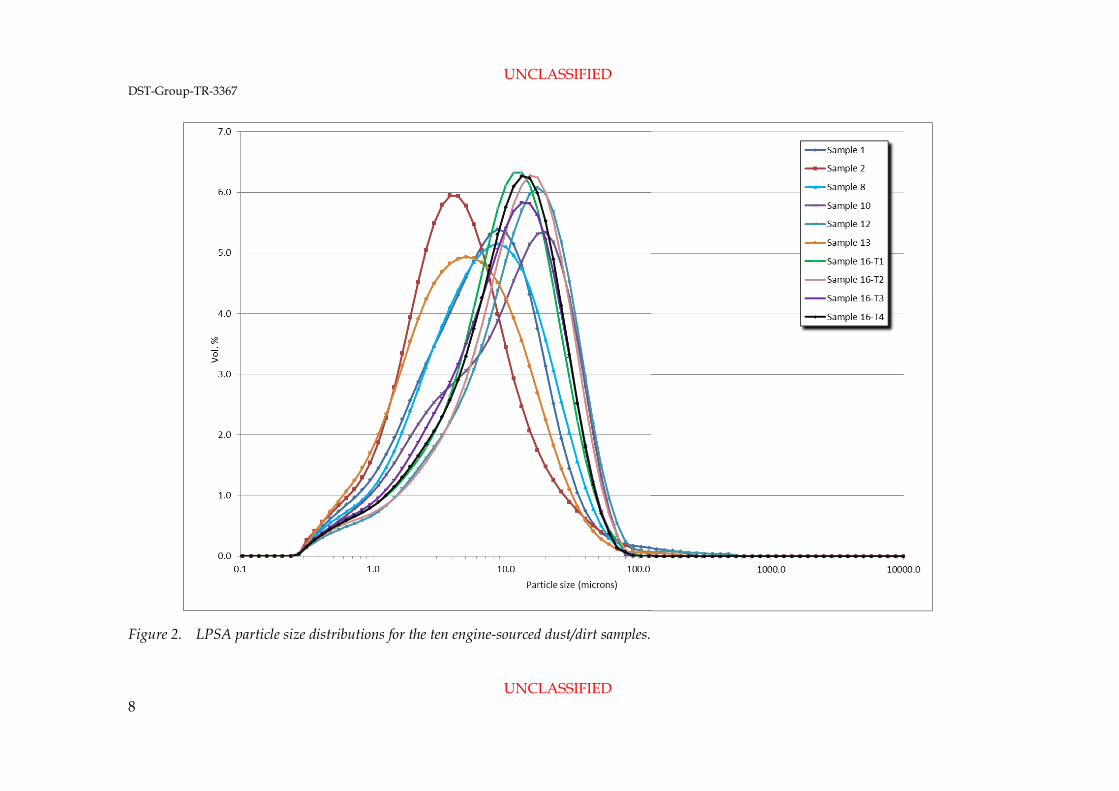
The particle size distribution results from LPSA for the engine-sourced and ground-sourced dirt, dust samples are shown in Figures 2 and 3 respectively. Table 2 summarises the particle sizing statistics generated by LPSA, where dx represents the diameter at which x% of the sample volume is comprised of particles equal to or smaller than that diameter. For example, a measured d90 of 350 µm, indicated that 90 vol.% of the sample has a particle diameter less than or equal to 350 µm, whilst the mean particle size value represents the average particle size for a sample.
Examination of Figure 2 indicates the particle size distributions of the ten engine-sourced samples are very similar. All of the distributions are unimodal, and predominantly comprised particles of diameter ≤100 µm. The mean particle size across these ten samples ranged between 8 and 17 µm, while d90 ranged between 15 and 34 µm (highlighted blue in Table 2).
The distributions shown in Figure 2 and the statistical results in Table 2 for the 16 (T1-T4) series of engine-sourced samples revealed that the four separate turbine stages of one engine exhibited almost identical particle size distributions.
2 The remaining four samples were unable to be analysed due to limited LPSA availability. 3 Sonication aids in breaking up agglomerates of particulates.

UNCLASSIFIED DST-Group-TR-3367
UNCLASSIFIED 6
In contrast to the engine-sourced samples, the ground-sourced samples possessed considerably different particle size distributions. Examination of Figure 3 shows that the particle sizes of the two samples range from less than 1 µm to over 1 mm. The distributions were also both multimodal, exhibiting multiple peaks across their distribution. These two ground-sourced samples were more than an order of magnitude coarser than the engine-sourced samples, with mean particle sizes ranging from 231 to 268 µm, and d90 values ranging from 550 to 762 µm (highlighted brown in Table 2).
Table 2. Particle size distribution statistics obtained by LPSA for dirt / dust samples. Engine-sourced and ground-sourced samples are coloured blue and brown respectively.
Sample Source Particle Size Distribution Statistics (µm)
Mean d10 d25 d50 d75 d90
1 Engine 10 1 2 6 14 20
2 Engine 7 1 2 4 9 15
8 Engine 10 1 2 6 15 22
10 Engine 14 2 3 10 23 31
12 Engine 17 2 4 12 25 34
13 Engine 8 1 2 4 11 17
16-T1 Engine 12 2 4 9 19 26
16-T2 Engine 14 2 4 11 22 30
16-T3 Engine 12 2 3 9 19 26
16-T4 Engine 12 2 4 10 19 26
27 Ground 231 4 17 177 401 550
33 Ground 268 10 33 114 482 762
2.3 Volcanic Ash Analysis
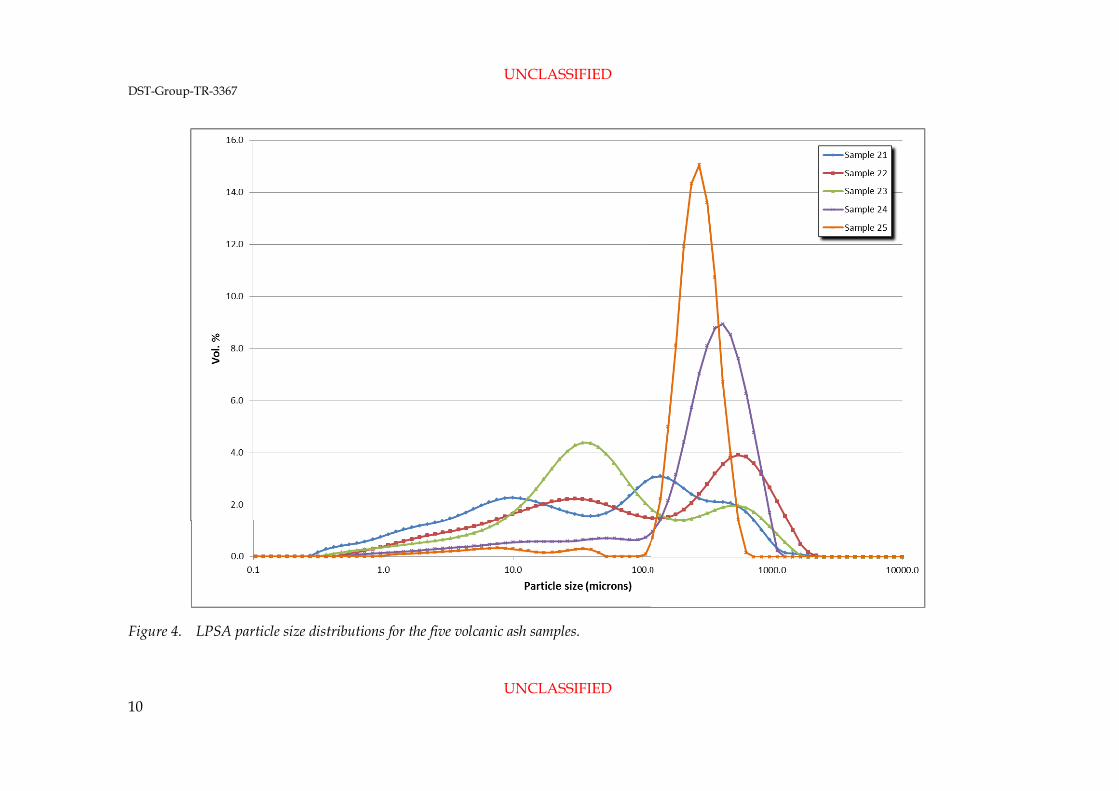
The particle size distributions from LPSA for the volcanic ash samples and the associated particle size distribution statistics are shown in Figure 4 and Table 3 respectively.
Examination of the volcanic ash particle size distribution statistics identified a range of particle size distributions across the five samples, with mean particle sizes ranging from 133 µm to 334 µm. Interestingly the same volcano, namely Ruapehu in NZ, for the 1995 (Sample 24) and 1996 (Sample 25) eruptions, showed significantly different particle size distributions. For example, the d10 values of Samples 24 and 25 were 25 µm and 143 µm respectively, while the d90 values were 631 µm and 378 µm respectively. These results showed that Sample 25 had a narrower particle size distribution than Sample 24.
It can be seen in Figure 4 that the five volcanic ashes had quite dissimilar particle size distributions. Samples 21, 22 and 23 all exhibited multimodal characteristics covering a
UNCLASSIFIED DST-Group-TR-3367
UNCLASSIFIED 7
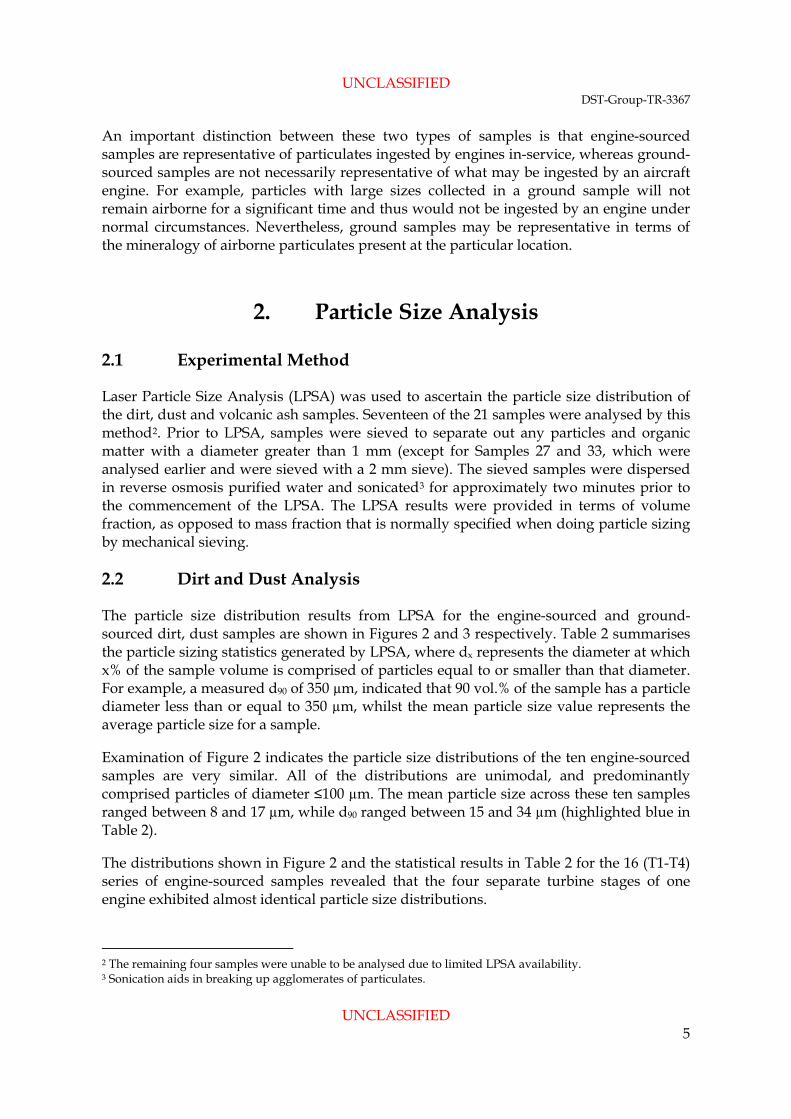
wide range of particle sizes. Contrasting this, Samples 24 and 25, both from Ruapehu, were strongly unimodal and were predominantly composed of particles exceeding 100 µm in size.
Table 3. Particle size distribution statistics obtained by LPSA for volcanic ash samples
Sample Source Particle Size Distribution Statistics (µm) Mean d10 d25 d50 d75 d90
21 Ground* 133 2 5 41 217 407 22 Ground* 268 4 11 91 525 765 23 Ground* 144 6 13 40 216 478 24 Ground* 334 25 145 317 512 631 25 Ground* 248 143 176 244 327 378
* The exact sampling location is unknown
2.4 Consolidated Data
The particulate samples were allocated to one of three categories, based on the type of sample (dirt/dust or volcanic ash) and the sampling location (engine or ground). As all of the volcanic ash samples were ground-sourced, this resulted in three categories:
a. Dirt/Dust - Engine
b. Dirt/Dust - Ground
c. Volcanic Ash – Ground.
The particle size distribution statistics from the samples in each of these categories were averaged and are shown in Table 4. The corresponding averaged particle size distributions are plotted in Figure 5. These data showed two significant features.
Firstly, the averaged particle size distribution of the engine-sourced samples was significantly finer than that of the ground-sourced samples. Of particular note were the d90 values (Table 4), which show that the d90 of the averaged engine-sourced samples was smaller than the d90 of the averaged ground-sourced by more than a factor of 20.
The second notable feature was the similarity of the particle size distributions (Figure 5) for the ground-sourced ash and dirt/dust samples. Both peaked at about 300 µm and tailed off at approximately the same rate, even though there were differences in how the two tails undulated. Both were significantly different to the distribution for the engine sourced samples which peaks at about 12 µm.
Table 4. Averaged particle size distribution statistics for the three categories of particulate samples
Samples Particle Size Distribution Statistics (µm) Mean d10 d25 d50 d75 d90
Dirt/Dust - Engine 12 2 3 8 18 25 Dirt/Dust - Ground 249 7 25 146 442 656
Volcanic Ash - Ground 225 36 70 147 360 532
UNCLASSIFIED DST-Group-TR-3367
UNCLASSIFIED 8
Figure 2. LPSA particle size distributions for the ten engine-sourced dust/dirt samples.

UNCLASSIFIED DST-Group-TR-3367
UNCLASSIFIED 9
Figure 3. LPSA particle size distributions for the two ground-sourced dust/dirt samples.
UNCLASSIFIED DST-Group-TR-3367
UNCLASSIFIED 10
Figure 4. LPSA particle size distributions for the five volcanic ash samples.

UNCLASSIFIED DST-Group-TR-3367
UNCLASSIFIED 11
Figure 5. LPSA average particle size distributions for engine-sourced dust/dirt, ground-sourced dust/dirt and ground-sourced volcanic ash samples.
UNCLASSIFIED DST-Group-TR-3367
UNCLASSIFIED 12
3. Particulate Morphologies
3.1 Experimental Method
Particle morphologies were characterised by taking samples of the particulates, mounting them in epoxy resin and then polishing back through the particulates in order to reveal their cross-sections. Polished specimens were sputter-coated with gold and examined using Scanning Electron Microscopy (SEM).
All of the volcanic ash samples were in an unweathered state, meaning that the particle morphologies observed here were representative of their morphologies post-ejection from their respective volcanoes.
Observations of the samples were predominantly performed using back-scattered electron imaging. This technique highlights compositional variations, whereby phases comprising heavier elements appear brighter and phases comprising lighter elements appear darker.
To be concise this report presents only a high and low magnification micrograph from each sample. The choice of the two magnifications varied sample to sample because the size range of the particles varied considerably. Scale bars have been added to clarify this. However, the samples were studied over a wider range of magnifications and the text contains some observations that were made at magnifications not shown. Where available, the d10, d50 and d90 particle size statistics obtained by LPSA are shown for each of the samples as a reference for the micrographs.
It should be noted that cross-sectioning even particles of a single size and shape will produce a variation in the cross-sectional diameters, as some particles will be cut at their centre (and therefore present the maximum diameter) and some will be cut near a vertice (and therefore present as a smaller diameter). This must be taken into account when viewing the cross-sections, and the range of particle sizes and shapes can still be deduced in most cases as the number of apparently small and large particles due to sectioning will be comparable. For example, a large numerical excess of small particles in a cross-section cannot be explained by sectioning of the larger particles but requires the sample to have had many small particles. The cross-sectioning was also useful in showing agglomeration and particle shape and indicating approximately the maximum particle size.

UNCLASSIFIED DST-Group-TR-3367
UNCLASSIFIED 13
3.2 Dirt and Dust Analysis
Sample 1 – Engine - T56 Turbine Module S/N T05357, 3rd Stage Turbine Wheel
Particle Size Distribution (PSD): d10/d50/d90 = 1/6/20 µm
Consistent with LPSA results, SEM of Sample 1 (engine-sourced, T56) found that the sample was composed primarily of very fine, discrete particulates. The fine particulates exhibited both equiaxed and elongated morphologies, and were predominantly single-phase in nature.
Figure 6. Back-scattered electron micrographs of dirt/dust Sample 1 (engine-sourced, T56). (a) Overview. (b) Higher magnification micrograph showing the fine nature of the particulates.
a b
10µm 10µm
UNCLASSIFIED DST-Group-TR-3367
UNCLASSIFIED 14
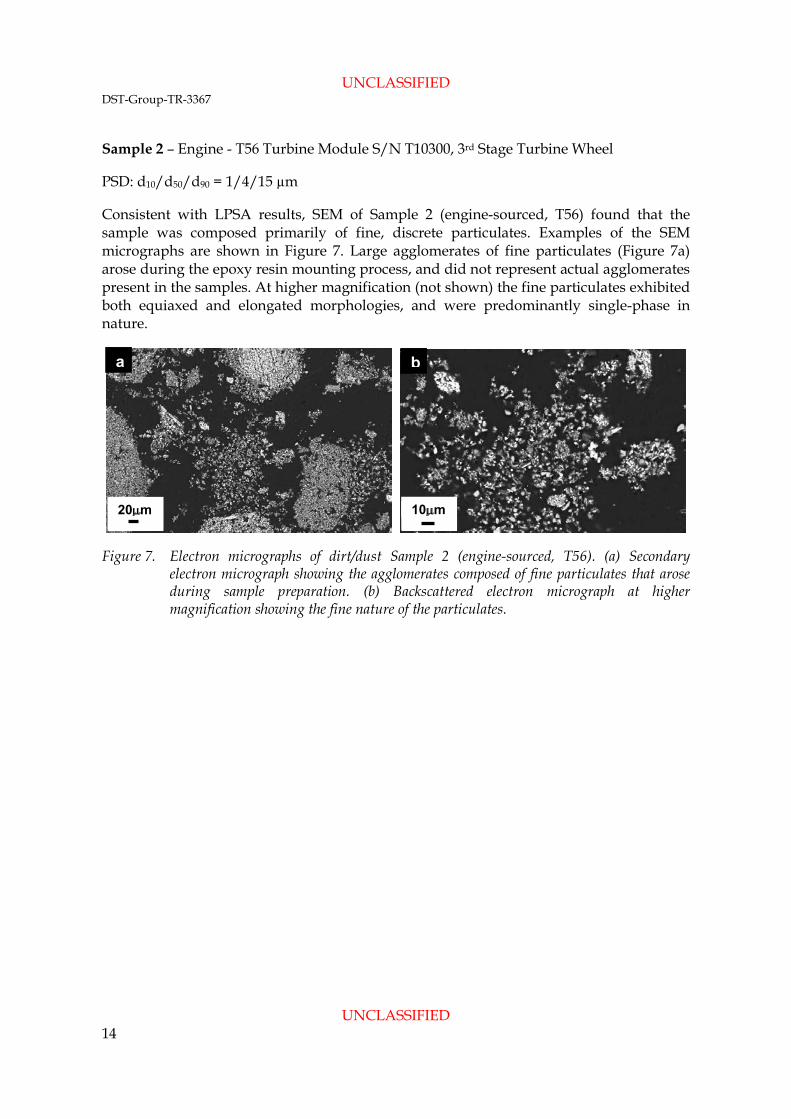
Sample 2 – Engine - T56 Turbine Module S/N T10300, 3rd Stage Turbine Wheel
PSD: d10/d50/d90 = 1/4/15 µm
Consistent with LPSA results, SEM of Sample 2 (engine-sourced, T56) found that the sample was composed primarily of fine, discrete particulates. Examples of the SEM micrographs are shown in Figure 7. Large agglomerates of fine particulates (Figure 7a) arose during the epoxy resin mounting process, and did not represent actual agglomerates present in the samples. At higher magnification (not shown) the fine particulates exhibited both equiaxed and elongated morphologies, and were predominantly single-phase in nature.
Figure 7. Electron micrographs of dirt/dust Sample 2 (engine-sourced, T56). (a) Secondary electron micrograph showing the agglomerates composed of fine particulates that arose during sample preparation. (b) Backscattered electron micrograph at higher magnification showing the fine nature of the particulates.
a b
20µm 10µm
UNCLASSIFIED DST-Group-TR-3367
UNCLASSIFIED 15
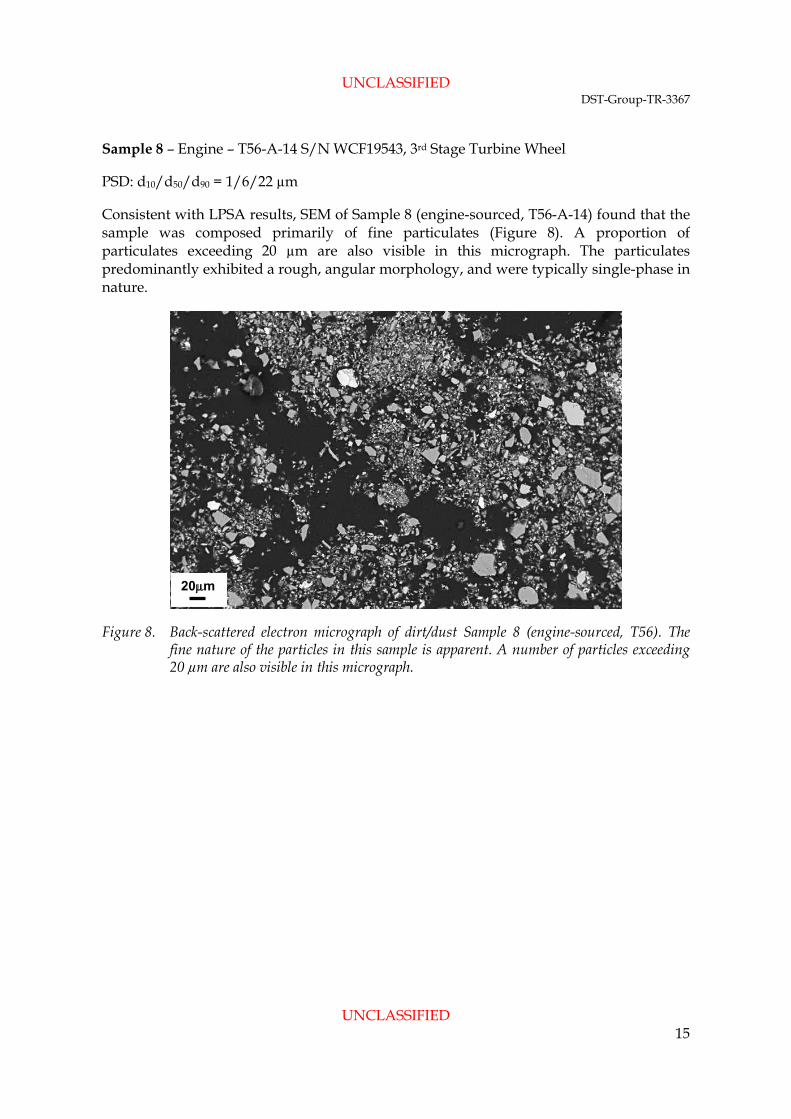
Sample 8 – Engine – T56-A-14 S/N WCF19543, 3rd Stage Turbine Wheel
PSD: d10/d50/d90 = 1/6/22 µm
Consistent with LPSA results, SEM of Sample 8 (engine-sourced, T56-A-14) found that the sample was composed primarily of fine particulates (Figure 8). A proportion of particulates exceeding 20 µm are also visible in this micrograph. The particulates predominantly exhibited a rough, angular morphology, and were typically single-phase in nature.
Figure 8. Back-scattered electron micrograph of dirt/dust Sample 8 (engine-sourced, T56). The fine nature of the particles in this sample is apparent. A number of particles exceeding 20 µm are also visible in this micrograph.
20µm

UNCLASSIFIED DST-Group-TR-3367
UNCLASSIFIED 16
Sample 10 – Engine – Squirrel, Turbomeca Arriel S/N 796/794
PSD: d10/d50/d90 = 2/10/31 µm
Consistent with LPSA results, SEM of Sample 10 (engine-sourced, Arriel) found that the sample was composed primarily of fine particulates (Figure 9). A proportion of particulates exceeding 20 µm are also visible in these micrographs. The particulates were generally equiaxed with a rough, angular surface morphology, and were predominantly single-phase in nature, though examples of multi-phase particulates were observed (example arrowed in Figure 9a).
Figure 9. Back-scattered electron micrographs of dirt/dust Sample 10 (engine-sourced, Arriel). (a) Overview showing the predominantly fine nature of the particulates. An example of a multi-phase particulate is arrowed. (b) Higher magnification micrograph showing a distribution of fine particulates with coarser particulates exceeding 20 µm in size.
a b
20µm 10µm
UNCLASSIFIED DST-Group-TR-3367
UNCLASSIFIED 17
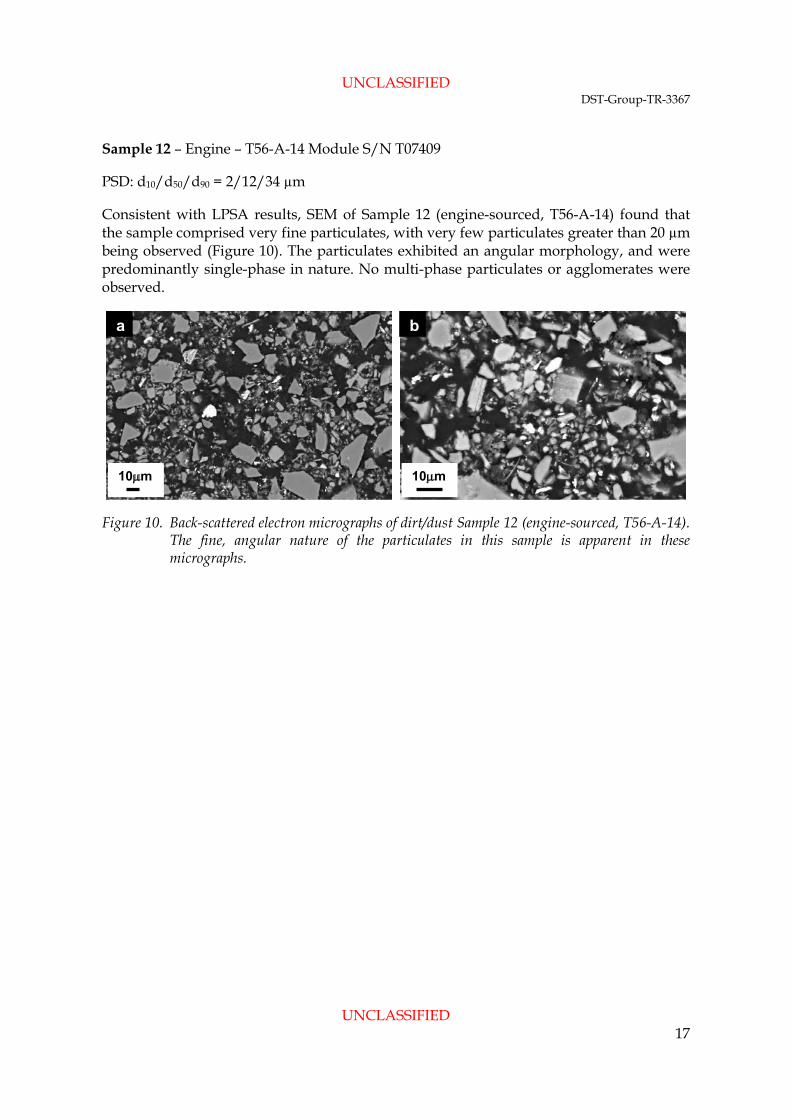
Sample 12 – Engine – T56-A-14 Module S/N T07409
PSD: d10/d50/d90 = 2/12/34 µm
Consistent with LPSA results, SEM of Sample 12 (engine-sourced, T56-A-14) found that the sample comprised very fine particulates, with very few particulates greater than 20 µm being observed (Figure 10). The particulates exhibited an angular morphology, and were predominantly single-phase in nature. No multi-phase particulates or agglomerates were observed.
Figure 10. Back-scattered electron micrographs of dirt/dust Sample 12 (engine-sourced, T56-A-14). The fine, angular nature of the particulates in this sample is apparent in these micrographs.
a b
10µm 10µm
UNCLASSIFIED DST-Group-TR-3367
UNCLASSIFIED 18
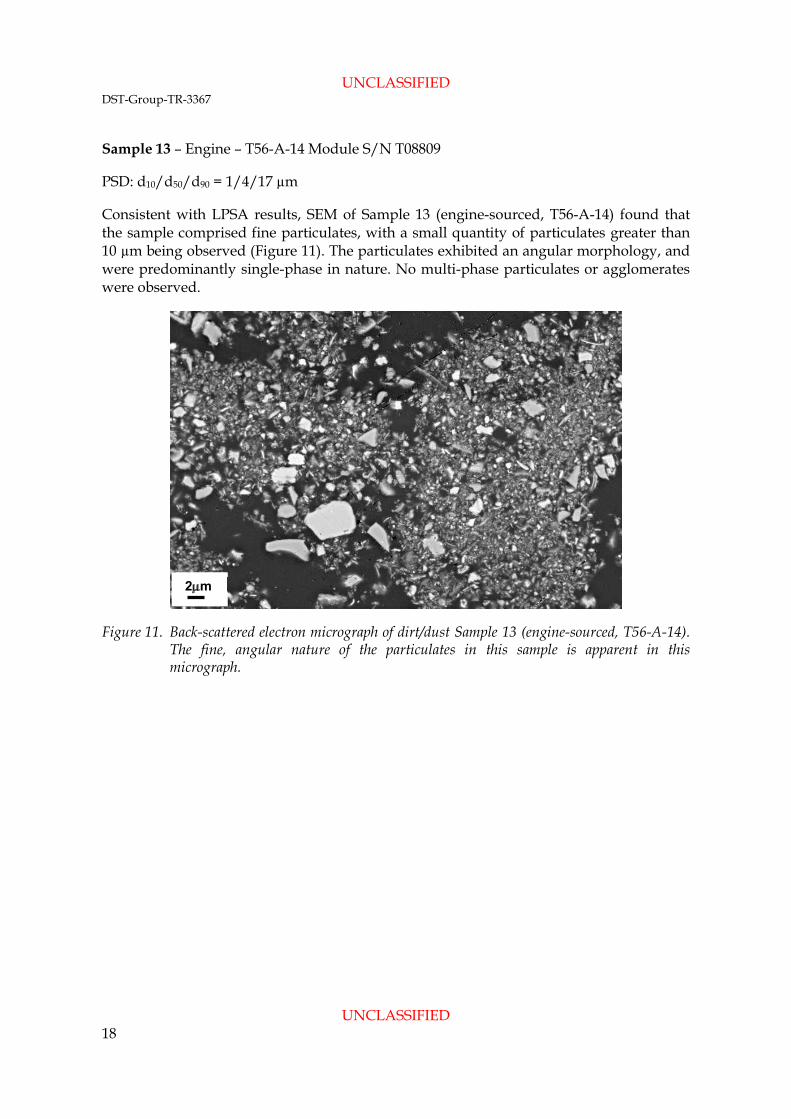
Sample 13 – Engine – T56-A-14 Module S/N T08809
PSD: d10/d50/d90 = 1/4/17 µm
Consistent with LPSA results, SEM of Sample 13 (engine-sourced, T56-A-14) found that the sample comprised fine particulates, with a small quantity of particulates greater than 10 µm being observed (Figure 11). The particulates exhibited an angular morphology, and were predominantly single-phase in nature. No multi-phase particulates or agglomerates were observed.
Figure 11. Back-scattered electron micrograph of dirt/dust Sample 13 (engine-sourced, T56-A-14). The fine, angular nature of the particulates in this sample is apparent in this micrograph.
2µm

UNCLASSIFIED DST-Group-TR-3367
UNCLASSIFIED 19
Sample 14 – Ground – Afghanistan Sand, collected from brown–out4 landing zone in desert
PSD: N/A
In contrast to the engine-sourced samples, this ground-sourced sample of dirt/dust from Afghanistan comprised coarse particulates, predominantly in the range 50-300 µm (Figure 12). The particulates in this sample predominantly exhibited a smooth, rounded morphology. Most of the particulates appeared to be single-phase in nature, though examples of multi-phase particulates were also apparent (examples arrowed in Figure 12b).
Figure 12. Back-scattered electron micrographs of dirt/dust Sample 14 (ground-sourced, Afghanistan). (a) Overview showing the predominantly coarse nature of the particulates. (b) Higher magnification micrograph showing the smooth, rounded morphology of the particulates, along with examples of multi-phase particulates (examples arrowed).
4 When a helicopter lands on dust covered land, the dust can be thrown into the air and thereby reduce visibility for the pilot. This reduction in visibility is known as a brown-out.
a b
100µm 100µm

UNCLASSIFIED DST-Group-TR-3367
UNCLASSIFIED 20
Sample 15 – Ground – Afghanistan Dust/Dirt, collected from helicopter landing pads
PSD: N/A
Sample 15, a ground-sourced sample from a helicopter landing pad in Afghanistan, predominantly comprised coarse particulates in the range 20-400 µm (Figure 13). The particulates in this sample were complex, with many multi-phase particulates (Figure 13a) and large agglomerates of finer particulates being observed (Figure 13b).
Figure 13. Back-scattered electron micrographs of dirt/dust Sample 15 (ground-sourced, Afghanistan). (a) Overview showing the complex nature of the particulates, including multi-phase particulates and agglomerates. (b) Higher magnification micrograph of an agglomerate composed of many finer particulates.
a b
100µm 20µm

UNCLASSIFIED DST-Group-TR-3367
UNCLASSIFIED 21
Sample 16 – Engine – T56-A-14 Turbine Module S/N T12281
PSD: d10/d50/d90 = 2/10/27 µm
Consistent with LPSA results, SEM of Sample 16 (engine-sourced, T56-A-14) found that the sample was composed primarily of fine particulates, with few particulates exceeding 30 µm being observed (Figure 14). The particulates generally exhibited an angular morphology and were predominantly single-phase in nature.
Figure 14. Back-scattered electron micrographs of dirt/dust Sample 16 (engine-sourced, T56-A-14). (a) Overview showing the predominantly fine nature of the particulates. (b) Higher magnification micrograph showing the angular morphology of the particulates.
a b
20µm 10µm
UNCLASSIFIED DST-Group-TR-3367
UNCLASSIFIED 22
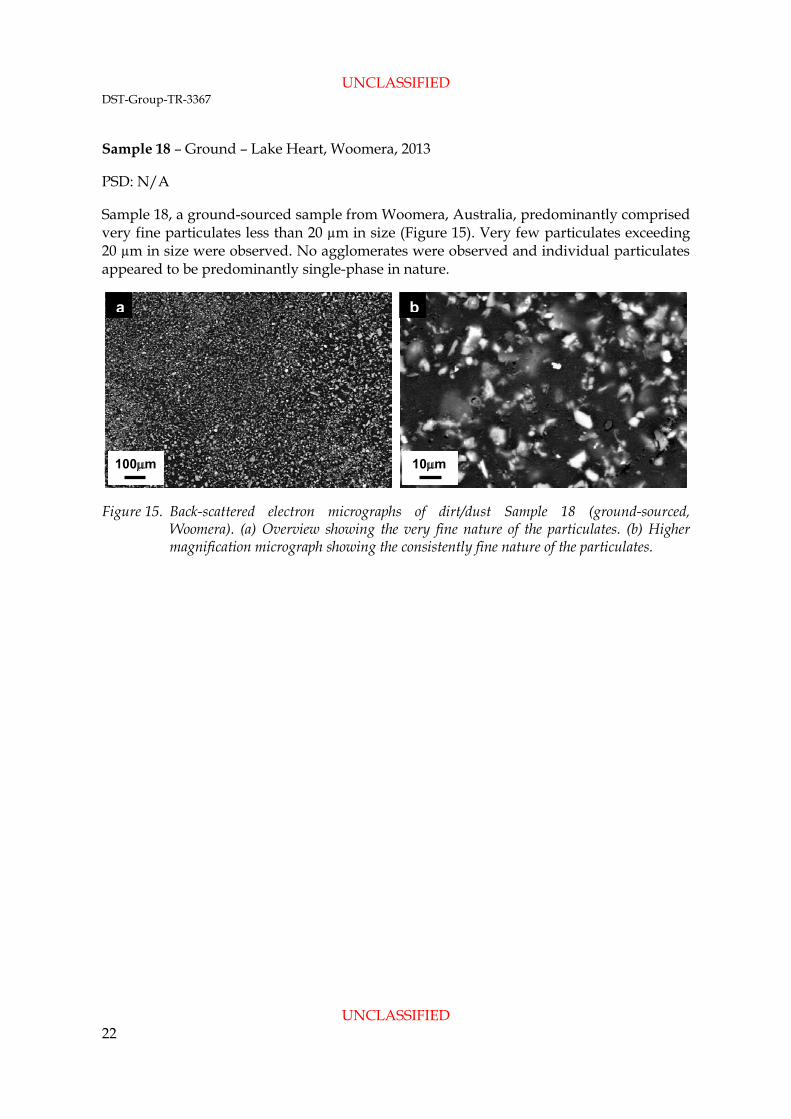
Sample 18 – Ground – Lake Heart, Woomera, 2013
PSD: N/A
Sample 18, a ground-sourced sample from Woomera, Australia, predominantly comprised very fine particulates less than 20 µm in size (Figure 15). Very few particulates exceeding 20 µm in size were observed. No agglomerates were observed and individual particulates appeared to be predominantly single-phase in nature.
Figure 15. Back-scattered electron micrographs of dirt/dust Sample 18 (ground-sourced, Woomera). (a) Overview showing the very fine nature of the particulates. (b) Higher magnification micrograph showing the consistently fine nature of the particulates.
a b
100µm 10µm
UNCLASSIFIED DST-Group-TR-3367
UNCLASSIFIED 23
Sample 20 – Ground – Iraqi Sand
PSD: N/A
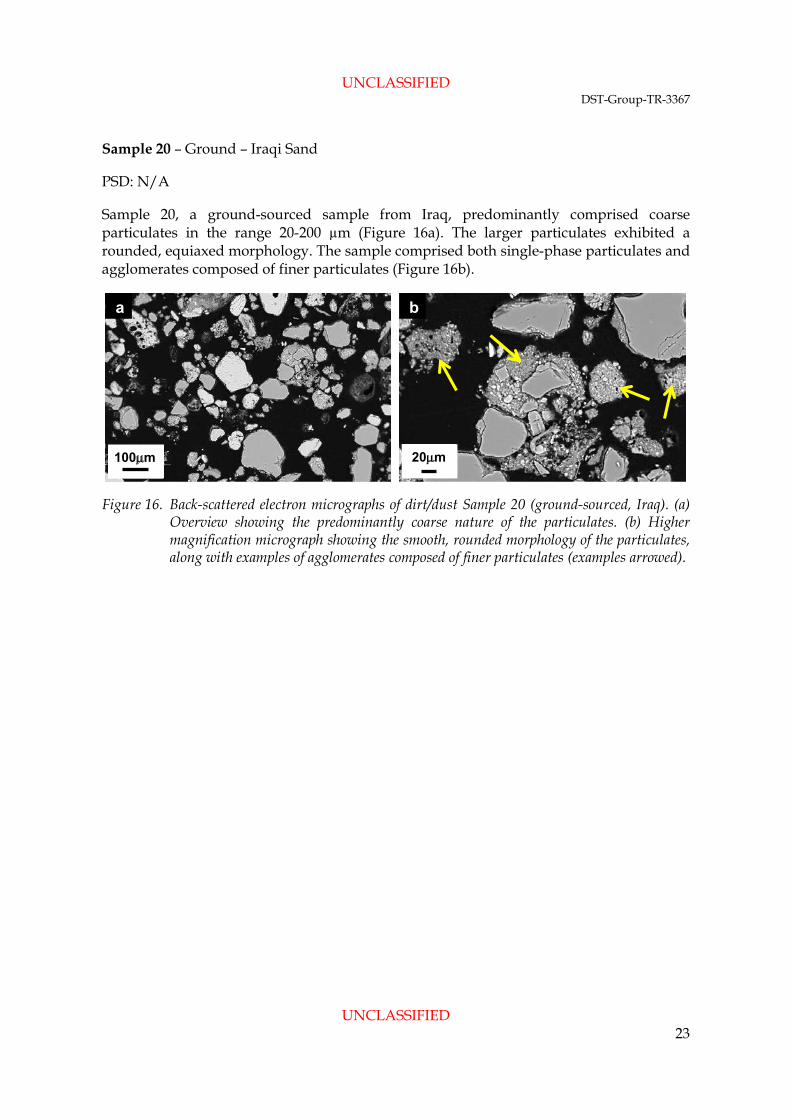
Sample 20, a ground-sourced sample from Iraq, predominantly comprised coarse particulates in the range 20-200 µm (Figure 16a). The larger particulates exhibited a rounded, equiaxed morphology. The sample comprised both single-phase particulates and agglomerates composed of finer particulates (Figure 16b).
Figure 16. Back-scattered electron micrographs of dirt/dust Sample 20 (ground-sourced, Iraq). (a) Overview showing the predominantly coarse nature of the particulates. (b) Higher magnification micrograph showing the smooth, rounded morphology of the particulates, along with examples of agglomerates composed of finer particulates (examples arrowed).
a b
100µm 20µm

UNCLASSIFIED DST-Group-TR-3367
UNCLASSIFIED 24
Sample 27 – Ground – Mount Stuart Training Area, Australia
PSD: d10/d50/d90 = 4/177/550 µm
Sample 27, a ground-sourced sample from Mount Stuart Training Area, Australia, was predominantly composed of particulates exceeding 100 µm in size (Figure 17a). The particulates predominantly exhibited an angular morphology. The sample comprised both single-phase particulates and agglomerates composed of finer particulates (examples of agglomerates arrowed in Figure 17b). The finer particulates (less than 100 µm) which the LPSA detected (Figure 3) appeared to be bound up in the agglomerates. It is likely that during sonication for LPSA analysis these agglomerates were broken down, allowing the finer particulates to be liberated and detected by the instrument.
Figure 17. Back-scattered electron micrographs of dirt/dust Sample 27 (ground-sourced, Australia). (a) Overview showing the predominantly coarse nature of the particulates. (b) Higher magnification micrograph showing the angular morphology of the particulates, along with examples of agglomerates composed of finer particulates (examples arrowed).
100µm 100µm
UNCLASSIFIED DST-Group-TR-3367
UNCLASSIFIED 25
Sample 33 – Ground – Yuma Proving Ground, USA
PSD: d10/d50/d90 = 10/114/762 µm
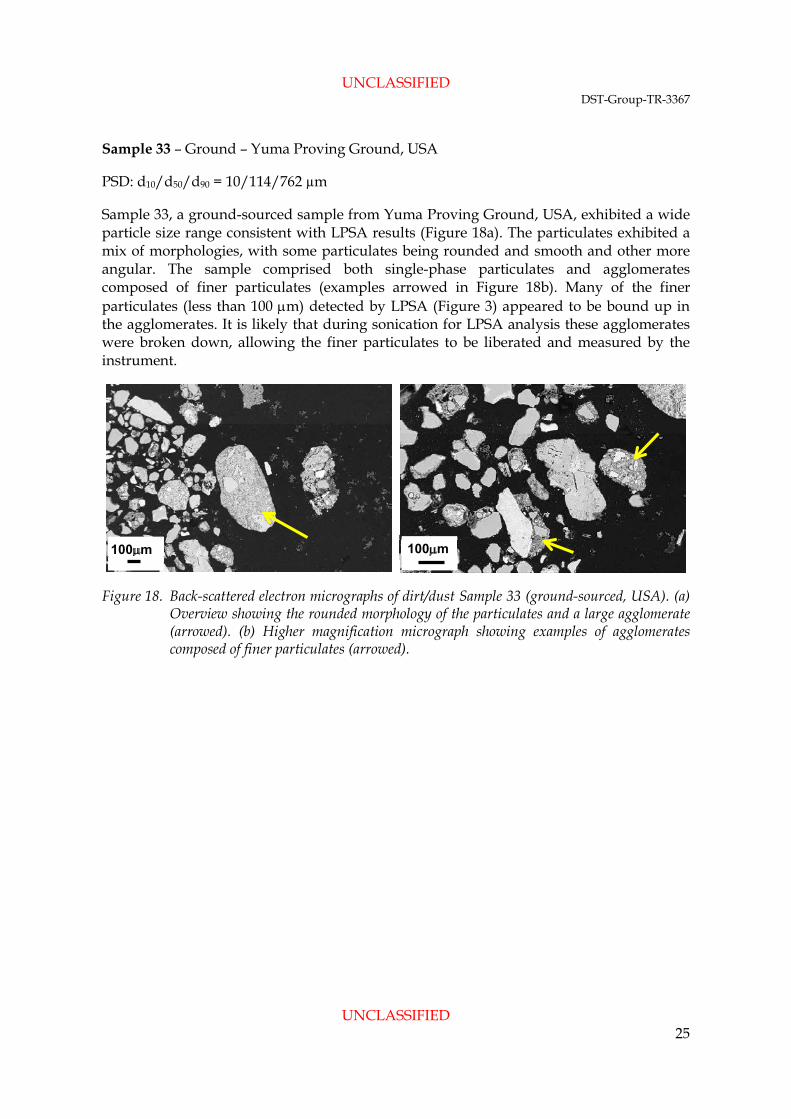
Sample 33, a ground-sourced sample from Yuma Proving Ground, USA, exhibited a wide particle size range consistent with LPSA results (Figure 18a). The particulates exhibited a mix of morphologies, with some particulates being rounded and smooth and other more angular. The sample comprised both single-phase particulates and agglomerates composed of finer particulates (examples arrowed in Figure 18b). Many of the finer particulates (less than 100 µm) detected by LPSA (Figure 3) appeared to be bound up in the agglomerates. It is likely that during sonication for LPSA analysis these agglomerates were broken down, allowing the finer particulates to be liberated and measured by the instrument.
Figure 18. Back-scattered electron micrographs of dirt/dust Sample 33 (ground-sourced, USA). (a) Overview showing the rounded morphology of the particulates and a large agglomerate (arrowed). (b) Higher magnification micrograph showing examples of agglomerates composed of finer particulates (arrowed).
100µm 100µm

UNCLASSIFIED DST-Group-TR-3367
UNCLASSIFIED 26
3.3 Volcanic Ash Analysis
Sample 21 – Merapi 2006 – Unweathered Pure Ash Fall
PSD: d10/d50/d90 = 2/41/407 µm
Scanning electron microscopy (SEM) of Sample 21 (Merapi, 2006) identified a wide range of particle sizes (Figure 19a), consistent with the LPSA results. The particles in this sample exhibited a predominantly equiaxed morphology. Many of the larger particles observed in this sample were discrete single particles (example arrowed in Figure 19b); however, examples of large agglomerates comprising many smaller particles of varying chemical compositions were observed (Figure 20).
Figure 19. Secondary electron micrographs of volcanic ash Sample 21 (Merapi 2006). (a) Overview showing a combination of fine and coarse particulates. (b) Many of the larger particles were discrete single particles (example arrowed).
Figure 20. Back-scattered electron micrograph of volcanic ash Sample 21 (Merapi, 2006), showing an agglomerate composed of finer particles. The lighter and darker contrasts of the finer particulates in this agglomerate are indicative of chemical compositions differences.
a b
100µm 50µm
50µm

UNCLASSIFIED DST-Group-TR-3367
UNCLASSIFIED 27
Sample 22 – Chaiten, Chile 2008 – Unweathered pure ash fall
PSD: d10/d50/d90 = 4/91/765 µm
Scanning electron microscopy of Sample 22 (Chaiten, 2008) identified a wide range of particle sizes (Figure 21a), consistent with the LPSA results. The particles exhibited an angular morphology, as opposed to the more equiaxed morphology of Sample 21. Some of the larger particles exhibited significant porosity (Figure 21b). Agglomerated fine particulates on the surfaces of larger particles were widely observed (Figure 21c).
Figure 21. Back-scattered electron micrographs of volcanic ash Sample 22 (Chaiten, 2008). (a) Overview showing particle morphologies. (b) A large particle with significant porosity. (c) Fine particles agglomerated on the surface of the large porous particle shown in (b).
a b
c
100µm
50µm
100µm

UNCLASSIFIED DST-Group-TR-3367
UNCLASSIFIED 28
Sample 23 – Soufriere Hills 2009 – Unweathered pure ash fall
PSD: d10/d50/d90 = 6/40/478 µm
Consistent with LPSA results, SEM of Sample 23 (Soufriere Hills, 2009) identified a high proportion of particles less than 100 µm in diameter (Figure 22a). Higher magnification SEM identified particle morphologies that were predominantly equiaxed, with others exhibiting a rough irregular morphology (Figure 22b). Multi-phase particulates were widely observed throughout the sample (example shown in Figure 22b).
Figure 22. Back-scattered electron micrographs of volcanic ash Sample 23 (Soufriere Hills, 2009), (a) Overview showing the fine particle sizes that dominated this sample. (b) Higher magnification micrograph showing predominantly equiaxed fine particles and a multi-phase particle (yellow arrow). Particles with a rough, irregular morphology are also visible here (red arrows).
a b
100µm 50µm

UNCLASSIFIED DST-Group-TR-3367
UNCLASSIFIED 29
Sample 24 – Ruapehu NZ 1995 Sample 95/5 – Unweathered ash fall
PSD: d10/d50/d90 = 25/317/631 µm
Consistent with LPSA results, SEM of Sample 24 (Ruapehu, 1995) identified a high proportion of particles exceeding 300 µm, with very few particles smaller than this being observed (Figure 23a). A wide variety of particle morphologies were observed, with many of the larger particles exhibiting significant porosity (Figure 23b). Large agglomerates of fine particles were commonly observed.
Figure 23. Back-scattered electron micrographs of volcanic ash Sample 24 (Ruapehu, 1995). (a) Overview showing the predominantly coarse nature of the particles. Two agglomerates of finer particles are indicated (yellow arrows). (b) Higher magnification micrograph showing an agglomerate of fine particles (yellow arrow) and porous larger particles (red arrows).
a b
200µm 100µm
UNCLASSIFIED DST-Group-TR-3367
UNCLASSIFIED 30
Sample 25 – Ruapehu NZ 1996 Sample 96/9 – Unweathered ash fall
PSD: d10/d50/d90 = 143/244/378 µm
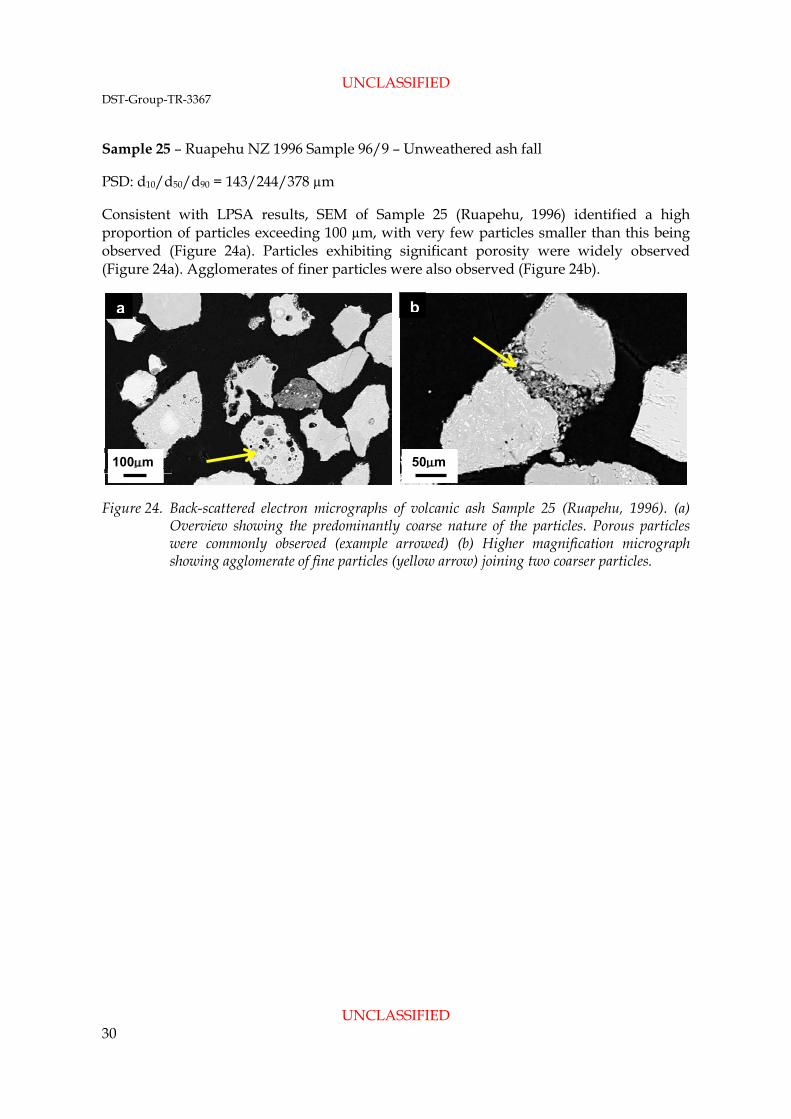
Consistent with LPSA results, SEM of Sample 25 (Ruapehu, 1996) identified a high proportion of particles exceeding 100 µm, with very few particles smaller than this being observed (Figure 24a). Particles exhibiting significant porosity were widely observed (Figure 24a). Agglomerates of finer particles were also observed (Figure 24b).
Figure 24. Back-scattered electron micrographs of volcanic ash Sample 25 (Ruapehu, 1996). (a) Overview showing the predominantly coarse nature of the particles. Porous particles were commonly observed (example arrowed) (b) Higher magnification micrograph showing agglomerate of fine particles (yellow arrow) joining two coarser particles.
a b
50µm 100µm
UNCLASSIFIED DST-Group-TR-3367
UNCLASSIFIED 31
4. Elemental Analyses
Energy Dispersive X-ray Spectroscopy (EDS) was used on mounted and polished particulate sample cross-sections to obtain overall chemical compositions of the dirt/dust and ash samples.
Analysis of the cured epoxy mounting resin identified carbon and chlorine as the predominant detectable elemental components. Consequently, carbon and chlorine were excluded from the EDS area scan analyses and are not shown in any of the following results.
4.1 Dirt and Dust Analyses
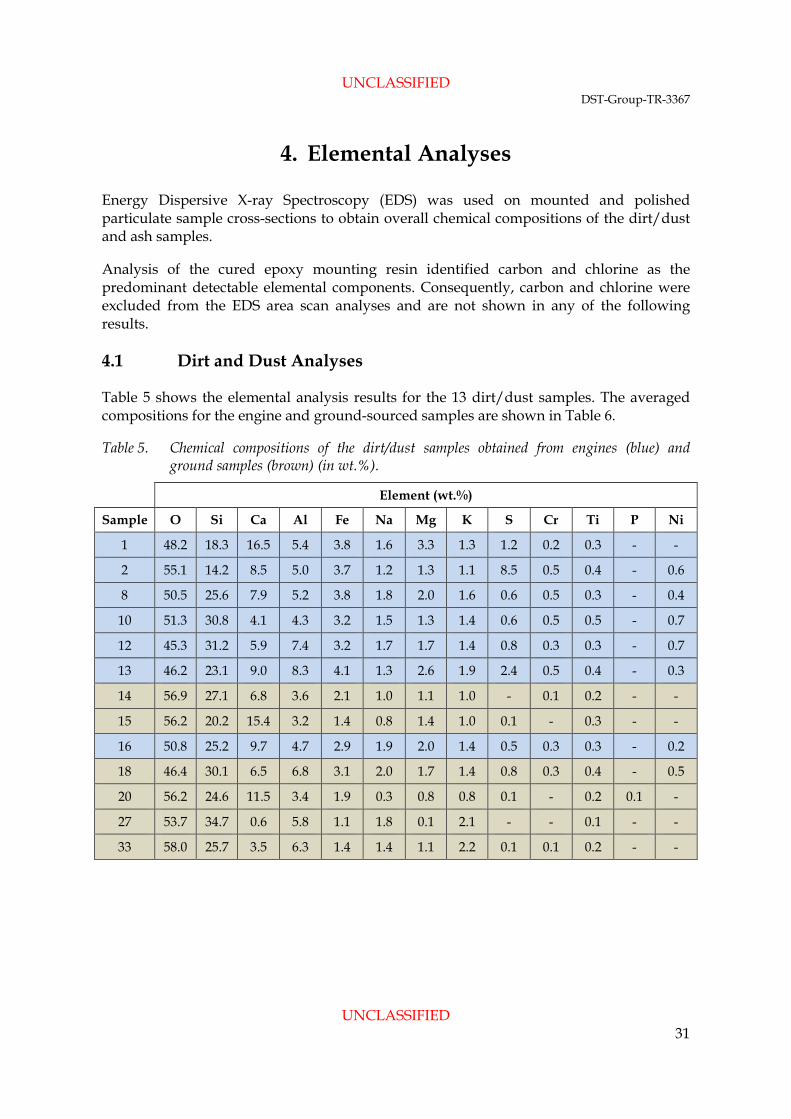
Table 5 shows the elemental analysis results for the 13 dirt/dust samples. The averaged compositions for the engine and ground-sourced samples are shown in Table 6.
Table 5. Chemical compositions of the dirt/dust samples obtained from engines (blue) and ground samples (brown) (in wt.%).
Element (wt.%)
Sample O Si Ca Al Fe Na Mg K S Cr Ti P Ni
1 48.2 18.3 16.5 5.4 3.8 1.6 3.3 1.3 1.2 0.2 0.3 - -
2 55.1 14.2 8.5 5.0 3.7 1.2 1.3 1.1 8.5 0.5 0.4 - 0.6
8 50.5 25.6 7.9 5.2 3.8 1.8 2.0 1.6 0.6 0.5 0.3 - 0.4
10 51.3 30.8 4.1 4.3 3.2 1.5 1.3 1.4 0.6 0.5 0.5 - 0.7
12 45.3 31.2 5.9 7.4 3.2 1.7 1.7 1.4 0.8 0.3 0.3 - 0.7
13 46.2 23.1 9.0 8.3 4.1 1.3 2.6 1.9 2.4 0.5 0.4 - 0.3
14 56.9 27.1 6.8 3.6 2.1 1.0 1.1 1.0 - 0.1 0.2 - -
15 56.2 20.2 15.4 3.2 1.4 0.8 1.4 1.0 0.1 - 0.3 - -
16 50.8 25.2 9.7 4.7 2.9 1.9 2.0 1.4 0.5 0.3 0.3 - 0.2
18 46.4 30.1 6.5 6.8 3.1 2.0 1.7 1.4 0.8 0.3 0.4 - 0.5
20 56.2 24.6 11.5 3.4 1.9 0.3 0.8 0.8 0.1 - 0.2 0.1 -
27 53.7 34.7 0.6 5.8 1.1 1.8 0.1 2.1 - - 0.1 - -
33 58.0 25.7 3.5 6.3 1.4 1.4 1.1 2.2 0.1 0.1 0.2 - -
UNCLASSIFIED DST-Group-TR-3367
UNCLASSIFIED 32
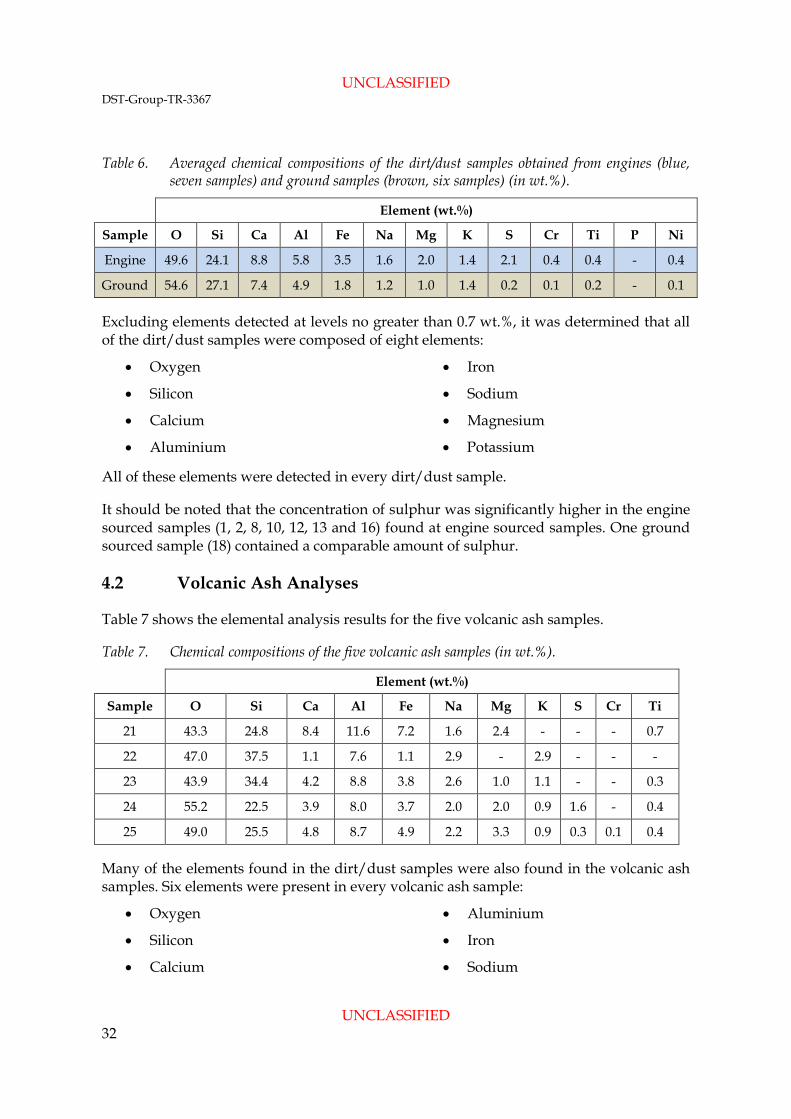
Table 6. Averaged chemical compositions of the dirt/dust samples obtained from engines (blue, seven samples) and ground samples (brown, six samples) (in wt.%).
Element (wt.%)
Sample O Si Ca Al Fe Na Mg K S Cr Ti P Ni
Engine 49.6 24.1 8.8 5.8 3.5 1.6 2.0 1.4 2.1 0.4 0.4 - 0.4
Ground 54.6 27.1 7.4 4.9 1.8 1.2 1.0 1.4 0.2 0.1 0.2 - 0.1
Excluding elements detected at levels no greater than 0.7 wt.%, it was determined that all of the dirt/dust samples were composed of eight elements:
• Oxygen
• Silicon
• Calcium
• Aluminium
• Iron
• Sodium
• Magnesium
• Potassium
All of these elements were detected in every dirt/dust sample.
It should be noted that the concentration of sulphur was significantly higher in the engine sourced samples (1, 2, 8, 10, 12, 13 and 16) found at engine sourced samples. One ground sourced sample (18) contained a comparable amount of sulphur.
4.2 Volcanic Ash Analyses
Table 7 shows the elemental analysis results for the five volcanic ash samples.
Table 7. Chemical compositions of the five volcanic ash samples (in wt.%).
Element (wt.%)
Sample O Si Ca Al Fe Na Mg K S Cr Ti
21 43.3 24.8 8.4 11.6 7.2 1.6 2.4 - - - 0.7
22 47.0 37.5 1.1 7.6 1.1 2.9 - 2.9 - - -
23 43.9 34.4 4.2 8.8 3.8 2.6 1.0 1.1 - - 0.3
24 55.2 22.5 3.9 8.0 3.7 2.0 2.0 0.9 1.6 - 0.4
25 49.0 25.5 4.8 8.7 4.9 2.2 3.3 0.9 0.3 0.1 0.4
Many of the elements found in the dirt/dust samples were also found in the volcanic ash samples. Six elements were present in every volcanic ash sample:
• Oxygen
• Silicon
• Calcium
• Aluminium
• Iron
• Sodium

UNCLASSIFIED DST-Group-TR-3367
UNCLASSIFIED 33
4.3 Comparison of Dirt/Dust and Volcanic Ash Samples
Average chemical compositions of the dirt/dust samples obtained from engines and ground samples (13 samples) and volcanic ash samples (five samples) are shown in Table 8. The major constituents are plotted in Figure 25.
Table 8. Averaged chemical compositions of the dirt/dust samples obtained from engines and ground samples (13 samples) and volcanic ash (five samples) (in wt.%), minor elements excluded (S, Cr, Ti, Ni).
Element (wt.%)
Sample O Si Ca Al Fe Na Mg K
Dirt/dust 51.9 25.4 8.1 5.3 2.7 1.4 1.6 1.4
Ash 47.7 28.9 4.5 8.9 4.1 2.3 1.7 1.2
Figure 25. Average chemical compositions of dirt/dust samples (red) and volcanic ash samples (blue).
Examination of Table 8 and Figure 25 shows that on average, the compositional differences between the dirt/dust and volcanic ash samples are not large. Both types of samples were composed of the same eight elements, and differences in the concentrations of these elements amounted to no more than a few weight percent.
UNCLASSIFIED DST-Group-TR-3367
UNCLASSIFIED 34
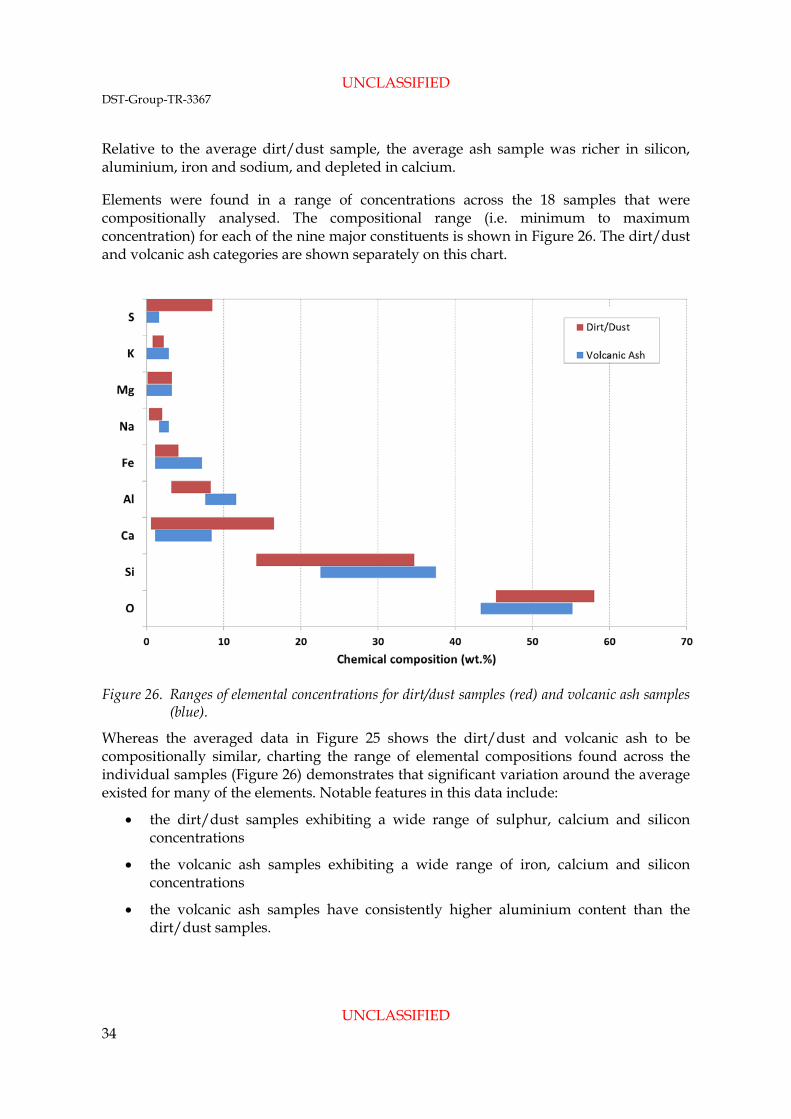
Relative to the average dirt/dust sample, the average ash sample was richer in silicon, aluminium, iron and sodium, and depleted in calcium.
Elements were found in a range of concentrations across the 18 samples that were compositionally analysed. The compositional range (i.e. minimum to maximum concentration) for each of the nine major constituents is shown in Figure 26. The dirt/dust and volcanic ash categories are shown separately on this chart.
Figure 26. Ranges of elemental concentrations for dirt/dust samples (red) and volcanic ash samples (blue).
Whereas the averaged data in Figure 25 shows the dirt/dust and volcanic ash to be compositionally similar, charting the range of elemental compositions found across the individual samples (Figure 26) demonstrates that significant variation around the average existed for many of the elements. Notable features in this data include:
• the dirt/dust samples exhibiting a wide range of sulphur, calcium and silicon concentrations
• the volcanic ash samples exhibiting a wide range of iron, calcium and silicon concentrations
• the volcanic ash samples have consistently higher aluminium content than the dirt/dust samples.

UNCLASSIFIED DST-Group-TR-3367
UNCLASSIFIED 35
5. Phase Analyses
The purpose of this section is to describe the mineralogies of the dirt/dust and volcanic ash specimens, as characterised using X-ray Diffraction (XRD) phase analysis. This bulk analysis technique enables the mineral components of the samples to be identified, from which properties that may impact on the life of gas turbine components, such as particulate hardness and melting point, can be determined.
5.1 Experimental Procedure
5.1.1 X-ray Diffraction Data Collection
A Bruker D8 X-ray diffractometer was used to collect the XRD data from the dirt/dust and ash samples. The diffractometer was equipped with a sample spinner and a position sensitive detector in Bragg-Brentano configuration. Cu-Kα X-ray radiation (λ=0.15406 nm) was used with an acceleration voltage of 40 kV and a current of 40 mA.
XRD data collection parameters were determined empirically for a scan range of 10° to 90° 2θ and a total count time of 12 hours. A NIST SRM-660b (LaB6) standard was used to characterise the instrumental broadening of the diffractometer. The instrument settings determined to provide the best compromise for signal-to-noise were: step-size of 0.01° 2θ; 2.5° Soller slits in the incident and diffracted beams; 1 mm incident beam slit; and, no air scatter shield. The data collection procedure and instrument parameters remained constant for all dirt/dust and volcanic ash samples.
5.1.2 X-Ray Diffraction Specimen Preparation
A total of 13 dirt/dust and 5 volcanic ash samples, as shown in Table 9, were analysed using XRD.5 Coarse specimens requiring reduction of particle size for XRD analysis were ground with a mortar and pestle (agate 99.9% SiO2) in alcohol for approximately 10 minutes.
5.1.3 Phase Analysis
Phase analysis was performed using DIFFRAC.EVA commercial software (Bruker AXS Corporation). Though this software allows for the calculation of phase concentrations through semi-quantitative analysis, for this work it was only used to identify the presence of particular minerals in the samples. Due to the poor sensitivity of the XRD technique to low concentrations of phases (typically <1.0 wt.%), there were minor peaks in all the volcanic ash diffraction patterns that were unable to be identified.
5 Given their collection from a single engine, only one sample from samples 16a-d was analysed using XRD.

UNCLASSIFIED DST-Group-TR-3367
UNCLASSIFIED 36
Table 9. Sample number, type, source and details of the 21 samples characterised in this report
Sample Number Sample Type Source Details
1 Dirt/Dust Engine T56 turbine module S/N T05357 - 3rd stage turb. wheel
2 Dirt/Dust Engine T56 turbine module S/N T10300 - 3rd stage turb. wheel
8 Dirt/Dust Engine T56-A-14 S/N WCF19543 - 3rd turbine wheel
10 Dirt/Dust Engine Squirrel, from Turbomeca Arriel S/N 796/794
12 Dirt/Dust Engine T56-A-14 module S/N T07409
13 Dirt/Dust Engine T56-A-14 module S/N T08809 - Turbine collection from 14th stage cooling air
14 Dirt/Dust Ground Afghanistan Sand - Collected from brown-out landing region in desert
15 Dirt/Dust Ground Afghanistan Dust/Dirt - Collected from helicopter landing pads
16 Dirt/Dust Engine T56-A-14 module S/N T12281
18 Dirt/Dust Ground Lake Heart, Woomera, collected May 2013
20 Dirt/Dust Ground Sand from Iraq
21 Volcanic Ash Ground Merapi 2006 - Unweathered Pure Ash Fall
22 Volcanic Ash Ground Chaiten, Chile 2008 - Unweathered pure ash fall
23 Volcanic Ash Ground Soufriere Hills 2009 - Unweathered pure ash fall
24 Volcanic Ash Ground Ruapehu NZ 1995 Sample 95/5 Unweathered ash fall - coarse
25 Volcanic Ash Ground Ruapehu NZ 1996 Sample 96/9 Unweathered ash fall - coarse
27 Dirt/Dust Ground RVO Trial - Mount Stuart Training Area Ground Collection
33 Dirt/Dust Ground Ground sample from Yuma Proving Ground
UNCLASSIFIED DST-Group-TR-3367
UNCLASSIFIED 37
5.2 XRD Results
The following sections contain the results of the XRD phase analysis of the dirt/dust and volcanic ash samples. Section 5.2.1 addresses the dirt/dust analyses and Section 5.2.2 addresses the volcanic ash phase analyses. For both the dirt/dust and the volcanic ash samples it is important to note that XRD can only identify crystalline phases. In particular, several of the volcanic ash samples had X-ray patterns with high backgrounds. This indicates that some constituents were amorphous or glass-like phases. These do not produce discrete diffraction lines. It is also possible that the dust/dirt samples also contained amorphous material. The presence of amorphous material may explain why not all the elements detected by EDS were accounted for within the phases identified by XRD. The missing elements could also be present in phases that diffracted too weakly to be identified or be incorporated into the crystalline lattice of identified phases without changing their diffraction patterns significantly. The most significant unaccounted for element was Fe.
5.2.1 Dirt and Dust Analysis
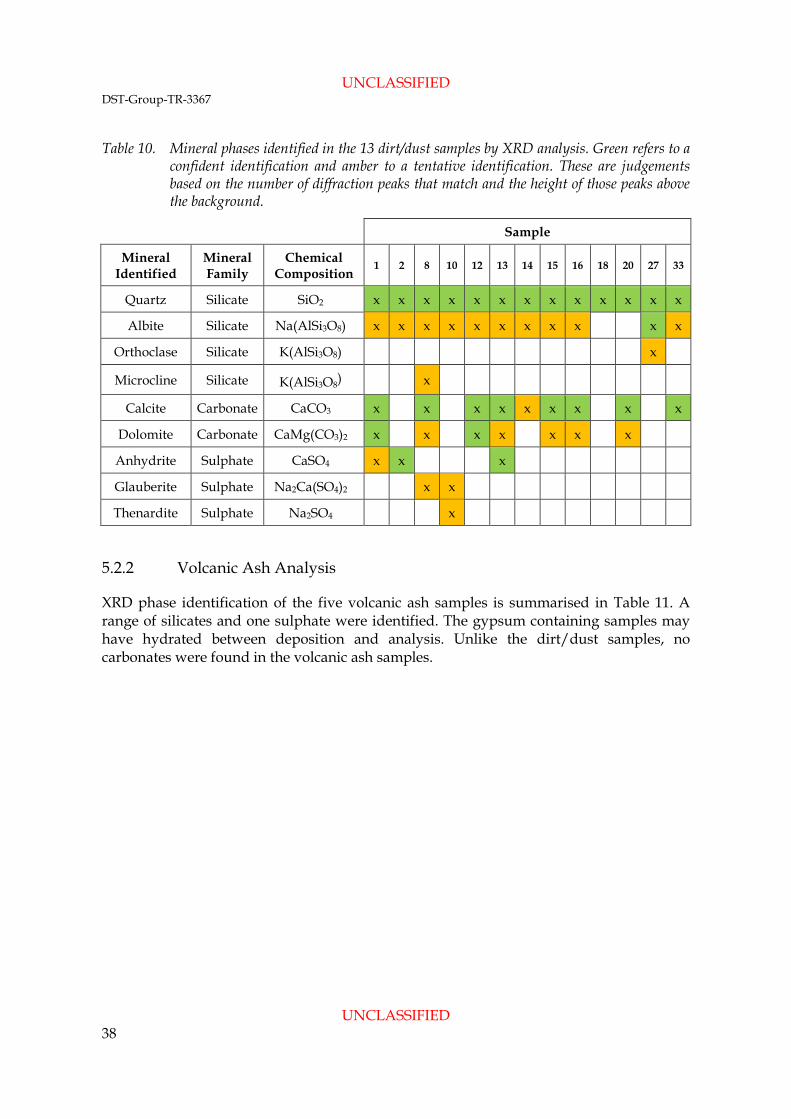
XRD phase identification revealed that the 12 dirt/dust samples were made up of nine different minerals. One sample, 18, contained only quartz. The results are summarised in Table 10. It is important to note that not all phases could be identified with the same level of confidence and that the identification relies on human judgement. The confidence level at which a phase can be identified within an XRD pattern depends on the heights of the diffraction peaks above background, and the number of diffraction peaks from the phase that can be clearly distinguished. Occasionally, the diffraction peaks from a major phase decreased confidence in the identification of a minor phase by obscuring some of the minor phases’ diffraction peaks. Therefore, Table 10 is colour coded where green refers to a confident identification and amber to a tentative identification. Many of the XRD patterns contained a range of small peaks which could not be assigned to a specific phase.
Quartz was confidently identified in all of the 13 dirt/dust samples and calcite was confidently identified in 8. Sulphates were tentatively identified in two of the dirt/dust samples. Sample 8, a T-56 engine-sourced sample, comprised the highest number of phases, with six phases being detected. Sample 18, a sample from Lake Heart, Woomera, comprised the lowest number of phases, with only quartz being confidently detected. The average number of phases detected in the dirt/dust samples was 3.7.
UNCLASSIFIED DST-Group-TR-3367
UNCLASSIFIED 38
Table 10. Mineral phases identified in the 13 dirt/dust samples by XRD analysis. Green refers to a confident identification and amber to a tentative identification. These are judgements based on the number of diffraction peaks that match and the height of those peaks above the background.
Sample
Mineral Identified
Mineral Family
Chemical Composition
1 2 8 10 12 13 14 15 16 18 20 27 33
Quartz Silicate SiO2 x x x x x x x x x x x x x
Albite Silicate Na(AlSi3O8) x x x x x x x x x x x
Orthoclase Silicate K(AlSi3O8) x
Microcline Silicate K(AlSi3O8) x
Calcite Carbonate CaCO3 x x x x x x x x x
Dolomite Carbonate CaMg(CO3)2 x x x x x x x
Anhydrite Sulphate CaSO4 x x x
Glauberite Sulphate Na2Ca(SO4)2 x x
Thenardite Sulphate Na2SO4 x
5.2.2 Volcanic Ash Analysis
XRD phase identification of the five volcanic ash samples is summarised in Table 11. A range of silicates and one sulphate were identified. The gypsum containing samples may have hydrated between deposition and analysis. Unlike the dirt/dust samples, no carbonates were found in the volcanic ash samples.

UNCLASSIFIED DST-Group-TR-3367
UNCLASSIFIED 39
Table 11. Mineral composition and the semi-quantitative phase analysis of the volcanic ash material determined from X-ray diffraction data. Green refers to a confident identification and amber to a tentative identification. The difference is a judgement based on the number of diffraction peaks that match and the height of those peaks above the background.
Sample
Mineral Family Composition
21 Mount Merapi
Indonesia (2006)
22 Chaiten
Chile (2008)
23 Soufrière Hills
Montserrat (2009)
24 Mount Ruapehu
New Zealand (1995)
25 Mount Ruapehu
New Zealand (1996)
Andesine Silicate (Na,Ca)Al(Si,Al)Si2O
8 X X X X
Labradorite Silicate (Ca,Na)Al(Al,Si)Si2O
8 X
α-Cristobalite Silicate SiO2 X X
Quartz Silicate SiO2 X
Diopside Silicate CaMgSi2O6 X
Gypsum Sulphate CaSO4·H
2O X X

UNCLASSIFIED DST-Group-TR-3367
UNCLASSIFIED 40
5.3 Physical Properties of the Particulates
The identification of the minerals comprising the dirt/dust and volcanic ash samples by XRD analysis permits the melting point and hardness of each of the mineral components to be determined from the literature. These physical properties are important with respect to both cold-end and hot-end degradation mechanisms.
In terms of cold-end degradation, the rate of erosion of compressor blade and vane aerofoils is, in part, a function of the hardness of the particulates in the airstream. If the particles are harder than the components they impinge on then erosion can be rapid [10], on the other hand, if the particles are of a lower hardness then little component erosion will occur. In the hot-end, the likelihood of a particulate melting and entering the turbine in a molten state, where it can then deposit on turbine components, is, in part, a function of its melting point [11]. The particles will melt if the temperature of the combustion gases is greater or equal to the particle’s melting point (provided the particles are sufficiently small, and that the residence time in the combustion gases is sufficiently long for the particles to reach thermal equilibrium with the combustion gases). The literature was therefore searched for the hardness and melting points of the phases identified.
5.3.1 Evaluation of Erosive Potential
In order to determine whether the observed phases had the potential to erode engine components and their protective coatings the hardness values of the identified phases were compared to that of typical engine materials. Table 12 lists the hardness values from the literature for both the identified phases and three materials (Ti-6Al-4V, IN718 and SS 17-4 PH) typical of those used to manufacture compressor or turbine aerofoils, and also for titanium nitride which is commonly used as the basis for erosion resistant coatings [10]. The hardness of aluminium oxide, a common abrasive, is also listed for comparison. The table uses the Mohs hardness scale which is commonly used for classifying minerals. In this scale, diamond, the hardness substance, has a Mohs hardness of 10 and talc, a soft mineral, a hardness value of 1. As the hardness values for the engine materials were not available on the Mohs scale, instead the Knoop, Vickers and Rockwell hardness values were employed to enable all the phases and materials to be ranked. The Vickers and Rockwell hardness values were first converted to Knoop values using ASTM standard tables [12]. These converted values and the original Knoop values were then converted to Mohs values using a Knoop to Mohs calibration curve based on the broad range of hardness data from the CRC handbook [13]. Although there is some residual uncertainty in the ranking (e.g. Nickel IN718 may be harder than Dolomite) it is reasonably clear that most of phases highlighted in orange are harder than the engine materials and have the potential to cause erosion. With the exception of dolomite, these hard phases are silicates. In contrast, the softer phases highlighted in green will cause little erosion of the engine materials. These soft phases are sulphates or carbonates. Given that the main phases of most of the samples were hard silicates (quartz, andesine or labradorite), all could cause aerofoil erosion.

UNCLASSIFIED DST-Group-TR-3367
UNCLASSIFIED 41
Table 12. Hardness values for minerals at room temperature identified in the dirt/dust and ash analyses as well as typical engine materials (highlighted in blue) and anti-erosion coatings (highlighted in purple). Minerals highlighted in orange are likely to erode typical engine materials. Minerals highlighted in green are unlikely to erode typical engine materials.
Material Mohs
Aluminum Oxide 9 [13]
Titanium Nitride 9 [13]
Quartz 6.5-6.7 [13] [14]
α-Cristobalite 6-7 [15]
Andesine 6-6.5 [16]
Labradorite 6-6.5 [17]
Albite 6-6.5 [18] [14]
Microcline 6-6.5 [18]
Orthoclase 6 [19]
Diopside 5.5-6.5 [20]
Dolomite 5.3-5.6 [13] [21]
Nickel IN718 5.3-5.4 [22] [23] [24]
Titanium Ti-6Al-4V 4.9-5.0 [25] [26] [27]
Stainless Steel 17-4 PH 4.4-5.8 [25] [28] [29]
Anhydrite 3.5 [30]
Calcite 3.4-3.8 [13] [21]
Glauberite 2.5-3 [31]
Thenardite 2.5-3 [32]
Gypsum 2 [13]
5.3.2 Evaluation of Deposition Potential
In order to deposit in the turbine section of an engine an ingested particle must first melt (or partially melt). Whether this occurs depends on factors such as particle melting point, residence time, viscosity, particle size, heat capacity and reflectance. The particle would need to be surrounded by combustion gases, hotter than its melting point, long enough for the energy required to melt it to be transferred. So even though the temperatures in the primary combustion zone of most gas turbine engines [33] are greater than the melting
UNCLASSIFIED DST-Group-TR-3367
UNCLASSIFIED 42
points of all the identified phases, not all engines will suffer from deposition. In order to simplify the problem of whether particulates will melt, for the purpose of this report, it has been assumed that ingested particulates will melt and deposit when their melting point is equal to or less than the turbine inlet temperature. In summary, we assume deposition occurs when:
Tm ≤ TIT (1)
This assumption is based on tests performed on a T56 engine. It was found that deposition of ingested particles occurred when the turbine inlet temperature (TIT) was greater than or equal to the melting point of the ingested particles (Tm) [11] [33]. For a particular engine the TIT varies with power setting and atmospheric conditions. Here we are assuming similar settings and conditions for the different engines so we can make comparisons between older cooler engines and newer hotter engines.
Unfortunately, the TITs of recent engines are not available in the open literature and cannot be reproduced in this unclassified version of the report. Therefore the TIT ranges of our current, future and legacy engines are shown schematically in Figure 27.
The melting points of the phases identified are shown in Table 13. Figure 27 shows that the legacy engines such as the T56 and TF30 would not be able to melt most of the silicates phases that were identified, with the possible exception of fine particles of Albite. However, it is possible that some of the amorphous content observed in the volcanic ash samples were silicates with melting points at or below that of the T56 TIT (~1100°C) [51] and therefore able to deposit in the legacy engines. This is compatible with the volcanic ash ingestion and deposition experiments of Kim et al, which found deposition [33]. Figure 27 shows that with the possible exception of quartz and α-cristobalite, all of the silicates identified are likely to form deposits in the hottest current and future ADF engines. This implies that CMAS will be a problem in many current and future ADF engines. This was confirmed by a DST group investigation of a current engine type used by the ADF. The investigation found both CMAS deposits and the corresponding degradation of the TBCs [34].
Tables 10 and 11 show that none of the phases identified contain all four CMAS elements (Ca, Mg, Al and Si). This is because the term CMAS was derived from analysing the composition of the observed molten deposits on turbine components and not the composition/s of the ingested materials. Deposition typically occurs in locations where the combustion gases impinge upon the turbine components. At these locations many different ingested phases may accumulate and are continually heated by the combustion gases. This facilitates the different particles (with different phases and compositions) to mix, react and become more homogenous. Therefore, the average composition of the mixed deposit is likely to encompass a larger range of elements than any of the phases identified in any one of the dust/dirt or ash samples. As the main constituents of many of these observed deposits were found to be Ca, Mg, Al and Si such mixed deposits are now generally referred to as ‘CMAS’ [11]. Furthermore, after several flights or hundreds of hours of further heating by the combustion gases it will be difficult to discern what the phases were present in the original deposited particles, and whether the particles were
UNCLASSIFIED DST-Group-TR-3367
UNCLASSIFIED 43
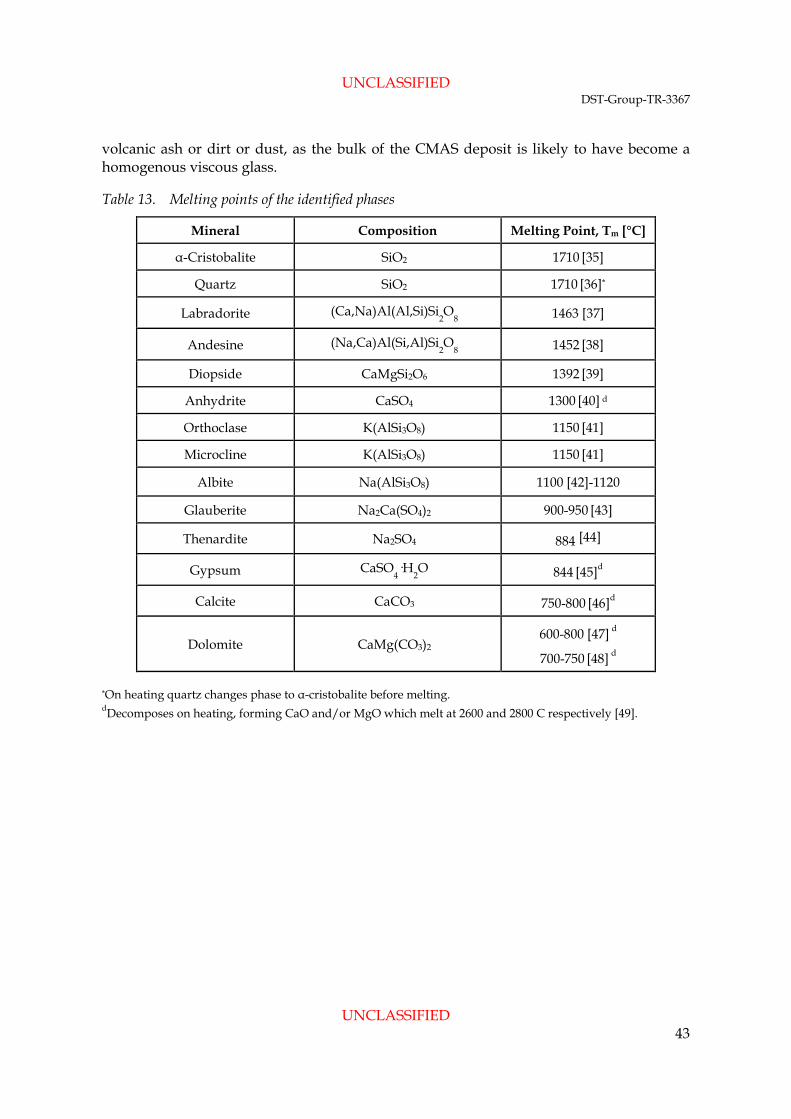
volcanic ash or dirt or dust, as the bulk of the CMAS deposit is likely to have become a homogenous viscous glass.
Table 13. Melting points of the identified phases
Mineral Composition Melting Point, Tm [°C]
α-Cristobalite SiO2 1710 [35]
Quartz SiO2 1710 [36]*
Labradorite (Ca,Na)Al(Al,Si)Si2O
8 1463 [37]
Andesine (Na,Ca)Al(Si,Al)Si2O
8 1452 [38]
Diopside CaMgSi2O6 1392 [39]
Anhydrite CaSO4 1300 [40] d
Orthoclase K(AlSi3O8) 1150 [41]
Microcline K(AlSi3O8) 1150 [41]
Albite Na(AlSi3O8) 1100 [42]-1120
Glauberite Na2Ca(SO4)2 900-950 [43]
Thenardite Na2SO4 884 [44]
Gypsum CaSO4·H
2O 844 [45]d
Calcite CaCO3 750-800 [46]d
Dolomite CaMg(CO3)2 600-800 [47] d
700-750 [48] d *On heating quartz changes phase to α-cristobalite before melting. dDecomposes on heating, forming CaO and/or MgO which melt at 2600 and 2800 C respectively [49].

UNCLASSIFIED DST-Group-TR-3367
UNCLASSIFIED 44
Figure 27. Comparison of TIT’s for ADF engines with melting points of the identified phases.
Given that quartz was the major phase in most samples collected, it is important for the management of future ADF engines that the melting point/s of the collected quartz be determined. The melting point of silicon dioxide (quartz and α-cristobalite) in its purest form is slightly above the estimated TIT for future engines. However, any ingested quartz-based phases are likely to be naturally occurring and therefore impure. In general, impurities reduce the melting point of the phase. Furthermore, even though specific mineral phases can be identified in the dirt/dust samples, it cannot be assumed that the minerals exist as distinct, homogeneous particles. In many cases the minerals will be present as particles made up of multiple phases, or as agglomerates of multiple minerals, which can again lower the temperature at which melting begins to occur between the minerals. When heated in the engine gas stream, these different phases can interact with each other, promoting the formation of molten phases and/or reduce melting points.
The phase diagrams for silicon dioxide (i.e. quartz) with additions of sodium oxide, magnesia (MgO), and potassium/aluminium oxide are shown in text books on ceramics [50]. These phase diagrams show that trace additions of these minerals will result in α-cristobalite and a liquid phase, at temperatures well below the melting point of silicon dioxide. This suggests that an ingested naturally occurring particle of quartz may have molten regions that could facilitate deposition.
If these melting point/s of the ingested quartz particulates are below that of pure quartz then CMAS will become a more frequent issue for our future fleets than that of our current engines. This will increase maintenance costs and decrease the time between hot-section overhauls.

UNCLASSIFIED DST-Group-TR-3367
UNCLASSIFIED 45
The behaviour of the sulphate and carbonate phases were not considered earlier with the silicates because they are more complex. Glauberite and thenardite will both melt and are likely to form deposits in all ADF engines. However, the gypsum, calcite and dolomite all decompose to form high melting point (2600 and 2800°C [49]) oxides of calcium or magnesium which are unlikely to melt in any gas turbine engine. However, in combination with other minerals and/or molten deposition they may promote the formation of molten phases and/or reduce melting points [51], as previously discussed.
6. Discussion
The magnitude of the degradation hazard that airborne particulates represent to gas turbine aero-engines is largely determined by the physical and chemical properties of the particulates. Developing an understanding of the types and properties of particulates that can become airborne and subsequently ingested by gas turbine aero-engines is thus an important activity if the degradation hazard presented to engines by particular environments is to be assessed.
When assessing a particular region or location for the types of dirt/dust particulates that may be ingested by an engine, sampling technique is of great importance. Ground sourcing of samples, while the simplest and most straightforward technique, produces samples that are not necessarily representative of what can become airborne and subsequently ingested by an engine. This is because ground samples are composed of both fine and coarse particulates, and thus a sample may contain a proportion of larger particulates that would never become airborne and hence ingestible under normal circumstances.
Ground sourcing of volcanic ash samples presents similar deficiencies. Ground-sourced volcanic ash was obviously airborne at some stage following its ejection from a volcano; however, larger particulates fall out of the atmosphere rapidly. It is only the finer particulates that will remain airborne and persist in the atmosphere for extended periods. Thus, as with dirt/dust samples, ground-sourced volcanic ash samples may comprise a proportion of larger particulates that would never become airborne for prolonged periods, and therefore would be unlikely to be ingested by an aircraft engine.
The samples of dirt/dust sourced from inside various ADF aircraft engines represent particulates that were ingested by the engines at some point in time, and thus must have been airborne. While only a proportion of the particulates ingested by an engine will remain trapped inside the various cavities, pipes and ducts of the engine, these samples at least represent actual airborne, ingested particulates. It is important to note that in most cases, the dirt/dust collected inside engines is accumulated over an extended period, so samples taken out of engines would likely be made up of particulates from a number of locations where the subject aircraft has previously operated. Determining where and/or when exactly an ingestion event occurred would be extremely difficult.

UNCLASSIFIED DST-Group-TR-3367
UNCLASSIFIED 46
Ideally, sampling of particulates at a location should involve atmospheric sampling in order to obtain realistic, representative samples of airborne, ingestible particulates. The Sandblaster 2 trial at Yuma Proving Ground [52], which involved particulate collections from dust clouds generated by rotorcraft, is a good example of how this can be done in a trial scenario. For longer-term assessment of specific locations, fixed particulate counter-collectors may be suitable for monitoring airborne particulates around airfields and landing zones. Remote sensing techniques may also be useful for monitoring and quantifying significant dust and ash clouds that affect active airspace.
Engine-sourced samples were consistently found to be finer (average d50: 8.3 µm) than ground-sourced dirt/dust (average d50: 145.5 µm) and ground-sourced volcanic ash (average d50: 146.5 µm). Similarly, the particle size distributions for the engine-sourced samples, Figure 2, show a narrow particle size distribution with the bulk of the samples having particle sizes less than 100 µm, whereas the ground-sourced dirt/dust (Figure 3) and volcanic ash samples (Figure 4) had much wider particle size distributions and significant proportions of particulates greater than 100 µm in size.
Analysis of particulate morphologies is important for assessing how erosive particulates may be if ingested by an engine. For a given mineral type, rougher, more angular particulates would be expected to be more erosive than smooth, rounded particulates. In most cases, the samples of engine-ingested dirt/dust particulates had more angular morphologies, while ground-sourced samples had smoother, more rounded morphologies. A likely explanation for this is that ground-sourced particulates have been weathered and thus tend towards a smoother morphology. Particulates ingested by engines may be more angular due to fragmentation as they pass through the engine and impact compressor blades and vanes at high velocities. The ground-sourced volcanic ash samples generally exhibited rough and angular morphologies, which was unsurprising given that the ash samples were all in an unweathered condition.
The erosive potential of ingested particulates is, in part, proportional to their hardness, as harder particles are more abrasive and therefore have greater potential to erode fan and compressor blades and vanes. While erosion is generally associated with fan and compressor blades and vanes, turbine components can also suffer from erosion. Typical alloys used in engines include titanium alloys (fan and compressor blades and vanes), stainless steels (later compressor stages) and nickel-based superalloys (turbine blades and vanes). The Mohs hardness values6 of these engine alloys are typically in the range of 4.4-5.8 (refer to Table 12). The sulphate and carbonate minerals identified in the dirt/dust and volcanic ash samples in this work were all assessed as being relatively soft, with Mohs hardness values of four or less, and were considered unlikely to cause erosion to most engine components. On the other hand, the silicate minerals possessed Mohs hardness values in the range 5.3-7 (refer to Table 12) and are therefore considered capable of causing erosion. Given that silicates were the most frequently observed mineral type across both
6 Room temperature hardness values were used. As temperature increases, the hardness of both the erosive medium and the engine components will decrease. These effects have not been addressed.
UNCLASSIFIED DST-Group-TR-3367
UNCLASSIFIED 47
the dirt/dust and volcanic ash samples, it is reasonable to conclude that most ingested particulates have the potential to erode engine componentry.
The potential for ingested particulates to melt in the hot gas-stream and subsequently deposit on turbine components and inside cooling channels is largely determined by the melting points of the particulates. It is well recognised that deposits of molten particulates on thermal barrier coatings can lead to spalling and failure of the coatings [53]. Identifying the phases present in samples of particulates helped in determining the likelihood of deposition in different generations of gas turbine engine.
Analysis in the SEM demonstrated that many particulate samples, particularly the volcanic ash, contained particulates made up of multiple phases. This is of interest as multi-phase particulates may have a greater tendency to melt in a hot gas-stream than if the same phases were present in separate single-phase particles.
Higher turbine inlet temperatures are desirable from performance and efficiency. Most gas turbine engines operate with turbine inlet temperatures exceeding 1000°C, with some modern engines operating with TITs exceeding 1500°C. As TITs increase with the introduction of newer, more advanced aircraft, the proportion of particulates that are likely to enter turbines in a molten state increases. Hotter-running engines also make greater use of ceramic thermal barrier coatings and advanced cooling technologies, which are vulnerable to damage and blockage by molten deposits. Consequently, newer generations of gas turbine aero-engines are more vulnerable to hot-end damage by ingested particulates as: (i) particulates are more likely to enter the turbine in a molten state, and (ii) the turbine components are more likely to be damaged by these deposits.
Qualitative phase analysis of the dirt/dust and volcanic ash samples found that the identified minerals exhibited a wide range of melting temperatures.
Among the dirt/dust samples (Table 13), the lowest melting point minerals identified were thenardite (sulphate, Tm=884°C) and glauberite (sulphate, Tm=900-950°C). These minerals were considered likely to melt and form deposits in all ADF engines. Calcite and dolomite were also identified. These minerals would decompose to form high melting point (2600 and 2800°C [49]) oxides of calcium or magnesium which are unlikely to melt in any gas turbine engine. However, in combination with other minerals and/or molten depositions they may promote the formation of CMAS [51].
Among the volcanic ash samples (Table 13), the lowest melting point minerals identified were diopside (silicate, Tm=1392°C) and andesine (silicate, Tm=1452°C). These minerals were considered likely to melt and form deposits in many current and potential future ADF engines (TIT≥1500°C). Similar to the dirt/dust samples, the volcanic ash samples were found to have gypsum (sulphate), a mineral that would decompose and potentially promote the formation of molten phases and/or reduce melting points.
The most abundant mineral identified in both the dirt/dust and volcanic ash samples was silicon dioxide (quartz, α-cristobalite (silicate, Tm=1710°C)). In their purest forms, both the quartz and α-cristobalite phases would be unlikely to melt in future ADF engines.

UNCLASSIFIED DST-Group-TR-3367
UNCLASSIFIED 48
However, any ingested phases are likely to be naturally occurring and therefore impure. In general, impurities reduce the melting point of the phase. Furthermore, in many cases the minerals will be present as either multiphase particles or as agglomerates. When heated in the engine gas stream, these different phases can interact with each other, promoting the formation of molten phases and/or reduce melting points. Due to the prevalence of quartz and the drive towards hotter turbine inlet temperatures it is expected that turbine component degradation by CMAS will become a more significant issue in future ADF engine fleets. This may lead to higher than expected operating costs and/or impacts on availability. Determining the melting point of naturally occurring, and therefore probably impure, quartz is consequently important.
To ascertain if the collected quartz and other silicates melt below their listed melting points, two further techniques should be applied:
1. Heating quartz particles on a hot stage while monitoring their shape under an optical microscope.
2. Subjecting samples with quartz to differential thermal analysis.
Both techniques can, in principle, show the temperature at which partial and full melting of the quartz occurs. Although, both techniques have limitations (e.g. determining which particles are quartz may be difficult under an optical microscope and the differential thermal analysis will average out the effects of all the particles in a sample) they will provide a better appreciation of the likelihood of deposition.
Irrespective of whether further laboratory studies are undertaken, the assumed correlation between deposition and Tm ≤ TIT should be tested. It may be possible to achieve this by correlating examples of observed deposition in ADF engines with samples of ingested material built up within the engine, in areas such as cooling passages.
Although, it would be expensive and difficult to study particle melting and deposition in a gas turbine engine, further understanding could be achieved with burner rig studies. Here particles would be injected into combustion gas flows of similar temperatures to gas turbine engines. The time the particles spend in the combustion gases would also be similar to that in gas turbine engines. It would then be possible to perform controlled experiments on melting and deposition of different types of particles at different gas temperatures up to 1800°C. It is therefore proposed that DST Group build an 1800°C burner rig to perform controlled experiments on ingestion. A key aim here will be to ascertain whether quartz can form deposits in the F135 engine.
CMAS deposits are likely homogenised mixtures of all the different particles that have added to the deposit. Figures 25 and 26 show that the range of elements is similar whether the particles are volcanic ash or dust or dirt, however, the figures also show that there could be large differences in the elemental ratios. The viscosity of a CMAS and its reactivity, and hence its potential to damage turbine coatings [34] or components, will depend on its elemental ratios. For example, large concentrations of Na or K are likely to lower the melting point and viscosity of a CMAS. Therefore, future work in addressing TBC degradation from CMAS attack would benefit from the selection of a set of standard

UNCLASSIFIED DST-Group-TR-3367
UNCLASSIFIED 49
CMAS compositions that cover the elemental ranges found in real dirt/dust and volcanic ash samples. These compositions could cover the observed range of melting points with three silicate glasses that soften at approximately 900, 1250 and 1600°C. This could be achieved by varying the proportion of Mg and/or Ca in the glass. The use of a single standard will not capture the full range of degradation mechanisms.
The frequent occurrence of sulphate minerals across the dirt/dust and volcanic ash samples is interesting from the point of view of turbine hot-corrosion. Sulphur-bearing materials, such as sodium sulphate (Na2SO4), also known by its mineral name thenardite, are well-recognised as causing hot-corrosion on nickel-based superalloys, such as those found in gas turbine hot-end components. While traditionally sodium sulphate in engines arises from sulphur in fuel combining with sodium in the air to form molten deposits, ingested particulates can also be a source of sulphur [54]. This suggests that dirt/dust and volcanic ash particulates may have a role in causing hot-corrosion degradation of turbine components.
7. Conclusions
From DST Group’s characterisation of dirt, dust and volcanic ash samples for gas turbine engine degradation studies the following conclusions can be made:
1. Ground-sourced sampling, while useful in identifying mineral constituents of dirt/dust and volcanic ash, produced samples with wide particle size distributions that were not necessarily representative of what can become airborne, and subsequently ingested, by an aircraft engine.
2. Samples obtained from inside engines represent true airborne particulates, though they only constitute a fraction of the total particulates ingested by an engine.
3. Engine-sourced samples were consistently found to have finer particle sizes than ground-sourced dirt/dust and ground-sourced volcanic ash, with the bulk of the engine-sourced samples exhibiting particle sizes less than 100 µm.
4. Particulates composed of multiple phases, which may have a greater tendency to melt in a hot gas-stream than the same phases as separate single-phase particles, were observed in many of the dirt/dust and volcanic ash samples.
5. Nine chemical elements were identified across all of the dirt/dust and volcanic ash samples examined in this study.
6. From a chemical composition perspective, the analysed dirt/dust and volcanic ash samples were quite similar, with little to differentiate between them.
7. Across the dirt/dust samples, a total of nine distinct crystalline mineral phases were identified by XRD. Silicate phases were the most numerous, comprising four of the nine phases. Three sulphate phases and two carbonates made up the remaining five phases. Quartz, a silicate phase, was the only mineral identified in every one of the 14 dirt/dust samples.

UNCLASSIFIED DST-Group-TR-3367
UNCLASSIFIED 50
8. Across the volcanic ash samples, six distinct crystalline mineral phases were identified. Silicate minerals were the most numerous, making up five of the six identified phases and a sulphate made up the remaining phase. No one phase was identified in all volcanic ash samples.
9. XRD analysis identified amorphous material in both the dirt/dust and the volcanic ash samples.
10. While the carbonate and sulphate minerals identified in the dirt/dust and volcanic ash samples are softer than typical engine alloys, the identified silicate minerals are harder, and therefore capable of eroding engine componentry.
11. Among the dirt/dust samples, the lowest melting point minerals identified were thenardite (sulphate, Tm=884°C) and glauberite (sulphate, Tm=900-950°C), while the highest melting point phase was quartz (Tm=1710°C).
12. Among the volcanic ash samples, diopside (silicate, Tm=1392°C) and andesine (silicate, Tm=1452°C) had the lowest melting temperatures, while the highest melting point phase was quartz (Tm=1710°C) and α-cristobalite (Tm=1710°C).
13. Impurities decrease the melting point of a phase. Ingested materials are expected to be impure.
14. The different phases in these agglomerates can interact promoting the formation of molten phases and/or reduce melting points.
15. The assumed correlation between deposition and Tm ≤ TIT suggested that most of the identified minerals would deposit in our hottest current and future engines.
16. The higher melting point minerals, namely quartz and α-cristobalite, will likely deposit as well in our future engines due to the impure nature of minerals.
17. CMAS is likely to become a more frequent issue for ADF engines that have TITs exceeding the melting point of quartz. This may lead to higher than expected operating costs and/or impacts on availability.
18. Sulphur-bearing dirt/dust and volcanic ash particulates may have a role in causing hot-corrosion degradation of turbine components.

UNCLASSIFIED DST-Group-TR-3367
UNCLASSIFIED 51
8. Recommendations
From DST Group’s characterisation of dirt, dust and volcanic ash samples for gas turbine engine degradation studies it is recommended that:
1. a low-temperature heat-treatment of dirt/dust and volcanic ash samples should be considered in order to burn off organic materials from samples prior to any analysis
2. the sampling of particulates at particular locations should use atmospheric sampling, in preference to ground sampling, in order to obtain realistic, representative samples of airborne, ingestible particulates
3. the modelling of particulate melting should be considered to gain a quantitative understanding of the factors that affect melting and subsequent deposition
4. the use of a set of standard CMAS compositions that cover the elemental and melting point ranges found in real dirt/dust and volcanic ash samples, rather than a single standard composition, should be considered for conducting laboratory assessments of TBC degradation
5. a burner rig should be developed at DST Group to perform controlled experiments on melting and deposition of different types of particles at different gas temperatures up to 1800 C (a key aim here being to ascertain whether quartz can form deposits in the F135 engine)
6. remote sensing options for quantifying atmospheric particulate concentrations should be explored through discussions with other agencies, such as the Bureau of Meteorology.

UNCLASSIFIED DST-Group-TR-3367
UNCLASSIFIED 52
9. References
[1] A. Hamed, W. C. Tabkoff and R. V. Wenglarz, “Erosion and Deposition in
Turbomachinery,” vol. 22, no. 2, pp. 350-360, 2006. [2] J. Calero, “ADF (ARMY) A17-036 Kiowa Failure Investigation of Bell 206B-1 Rolls
Royce 250-C20 Series Engine,” DSTO Client Report, DSTO-CR-2005-0001, 2005. [3] S. L. Slater and C. A. Wood, “Failure Analysis of a 1st Stage Turbine Blade from
RAAF T56-A-15 Turbine Module S/N T10441,” DSTO Client Report, DSTO-CR-2006-0008.
[4] S. L. S. a. C. A. Wood, “Failure Analysis of a 1st Stage Turbine Blade from RAAF T56-A-15 Turbine Module S/N T10441,” 2006.
[5] C. G. Levi, J. W. Hutchinson, M. H. Vidal-Setif and C. A. Johnson, “Environmental Degradation of Thermal Barrier Coatings by Molten Deposits,” MRS Bulletin, vol. 37, no. 10, 2012.
[6] M. Tamilselvi, S. Balam and R. Rajendran, “Rootcause analysis of discoloration of platinum aluminide coated DS CM 247LC high pressure nozzle guide vane of an aero-engine,” Engineering Failure Analysis, vol. 45, pp. 387-397, 2014.
[7] “Air travel disruption after the 2010 Eyjafjallojokull eruption,” [Online]. Available: http://en.wikipedia.org/wiki/Air_travel_disruption_after_the_2010_Eyjafjallaj%C3%B6kull_eruption.
[8] “British Airways Flight 9,” [Online]. Available: http://en.wikipedia.org/wiki/British_Airways_Flight_9.
[9] “KLM Flight 867,” [Online]. Available: http://en.wikipedia.org/wiki/KLM_Flight_867.
[10] M. Sesso and J. Thornton, “On the Erosion Resistance of Hard Coatings,”DST-Group TR in review, 2017/1041014.
[11] M. P. Borom, C. A. Johnson and L. A. Peluso, “Role of environmental deposits and operating surface temperature in spallation of air plasma spray,” Surface and Coatings Technology, Vols. 86-87, pp. 116-126, 1996.
[12] ASTM, “E140 Standard Hardness Conversion Tables for Metals Relationship Among Brinell Hardness, Vickers Hardness, Rockwell Hardness, Superficial Hardness, Knoop Hardness, Scleroscope Hardness, and Leeb Hardness”.
[13] D. R. Lide, CRC Handbook of Chemistry and Physics, 78th Edition, 2005. [14] F. Knoop, C. G. Peters and W. B. Emerson, “Sensitive pyramidal-diamond tool for
indentation measurements: U.S. National Bureau of Standards,” vol. 23, pp. 39-61, 1939.
[15] “Cristobalite: Cristobalite mineral information and data,” [Online]. Available: http://www.mindat.org/min-1155.html.
[16] “Andesine: Andesine mineral information and data,” [Online]. Available: http://www.mindat.org/min-220.html .
[17] “Labradorite: Labradorite mineral information and data,” [Online]. Available:

UNCLASSIFIED DST-Group-TR-3367
UNCLASSIFIED 53
http://www.mindat.org/min-2308.html. [18] “Microcline: Microcline mineral information and data,” [Online]. Available:
http://www.mindat.org/min-2704.html. [19] “Orthoclase: Orthoclase mineral information and data,” [Online]. Available:
http://www.mindat.org/min-3026.html. [20] “Diopside: Diopside mineral information and data,” [Online]. Available:
http://www.mindat.org/min-1294.html. [21] T. Y. Wong and R. C. Bradt, “Microhardness anisotropy of single crystals of calcite,
dolomite and magnesite on their cleavage planes,” Material Chemistry and Physics, vol. 30, pp. 261-266, 1992.
[22] A. Hascalik and M. Ay, “CO2 laser cut quality of Inconel 718 nickel based superalloy,” Optics & Laser Technology, vol. 48, pp. 554-564, 2013.
[23] A. D. Sharma, A. K. Sharma and N. Thakur, “Crystallographic, microstructure and mechanical characteristics of dynamically processed IN718 superalloy,” Journal of Alloys and Compounds, vol. 597, pp. 175-180, 2014.
[24] J. J. Schirra, “Effect of Heat Treatment Variations on the Hardness and Mechnical Properties of Wrought Inconel 718,” in Superalloys 718, 625, 706 and Various Derivatives, 1997.
[25] J. F. Shackelford and W. Alexander, Materials Science and Engineering Handbook 3rd Edition, CRC Press, 2001, p. 723.
[26] S. Campanelli, G. Casalino, M. Mortello, A. Angelastro and A. Ludovico, “Microstructural characteristics and mechanical properties of Ti6Al4V alloy fiber laser welds,” Procedia CIRP, vol. 33, pp. 428-433, 2015.
[27] J. C. Wilson, S. Banfield, J. Housden, C. Olivero and P. Chapon, “On the response of Ti-6Al-4V and Ti-6Al-7Nb alloys to a Nitron-100 treatment,” Surface & Coatings Technology, vol. 260, pp. 335-346, 2014.
[28] J. Wang, H. Zou, C. Li, R. Zuo, S. Qiu and B. Shen, “Relationship of microstructure transformation and hardening behavior of type 17-4 PH stainless steel,” J. Univ. Sci. Technol. Beijing, vol. 13, pp. 235-239, 2006.
[29] Z. Chen, G. Zhou and Z. Chen, “Microstructure and Hardness Investigation of 17-4PH Stainless Steel by Laser Quenching,” Materials Science and Engineering A, vol. 534, pp. 536-541, 2012.
[30] “Anhydrite: Anhydrite mineral information and data,” [Online]. Available: http://www.mindat.org/min-234.html.
[31] “Glauberite: Glauberite mineral information and data. - Mindat.org,” [Online]. Available: http://www.mindat.org/min-1706.html.
[32] “Thénardite: Thénardite mineral information and data,” [Online]. Available: http://www.mindat.org/min-3935.html.
[33] J. Kim, M. Dunn, A. Baran, D. Wade and E. Tremba, “Deposition of Volcanic Materials in the Hot Sections of Two Gas Turbine Engines,” Transactions of the ASME Journal of Engineering for Gas Turbines and Power, vol. 115, no. 646, 1993.
[34] J. Thornton, C. Wood, J. A. Kimpton, M. Sesso, M. Zonneveldt and N. Armstrong,
UNCLASSIFIED DST-Group-TR-3367
UNCLASSIFIED 54
“Failure Mechanisms of Calcium Magnesium Aluminium Silicate Affected Thermal Barrier Coatings,” J Am Ceram Soc. 2017;00:1–11.
[35] G. H. Aylward and T. J. V. Findlay, SI Chemical Dta, vol. 52, 1974. [36] W. D. Callister, Materials Science and Engineering An Introduction, vol. 60, 1991, pp.
331-362. [37] Doelter, “Determination of melting-points by the optical method,” Zeitscrift fur
Elektrochemie, vol. 12, pp. 617-621, 1906. [38] P. Richet and Y. Bottinga, “Anorthite, andesine, wollastonite, diopside, cordierite
and pyrope: thermodynamics of melting, glass transitions, and properties of the amorphous phases,” Earth and Planetary Science Letters, vol. 67, pp. 415-432, 1984.
[39] J. J. DeYoreo, R. A. Lange and A. Navrotsky, “Scanning calorimetric determinations of the heat contents of diopside rich systems during melting and crystallisation,” vol. 59, no. 13, pp. 2701-2707, 1995.
[40] W. M. Swift, A. F. Panek, G. W. Smith, G. J. Vogel and A. A. Jonke, “Decomposition of Calcium Sulfate: A Review of the Literature ANL-76-122,” Argonne National Lab, 1976.
[41] “Minerals in sedimentary rocks stability, identity and textures,” [Online]. Available: http://www.geo.arizona.edu/geo3xx/geo306_mdbarton/classonly/306%20Web%20Materials/306_Lecture041108.htm.
[42] J. P. Greenwood and P. C. Hess, “Congruent melting kinetics of albite: theory and experiment,” Journal of Geophysical Research, vol. 103, pp. 29815-28, 1998.
[43] D. Freyer, W. Voigt and K. Kohnke, “The phase diagram of the system Na2SO4-CaSO4,” Eur. J. Solid State Inorg. Chem, pp. 595-606, 1998.
[44] G. G. Hawley, The Condensed Chemical Dictionary, 10th ed., New York: Van Nostrand Reinhold Co., 1981, p. 952.
[45] H. B. B. C. P. Ltd, “Gypsum MSDS”. [46] E. Ruiz-Agudo, C. Rodriguez Navarro, A. Luque, A. Rodriguez Navarro and M.
Ortega Huertas, “A TEM and 2D-XRD Study of the Thermal Decomposition of Calcite,” Revista de la Sociedad Espanola de Mineralogia, vol. 9, 2008.
[47] A. I. Rat'ko, A. I. Ivanets, E. A. Kulak, Morozov and I. O. Sakhar, “Thermal Decomposition of Natural Dolomite,” Inorganic Materials, vol. 47, no. 12, pp. 1372-1377, 2011.
[48] P. Engler, M. W. Santana, M. Mittleman and D. Balazs, “Non isothermal in situ XRD analysis of dolomite decomposition,” The Rigaku Journal, vol. 5, no. 2, pp. 3-8, 1988.
[49] G. W. C. Kaye and T. H. Laby, Tables of Physical and Chemical Constants 14th Edition, London: Longman Group Limited, 1973.
[50] W. D. Kingery, H. K. Bowen and D. R. Uhlmann, Introduction to Ceramics - 2nd Edition, John Wiley and Sons, 1976, p. 288.
[51] R. Naraparaju, P. Mechnich, U. Schulz and G. C. M. Rodriguez, “The Accelerating Effect of CaSO4 Within CMAS (CaO–MgO–Al2O3–SiO2) andIts Effect on the Infiltration Behavior in EB-PVD 7YSZ,” Journal of The American Ceramic Society , vol. 99, no. 4, p. 1398–1403, 2016.
UNCLASSIFIED DST-Group-TR-3367
UNCLASSIFIED 55
[52] C. Cowherd, “Sandblaster 2 Support of See-Through Technologies for Particulate Brownout,” 2007.
[53] L. Li, N. Hitchman and J. Knapp, “Failure of Thermal Barrier Coatings Subjected to CMAS Attack,” Journal of Thermal Spray Technology, vol. 19, no. 1, pp. 148-155, 2010.
[54] N. Eliaz, N. G. Shemesh and R. M. Latanision, “Hot Corrosion In Gas Turbine Components, Engineering Failure Analysis,” Engineering Failure Analysis, vol. 9, no. 1, pp. 31-43, 2002.
[55] C. Report. [56] “Quartz: Quartz mineral information and data,” [Online]. Available:
http://www.mindat.org/min-3337.html. [57] “Albite: Albite mineral information and data,” [Online]. Available:
http://www.mindat.org/min-96.html. [58] “Calcite: Calcite mineral information and data,” [Online]. Available:
http://www.mindat.org/min-859.html. [59] “Dolomite: Dolomite mineral information and data,” [Online]. Available:
http://www.mindat.org/min-1304.html. [60] “Gypsum: Gypsum mineral information and data,” [Online]. Available:
http://www.mindat.org/min-1784.html. [61] M. Bauccio, ASM Metals Reference Book Third Edition, Materials Park, OH: ASM
International, 1993, p. 512. [62] W. Taylor, “Correlation of the Mohs scale of hardness with the Vickers hardness
numbers,” Mineralogical Magazine, vol. 28, pp. 718-721, 1949. [63] J. Hogan, S. Boonsue, J. Spray and R. Rogers, “Micro-scale deformaton of gypsum
during micro indentation loading,” International Journal Rock Mechanics & Mining Sciences, vol. 54, pp. 140-149, 2012.
[64] DAVENG - DGTA, “RAAF Rolls Royce T56-A-14/15 Engine Structural Integrity Management Plan Vol. 1”.
10. Acknowledgements
The authors would like to gratefully acknowledge the following people for their contributions to this study:
• Adrian Weller at Defence Technology Agency, New Zealand, for providing the volcanic ash materials to DST Group for analysis
• Adrian Knight at Rheological Consulting Services Pty Ltd, for the laser particle size analyses of the samples.
• Matthew Rowles at The University of Melbourne for the XRD analyses of the samples
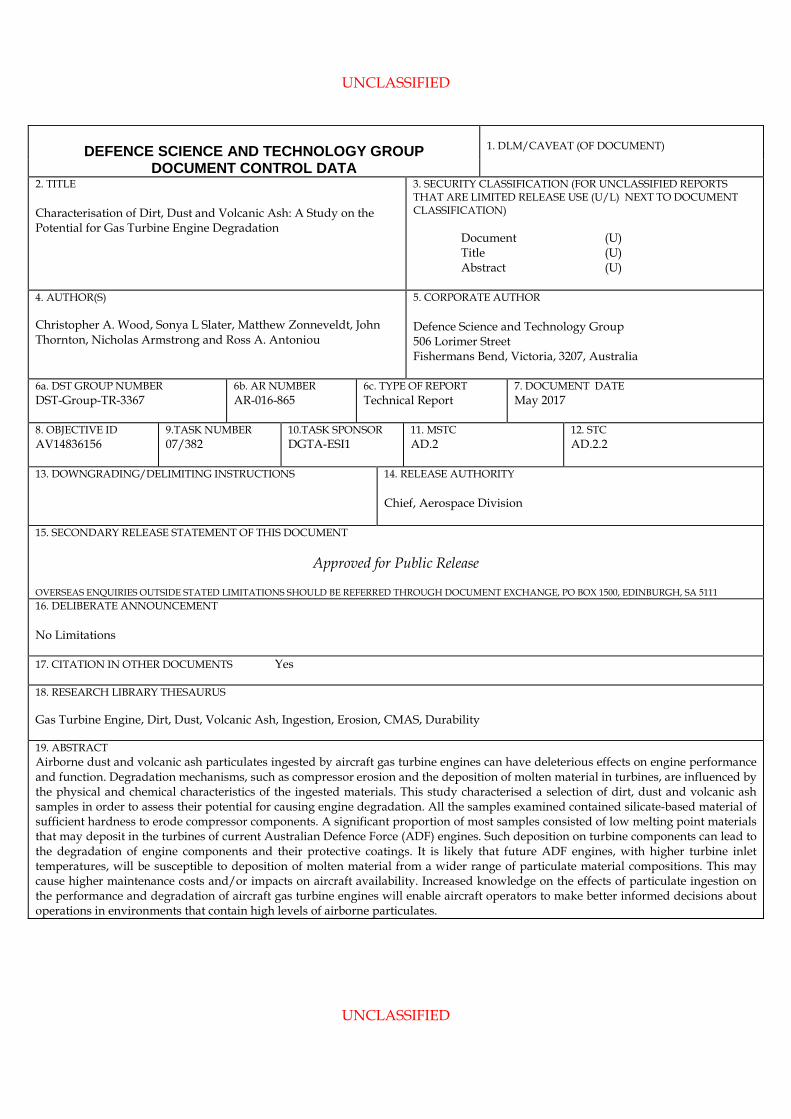
UNCLASSIFIED
UNCLASSIFIED
DEFENCE SCIENCE AND TECHNOLOGY GROUP
1. DLM/CAVEAT (OF DOCUMENT) DOCUMENT CONTROL DATA
2. TITLE Characterisation of Dirt, Dust and Volcanic Ash: A Study on the Potential for Gas Turbine Engine Degradation
3. SECURITY CLASSIFICATION (FOR UNCLASSIFIED REPORTS THAT ARE LIMITED RELEASE USE (U/L) NEXT TO DOCUMENT CLASSIFICATION) Document (U) Title (U) Abstract (U)
4. AUTHOR(S) Christopher A. Wood, Sonya L Slater, Matthew Zonneveldt, John Thornton, Nicholas Armstrong and Ross A. Antoniou
5. CORPORATE AUTHOR Defence Science and Technology Group 506 Lorimer Street Fishermans Bend, Victoria, 3207, Australia
6a. DST GROUP NUMBER DST-Group-TR-3367
6b. AR NUMBER AR-016-865
6c. TYPE OF REPORT Technical Report
7. DOCUMENT DATE May 2017
8. OBJECTIVE ID AV14836156
9.TASK NUMBER 07/382
10.TASK SPONSOR DGTA-ESI1
11. MSTC AD.2
12. STC AD.2.2
13. DOWNGRADING/DELIMITING INSTRUCTIONS
14. RELEASE AUTHORITY Chief, Aerospace Division
15. SECONDARY RELEASE STATEMENT OF THIS DOCUMENT
Approved for Public Release OVERSEAS ENQUIRIES OUTSIDE STATED LIMITATIONS SHOULD BE REFERRED THROUGH DOCUMENT EXCHANGE, PO BOX 1500, EDINBURGH, SA 5111 16. DELIBERATE ANNOUNCEMENT No Limitations 17. CITATION IN OTHER DOCUMENTS Yes 18. RESEARCH LIBRARY THESAURUS Gas Turbine Engine, Dirt, Dust, Volcanic Ash, Ingestion, Erosion, CMAS, Durability 19. ABSTRACT Airborne dust and volcanic ash particulates ingested by aircraft gas turbine engines can have deleterious effects on engine performance and function. Degradation mechanisms, such as compressor erosion and the deposition of molten material in turbines, are influenced by the physical and chemical characteristics of the ingested materials. This study characterised a selection of dirt, dust and volcanic ash samples in order to assess their potential for causing engine degradation. All the samples examined contained silicate-based material of sufficient hardness to erode compressor components. A significant proportion of most samples consisted of low melting point materials that may deposit in the turbines of current Australian Defence Force (ADF) engines. Such deposition on turbine components can lead to the degradation of engine components and their protective coatings. It is likely that future ADF engines, with higher turbine inlet temperatures, will be susceptible to deposition of molten material from a wider range of particulate material compositions. This may cause higher maintenance costs and/or impacts on aircraft availability. Increased knowledge on the effects of particulate ingestion on the performance and degradation of aircraft gas turbine engines will enable aircraft operators to make better informed decisions about operations in environments that contain high levels of airborne particulates.