characterisation of fuel volatile compounds using a new
TRANSCRIPT

HAL Id: ineris-00972135https://hal-ineris.archives-ouvertes.fr/ineris-00972135
Submitted on 3 Apr 2014
HAL is a multi-disciplinary open accessarchive for the deposit and dissemination of sci-entific research documents, whether they are pub-lished or not. The documents may come fromteaching and research institutions in France orabroad, or from public or private research centers.
L’archive ouverte pluridisciplinaire HAL, estdestinée au dépôt et à la diffusion de documentsscientifiques de niveau recherche, publiés ou non,émanant des établissements d’enseignement et derecherche français ou étrangers, des laboratoirespublics ou privés.
Characterisation of fuel volatile compounds using a newionic microsensor
Patrick Bonnet, Didier Jamois, A. Rachid
To cite this version:Patrick Bonnet, Didier Jamois, A. Rachid. Characterisation of fuel volatile compounds using a newionic microsensor. International Conference and Advances in Vehicle Control and Safety, Jul 1998,Amiens, France. pp.507-513. �ineris-00972135�

98-34
Characterisation offuel volatile compounds using a new ionic microsensor
P. BonnetD. Jamois
Laboratoire d'analyse et de mesures ä l'emissionet capteurs (LAME)
Institut national de l'environnement industriel etdes risques (INERIS)
Vemeuil en Halatte,BP2 60550
Abstract
This articie describes an ionic microsensorcapable of characterising the volatile phase offuels. Ions are generated by the thin film catalyticmicrosensor developed by LETI and INERIS, as-sociated with a multi-level temperature interroga-tion technique. A suitably polarised electrode isadapted to this sensor m order to collect the ions.A measwement bench has been developed simulta-neously to record the responses offour sensors tomixtures of gases or vapours. Laboratory testsconducted on a wide ränge ofmolecules (alkanes,alcohols, ketones, aldehydes, etc.) show that it ispossible to differentiate between most of thesesubstances.
Key words: Catalytic microsensor, ionic emission,multilevel interrogation, volatile phase of dieselfüel, diesel pollutiön
l Introduction
The "Intemal combustion engines" project oftheDIVA (Diagnostique Industriel et Vehicules Avan-ces) [Industrial Diagnostics and Advanced Vehi-cles] research centre, fünded by Region Picardie,aims to develop a real-time system capable ofmodifying the operating parameters of a dieselengine so äs to optimise its pollutant emissions andfüel consumption. In view of the varied composi-tions of diesel füels and the effects that composi-tion has on the engine running, there is undoubtedtechnical interest in being able to characterise thefüel in the tank. Existing measurement facilities aretoo large to be carried on board the vehicie or can'tdiscem variations in diesel füel composition. This
A. Rachid
Automatic Systems Laboratory LSAJules Veme University ofPicardy UPJV
Amiens, Rue du MoulinNeuf 80000
articie describes an ionic microsensor able to pro-vide the engine Computer with useable data aboutthe füel quality. The thermionic emission due to thecatalytic combustion of a combustible gas on thesurfäce of a heated platinum filament has beendemonstrated in a number of research projectsincluding those M. E. UMSTEAD et al. [l] and W.M. SEARS et al. [2] for example. These authorsshowed that the total quantity of ions collectedduring this type of combustion depends on thefilament temperature and on the nature of the oxi-dised molecule [3] [4]. The filament in these testswas heated continuously to a given temperature.The filaments used were typically a few centime-tres long with a diameter of 0.125 mm.
Figure 1: Schematic diagram ofthe sensor
2 Sensor description
Like PIDs and FIDs, this sensor is composed oftwo parts (figure l): the first is based on the cata-lytic microsensor with platinum filament developedby LETI and INERIS [5], which generates the ions;the second part collects and measures the ions. The
Congres Advances in Vehides Control and Safety, Amiens, 1-3 juillet 1998, p. 507-513
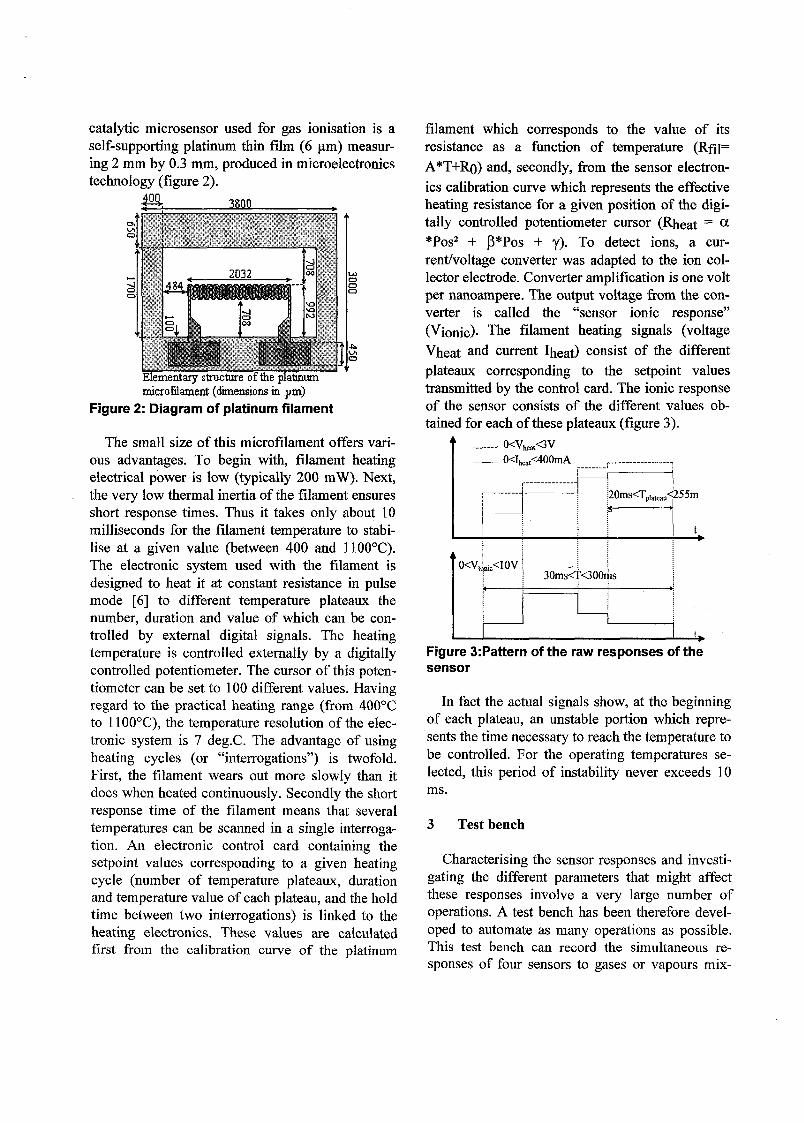
catalytic microsensor used for gas Ionisation is aself-supporting platinum thin film (6 (im) measur-ing 2 mm by 0.3 mm, produced in microelectronicstechnology (figure 2).
m.
Elementary structure ofthe platinummicrofilament (dimensions in yia)
Figur e 2: Diagram of platinu m filamen t
The small size of this microfilament offers vari-ous advantages. To begin with, filament heatingelectrical power is low (typically 200 mW). Next,the very low thermal inertia ofthe filament ensuresshort response times. Thus it takes only about 10milliseconds for the filament temperature to stabi-lise at a given value (between 400 and 1100°C).The electronic System used with the filament isdesigned to heat it at constant resistance in pulsemode [6] to different temperature plateaux thenumber, duration and value of which can be con-trolled by extemal digital signals. The heatingtemperature is controlled extemally by a digitallycontrolled potentiometer. The Cursor of this poten-tiometer can be set to 100 different values. Havingregard to the practical heating ränge (from 400°Cto 1100°C), the temperature resolution ofthe elec-tronic System is 7 deg.C. The advantage of usingheating cycles (or "interrogations") is twofold.First, the filament wears out more slowly than itdoes when heated continuously. Secondly the shortresponse time of the filament means that severaltemperatures can be scanned in a single interroga-tion. An electronic control card containing thesetpoint values corresponding to a given heatingcycle (number of temperature plateaux, durationand temperature value of each plateau, and the holdtime between two interrogations) is linked to theheating electronics. These values are caiculatedfirst from the calibration curve of the platinum
filament which corresponds to the value of itsresistance äs a fünction of temperature (Rfil=A*T+R.o) and, secondly, from the sensor electron-ics calibration curve which represents the effectiveheating resistance for a given position of the digi-tally controlled potentiometer Cursor (Rheat = a
*Pos2 + ß*Pos + y). To detect ions, a cur-rent/voltage Converter was adapted to the ion col-lector electrode. Converter amplification is one voltper nanoampere. The output voltage from the con-verter is called the "sensor ionic response"(Vionic)- Thö filament heating signals (voltageVheat äüd current Iheat) consist of the differentplateaux corresponding to the setpoint valuestransmitted by the control card. The ionic responseof the sensor consists of the different values ob-tained for each ofthese plateaux (figure 3).
0<Vi,e,t<3V0<Iheat<400mA ,.—————-,
255m
0<V„„,c<10V30ms<T<300ms
Figur e 3:Patter n ofthe raw response s ofth esensor
In fact the actual signals show, at the beginningof each plateau, an unstable portion which repre-sents the time necessary to reach the temperature tobe controlled. For the operating temperatures se-lected, this period of instability never exceeds 10ms.
3 Test bench
Characterising the sensor responses and investi-gating the different parameters that might affectthese responses involve a very large number ofoperations. A test bench has been therefore devel-oped to automate äs many operations äs possible.This test bench can record the simultaneous re-sponses of four sensors to gases or vapours mix-

tures. The vapours are generated using a motorisedsyringe (figure 4). This type of system can generateall the vapour concentrations needed for the pur-posesofthetest.
Figur e 4: Generatin g combustibl e vapour s
A data acquisition system simultaneously rec-ords the signals from the four sensors: these consistof the ionic responses together with the filamentheating voltage and current. Automatic data proc-essing gives the effective temperature of eachplateau together with the corresponding ionic re-sponse value.
4 Tests carried out
The first task was to study the influence of theoperating parameters (electrode-filament distanceand bias voltage) and of the ambient measurementconditions (relative humidity and the proportion ofoxygen present). The second phase was to investi-gate the response of the sensor in the presence ofcombustible molecules. Most of the moleculestested are listed in the following table.
Name of gas or vapourMethanePropaneButanePentaneCyclohexane2.2 Dimethyl butane2.3 Dimethyl butaneMethyl pentaneN-HexaneHeptaneMethyl-cyclo-hexaneOctane
FamilyAlkaneAlkaneAlkaneAlkaneAlkaneAlkaneAlkaneAlkaneAlkaneAlkaneAlkaneAlkane
NbofCl34566666778
2.3.4 trimethyl pentane 89102334462
AlkaneAlkaneAlkaneAlcoholAlcoholAlcoholAlcoholAlcoholAlcoholAlkyne
NonaneDecaneEthanolPropanol-1Propanol-2Butanol-1Butanol-2Hexanol-1AcetyleneButanal Aldehyde 4
Aldehyde 6KetoneKetoneKetoneKetoneKetoneAromatic 6Aromatic 7Aromatic 8Aromatic 9Aromatic 9Aromatic 10
HexanalAcetoneMethyl-ethyl-ketone2-Methyl-3 -butanoneHexanone-2Methyl isobutyl ketoneBenzeneTolueneEthyl benzeneTrimethyl 1,2,4 benzeneTrimethyl 1,3,5 benzeneCumeneTable 1: Principa l molecule s tested .
Some of these molecules were tested at differentconcentrations using different interrogation cycles(l, 6, 12, 24 or 100 temperature plateaux accordingto the molecules).
4.1 Reference tests
In order to take into account any Variation in thesensor ionic response with time, or response dis-persion between sensors, reference tests were con-ducted periodically. Accordingly the sensors char-acteristics were recorded in N50 synthetic air,0.69% butane and 1000 ppm acetone for an elec-trode-filament distance of 2 mm and a bias voltageof -80 V. There is no sensor ionic response fortemperatures below 1100°C in air. The response inbutane (6900 ppm) shows a maximum (100 mV or100 pA) around 9000C. The response to acetone(1000 ppm) shows a maximum (220 mV) around950°C. Making alloWance for the differences be-tween the filaments reactive surface areas, all theseresults agree with the data from the literature.

4.2 Influence of the operating parameters ofthe sensor
Sensor respons e at 730-C äs a funcUo n of electrode-fflamen tdistanc e
Figur e 5
Influenc e of acceleratiii g voltag e
40 60 80 100
Acceleratin g voltag e (In »olts )
Figur e 6
Influenc e of the percentag e of oxygen e presen t bn thecombustio n of 2000ppm of butan e
9% 11% 13% 15% 17%
Percentag e of oxygene (in % v/v)
Figur e 7
The ions created in combustion reactions desorbfrom the platinum filament at a velocity VQ and arethen accelerated by the electric field produced bythe bias voltage applied to the collecting electrode.The intensity of this acceleration is proportional tothe bias voltage applied between the electrode andthe filament, and inversely proportional to theelectrode-filament distance. It can be seen from thecurve in figure 5 that the ionic response is inverselyproportional to the electrode-filament distance. Theshape of the curves on figure 6 shows that theefficiency of ion collection is dependent of the
applied accelerating field. The moving ions areslowed down and their direction changed essen-tially by impacts with neutral molecules in thesurrounding atmosphere. Accordingly the numberof ions collected on the electrode is a fünction ofthe accelerating electric field: this is certainlyrelated to the detecting head geometry which wasnot optimised for maximum collection efficiency.The accelerating voltage (-80 V) and the referenceelectrode-filament distance (2 mm) were deter-mined from these results for the four sensors.
4.3 Influence of measurement conditions
Quite apart from the nature and quantity of thecombustible gas to be detected, other parameterscan influence measurements. It was confirmed thatvariations in flow rates between 50 cnrVmin and 2l/min do not change the ionic response. Figure 7shows the influence of the oxygen percentagepresence (from 20% to 6% by volume) on thesensor ionic responses at different temperaturesunder the reference conditions. As the oxygenconcentration falls, the practically linear ionicresponse is also seen to fall. Also, it is possible toevaluate the power dissipated by the catalyticcombustion reaction by measuring the heatingparameters of the microsensor. However no fall incatalytic activity, obtained from microsensor heat-ing parameters measures, is observed äs the oxygenconcentration declines. It must therefore be con-cluded that although catalytic activity is necessaryfor ionic emission [4] during the different combus-tion stages, at least one specific stage in ion crea-tion process is limited by the oxygen concentration.It can be seen however that for a given oxygenconcentration the responses ratios for differenttemperatures remain the same. Consequently thediscrimination potential of the sensor does notappear to be adversely affected by a fall in theoxygen concentration.
4.4 Responses to combustible molecules
Owing to the varied nature and proportions ofthe füel components, it was not possible at thisstage to conduct systematic tests for each dieselfuel ingredient. This investigation attempts to
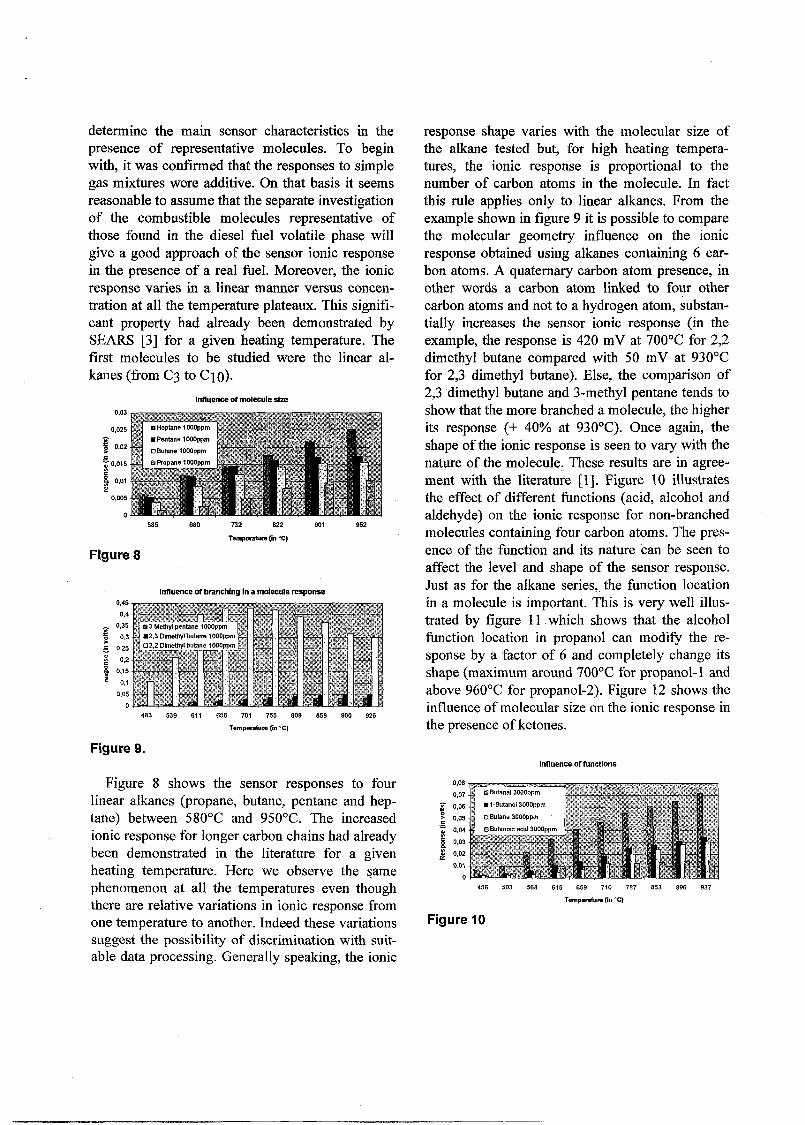
determine the main sensor characteristics in thepresence of representative molecules. To beginwith, it was confirmed that the responses to simplegas mixtures were additive. On that basis it seemsreasonable to assume that the separate investigationof the combustible molecules representative ofthose found in the diesel fuel volatile phase willgive a good approach of the sensor ionic responsein the presence of a real fuel. Moreover, the ionicresponse varies in a linear manner versus concen-tration at all the temperature plateaux. This signifi-cant property had already been demonstrated bySEARS [3] for a given heating temperature. Thefirst molecules to be studied were the linear al-kanes (frorn €3 to CK)).
[nfluenc e of molecul e size
732 822
Temporatur e (in • C)
Figur e 8
i nfluenc e of branchin g In a molecul e respons e
701 755
Temperatur e (m "C)
Figur e 9.
Figure 8 shows the sensor responses to fourlinear alkanes (propane, butane, pentane and hep-tane) between 580°C and 950°C. The increasedionic response for longer carbon chains had alreadybeen demonstrated in the literature for a givenheating temperature. Here we observe the samephenomenon at all the temperatures even thoughthere are relative variations in ionic response fromone temperature to another. Indeed these variationssuggest the possibility of discrimination with suit-able data processing. Generally speaking, the ionic
response shape varies with the molecular size ofthe alkane tested but, for high heating tempera-tures, the ionic response is proportional to thenumber of carbon atoms in the molecule. In factthis ruie applies only to linear alkanes. From theexample shown in figure 9 it is possible to comparethe molecular geometry influence on the ionicresponse obtained using alkanes containing 6 car-bon atoms. A quatemary carbon atom presence, inother words a carbon atom linked to four othercarbon atoms and not to a hydrogen atom, substan-tially increases the sensor ionic response (in theexample, the response is 420 mV at 700°C for 2,2dimethyl butane compared with 50 mV at 930°Cfor 2,3 dimethyl butane). Eise, the comparison of2,3 dimethyl butane and 3-methyl pentane tends toshow that the more branched a molecule, the higherits response (+ 40% at 930°C). Once again, theshape ofthe ionic response is seen to vary with thenature of the molecule. These results are in agree-ment with the literature [l]. Figure 10 illustratesthe effect of different fünctions (acid, alcohol andaldehyde) on the ionic response for non-branchedmolecules containing four carbon atoms. The pres-ence of the fünction and its nature can be seen toaffect the level and shape of the sensor response.Just äs for the alkane series, the fünction locationin a molecule is important. This is very well illus-trated by figure 11 which shows that the alcoholfünction location in propanol can modify the re-sponse by a factor of 6 and completely change itsshape (maximum around 700°C for propanol-1 andabove 960°C for propanol-2). Figure 12 shows theinfluence of molecular size on the ionic response inthe presence ofketones.
Influenc e of fünction s
615 659 710 787
Temperafure (in °C)
Figur e 10

Unlike the alkanes, the ionic response falls ästhe length of the carbon chains associated with theketone fünction increases. Indeed äs the size ofthemolecule increases, the ionic response tends to-wards that of the alkanes of equivalent molecularweight, äs if the fünction specificity is attenuatedby the length of the carbon chains. Accordingly thefünction has most effect on molecules of smallsize. Figure 13 shows the responses obtained for anumber of saturated and aromatic cycles. In factthese responses are extremely low (frequentlybelow l mV). Only the cyclanes and light aromaticcompounds are liable to give usable responses.
Influenc e of fünctio n locatlo n In the molecul e
456 502 568 625 645 719 768 813 863 912 958
Temperatur e (in °C)
Figurell
Respons e to Ketone s
702 755 818
Temperatur e (in °C)
Figur e 12
respons e to cycli c molecule s
Temperatur e (in "C)
Figur e 13
5 Composition ofa diesel fuel
Although the compositions of diesel fuels areextremely varied, essentially owing to additives, itis possible to discem major molecular families.Figure 15 shows the average composition of acommercial diesel füel.
Type of molecule (size) Proportions by massAlcanes (C\Q a C^Q)Cyclanes (>Cy)Aromatics (>C(,)Ethers(C2äCn)Aleohols
30%35%20%10%<5%
Table 2: Mass compositio n of Diesel fuel [7].
On the basis of this typical diesel füel composi-tion, an attempt can be made to determine what themain composition of its volatile phase will be.Since most of the molecules in diesel füel have ahigh molecular weight, the volatile phase consistsessentially ofthe lightest ethers and alcohols, a fewcyclanes and aromatics, and other light moleculesresulting frorn imperfections in refining, the natureand quantities of which are not well known. How-ever, it can be seen that the ionic responses tocyclanes and aromatics are low compared withthose to ethers and alcohols. On the other hand, thepresence of ethers and alcohols gives ionic re-sponses at high levels and with fairly characteristicshapes.
Compound s liabl e to have the greates t influenc e on Ionicrespons e to Dfesel vapour s
Temperatur e (in °C)
Figur e 14
Figure 14 shows the ionic response obtained inthe presence oftwo molecules representative ofthetwo most volatile compounds families (ethers andalcohols). It can therefore be expected that theionic sensor will be fairly sensitive to ethers and

alcohols concentrations for different diesel füels, orto change in their composition by the progressivedepletion of the most volatile compounds gaseousphase.
loni c respons e to Diesel oll vapou r
Temperatur e (in "C)
Figur e 15
Figure 15 shows typical experimental ionicresponses obtained in the presence of diesel füelvapours once the liquid-vapour equilibrium hasbeen reached, and then in unbalanced conditions(test volume flushed with air and renewed everytwo minutes), after one hour. In spite of the lowSaturation diesel fuel vapour pressure [7], a quitesatisfactory signal level is obtained. The ionicresponse obtained for diesel füel in static air showsa number of inflection points that are characteristicof a mixture of different kind of molecule. Thelarge signal at high heating temperatures recalls thecurve shape obtained for ether, with in addition alocal maximum around 650°C, which suggests analcohol-1 response (Figure 11). When the air abovethe fuel is renewed at a fairly rapid rate, the vapourconcentration falls. This explains the fall in theaverage level of the ionic response observed. Sincethe fuel quantity used was very low for an exten-sive liquid-gas exchange surface, it is likely thatthe relative proportion of highiy volatile com-pounds feil with respect to other components. Thiscould explain a relative fall in the signal attributedto the presence of ethers for high heating tempera-tures. It is now necessary to make measurementson a number of fuels in rigorous test conditions inorder to ensure reproductibility and usability ofionic responses.
6 Conclusion
The ionic sensor described here can detect mostvolatile organic molecules. The ionic response äs afünction of temperature varies with the nature andconcentration of molecules. The multiple tempera-ture plateaux pulse mode has renewed the interestin such a sensor since the research already under-taken by other teams. This property shows thediscrimination capability of such a sensor in cir-cumstances where only a single füel molecule hasto be identified. Since the responses to mixtures areadditive, it could possible to combine such a sensorand a suitable data processing System in order toidentify the constituents of a gas. The tests con-ducted on diesel füel show that it is possible todetect certain molecules constituting its volatilephase. At this stage of the research it seems rea-sonable to believe that this sensor will differentiatecertain variations in diesel füel composition.
Bibliography '
[l] M. E. UMSTEAD, F. J. WOODS and J. E.JOHNSON, « A Study ofthe Ionisation Produced by the Catalytic Combustion ofHydrocarbons, » Journal ofcatalysis , 5, 293-300,1996.
[2] W. M. SEARS,V.A.MOEN,B.K.MIREMADI,R.F.FRINDT and S.R.MORRISON, « PositiveIon Emission from a Platinum Hot Wire GasSensor, ».Sensors and Actuators, 11, 209-220,1987.
[3] W. M. SEARS, « Production of Positive IonsDuring the Catalytic Oxydation of OrganicVapors on Hot Platinum, » Anal. Chem., 60,460-465, 1988.
[4] W. M. SEARS and R. MORRISSON,« Design of Platinum Hot Wire Gas Sensors, » Sensors and Actuators, 13, 89-101,1988.
[5] Charbonnages de France, « Capteur ä filamenten couche minee autoporte, », Brevet WO91/02242, 1991.
[6] Charbonnages de France, « Procede pseudo-continu d'interrogation d'un detecteur de gazoxydable, », Brevet WO 90/12313, 1990.
[7] Carburants et Moteurs, J. C. GUIBET, 1996.