characterisation of manganese peroxidase and laccase ... · bacteria capable for degradation of...
TRANSCRIPT
Vol.:(0123456789)1 3
World Journal of Microbiology and Biotechnology (2018) 34:32 https://doi.org/10.1007/s11274-018-2416-9
ORIGINAL PAPER
Characterisation of manganese peroxidase and laccase producing bacteria capable for degradation of sucrose glutamic acid-Maillard reaction products at different nutritional and environmental conditions
Vineet Kumar1 · Ram Chandra1
Received: 20 July 2017 / Accepted: 27 January 2018 / Published online: 2 February 2018 © The Author(s) 2018. This article is an open access publication
AbstractMaillard reactions products (MRPs) are a major colorant of distillery effluent. It is major source of environmental pollution due to its complex structure and recalcitrant nature. This study has revealed that sucrose glutamic acid-Maillard reaction products (SGA-MRPs) showed many absorption peaks between 200 and 450 nm. The absorption maximum peak was noted at 250 nm in spectrophotometric detection. This indicated the formation of variable molecular weight Maillard products during the SGA-MRPs formation at high temperature. The identified aerobic bacterial consortium consisting Klebsiella pneumoniae (KU726953), Salmonella enterica (KU726954), Enterobacter aerogenes (KU726955), Enterobacter cloaceae (KU726957) showed optimum production of MnP and laccase at 120 and 144 h of growth, respectively. The potential bac-terial consortium showed decolourisation of Maillard product up to 70% in presence of glucose (1%), peptone (0.1%) at optimum pH (8.1), temperature (37 °C) and shaking speed (180 rpm) within 192 h of incubation. The reduction of colour of Maillard product correlated with shifting of absorption peaks in UV–Vis spectrophotometry analysis. Further, the changing of functional group in FT-IR data showed appearance of new peaks and GC–MS analysis of degraded sample revealed the depolymerisation of complex MRPs. The toxicity evaluation using seed of Phaseolus mungo L. showed reduction of toxic-ity of MRPs after bacterial treatment. Hence, this study concluded that developed bacterial consortium have capability for decolourisation of MRPs due to high content of MnP and laccase.
Keywords Melanoidins · Manganese peroxidase · Laccase · Metabolites · GC–MS analysis
Introduction
Melanoidins are complex, dark coloured, amino-carbonyl polymeric compounds with high molecular weight, formed by non-enzymatic browning Maillard reaction (MR) during several industrial processes (Hayase 2000; Echavarría et al. 2014; Bharagava and Chandra 2010). The major sources of
melanoidins in environment are sugarcane-molasses based distilleries and fermentation industries all over the world. Due to its complex unknown organic pollutants and high total dissolved solids (TDS), the safe disposal of distillery waste is a paramount challenge for industrialist (Chandra and Kumar 2017). The toxicity of distillery waste is well documented in terrestrial and aquatic environment due to presence of heavy metals and recalcitrant organic com-pounds (Chandra et al. 2008a, b; Hemavanthi et al. 2015). The majority of molasses-based distilleries are located in tropical and subtropical regions of world and generate ~ 12–15 liters of effluent per liter of alcohol production. Cur-rently, there are more than 397 distilleries are operating in India producing approx. 3.25 × 10¹⁰ liters of ethanol and gen-erating 40.90 × 10¹⁵ liters of effluent annually (AIDA 2016).
Various physico-chemical methods such as column filtra-tion (Satyawali and Balakrishnan 2008), flocculation (Liang
Electronic supplementary material The online version of this article (https ://doi.org/10.1007/s1127 4-018-2416-9) contains supplementary material, which is available to authorized users.
* Ram Chandra [email protected]; [email protected]
1 Department of Environmental Microbiology, School for Environmental Sciences, Babasaheb Bhimrao Ambedkar Central University, Vidya Vihar, Raebareli Road, Lucknow, Uttar Pradesh 226025, India
World Journal of Microbiology and Biotechnology (2018) 34:32
1 3
32 Page 2 of 18
et al. 2009a), adsorption (Onyango et al. 2011), chemical precipitation or coagulation (Chandra and Singh 1999; Liang et al. 2009b), UV/H2O2 treatment (Dwyer and Lant 2008) and ozone oxidation (Kim et al. 1985) has been reported for removal and decolourisation of distillery effluent, but these techniques are not feasible at large scale due to high cost and blockage of filtration devices. Moreover, due to high TDS it generates huge amount of toxic sludge and other second-ary pollutants (Liang et al. 2009b; Chandra et al. 2008a). In addition, the conventional anaerobic digestion and activated sludge processes are effective in removing the biochemi-cal oxygen demand (BOD) and chemical oxygen demand (COD) from effluent upto certain extent only. But, the color of distillery effluent converts darker with higher TDS after anaerobic treatment due to complexation of melanoidins. Therefore, extended aeration of distillery effluent does not change its physico-chemical properties even after aeration.
Hence, in recent years, the biological approaches with microbial decolourisation process of effluent for optimisa-tion of various parameters at laboratory conditions have drawn attention of various workers world over to explore the feasible technology because it may lead eco-sustainable and cost effective alternative to chemical methods (Kaushik et al. 2010). Under biological treatment process using fungi such as Geotrichum candidum (Kim and Shoda 1999) Flavadon flavus (Raghukumar and Rivonkar 2001), Phanerochaete chrysosporium (Thakkar et al. 2006), Trametes sp. (Gonzalez et al. 2000), Coriolus hirsutus (Miyata et al. 2000), Pleurotus florida, Aspergillus flavus (Pant and Adholeya 2009a), Neu-rospora intermedia (Kaushik and Thakur 2013), Fusarium verticillioides (Pant and Adholeya 2009b) and yeast Citero-myces sp., Candida tropicalis (Tiwari et al. 2012), and Can-dida glabrate (Mahgoub et al. 2016) have been reported for melanoidins degradation using different category of melanoi-dins. The degradation and decolourisation of melanoidins by fungus has been reported more effective due to prevalence of ligninolytic enzymes, which metabolizes melanoidins as a sole carbon and nitrogen sources (Miyata et al. 2000; González et al. 2008). But, the large scale applications of these techniques have own constraint due to slow growth cycle, huge spore formation, low pH range (3.0–5.0), and adverse submerged aquatic environment for growth of fun-gus (Arimi et al. 2014). Therefore, bacteria are promising alternative for higher decolourisation due to its faster growth rate, higher environmental adaptability and high metaboliz-ing capability of melanoidins by ligninolytic enzyme activity (Bharagava et al. 2009; Yadav et al. 2011). Some worker have reported the bacterial decolourisation and degradation of sugarcane molasses melanoidins as well as model mela-noidins both (Kumar and Chandra 2006; Chandra et al. 2009; Bharagava and Chandra 2009). But, due to complex nature of melanoidins in sugarcane molasses with mixture of various other organic compounds it shows variable absorption range
which makes more difficult to understand the mechanism of melanoidins decolourisation and characterization of its metabolic products. But, most of degradation/decolourisation process of molasses-melanoidins is reported at 475 nm only based on purified melanoidins absorption maxima through dialysis process with specific molecular weight, while the molasses-melanoidins contains mixture of Maillard products (i.e. initial, intermediate and advanced stages with variable molecular weight). Therefore, prior to attempting the degra-dation and decolourisation of distillery effluent, the degrada-tion of model melanoidins with mixture of complex Maillard reaction products (MRPs) should be evaluated for its degra-dability. But, no any such study has been reported so far for assessment of melanoidins degradation as whole to assess the capability of bacterial consortium. Moreover, recent studies have revealed the preferential role of MnP for melanoidins depolymerisation followed by laccase induction in bacterial degradation (Yadav and Chandra 2012, 2013). The role of bacterial manganese peroxidase (MnP) and laccase for mela-noidins degradation is less reported.
Therefore, the main objective of this study was to inves-tigate the MnP and laccase producing bacterial consor-tium capability for the degradation and decolourisation of complex sucrose glutamic acid-Maillard reaction products (SGA-MRPs), which are predominantly present in sugarcane juice composition which generate the complex of molasses melanoidins due to thermal degradation reaction at subse-quent stage (Walford 1996; Eggleston and Vercellotti 2000). Further, the change in absorption peaks (200–700 nm) by UV–Vis spectrophotometric analysis has been correlated for their structural changes and reduction in color by investiga-tion through fourier transform-infrared spectroscopy (FT-IR), high performance liquid chromatography (HPLC), and gas chromatography–mass spectrometry (GC–MS) analysis. Furthermore, to evaluate the stability of potential bacterial consortium at variable nutritional and environmental con-ditions was assessed for optimum degradation and decol-ourisation of SGA-MRPs. The reduction of toxicity after bacterial degradation was also evaluated by using seed ger-mination test of Phaseolus mungo L.
Materials and methods
Distillery sludge sample collection, isolation and screening of melanoidins tolerant, MnP, and laccase producing bacterial strains
The sludge sample was collected from the dumping site of M/s Unnao Distilleries and Breweries, located in Unnao, Uttar Pradesh (26°320″N, 80°30′0″E), India for isolation of potential bacterial strains. For isolation of bacterial strains, 10 g of sludge sample was transferred to a 250 mL

World Journal of Microbiology and Biotechnology (2018) 34:32
1 3
Page 3 of 18 32
Erlenmeyer flask containing 100 mL sterile GPM broth (g L−1; glucose 1%, peptone 0.1%, MgSO4·7H2O 0.05%, K2HPO4 0.1%). The flasks were incubated at 37 ± 1 °C in a refrigerated incubator shaker (Orbitek, Scigenic Biotech, India) at 120 rpm for 7 days. The flask containing the sam-ple showing the decolourisation was selected. Subsequently, an aliquot (1.0 mL) was taken serially diluted in order of 10−2, 10−3, 10−4, 10−5, and 10−6, then after diluted sample (0.1 mL) was spread on GPM agar medium plates. Further, the bacterial colonies showing clear zone on agar plates were purified on GPM agar plate by streak plate method.
To investigate, the bacterial tolerance on melanoidins purified bacterial strains were spread on pre-sterilised GPM agar medium plate amended with different concentration of molasses melanoidins (1000, 1500, 2000, 2500, 3000, and 3500 mg L−1 w/v). Each plate was incubated at 37 ± 1 °C for 48 h and observed for growth of tolerant bacterial colo-nies. The bacterial strains tolerant to high concentration of melanoidins were selected and screened for MnP and lac-case activity by plate assay method. For enzyme screening, the substrate used for MnP (EC 1.11.1.13) was phenol red (Lobachemie, India) (Pangallo et al. 2007), while laccase (EC 1.10.3.2) activity was detected in presence of guaiacol (Sigma-Aldrich, St. Louis, MO, USA) as a substrate in B&K agar medium containing (g L−1) dextrose 1%, peptone 0.5%, beef extract 0.3%, NaCl 0.5%, and CuSO4 (1 mM) (D’Souza et al. 2006). The conversion of dark pink to yellow colour indicated the presence of MnP activity and reddish brown colour zones in the medium indicated the presence of lac-case activity.
Identification of bacterial strains
Morphological and biochemical characterisation
The isolated bacterial strains were identified based on mor-phological and biochemical characteristics by using the standard procedure described by Barrow and Feltham (2003).
Molecular characterisation
The isolated potential MnP and laccase producing bacterial strains were characterized by 16S rRNA gene sequence anal-ysis. The total genomic DNA from the overnight growth cul-ture of bacterial consortium was extracted using the method described by Kapley et al. (2001). The PCR amplicon were electrophoresed through 1.2% (w/v) agarose gel in 1× TAE buffer using 1 Kb DNA ladder (Merck Biosciences, India), then visualized by staining with ethidium bromide. Finally, the amplified 16S rDNA gene amplicon were purified from gel using a PCR cleanup kit (Merck Biosciences, India) and sequenced using 1492R and 27F eubacterial primer in an automated DNA sequencer. A phylogenetic tree was
generated using the MEGA software (version 6.0) by the Neighbor-Joining method (Tamura et al. 2013).
Maillard products decolourisation and degradation studies
Preparation and physico-chemical analysis of Maillard products
SGA-MRPs were prepared following the method described by Bharagava et al. (2009). Briefly, 1.0 M sucrose, 1.0 M glutamic acid, and 0.5 M sodium carbonate were dissolved in 1.0 L of doubled distilled water and the pH of the reac-tion mixture was adjusted to 8.0 with 1 N NaOH. After this, the solution was refluxed at 110 °C for 8 h. The prepared SGA-MRPs were diluted to 10% of its original concentration using distilled water to obtain the OD 3.5 ± 0.02 at 250 nm. This prepared SGA-MRPs solution was used for physico-chemical and decolourisation studies. The physico-chemical parameters (i.e. color, pH, BOD, COD, TDS, etc.) of SGA-MRPs were analysed as per standard methods (APHA 2012).
Construction of bacterial consortium for decolourisation studies
A loopful pure culture of isolated bacteria strains IITRCS01, IITRCS06, IITRCS07, and IITRCS11 was transferred to a 50 mL modified GPM broth medium supplemented with K2HPO4 (0.1%), MgSO4·7H2O (0.05%) and molasses mela-noidins (1000 mg L−1) and incubated for 24 h in continu-ous shaking condition (125 rpm) at 37 ± 1 °C. After 24 h, the equal volume of each bacterial strains containing cell density 3.1 × 10⁴ cells mL−1 was used for preparation of dif-ferent bacterial consortium. The bacterial strains IITRCS01, IITRCS06, IITRCS07, and IITRCS11 were taken in the vari-ous combinations i.e. in the ratio of 1:1:1:1, 1:2:1:1, 1:2:2:1, 1:2:2:2, 2:1:1:2; 2:2:1:1, 2:2:2:1 and 2:2:2:2 for optimal decolourisation of SGA-MRPs.
Decolourisation assay
The decolourisation experiment was carried out in Erlen-meyer flasks (250 mL) containing 100 mL of previously prepared (as mentioned in “Maillard products decolourisa-tion and degradation studies” section) sterile SGA-MRPs solution supplemented with (glucose 1%, peptone 0.1%, K2HPO4 0.1%) and MgSO4·7H2O (0.05% g L−1) and 1.0 mL of trace elements solution containing CuSO4·5H2O (0.003%), MnCl2·4H2O (0.001%), ZnSO4·7H2O (0.001%), and CaCl2·2H2O (0.002%), and pH was adjusted to 7.0 with 1 N NaOH (Bharagava et al. 2009). The flasks were inocu-lated with 1% (v/v) over night grown culture of bacterial consortium (OD 0.24) and incubated at 37 ± 1 °C under
World Journal of Microbiology and Biotechnology (2018) 34:32
1 3
32 Page 4 of 18
shaking flask condition (125 rpm) for 192 h. The decol-ourisation of SGA-MRPs was monitored by measuring the change in absorbance maxima of the melanoidins at 250 nm after scanning of absorbance maxima by using a UV–Vis spectrophotometer (Evoluation-201, Thermo Scientific, USA). Simultaneously, the un-inoculated flask contain same medium and condition was used as control. The % decolori-zation was calculated as
Optimisation of culture conditions for decolourisation and degradation of SGA‑MRPs
Optimisation of nutritional parameters
The effect of different carbon source viz. sucrose, fructose, glucose, xylose, lactose, and starch at 1.0% (w/v) were eval-uated for the SGA-MRPs decolourisation and degradation. In another experiment, different organic and inorganic nitro-gen sources viz. peptone, beef extract, yeast extract, sodium sulphate, ammonium chloride and urea were added into the GPM medium at 0.5% (w/v) concentration. The effect of carbon and nitrogen sources were optimised for decolourisa-tion and degradation SGA-MRPs at different concentration viz. 0.1–1.0 (w/v).
Optimisation of environmental conditions
To evaluate the effect of different environmental conditions the same experiment was carried out at different temperature (25–50 °C), pH (4–12), and shaking speed (100–220 rpm).
Evaluation of bacterial growth, biomass, and scanning electron microscopic (SEM) observation of bacterial consortium
During decolourisation experiment, the optical density was continuously measured till 192 h at 12 h periodic interval by taking absorbance at 620 nm by UV–Vis spectrophotometer as the measurement of the bacterial cell growth. While the bacterial sample for biomass determination and SEM micro-graph was collected from the flask after 144 h of incuba-tion. First, the bacterial cells were centrifuged (6500×g) for 10 min at 4 °C, the pellets were washed thrice with distilled water to remove the attached medium contents. For bacte-rial biomass determination, the pellet was dried in an hot air oven at 80 °C until getting a constant dried weight reported in the form of dry cell mass (g L−1). For SEM micrograph, the bacterial cells were fixed with 1% (w/v) glutaraldehyde in 0.1 M phosphate buffer (pH 7.2) for 2 h and washed again
Decolourisation (%)
=initial absorbance (A0) − final absorbance (A1)
initial absorbance (A0)× 100
with distilled water. The fixed samples were then dehy-drated through 25, 50, 75, 95 and 100% ethanol solutions in increasing concentration for 5 min, at each step. The samples were then dried in critical point drier and coated with a thin conductive film of gold in a sputtering coater and observed under SEM (FEI Quanta 450, Hillsboro, USA).
Estimation of MnP and lacasse activity
To measure the ligninolytic activity during degradation, the bacterial degraded supernatant was obtained by centrifuga-tion at 6500×g for 10 min at 4 °C. The MnP and laccase activity was determined using the phenol red (Lobachemie, Mumbai, India) and guaiacol (Sigma-Aldrich, St. Louis, MO, USA), respectively as described earlier (Arora et al. 2002). The enzyme activity was expressed as international unit (IU), where 1 IU represents the amount of enzyme that forms 1 µmol of product per minute under standard assay conditions.
UV–Vis and FT‑IR spectroscopic analysis
UV–Vis absorption spectra of the treated and untreated SGA-MRPs solution were recorded using a UV–Vis spec-trophotometer in the wavelength range between 200 and 700 nm at room temperature. Further, FT-IR analysis of the sample was performed in range of 400–4000 cm−1 using a spectrophotometer (Nicolet™ 6700, Thermo Scientific, USA) in order to reveal the chemical nature of the SGA-MRPs. The separated samples of SGA-MPs were mixed with potassium bromide (KBr) to prepare the pellet for FT-IR analysis.
Extraction and identification of various organic compounds
The organic compounds present in treated and untreated SGA-MPs were extracted by ethyl acetate under acidic condition (pH < 2.0) as previously described (Chandra and Kumar 2017). An aliquot of the concentrate was dissolved in 3.0 mL methanol, filtered through 0.22-µm syringe filters and used for further HPLC and GC–MS analysis.
HPLC analysis
HPLC analysis was carried out using waters, 515 HPLC instrument equipped with a diode array detector system (1100 series, Agilent Technologies, USA) and reverse phase C18 column (250 × 4.6 mm, 5 µm particle size) by using the gradient of solvent A (Milli-Q water) and solvent B (acetonitrile with 0.1% TFA) (Merck, Germany) at a flow rate 0.4 mL min−1 for 60. The detection was monitored at wavelength 250 nm (absorption maxima) to assess the
World Journal of Microbiology and Biotechnology (2018) 34:32
1 3
Page 5 of 18 32
decolourisation and degradation of Maillard products. 50 µL of methanol extract was injected into the column by using a glass microsyringe (Agilent Technologies, USA).
GC–MS analysis
In GC–MS analysis, the extracted samples were derivatised with trimethylsilyl (TMS) as described by Chandra and Kumar (2017). An aliquot (2.0 µL) of derivatised sample was injected in GC–MS (Trace GC Ultra Gas Chromatograph, Thermo Scientific, USA) equipped with a TriPlus auto sampler cou-pled to TSQ Quantum XLS triple quadrupole mass spec-trometer (Thermo Scientific, USA). Separation was carried out on DB-5 MS capillary column (30-m length × 0.25 µm I.D. × 0.25 mm film thickness of 5% phenyl and 95% methyl-polysiloxane) with helium as the carrier gas at a flow rate of 1.1 mL min−1. The temperature of GC oven was programmed started from 65 °C (hold for 2 min), increased to 230 °C at a rate of 6 °C min−1 and finally reached to 290 °C (hold for 20 min) at a rate of 10 °C min−1 increased. The transfer line temperature and ion source temperature were kept at 290 and 220 °C, respectively. The mass spectrum (MS) was operated in the positive electron ionization (+ EI) mode at an electron energy of 70 eV with a solvent delay of 7 min. The MS was operated in full-scan mode from m/z, 45–800. The detected organic compounds were identified by matching with the MS library NIST v. 1.0.0.12 available with instrument.
Toxicity assessment of Maillard reaction products
The toxicity effect of untreated and treated SGA-MRPs was studied on P. mungo L. seed germination using Petri dish method (Chandra and Kumar 2017). The seed germination parameters like germination percentage, germination index (GI), relative toxicity percentage, phytotoxicity percentage and stress tolerance index were calculated using the formula described earlier (Chandra and Kumar 2017; David Noel and Rajan 2015).
Statistical data analysis
All the experiment was carried out in triplicate and the results were presented as the mean of three independent observations. To confirm the variability of data obtained and validity of results, the mean concentration of various physico-chemical parameters of untreated and treated SGA-MRPs was calculated by Student’s t test by using SPSS (ver-sion 17.0, Chicago, USA).
Results
Isolation and screening of bacterial strains
Twenty-seven morphologically distinct bacterial strains were isolated from distillery sludge. Only four bacterial isolates namely IITRCS01, IITRCS06, IITRCS07, and IITRCS11 could show the MnP activity by changing the deep orange to light yellow color at melanoidins (800 mg L−1) containing phenol red amended modified GPM agar plates, as well as laccase activity by developing a reddish brown color zone on B&K agar plate during the screening of potential bac-terial strains capable for growth on SGA-MRPs amended media. The screened bacterial strains also showed toler-ance for growth on melanoidins amended GPM agar plate at 3500 mg L−1 concentration.
Characterisation and identification of bacterial strains
Screened bacterial strains IITRCS01, IITRCS06, IITRCS07, and IITRCS11 showed several morphological and bio-chemical characteristics are mentioned in Bergey’s manual of Systematic Bacteriology (Brenner et al. 2005). Further, the molecular identification of screened bacterial strains IITRCS01, IITRCS06, IITRCS07, and IITRCS11 showed specific amplification of a single band of around 1500 bp of 16S rRNA gene (Supplementary Fig. S1). The BLAST analysis of nucleotide sequence data of representative iso-lates was showed 100% sequence homology with Klebsiella pneumoniae (KU726952), Salmonella enterica (NR044372), Enterobacter aerogenes (NR024643), and Enterobacter cloaceae (KJ437492) found in the GenBank database. Hence, based on the sequence homology, the bacterial strain IITRCS01, IITRCS06, IITRCS07, and IITRCS11 were identified as K. pneumoniae (KU726953), S. enter-ica (KU726954), E. aerogenes (KU726955), E. cloaceae (KU726957), respectively. These bacterial species belonged to group Gammaproteobacteria. Further, the phylogenetic tree was showed the interrelationship of bacterial species with the most closely related genera inferred from sequences of the 16S rRNA gene as shown in Supplementary Fig. S2.
Physico‑chemical analysis
The physico-chemical characteristics of untreated SGA-MRPs showed dark brown in color at pH 6.9. In addition, the concentration of BOD (8641), COD (11,586), TDS (1050.77), VS (457.83), and phenolics (110.56 mg L−1) were found higher as shown in Table 1. In contrast to above, the bacterial treated SGA-MRPs showed reduction
World Journal of Microbiology and Biotechnology (2018) 34:32
1 3
32 Page 6 of 18
in all physico-chemical parameters as shown in Table 1. The colour of SGA-MRPs is dark brown which turned light brown after bacteria treatment. Initially, during degrada-tion of SGA-MRPs the pH of medium was decreased to 4.1, but after 192 h of bacterial growth the pH was gradu-ally enhanced. However, a sharp reduction in BOD (2568), COD (4201), TDS (687.92), VS (113.41) and phenolics (55.77 mg L−1) was noted as shown in Table 1. All the physico-chemical parameters of treated SGA-MRPs were found significantly higher (p < 0.001) that the untreated SGA-MRPs except for pH (p < 0.05).
Effect of different carbon and nitrogen sources
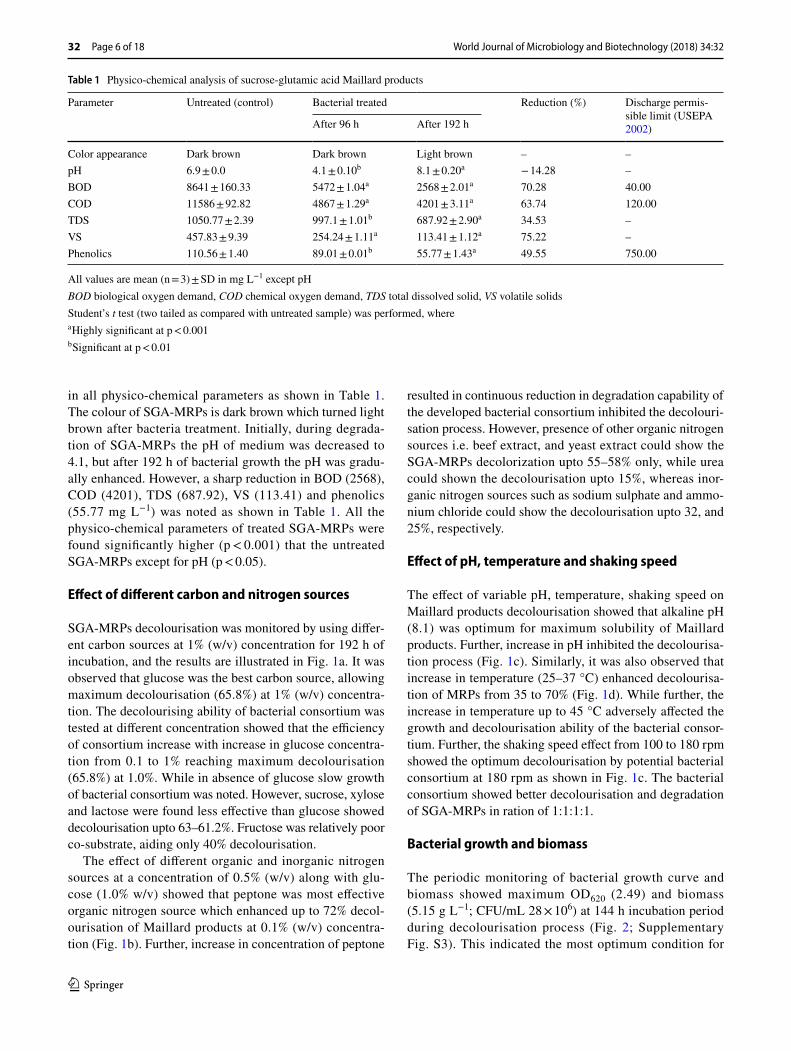
SGA-MRPs decolourisation was monitored by using differ-ent carbon sources at 1% (w/v) concentration for 192 h of incubation, and the results are illustrated in Fig. 1a. It was observed that glucose was the best carbon source, allowing maximum decolourisation (65.8%) at 1% (w/v) concentra-tion. The decolourising ability of bacterial consortium was tested at different concentration showed that the efficiency of consortium increase with increase in glucose concentra-tion from 0.1 to 1% reaching maximum decolourisation (65.8%) at 1.0%. While in absence of glucose slow growth of bacterial consortium was noted. However, sucrose, xylose and lactose were found less effective than glucose showed decolourisation upto 63–61.2%. Fructose was relatively poor co-substrate, aiding only 40% decolourisation.
The effect of different organic and inorganic nitrogen sources at a concentration of 0.5% (w/v) along with glu-cose (1.0% w/v) showed that peptone was most effective organic nitrogen source which enhanced up to 72% decol-ourisation of Maillard products at 0.1% (w/v) concentra-tion (Fig. 1b). Further, increase in concentration of peptone
resulted in continuous reduction in degradation capability of the developed bacterial consortium inhibited the decolouri-sation process. However, presence of other organic nitrogen sources i.e. beef extract, and yeast extract could show the SGA-MRPs decolorization upto 55–58% only, while urea could shown the decolourisation upto 15%, whereas inor-ganic nitrogen sources such as sodium sulphate and ammo-nium chloride could show the decolourisation upto 32, and 25%, respectively.
Effect of pH, temperature and shaking speed
The effect of variable pH, temperature, shaking speed on Maillard products decolourisation showed that alkaline pH (8.1) was optimum for maximum solubility of Maillard products. Further, increase in pH inhibited the decolourisa-tion process (Fig. 1c). Similarly, it was also observed that increase in temperature (25–37 °C) enhanced decolourisa-tion of MRPs from 35 to 70% (Fig. 1d). While further, the increase in temperature up to 45 °C adversely affected the growth and decolourisation ability of the bacterial consor-tium. Further, the shaking speed effect from 100 to 180 rpm showed the optimum decolourisation by potential bacterial consortium at 180 rpm as shown in Fig. 1c. The bacterial consortium showed better decolourisation and degradation of SGA-MRPs in ration of 1:1:1:1.
Bacterial growth and biomass
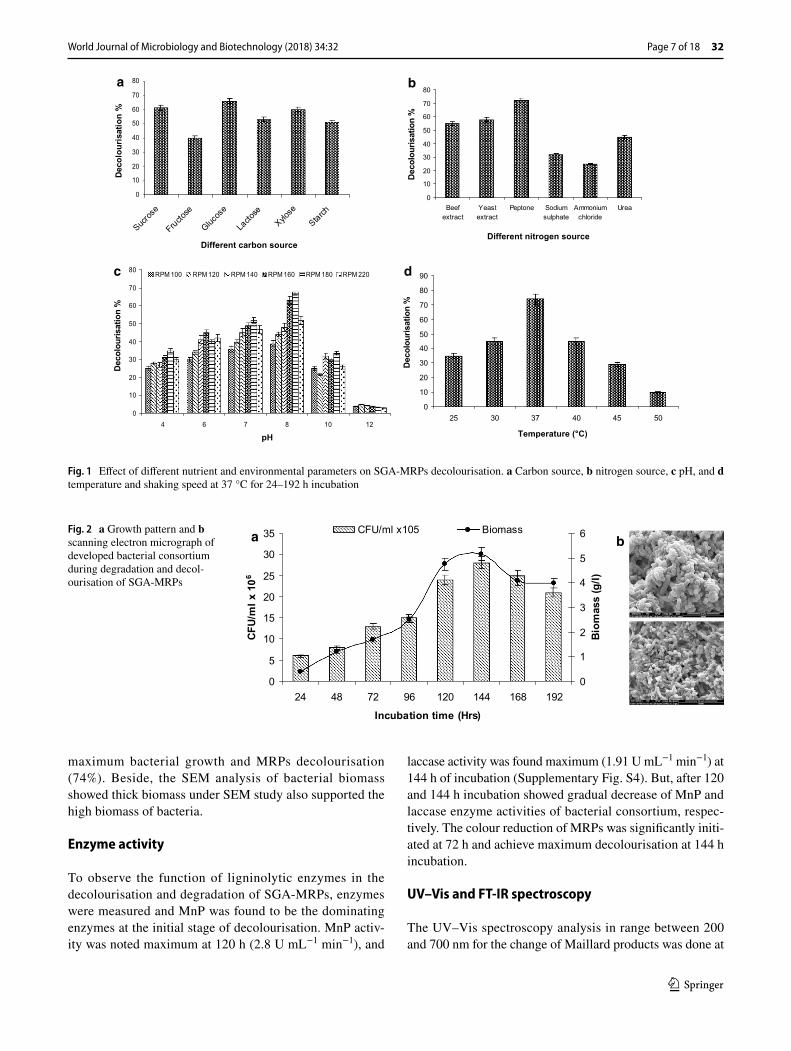
The periodic monitoring of bacterial growth curve and biomass showed maximum OD620 (2.49) and biomass (5.15 g L−1; CFU/mL 28 × 106) at 144 h incubation period during decolourisation process (Fig. 2; Supplementary Fig. S3). This indicated the most optimum condition for
Table 1 Physico-chemical analysis of sucrose-glutamic acid Maillard products
All values are mean (n = 3) ± SD in mg L−1 except pHBOD biological oxygen demand, COD chemical oxygen demand, TDS total dissolved solid, VS volatile solidsStudent’s t test (two tailed as compared with untreated sample) was performed, wherea Highly significant at p < 0.001b Significant at p < 0.01
Parameter Untreated (control) Bacterial treated Reduction (%) Discharge permis-sible limit (USEPA 2002)After 96 h After 192 h
Color appearance Dark brown Dark brown Light brown – –pH 6.9 ± 0.0 4.1 ± 0.10b 8.1 ± 0.20a − 14.28 –BOD 8641 ± 160.33 5472 ± 1.04a 2568 ± 2.01a 70.28 40.00COD 11586 ± 92.82 4867 ± 1.29a 4201 ± 3.11a 63.74 120.00TDS 1050.77 ± 2.39 997.1 ± 1.01b 687.92 ± 2.90a 34.53 –VS 457.83 ± 9.39 254.24 ± 1.11a 113.41 ± 1.12a 75.22 –Phenolics 110.56 ± 1.40 89.01 ± 0.01b 55.77 ± 1.43a 49.55 750.00
World Journal of Microbiology and Biotechnology (2018) 34:32
1 3
Page 7 of 18 32
maximum bacterial growth and MRPs decolourisation (74%). Beside, the SEM analysis of bacterial biomass showed thick biomass under SEM study also supported the high biomass of bacteria.
Enzyme activity
To observe the function of ligninolytic enzymes in the decolourisation and degradation of SGA-MRPs, enzymes were measured and MnP was found to be the dominating enzymes at the initial stage of decolourisation. MnP activ-ity was noted maximum at 120 h (2.8 U mL−1 min−1), and
laccase activity was found maximum (1.91 U mL−1 min−1) at 144 h of incubation (Supplementary Fig. S4). But, after 120 and 144 h incubation showed gradual decrease of MnP and laccase enzyme activities of bacterial consortium, respec-tively. The colour reduction of MRPs was significantly initi-ated at 72 h and achieve maximum decolourisation at 144 h incubation.
UV–Vis and FT‑IR spectroscopy
The UV–Vis spectroscopy analysis in range between 200 and 700 nm for the change of Maillard products was done at
0
10
20
30
40
50
60
70
80
Beefextract
Yeastextract
Peptone Sodiumsulphate
Ammoniumchloride
Urea
Different nitrogen source
Dec
olou
risat
ion
%
0
10
20
30
40
50
60
70
80
Sucros
e
Fructose
Glucos
e
Lacto
seXylo
se
Starch
Different carbon source
Deco
lour
isat
ion
%
0
10
20
30
40
50
60
70
80
4 6 7 8 10 12
pH
Dec
olou
risat
ion
%
RPM 100 RPM 120 RPM 140 RPM 160 RPM 180 RPM 220 dc
a b
0
10
20
30
40
50
60
70
80
90
25 30 37 40 45 50
Temperature (°C)
Dec
olou
risat
ion
%
Fig. 1 Effect of different nutrient and environmental parameters on SGA-MRPs decolourisation. a Carbon source, b nitrogen source, c pH, and d temperature and shaking speed at 37 °C for 24–192 h incubation
Fig. 2 a Growth pattern and b scanning electron micrograph of developed bacterial consortium during degradation and decol-ourisation of SGA-MRPs
0
5
10
15
20
25
30
35
24 48 72 96 120 144 168 192
Incubation time (Hrs)
CFU/
ml x
106
0
1
2
3
4
5
6
Biom
ass
(g/l)
CFU/ml x105 Biomassa b
World Journal of Microbiology and Biotechnology (2018) 34:32
1 3
32 Page 8 of 18
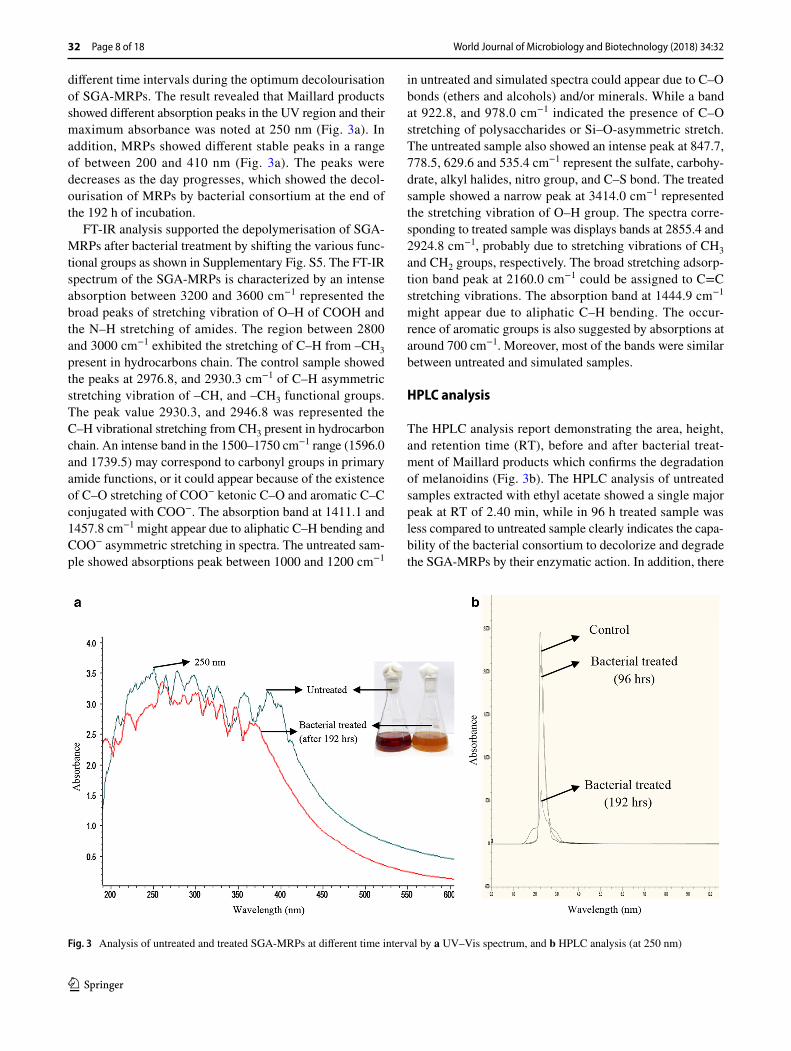
different time intervals during the optimum decolourisation of SGA-MRPs. The result revealed that Maillard products showed different absorption peaks in the UV region and their maximum absorbance was noted at 250 nm (Fig. 3a). In addition, MRPs showed different stable peaks in a range of between 200 and 410 nm (Fig. 3a). The peaks were decreases as the day progresses, which showed the decol-ourisation of MRPs by bacterial consortium at the end of the 192 h of incubation.
FT-IR analysis supported the depolymerisation of SGA-MRPs after bacterial treatment by shifting the various func-tional groups as shown in Supplementary Fig. S5. The FT-IR spectrum of the SGA-MRPs is characterized by an intense absorption between 3200 and 3600 cm−1 represented the broad peaks of stretching vibration of O–H of COOH and the N–H stretching of amides. The region between 2800 and 3000 cm−1 exhibited the stretching of C–H from –CH3 present in hydrocarbons chain. The control sample showed the peaks at 2976.8, and 2930.3 cm−1 of C–H asymmetric stretching vibration of –CH, and –CH3 functional groups. The peak value 2930.3, and 2946.8 was represented the C–H vibrational stretching from CH3 present in hydrocarbon chain. An intense band in the 1500–1750 cm−1 range (1596.0 and 1739.5) may correspond to carbonyl groups in primary amide functions, or it could appear because of the existence of C–O stretching of COO− ketonic C–O and aromatic C–C conjugated with COO−. The absorption band at 1411.1 and 1457.8 cm−1 might appear due to aliphatic C–H bending and COO− asymmetric stretching in spectra. The untreated sam-ple showed absorptions peak between 1000 and 1200 cm−1
in untreated and simulated spectra could appear due to C–O bonds (ethers and alcohols) and/or minerals. While a band at 922.8, and 978.0 cm−1 indicated the presence of C–O stretching of polysaccharides or Si–O-asymmetric stretch. The untreated sample also showed an intense peak at 847.7, 778.5, 629.6 and 535.4 cm−1 represent the sulfate, carbohy-drate, alkyl halides, nitro group, and C–S bond. The treated sample showed a narrow peak at 3414.0 cm−1 represented the stretching vibration of O–H group. The spectra corre-sponding to treated sample was displays bands at 2855.4 and 2924.8 cm−1, probably due to stretching vibrations of CH3 and CH2 groups, respectively. The broad stretching adsorp-tion band peak at 2160.0 cm−1 could be assigned to C=C stretching vibrations. The absorption band at 1444.9 cm−1 might appear due to aliphatic C–H bending. The occur-rence of aromatic groups is also suggested by absorptions at around 700 cm−1. Moreover, most of the bands were similar between untreated and simulated samples.
HPLC analysis
The HPLC analysis report demonstrating the area, height, and retention time (RT), before and after bacterial treat-ment of Maillard products which confirms the degradation of melanoidins (Fig. 3b). The HPLC analysis of untreated samples extracted with ethyl acetate showed a single major peak at RT of 2.40 min, while in 96 h treated sample was less compared to untreated sample clearly indicates the capa-bility of the bacterial consortium to decolorize and degrade the SGA-MRPs by their enzymatic action. In addition, there
Fig. 3 Analysis of untreated and treated SGA-MRPs at different time interval by a UV–Vis spectrum, and b HPLC analysis (at 250 nm)
World Journal of Microbiology and Biotechnology (2018) 34:32
1 3
Page 9 of 18 32
were some extra peaks appeared in bacterial treated sample suggesting the formation of several new metabolites. Fur-ther, after 192 h treatment of SGA-MRPs, the HPLC chro-matogram also showed shifting of peak, decrease in peak area height, and generation of some new peaks compared to untreated sample. This suggested the biotransformation and biodegradation of SGA-MRPs in various metabolites by developed bacterial consortium.
Identification of organic pollutants and their metabolites
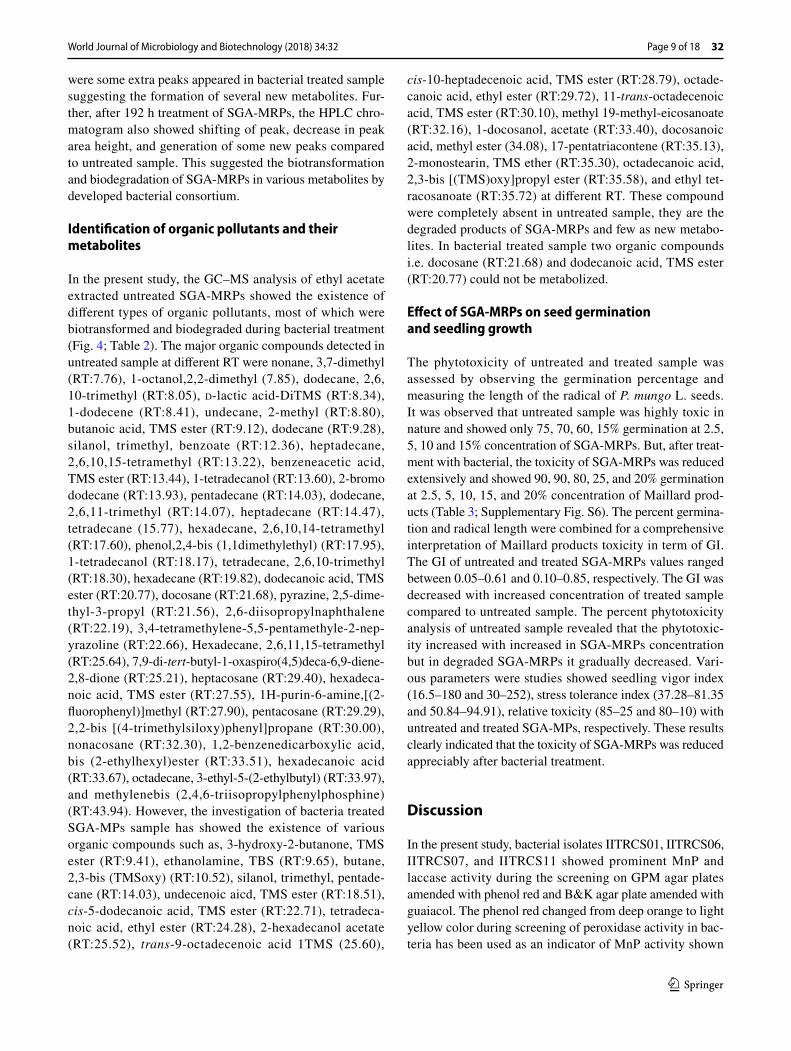
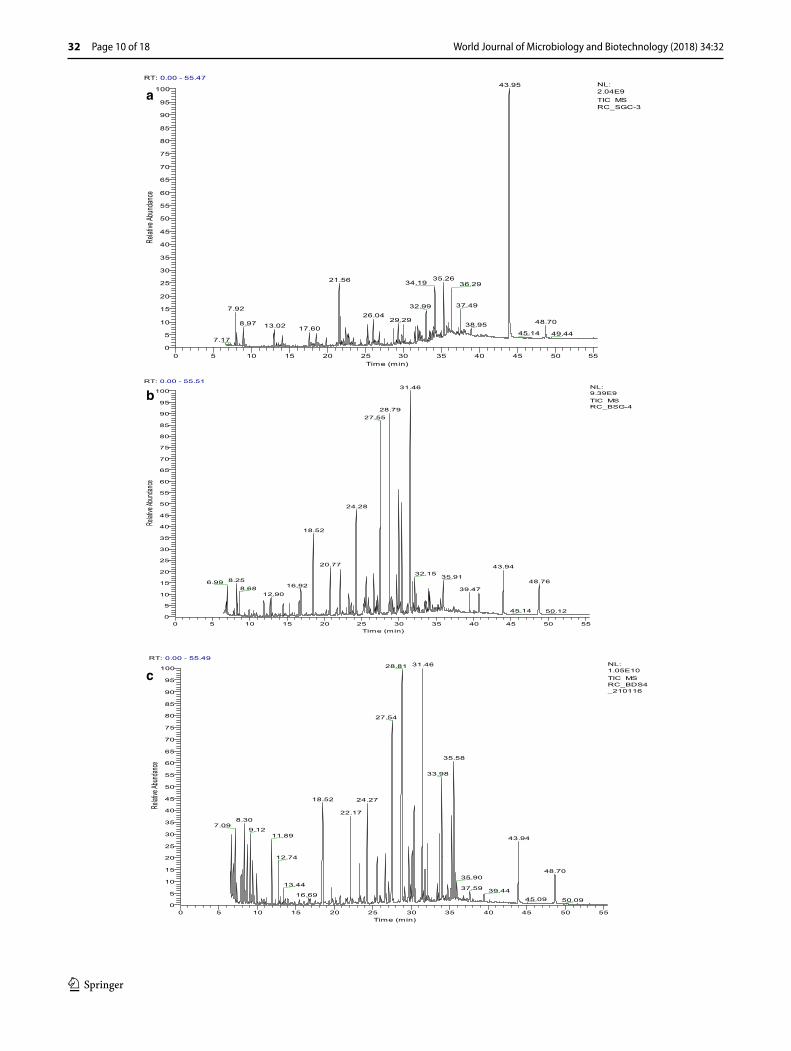
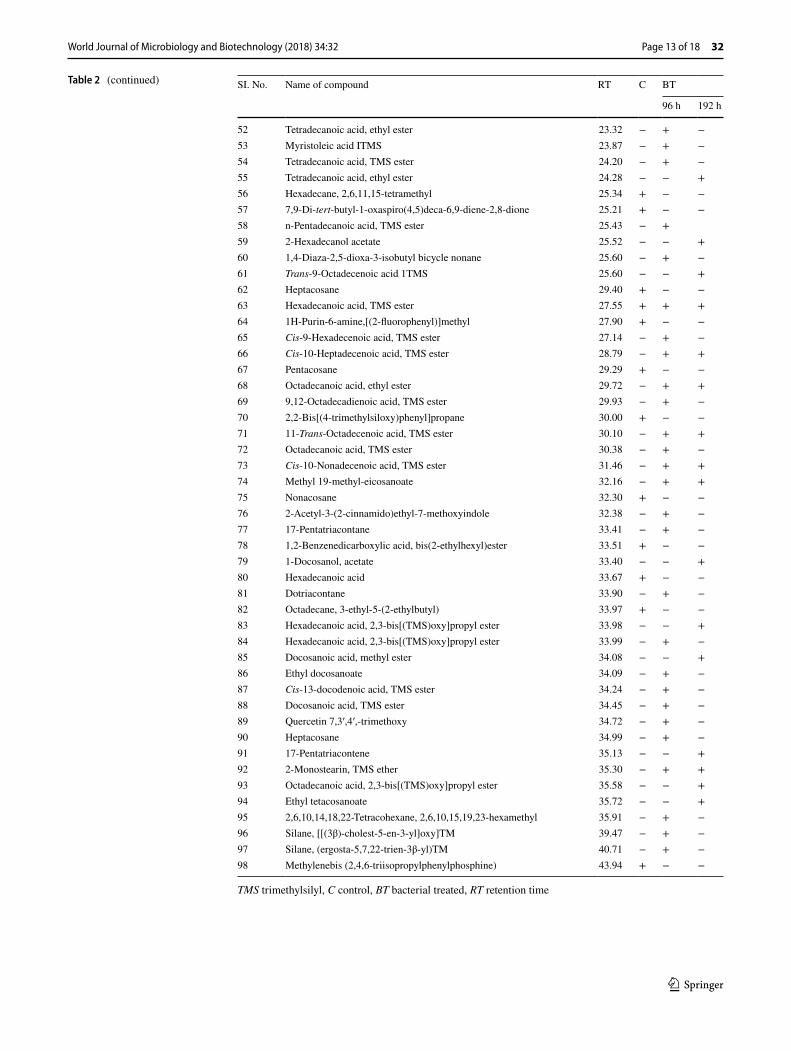
In the present study, the GC–MS analysis of ethyl acetate extracted untreated SGA-MRPs showed the existence of different types of organic pollutants, most of which were biotransformed and biodegraded during bacterial treatment (Fig. 4; Table 2). The major organic compounds detected in untreated sample at different RT were nonane, 3,7-dimethyl (RT:7.76), 1-octanol,2,2-dimethyl (7.85), dodecane, 2,6, 10-trimethyl (RT:8.05), d-lactic acid-DiTMS (RT:8.34), 1-dodecene (RT:8.41), undecane, 2-methyl (RT:8.80), butanoic acid, TMS ester (RT:9.12), dodecane (RT:9.28), silanol, trimethyl, benzoate (RT:12.36), heptadecane, 2,6,10,15-tetramethyl (RT:13.22), benzeneacetic acid, TMS ester (RT:13.44), 1-tetradecanol (RT:13.60), 2-bromo dodecane (RT:13.93), pentadecane (RT:14.03), dodecane, 2,6,11-trimethyl (RT:14.07), heptadecane (RT:14.47), tetradecane (15.77), hexadecane, 2,6,10,14-tetramethyl (RT:17.60), phenol,2,4-bis (1,1dimethylethyl) (RT:17.95), 1-tetradecanol (RT:18.17), tetradecane, 2,6,10-trimethyl (RT:18.30), hexadecane (RT:19.82), dodecanoic acid, TMS ester (RT:20.77), docosane (RT:21.68), pyrazine, 2,5-dime-thyl-3-propyl (RT:21.56), 2,6-diisopropylnaphthalene (RT:22.19), 3,4-tetramethylene-5,5-pentamethyle-2-nep-yrazoline (RT:22.66), Hexadecane, 2,6,11,15-tetramethyl (RT:25.64), 7,9-di-tert-butyl-1-oxaspiro(4,5)deca-6,9-diene-2,8-dione (RT:25.21), heptacosane (RT:29.40), hexadeca-noic acid, TMS ester (RT:27.55), 1H-purin-6-amine,[(2-fluorophenyl)]methyl (RT:27.90), pentacosane (RT:29.29), 2,2-bis [(4-trimethylsiloxy)phenyl]propane (RT:30.00), nonacosane (RT:32.30), 1,2-benzenedicarboxylic acid, bis (2-ethylhexyl)ester (RT:33.51), hexadecanoic acid (RT:33.67), octadecane, 3-ethyl-5-(2-ethylbutyl) (RT:33.97), and methylenebis (2,4,6-triisopropylphenylphosphine) (RT:43.94). However, the investigation of bacteria treated SGA-MPs sample has showed the existence of various organic compounds such as, 3-hydroxy-2-butanone, TMS ester (RT:9.41), ethanolamine, TBS (RT:9.65), butane, 2,3-bis (TMSoxy) (RT:10.52), silanol, trimethyl, pentade-cane (RT:14.03), undecenoic aicd, TMS ester (RT:18.51), cis-5-dodecanoic acid, TMS ester (RT:22.71), tetradeca-noic acid, ethyl ester (RT:24.28), 2-hexadecanol acetate (RT:25.52), trans-9-octadecenoic acid 1TMS (25.60),
cis-10-heptadecenoic acid, TMS ester (RT:28.79), octade-canoic acid, ethyl ester (RT:29.72), 11-trans-octadecenoic acid, TMS ester (RT:30.10), methyl 19-methyl-eicosanoate (RT:32.16), 1-docosanol, acetate (RT:33.40), docosanoic acid, methyl ester (34.08), 17-pentatriacontene (RT:35.13), 2-monostearin, TMS ether (RT:35.30), octadecanoic acid, 2,3-bis [(TMS)oxy]propyl ester (RT:35.58), and ethyl tet-racosanoate (RT:35.72) at different RT. These compound were completely absent in untreated sample, they are the degraded products of SGA-MRPs and few as new metabo-lites. In bacterial treated sample two organic compounds i.e. docosane (RT:21.68) and dodecanoic acid, TMS ester (RT:20.77) could not be metabolized.
Effect of SGA‑MRPs on seed germination and seedling growth
The phytotoxicity of untreated and treated sample was assessed by observing the germination percentage and measuring the length of the radical of P. mungo L. seeds. It was observed that untreated sample was highly toxic in nature and showed only 75, 70, 60, 15% germination at 2.5, 5, 10 and 15% concentration of SGA-MRPs. But, after treat-ment with bacterial, the toxicity of SGA-MRPs was reduced extensively and showed 90, 90, 80, 25, and 20% germination at 2.5, 5, 10, 15, and 20% concentration of Maillard prod-ucts (Table 3; Supplementary Fig. S6). The percent germina-tion and radical length were combined for a comprehensive interpretation of Maillard products toxicity in term of GI. The GI of untreated and treated SGA-MRPs values ranged between 0.05–0.61 and 0.10–0.85, respectively. The GI was decreased with increased concentration of treated sample compared to untreated sample. The percent phytotoxicity analysis of untreated sample revealed that the phytotoxic-ity increased with increased in SGA-MRPs concentration but in degraded SGA-MRPs it gradually decreased. Vari-ous parameters were studies showed seedling vigor index (16.5–180 and 30–252), stress tolerance index (37.28–81.35 and 50.84–94.91), relative toxicity (85–25 and 80–10) with untreated and treated SGA-MPs, respectively. These results clearly indicated that the toxicity of SGA-MRPs was reduced appreciably after bacterial treatment.
Discussion
In the present study, bacterial isolates IITRCS01, IITRCS06, IITRCS07, and IITRCS11 showed prominent MnP and laccase activity during the screening on GPM agar plates amended with phenol red and B&K agar plate amended with guaiacol. The phenol red changed from deep orange to light yellow color during screening of peroxidase activity in bac-teria has been used as an indicator of MnP activity shown
World Journal of Microbiology and Biotechnology (2018) 34:32
1 3
32 Page 10 of 18
RT: 0.00 - 55.51
0 5 10 15 20 25 30 35 40 45 50 55Time (min)
0
5
10
15
20
25
30
35
40
45
50
55
60
65
70
75
80
85
90
95
100
Relati
ve Ab
unda
nce
31.46
28.7927.55
24.28
18.52
20.77 43.9432.15
35.918.25 48.766.99
16.928.68 39.4712.90
45.14 50.12
NL:9.39E9TIC MS RC_BSG-4
RT: 0.00 - 55.49
0 5 10 15 20 25 30 35 40 45 50 55Time (min)
0
5
10
15
20
25
30
35
40
45
50
55
60
65
70
75
80
85
90
95
100
Relati
ve Ab
unda
nce
31.4628.81
27.54
35.58
33.98
18.52 24.27
22.178.30
7.099.12
11.89 43.94
12.74
48.7035.90
13.4437.59 39.44
16.6945.09 50.09
NL:1.05E10TIC MS RC_BDS4_210116
RT: 0.00 - 55.47
0 5 10 15 20 25 30 35 40 45 50 55Time (min)
0
5
10
15
20
25
30
35
40
45
50
55
60
65
70
75
80
85
90
95
100
Relat
ive Ab
unda
nce
43.95
35.2621.56 34.19 36.29
37.4932.997.9226.04
29.29 48.708.97 38.9513.02 17.6045.14 49.44
7.17
NL:2.04E9TIC MS RC_SGC-3
a
b
c
World Journal of Microbiology and Biotechnology (2018) 34:32
1 3
Page 11 of 18 32
in Supplementary Fig. S4. This change in colour of phenol red occurred due to oxidation of glucose by sugar oxidase enzyme, resulting in the production of H2O2 and media acidification (i.e. lowering of pH) which is required for the melanoidins degradation (Aoshima et al. 1985; Hwang et al. 2011). The guaiacol is also a chromogenic substrate that is used for quick screening of microbial strains producing lac-cases by means of a color reaction (Okino et al. 2000). The selected four bacterial strains produced the laccase which catalyzed the oxidation of guaiacol to form reddish brown halo zones in the medium (Supplementary Fig. S4). This observation corroborated with earlier finding for screening of MnP and laccase producing bacterial strains by Chandra and Singh (2012).The 16S rRNA genes sequence analysis showed that screened bacterial strain IITRCS01, IITRCS06, IITRCS07, and IITRCS11 were identified as K. pneumo-niae (KU726953), S. enterica (KU726954), E. aerogenes (KU726955), E. cloaceae (KU726957), respectively. This bacterial species belonged to group Gammaproteobacteria. The class Gammaproteobacteria constitutes a very large and diverse group of bacteria that exhibits enormous vari-ety in terms of their phenotype and metabolic capabilities (Woese et al. 1985; Brenner et al. 2005; Kersters et al. 2006). Members of this group exhibit broad ranges of aerobicity, of trophism, including chemoautotrophism and photoauto-trophism, and of temperature adaptation. The class Gam-maproteobacteria also includes enteric bacteria and it is well known for harbouring large numbers of human, animal and plant pathogens (Brenner et al. 2005; Kersters et al. 2006). Although, Gammaproteobacteria has only the taxonomic rank of class within the phylum Proteobacteria.
Since, MR is a complex series of chemical reaction that occurs between the carbonyl groups of reducing sugars and the amino groups of amino acids, peptides or proteins (Echavarría et al. 2013a, b). The MRPs are a particularly complex mixture of various organic compounds of differ-ent molecular weights. They include not only aldehydes, ketones, dicarbonyls, acryl amides, and heterocyclic amines, but also melanoidins, which are polymeric products formed at the advanced steps of MR (Wang et al. 2011). In this study, we have selected sucrose, glutamic acid, and sodium carbonate for the synthesis of MRPs due to presence of sucrose and glutamic acid abundantly present in sugarcane juice, which are highly reactive in the MR at elevated tem-perature, sucrose invariably hydrolyses first to the reduc-ing thermolabile hexose sugar, glucose and fructose, which enter into the initiation pathway of MR (Walford 1996; Nolasco Junior and De Massaguer 2006). The alkaline pH (8.0) favour the MR, because at alkaline pH sugar thermal
degradation rate increased which leads formation of colour. Therefore, color formation under alkaline condition is result of sucrose degradation into reducing sugar at initial stage (Eggleston and Vercellotti 2000). In addition, the used of sodium carbonate also favour the reaction of MRPs forma-tion during the decomposition of sugar. Further, the phys-ico-chemical characteristics of untreated MRPs showed dark brown in color at high BOD, COD, TDS, VS, and phenolics at pH 6.9. Thus, the high BOD and COD values of the MRPs solution are due to lack of oxygen molecule in MRPs dur-ing the synthesis of MRPs after dehydration process. Since, some caramelized sugar may be also generated during the MRPs synthesis. Therefore, high TDS of solution is found in this study. However, in contrary to control, the bacterial degraded sample showed reduction of BOD, COD, TDS, VS and phenolics values. This indicated the degradation of MRPs by inoculated bacterial consortium due to presence of ligninolytic enzyme activities. Consequently, the reduction in colour was noted due to depolymerisation of melanoi-dins as reported earlier (Verman et al. 1974). At the initial stage of bacterial incubation during the decolourisation pro-cess the pH of medium was noted 4.1. This might be due to generation of some organic acids with bacterial reaction in medium composition (Davídek et al. 2006). But, it gradu-ally moves towards alkaline condition (pH 8.1) after 192 h of bacterial incubation. The increased pH of media might be due to depolymerisation of MRPs by enzyme activity of bacterial consortium. This induced the solubility and uti-lisation of melanoidins which favoured the mineralisation and co-metabolism of MRPs (Bharagava et al. 2009). These results also corroborated to the previous findings regard-ing the degradation of natural and synthetic melanoidins (Bharagava et al. 2009; Kumar and Chandra 2006; Yadav and Chandra 2012).
A potential consortium was developed from selected strains of bacteria for decolourisation of MRPs. It has been reported glucose is an essential carbon source for melanoi-dins decolourisation (Kumar and Chandra 2006). In our investigation, the potential bacterial consortium showed maximum decolourisation (65.8%) at 1.0% concentration of glucose. While in absence of glucose the slow growth of bacterial consortium was noted. This revealed that the carbon source present in MRPs is not readily being utilised by bacterial consortium. But, the supplementation of glu-cose in media was readily available for bacterial growth. This indicated strong evidence that incubated bacterial con-sortium is not able to utilise the SGA-MRPs for its growth and metabolism. Similar observation has also been reported by previous worker in case of anaerobically treated distill-ery spent wash (Ghosh et al. 2004). This indicated that our bacterial consortium was more effective for decolourisation and degradation of MRPs. This might be due to induction of hight amount of ligninolytic enzyme which facilitated
Fig. 4 GC–MS chromatogram of organic compounds extracted with ethyl acetate from SGA-MRPs. a Control, b bacterial degraded after 96 h incubation, and c bacterial degraded after 192 h incubation
◂
World Journal of Microbiology and Biotechnology (2018) 34:32
1 3
32 Page 12 of 18
Table 2 Organic compounds identified by GC–MS analysis extracted with ethyl acetate from untreated (control) and bacterial treated SGA-MRPs
SI. No. Name of compound RT C BT
96 h 192 h
1 Nonane, 3,7-dimethyl 7.76 + − −2 Butane, 2,3-bis(trimethylsiloxy) 7.82 − + −3 1-Octanol,2,2-dimethyl 7.85 + − −4 3,6-Dioxa-2,7-disilaoctane,2,2,4,5,7,7-hexamethyl 8.00 − + −5 Dodecane, 2,6, 10-trimethyl 8.05 + − −6 d-Lactic acid-DiTMS 8.34 + − −7 1-Dodecene 8.41 + − −8 Piperidine, 1,4-dimethyl 8.68 − + −9 Undecane, 2-methyl 8.80 + − −10 Butanoic acid, TMS ester 9.12 + − −11 Dodecane 9.28 + + −12 3-Hydroxy-2-butanone. TMS ester 9.41 − − +13 Ethanolamine, TBS 9.65 − − +14 Silane, trimethyl(4-methylphenoxy) 10.31 − + −15 Butane, 2,3-bis(TMSoxy) 10.52 − − +16 α-d-Mannopyranoside, methyl, cyclic 2,3:4,6-bis(butyloboronate) 10.53 − + −17 2-Hexenoic acid, 5-(1-ethoxyethoxy), 2-(TMS)ethyl ester 10.57 − + −18 Silanol, trimethyl, benzoate 12.36 + − −19 Octanoic acid, TMS ester 12.75 − + −20 Silanol, trimethyl-phosphate 12.90 + − −21 Heptadecane, 2,6,10,15-tetramethyl 13.22 + − −22 Benzeneacetic acid, TMS ester 13.44 + − −23 1-Tetradecanol 13.60 + − −24 Butanedioic acid, bis(TMS)ester 13.82 − + −25 2-Bromo dodecane 13.93 + − −26 Pentadecane 14.03 + − +27 Dodecane, 2,6,11-trimethyl 14.07 + − −28 Vanillin, tert-butyldimethylsilyl ether 14.45 − + −29 Heptadecane 14.47 + − −30 4-Methoxy-α-(TMS)benzenemethanol 14.51 − + −31 Nonanoic acid, TMS ester 14.85 − + −32 1H-Purine-2,6-dione, 3,7-dihydro-1,3-dimethyl-7-(TMS) 15.34 − + −33 Tetradecane 15.77 + − −34 Decanoic acid, TMS ester 16.92 − + −35 Hexadecane, 2,6,10,14-tetramethyl 17.60 + − −36 2-(2-(2-Butoxyethoxy)ethoxy)ethoxy-trimethylsilane 17.84 + − −37 Phenol,2,4-bis(1,1dimethylethyl) 17.95 + − −38 1-Tetradecanol 18.17 + − −39 Tetradecane, 2,6,10-trimethyl 18.30 + − −40 Undecenoic aicd, TMS ester 18.51 − − +41 Undecenoic acid, TMS ester 18.52 − + −42 Hexadecane 19.82 + − −43 Dodecanoic acid, TMS ester 20.77 + + +44 Pumiliotoxin 20.52 − + −45 Docosane 21.68 + + +46 Pyrazine, 2,5-dimethyl-3-propyl 21.56 + − −47 Glucopyranose-1,2,3,5-Di-methylboronate-TMS 22.11 − + −48 2,6-Diisopropylnaphthalene 22.19 + − −49 3,4-Tetramethylene-5,5-pentamethyle-2-nepyrazoline 22.66 + − −50 Cis-5-Dodecanoic acid, TMS ester 22.71 − + +51 Leucine 22.82 + − −
World Journal of Microbiology and Biotechnology (2018) 34:32
1 3
Page 13 of 18 32
Table 2 (continued) SI. No. Name of compound RT C BT
96 h 192 h
52 Tetradecanoic acid, ethyl ester 23.32 − + −53 Myristoleic acid ITMS 23.87 − + −54 Tetradecanoic acid, TMS ester 24.20 − + −55 Tetradecanoic acid, ethyl ester 24.28 − − +56 Hexadecane, 2,6,11,15-tetramethyl 25.34 + − −57 7,9-Di-tert-butyl-1-oxaspiro(4,5)deca-6,9-diene-2,8-dione 25.21 + − −58 n-Pentadecanoic acid, TMS ester 25.43 − +59 2-Hexadecanol acetate 25.52 − − +60 1,4-Diaza-2,5-dioxa-3-isobutyl bicycle nonane 25.60 − + −61 Trans-9-Octadecenoic acid 1TMS 25.60 − − +62 Heptacosane 29.40 + − −63 Hexadecanoic acid, TMS ester 27.55 + + +64 1H-Purin-6-amine,[(2-fluorophenyl)]methyl 27.90 + − −65 Cis-9-Hexadecenoic acid, TMS ester 27.14 − + −66 Cis-10-Heptadecenoic acid, TMS ester 28.79 − + +67 Pentacosane 29.29 + − −68 Octadecanoic acid, ethyl ester 29.72 − + +69 9,12-Octadecadienoic acid, TMS ester 29.93 − + −70 2,2-Bis[(4-trimethylsiloxy)phenyl]propane 30.00 + − −71 11-Trans-Octadecenoic acid, TMS ester 30.10 − + +72 Octadecanoic acid, TMS ester 30.38 − + −73 Cis-10-Nonadecenoic acid, TMS ester 31.46 − + +74 Methyl 19-methyl-eicosanoate 32.16 − + +75 Nonacosane 32.30 + − −76 2-Acetyl-3-(2-cinnamido)ethyl-7-methoxyindole 32.38 − + −77 17-Pentatriacontane 33.41 − + −78 1,2-Benzenedicarboxylic acid, bis(2-ethylhexyl)ester 33.51 + − −79 1-Docosanol, acetate 33.40 − − +80 Hexadecanoic acid 33.67 + − −81 Dotriacontane 33.90 − + −82 Octadecane, 3-ethyl-5-(2-ethylbutyl) 33.97 + − −83 Hexadecanoic acid, 2,3-bis[(TMS)oxy]propyl ester 33.98 − − +84 Hexadecanoic acid, 2,3-bis[(TMS)oxy]propyl ester 33.99 − + −85 Docosanoic acid, methyl ester 34.08 − − +86 Ethyl docosanoate 34.09 − + −87 Cis-13-docodenoic acid, TMS ester 34.24 − + −88 Docosanoic acid, TMS ester 34.45 − + −89 Quercetin 7,3′,4′,-trimethoxy 34.72 − + −90 Heptacosane 34.99 − + −91 17-Pentatriacontene 35.13 − − +92 2-Monostearin, TMS ether 35.30 − + +93 Octadecanoic acid, 2,3-bis[(TMS)oxy]propyl ester 35.58 − − +94 Ethyl tetacosanoate 35.72 − − +95 2,6,10,14,18,22-Tetracohexane, 2,6,10,15,19,23-hexamethyl 35.91 − + −96 Silane, [[(3β)-cholest-5-en-3-yl]oxy]TM 39.47 − + −97 Silane, (ergosta-5,7,22-trien-3β-yl)TM 40.71 − + −98 Methylenebis (2,4,6-triisopropylphenylphosphine) 43.94 + − −
TMS trimethylsilyl, C control, BT bacterial treated, RT retention time
World Journal of Microbiology and Biotechnology (2018) 34:32
1 3
32 Page 14 of 18
for the decolourisation processes (Kumar and Chandra 2006). Simultaneously, the effect of various concentration of organic (peptone, beef extract, yeast extract, and urea) and inorganic nitrogen (sodium sulphate and ammonium chlo-ride) sources on MRPs decolourisation was investigated, but peptone was found most effective organic nitrogen source which showed decolourisation upto 72% at 0.1% (w/v) con-centration. Because, peptone are rich in free amino acids and short peptides, which support cell growth with a low consumption rate of the carbon source and minimize the accumulation of by-products (Lau et al. 2004). Moreover, presence of other sources of organic nitrogen could show the decolorization upto 55–58% only, whereas inorganic nitrogen could show the decolourisation upto 15–32%. Thus, this finding showed the inhibitory effect of sodium sulphate and ammonium chloride on bacterial growth. Similar, effect has also been reported by previous workers for melanoi-dins decolourisation (Tiwari et al. 2012, 2013; Yadav and Chandra 2012; Sirianuntapiboon et al. 2004). Hence, the developed bacterial consortium utilised tiny amount of pep-tone for higher decolourisation, BOD, and COD reduction compared to other researchers ever reported.
The variation in SGA-MRPs decolourisation process was directly affected with change in pH and temperature of cul-ture conditions. The optimum SGA-MRPs decolourisation (72%) was noted at pH 8.1 by developed bacterial consor-tium after 192 h of incubation. Further, increase or decrease in pH inhibited the decolourisation process. This might be due to inhibition of the enzyme activity. For developed aer-obic bacterial consortium comprising Bacillus sp., Bacil-lus licheniformis, and Alcaligenes sp. was showed highest decolourisation activity at pH 7.0 (Bharagava and Chandra 2010). In another study, the optimum pH for melanoidins
decolourisation by bacterial strains Alcaligenes faecalis SAG5 was note at pH 7.5 (Santal et al. 2011). The developed bacterial consortium showed maximum decolourisation (70%) at 37 °C. While further, increase in temperature up to 45 °C adversely affected the growth, metabolism and MRPs decolourisation ability of bacterial consortium. Similar pat-tern is also reported in other studies also (Mohana et al. 2007; Santal et al. 2011). However, the Maillard products were significantly affected by various shaking speed also. It was observed that the optimum decolourisation (70%) by potential bacterial consortium was noted at 180 rpm. How-ever, increase in shaking speed resulted decrease in decol-ourisation process. This might be due to mechanical injury of bacterial cell wall at a higher shaking speed (Tiwari et al. 2014; Yadav and Chandra 2012).
For efficient and potential consortium, different inocu-lums ratio of bacterial strains were also optimized. Con-sortium having 1:1:1:1 inoculums ratio of bacteria showed maximum (74%) decolourisation of MRPs within biomass (5.15 g L−1; CFU mL−1 28 × 106) OD620 (2.49) at 144 h of incubation. Further, incubation did not increase the rate of decolourisation. The direct correlation of OD620 with high bacterial biomass indicated the direct involvement in decol-ourisation and degradation process of MRPs. This indicted high bacterial growth was due to utilisation of MRPs as a carbon source for its growth.
During the maximum decolourisation of MRPs, the MnP activity was noted highest (2.8 U mL−1 min−1) at 120 h of incubation and laccase activity was found highest (1.91 U mL−1 min−1) at 144 h of incubation. The MnP and lac-case have a broad substrate oxidising enzymes reported for detoxification and degradation of phenolic and non-phenolic polymeric compounds (Rodriguez et al. 1999; González
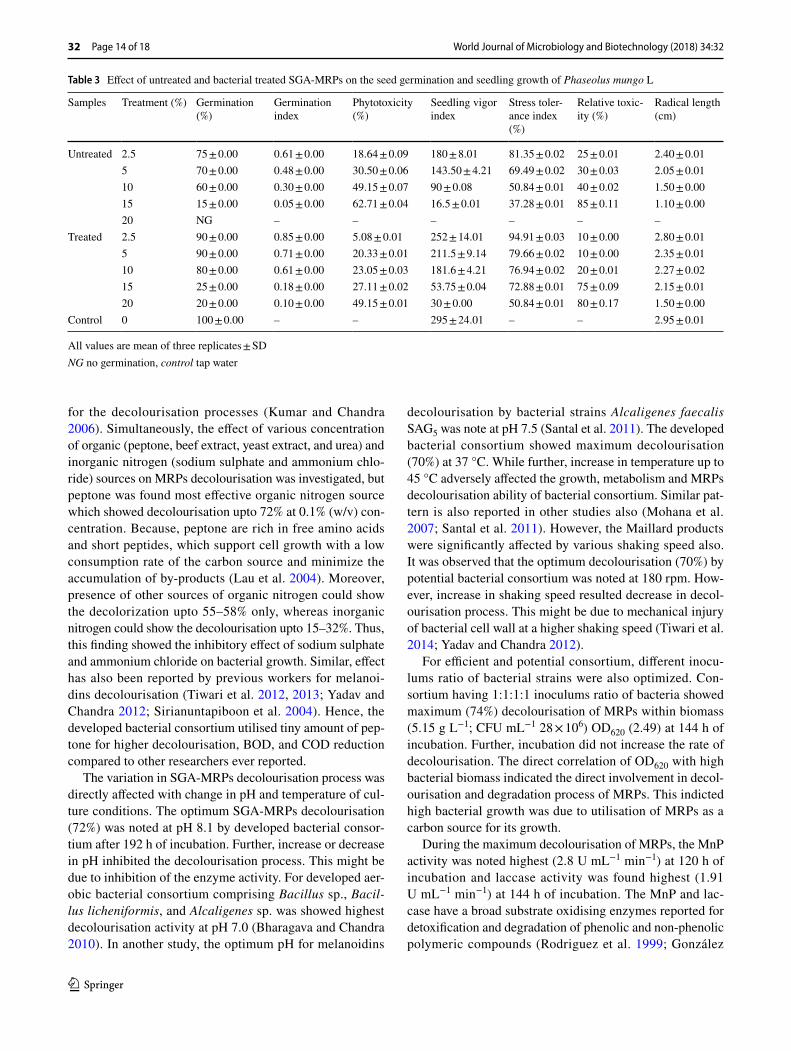
Table 3 Effect of untreated and bacterial treated SGA-MRPs on the seed germination and seedling growth of Phaseolus mungo L
All values are mean of three replicates ± SDNG no germination, control tap water
Samples Treatment (%) Germination (%)
Germination index
Phytotoxicity (%)
Seedling vigor index
Stress toler-ance index (%)
Relative toxic-ity (%)
Radical length (cm)
Untreated 2.5 75 ± 0.00 0.61 ± 0.00 18.64 ± 0.09 180 ± 8.01 81.35 ± 0.02 25 ± 0.01 2.40 ± 0.015 70 ± 0.00 0.48 ± 0.00 30.50 ± 0.06 143.50 ± 4.21 69.49 ± 0.02 30 ± 0.03 2.05 ± 0.0110 60 ± 0.00 0.30 ± 0.00 49.15 ± 0.07 90 ± 0.08 50.84 ± 0.01 40 ± 0.02 1.50 ± 0.0015 15 ± 0.00 0.05 ± 0.00 62.71 ± 0.04 16.5 ± 0.01 37.28 ± 0.01 85 ± 0.11 1.10 ± 0.0020 NG – – – – – –
Treated 2.5 90 ± 0.00 0.85 ± 0.00 5.08 ± 0.01 252 ± 14.01 94.91 ± 0.03 10 ± 0.00 2.80 ± 0.015 90 ± 0.00 0.71 ± 0.00 20.33 ± 0.01 211.5 ± 9.14 79.66 ± 0.02 10 ± 0.00 2.35 ± 0.0110 80 ± 0.00 0.61 ± 0.00 23.05 ± 0.03 181.6 ± 4.21 76.94 ± 0.02 20 ± 0.01 2.27 ± 0.0215 25 ± 0.00 0.18 ± 0.00 27.11 ± 0.02 53.75 ± 0.04 72.88 ± 0.01 75 ± 0.09 2.15 ± 0.0120 20 ± 0.00 0.10 ± 0.00 49.15 ± 0.01 30 ± 0.00 50.84 ± 0.01 80 ± 0.17 1.50 ± 0.00
Control 0 100 ± 0.00 – – 295 ± 24.01 – – 2.95 ± 0.01
World Journal of Microbiology and Biotechnology (2018) 34:32
1 3
Page 15 of 18 32
et al. 2008). The presence of melanoidins and other similar compounds can induce the expression of MnP and laccase protein both are having synergistic action in the degradation and depolymerisation of melanoidins and other industrial pollutants (Miyata et al. 2000; González et al. 2008). In our study, MnP was profusely present at the initial phase of bacterial growth, while laccase was produced in later phase of growth during MRPs degradation. The findings of this study are well supported by earlier results reported by vari-ous workers (Pant and Adholeya 2007, 2009b; Yadav and Chandra 2012).
UV–Vis spectrophotometric analysis is the most com-mon used method of the MR (Martins and Van Boekel 2003; Echavarría et al. 2014). In this study, MRPs showed dif-ferent absorption peaks in a range of between 200 and 410 nm and their maximum absorbance was noted at 250 nm (Fig. 3a). The stable peaks absorbance in UV region indi-cated the presence of several organic compounds formed during the early stages of the MR (Echavarría et al. 2013a, b). While, the absorbance of either 280 nm, 320–350 nm or 420–450 nm corresponding to early MRPs for pyrazine compounds (at 280 nm) (Gu et al. 2010), advanced stage for soluble pre-melanoidins formation (at 320–350 nm) and final MRPs (at 420–450 nm) corresponding to polymerised MRPs in medium (Billaud et al. 2004). On the basis of our findings, it can be stated that the formation of various peaks in UV and visible region indicated the presence of complex mixture of early, advanced and final MRPs. Our findings corroborated with the earlier results reported by Echavarría et al. (2013a, b).
The FT-IR spectrum of the SGA-MRPs is characterized by an intense absorption between 3200 and 3600 cm−1 rep-resented the broad peaks of stretching vibration of OH of COOH and N–H of amides. The peak value 3519.4, 3486.2, 3427.6, 3397.9, 3366.1, and 3333.1 cm−1 was rep-resented the O–H vibrational stretching present in acids, alcohol and phenol (Ramezani et al. 2011). The region between 2800 and 3000 cm−1 exhibited the stretching of C–H from –CH3 present in hydrocarbons chain (Kadam et al. 2013). The weakening of O–H group was probably due to action of bacterial enzyme which cleaved the C–O bond and eventually removed the O–H group from the polymer. These results are corroborated by previous find-ings (Liakos and Lazaridis 2014; Ramezani et al. 2011). The additional peaks in the treated effluent are due to deg-radation of SGA-MPs by developed bacterial consortium. In HPLC analysis, the SGA-MRPs showed major peak at 2.40 min but after bacterial treatment the height and area of peak reduced and some additional peaks was also observed. This indicated the biotransformation of Maillard products and formation of some new metabolites. These findings are well supported by earlier results reported by
various researchers (Tiwari et al. 2012; Yadav and Chan-dra 2012).
GC–MS is an ideal technique for the determination of organic pollutants in environment. The major organic com-pounds detected in untreated sample were organic acids, pyrazine and phenolic compounds. Lactic acid, benze-neacetic acid, and benzenedicarboxylic acid are the alkaline degradation products of hexose. Pyrazines are the amadori products play a key role during the Maillard product syn-thesis. Phenolic compounds are the fragmentary product of amadori compound. The presence of organic acids, phe-nolics and long chain aliphatic compounds in wastewater was reported previously by various workers (Gonzalez et al. 2000; Chandra and Kumar 2017). However, the analysis of sample after bacteria treatment has showed the presence of various organic compounds as shown in Table 2. Similar, compounds have been identified in distillery effluent after treatment with Emericella nidulans var. lata, N. intermedia followed by Bacillus sp. in three stage bioreactor (Kaushik et al. 2010). However, several organic compounds detected in untreated sample were diminished after bacterial treat-ment. This suggested that complex and high molecular weight compounds were degraded by bacterial consortium with the help of extracellular ligninolytic enzymes. These organic compounds were utilized as sole carbon, nitrogen and energy source and played a key role in the decolourisa-tion and degradation of SGA-MRPs.
The toxicity study of degraded and undegraded SGA-MRPs with P. mungo L. seeds showed that untreated sam-ple was highly toxic in nature and showed only 75, 70, 60, 15% germination at different concentration of SGA-MRPs. While, the toxicity of degraded SGA-MRPs sample was significantly reduced. Suppression of germination at high concentration of SGA-MRPs might be due to the occurrence of highly toxic organic pollutants and dissolve solid which absorbed by the seed before germination and affecting differ-ent biochemical and physiological process of seed germina-tion (Bharagava and Chandra 2010). Increased in percent germination in treated SGA-MRPs might be due to decrease of organic compounds that has created favorable environ-ment for germination and utilisation of nutrient present in Maillard products.
Conclusion
This study has revealed that SGA-MRPs showed mixture of variable molecular weight melanoidins. Therefore, sev-eral peaks were noted in rage of 200–450 nm. Further, this study also showed that the developed bacterial consortium has ability to degrade and decolourise recalcitrant complex SGA-MRPs polymer up to 70% in existence of adequate
World Journal of Microbiology and Biotechnology (2018) 34:32
1 3
32 Page 16 of 18
carbon and nitrogen source at broad range of temperature, pH, and shaking speed within a incubation period of 192 h. GC–MS and other spectrophotometric analysis of untreated and bacterial treated sample of SGA-MRPs have shown that the majority of the colours containing compounds (melanoi-dins) detected in untreated sample were diminished from the treated sample by MnP and laccase enzyme activity of bacteria. Hence, the optimized conditions for developed bac-terial consortium can be used for decolourisation of MRPs containing industrial wastewater at large scale.
Acknowledgements Instrumentation facilities for scanning elec-tron microscopy from central facilities, CSIR-IITR, Lucknow, Uttar Pradesh, India are gratefully acknowledged. The financial assistance from DBT, New Delhi, India to Prof. Ram Chandra and Rajiv Gan-dhi National Senior Research Fellowship (RGNSRF) from University Grant Commission, New Delhi, to Mr. Vineet Kumar, Ph.D. Scholar is highly acknowledged.
Open Access This article is distributed under the terms of the Crea-tive Commons Attribution 4.0 International License (http://creat iveco mmons .org/licen ses/by/4.0/), which permits unrestricted use, distribu-tion, and reproduction in any medium, provided you give appropriate credit to the original author(s) and the source, provide a link to the Creative Commons license, and indicate if changes were made.
References
AIDA (All India Distillers’ Associations) (2016) Annual report. New Delhi, http://www.aidai ndia.org/annua l-repor t.html
Aoshima I, Tozawa Y, Ohmomo S, Ueda K (1985) Production of decol-orizing activity for molasses pigment by Coriolus versicolor Ps4a. Agric Biol Chem 49:2041–2045
APHA (American Public Health Association) (2012) Standard method for examination of water and wastewater, 22nd edn. APHA, AWWA, WEF, Washigton, DC
Arimi MM, Zhang Y, Götz G, Kiriamiti K, Geißen SU (2014) Anti-microbial colorants in molasses distillery wastewater and their removal technologies. Int Biodeterior Biodegrad 87:34–43
Arora DS, Chander M, Gill PK (2002) Involvement of lignin per-oxidase, manganese peroxidase and laccase in degradation and selective ligninolysis of wheat straw. Int Biodeterior Biodegrad 50:115–120
Barrow GI, Feltham RKA (2003) Cowan and Steels, Manual for the identification of medical bacteria, 3rd edn. Cambridge University Press, Cambridge
Bharagava RN, Chandra R (2009) Isolation and characterisation of phenolic compounds by 1H NMR and mass spectrometric analy-sis from sugarcane molasses post methanated distillery effluent. Indian J Environ Prot 29:873–888
Bharagava RN, Chandra R (2010) Biodegradation of the major color containing compounds in distillery wastewater by an aerobic bac-terial culture and characterization of their metabolites. Biodeg-radation 21:703–711
Bharagava RN, Chandra R, Rai V (2009) Isolation and characterization of aerobic bacteria capable of the degradation of synthetic and natural melanoidins from distillery effluent. World J Microbiol Biotechnol 25(5):737–744
Billaud C, Maraschin C, Nicolas J (2004) Inhibition of polyphenolox-idase from apple by Maillard reaction products prepared from
glucose or fructose with L-cysteine under various conditions of pH and temperature. LWT 37:69–78
Brenner DJ, Krieg NR, Staley JT, Garrity GM (2005) Bergey’s manual of systematic bacteriology. Springer, New York
Chandra R, Kumar V (2017) Detection of Bacillus and Stenotropho-monas species growing in an organic acid and endocrine-disrupt-ing chemicals rich environment of distillery spent wash and its phytotoxicity. Environ Monit Assess 189:26
Chandra R, Singh H (1999) Chemical decolourisation of anaerobically treated distillery effluent. Indian J Environ Prot 19(11):833–837
Chandra R, Singh R (2012) Decolourisation and detoxification of rayon grade pulp paper mill effluent by mixed bacterial culture isolated from pulp paper mill effluent polluted site. Biochem Eng J 61:49–58
Chandra R, Bharagava RN, Rai V (2008a) Melanoidins as major col-ourant in sugarcane molasses based distillery effluent and its deg-radation. Bioresour Technol 99:4648–4660
Chandra R, Yadav S, Mohan D (2008b) Effect of distillery sludge on seed germination and growth parameters of green gram (Phaseo-lus mungo L.). J Hazard Mater 152:431–439
Chandra R, Bharagava RN, Rai V, Singh SK (2009) Characterization of sucrose–glutamic acid Maillard products (SGMPs) degrading bacteria and their metabolites. Bioresour Technol 100:6665–6668
D’Souza DT, Tiwari R, Sah AK, Raghukumar C (2006) Enhanced pro-duction of laccase by a marine fungus during treatment of colored effluents and synthetic dyes. Enzyme Microb Technol 38:504–511
David Noel S, Rajan MR (2015) Phytotoxic effect of dyeing industry effluent on seed germination and early growth of lady’s finger. J Pollut Eff Control 3:138
Davídek T, Devaud S, Robert F, Blank I (2006) Sugar fragmentation in the Maillard reaction cascade: isotope labeling studies on the formation of acetic acid by a hydrolytic β-dicarbonyl cleavage mechanism. J Agric Food Chem 54(18):6667–6676
Dwyer J, Lant P (2008) Biodegradability of DOC and DON for UV/H2O2 pre-treated melanoidin based wastewater. Biochem Eng J 42:47–54
Echavarría AP, Pagán J, Ibarz A (2013a) Antioxidant activity of the melanoidin fraction formed from D-glucose and D-fructose with L-asparagine in the Maillard reaction. Sci Agropecu 4:45–54
Echavarría AP, Pagán J, Ibarz A (2013b) Optimization of Maillard reaction products isolated from sugar-amino acid model system and their antioxidant activity. Afinidad LXX, 562, Abril-Junio
Echavarría AP, Pagán J, Ibarz A (2014) Kinetics of color development of melanoidins formed from fructose/amino acid model systems. Food Sci Technol Int 20(2):119–126
Eggleston G, Vercellotti JR (2000) Degradation of sucrose, glucose and fructose in concentrated aqueous solution under constant pH conditions at elevated temperature. J Carbohydr Chem 19(9):1305–1318
Ghosh M, Verma SC, Mengoni A, Tripathi AK (2004) Enrichment and identification of bacteria capable of reducing chemical oxy-gen demand of anaerobically treated molasses spent wash. J Appl Microbiol 96:1278–1286
Gonzalez T, Terron MC, Yague S, Zapico E, Galletti GC, Gonza-lez AE (2000) Pyrolysis/gas chromatography/mass spectrom-etry monitoring of fungal-biotreated distillery wastewater using Trametes sp I-62 (CECT 20197). Rapid Commun Mass Spectrom 14:1417–1424
González T, Terrón MC, Yagüe S, Junca H, Carbajo JM, Zapico EJ, Silva R, Arana-Cuenca A, Téllez A, González AE (2008) Mel-anoidin-containing wastewaters induce selective laccase gene expression in the white-rot fungus Trametes sp. I-62. Res Micro-biol 159(2):103–109
Gu FL, Kim J, Abbas S, Zhang XM, Xia SQ, Chen ZX (2010) Struc-ture and antioxidant activity of high molecular weight Maillard reaction products from casein–glucose. Food Chem 120:505–511
World Journal of Microbiology and Biotechnology (2018) 34:32
1 3
Page 17 of 18 32
Hayase F (2000) Recent development of 3-deoxyosone related Maillard reaction products. Food Sci Technol Res 6(2):79–86
Hemavanthi KL, Kumar NKH, Jagannath S (2015) Gentotoxic effect of distillery effluent on root tip cells of Allium sativum L. J Appl Biol Biotechnol 3(03):038–041
Hwang C, Jiang Y, Sheu S, Hsieh P, Guo J (2011) Purification and characterization of a novel glucose oxidase-like melanoidin decol-orizing enzyme from Geotrichum sp. No 56. Afr J Microbiol Res 5(20):3256–3266
Kadam AA, Kamatkar JD, Khandare RV, Jadhav JP, Govindwar SP (2013) Solid-state fermentation: tool for bioremediation of adsorbed textile dyestuff on distillery industry waste-yeast bio-mass using isolated Bacillus cereus strain EBT1. Environ Sci Pol-lut Res 20:1009–1020
Kapley A, Lampel K, Purohit HJ (2001) Rapid detection of Salmo-nella in water samples by multiplex PCR. Water Environ Res 73:461–465
Kaushik G, Thakur IS (2013) Adsorption of colored pollutants from distillery spent wash by native and treated fungus: Neurospora intermedia. Environ Sci Pollut Res 20(2):1070–1078
Kaushik G, Gopal M, Thakur IS (2010) Evaluation of performance and community dynamics of microorganisms during treatment of distillery spent wash in a three stage bioreactor. Bioresour Technol 101:4296–4305
Kersters K, Devos P, Gillis M, Swings J, Vandamme P, Stackebrandt E (2006) Introduction to the proteobacteria. In: Dworkin M, Falkow S, Rosenberg E, Schleifer KH, Stackebrandt E (eds) The prokary-otes: a handbook on the biology of bacteria. Springer, New York, pp 3–37
Kim SJ, Shoda M (1999) Batch decolorization of molasses by sus-pended and immobilized fungus of Geotrichum candidum. J Biosci Bioeng 88(5):586–589
Kim SB, Hayase F, Kato H (1985) Decolourisation and degrada-tion products of melanoidin on ozonolysis. Agric Biol Chem 49:785–792
Kumar P, Chandra R (2006) Decolourisation and detoxification of syn-thetic molasses melanoidins by individual and mixed cultures of Bacillus spp. Bioresour Technol 97:2096–2102
Lau J, Tran C, licari P, Galazzo J (2004) Development of a high cell-density fed-bath bioprocess for the heterologous production of 6-deoxyerythronolide B in Escherichia coli. J Biotechnol 110:95–103
Liakos TI, Lazaridis NK (2014) Melanoidins removal from simulated and real wastewaters by coagulation and electro-flotation. Chem Eng J 242:269–277
Liang Z, Wang Y, Zhou Y, Liu H, Wu Z (2009a) Variables affecting melanoidins removal from molasses wastewater by coagulation/flocculation. Sep Purif Technol 68(3):382–389
Liang Z, Wang Y, Zhou Y, Liu H (2009b) Coagulation removal of melanoidins from biologically treated molasses wastewater using ferric chloride. Chem Eng J 152(1):88–94
Mahgoub S, Tsioptsias C, Samaras P (2016) Biodegradation and decol-orization of melanoidin solutions by manganese peroxidase yeasts. Water Sci Technol 73(10):2436–2445
Martins S, Van Boekel M (2003) Melanoidins extinction coefficient in the glucose/glycine Maillard reaction. Food Chem 83:135–142
Miyata N, Mori T, Iwahori K, Fujita M (2000) Microbial decolouri-zation of melanoidin-containing wastewaters: combined use of activated sludge and the fungus Coriolus hirsutus. J Biosci Bioeng 89:145–150
Mohana S, Acharya BK, Madamwar D (2007) Distillery spent wash: treatment technologies and potential applications. J Hazard Mater 163(1):12–25
Nolasco Junior J, De Massaguer PR (2006) Thermal degradation kinet-ics of sucrose, glucose and fructose in sugarcane must for bioetha-nol production. J Food Process Eng 29:462–477
Okino LK, Machado KMG, Fabris C, Bononi VLR (2000) Ligninolytic activity of tropical rainforest basidiomycetes. World J Microbiol Biotechnol 16(8–9):889–893
Onyango MS, Kittinya J, Hadebe N, Ojijo VO, Ochieng A (2011) Sorp-tion of melanoidin onto surfactant modified zeolite. Chem Ind Chem Eng Q 17:385–395
Pangallo D, Simonovicova A, Chovanova K, Ferianc P (2007) Wooden art objects and the museum environment: identification and bio-degradative characteristics of isolated microflora. Lett Appl Microbiol 45:87–94
Pant D, Adholeya A (2007) Identification, ligninolytic enzyme activity and decolorization potential of two fungi isolated from a distillery effluent contaminated site. Water Air Soil Pollut 183:165–176
Pant D, Adholeya A (2009a) Nitrogen removal from biomethanated spent wash using hydroponic treatment followed by fungal decol-orization. Environ Eng Sci 26:559–565
Pant D, Adholeya A (2009b) Concentration of fungal ligninolytic enzymes by ultrafiltration and their use in distillery effluent decol-orization. World J Microbiol Biotechnol 25:1793–1800
Raghukumar C, Rivonkar G (2001) Decolourization of molasses spent wash by the white-rot fungus Flavodon flavus, isolated from a marine habitat. Appl Microbiol Biotechnol 55:510–514
Ramezani A, Darzi GN, Mohammadi M (2011) Removal of melanoidin from molasses spent wash using fly ash–clay adsorbents. Korean J Chem Eng 28:1035–1041
Rodriguez E, Pickard M, Vazquez-Duhalt R (1999) Industrial dye decolourisation by laccase from ligninolytic fungi. Curr Micro-biol 38:27–31
Santal AR, Singhb NP, Saharan BS (2011) Biodegradation and detoxi-fication of melanoidin from distillery effluent using an aerobic bacterial strain SAG5 of Alcaligenes faecalis. J Hazard Mater 193:319–324
Satyawali Y, Balakrishnan M (2008) Treatment of distillery effluent in a membrane bioreactor (MBR) equipped with mesh filter. Sep Purif Technol 63(2):278–286
Sirianuntapiboon S, Zohsalam P, Ohmomo S (2004) Decolorization of molasses wastewater by Citeromyces sp. WR-43-6. Process Biochem 39:917–924
Tamura K, Stecher G, Peterson D, Filipski A, Kumar S (2013) MEGA6: molecular evolutionary genetics analysis version 6.0. Mol Biol Evol 30(12):2725–2729
Thakkar AP, Dhamankar VS, Kapdnis BP (2006) Biocatalytic decol-orisation of molasses by Phanerochaete chrysosporium. Bioresour Technol 97(12):1377–1381
Tiwari S, Gaur R, Singh R (2012) Decolorization of a recalcitrant organic compound (Melanoidin) by a novel thermotolerant yeast, Candida tropicalis RG-9. BMC Biotechnol 12:30
Tiwari S, Rai P, Yadav SK, Gaur R (2013) A novel thermotolerant Pediococcus acidilactici B-25 strain for color, COD, and BOD reduction of distillery effluent for end use applications. Environ Sci Pollut Res Int 20(6):4046–4058
Tiwari S, Gaur R, Singh A (2014) Distillery spentwash decolourisation by a noval consortium of Pedicoccus acidilactici and Candida tropicalis under static condition. Pak J Biol Sci 17(6):780–791
USEPA (2002) The environment protection rules, 3A, Schedule-II, III. U.S. Environmental Protection Agency, Office of research and development, Cincinnati
Verman SR, Delea RC, Tyagi MP, Gupta SP (1974) Studies of charac-teristics and disposal problem of industrial effluent with reference to ISI standard; part I. Indian J Environ Health 16:289–299
Walford SN (1996) Composition of cane juice. Proc S Afr Sug Technol Ass 70:265–266
Wang H, Qian H, Yao W (2011) Melanoidins produced by the Mail-lard reaction: structure and biological activity. Food Chem 128:573–584
World Journal of Microbiology and Biotechnology (2018) 34:32
1 3
32 Page 18 of 18
Woese CR, Weisburg WG, Hahn CM, Paster BJ, Zablen LB, Lewis BJ, Macke TJ, Ludwig W, Stackebrandt E (1985) The phylogeny of purple bacteria: the gamma subdivision. Syst Appl Microbiol 6:25–33
Yadav S, Chandra R (2012) Biodegrdation of organic compounds of molasses melanoidins (MM) from biomethanated distillery distill-ery spent wash (BMDS) during the decolourisation by potential bacterial consortium. Biodegradtion 23:609–620
Yadav S, Chandra R (2013) Detection of persistent organic com-pounds from biomethanated distillery spent wash (BMDS) and
their degradation by manganese peroxidase and laccase producing bacterial strains. J Environ Biol 34(4):755–764
Yadav S, Chandra R, Rai V (2011) Characterization of potential MnP producing bacteria and its metabolic products during decolouri-sation of synthetic melanoidins due to biostimulatory effect of d-xylose at stationary phase. Proc Biochem 46:1774–1784