characterisiics of four hiqhway dittinaqe · pdf filecharacterisiics of four hiqhway dittinaqe...
TRANSCRIPT
ChARACTERisiics of FOUR HiqhwAy DittiNAqE SYSTEMS IN Ohio
IBy ^Dcwd G Straub
U.S. GEOLOGICAL SURVEY Water-Resources Investigations Report 95-4020
Final Report on a study of Discharge Characteristics of Selected Longitudinal Drain Materials
Prepared in cooperation 'with theOHIO DEPARTMENT OF TRANSPORTATIONand theU.S. DEPARTMENT OF TRANSPORTATION,FEDERAL HIGHWAY ADMINISTRATION
The contrnts of this repeat reflect die views of the anthoa, who arc responsible for the facto and the accuracy of the date pteacated hedn. The contents do not necessarily leflect the offidtl views or policies of the Ohio Department of Tkaospoftatioo or the Indeed. Highway AdnunuttatioiL Rport does not ^^ff**"^ A ilMVii^iu, ff^-iTif^vm, or
Columbus, Ohio1995 Reprinted August, 1995
U S. DEPARTMENT OF THE INTERIOR BRUCE BABBITT, Secretary
U.S. GEOLOGICAL SURVEY Gordon P. Eaton, Director
For additional information Copies of this report may write to: be purchased from:
District Chief U.S. Geological Survey U.S. Geological Survey Earth Science Information Center 975 West Third Avenue Open-File Reports Section Columbus, OH 43212-3192 Box 25286, MS 517
Denver Federal Center Denver, CO 80225
CONTENTS
Abstract........................................... ^ 1Introduction.............................................^ 1
Purpose and scope................................................................................................................................ 2Previous studies................................................................................................................................... 2
Data collection............................................................................................................................................ 2Edge drain description and installation................................................................................................ 2Instrumentation ................................................................................................................................... 5Factors affecting accuracy of data....................................................................................................... 5
Discharge characteristics of highway drainage systems............................................................................. 9Maximum discharge............................................................................................................................. 9Volumes..................................................^ 10L^gtimes.............................................^^ 15
Summary .................................................................................................................................................... 19References cited ......................................................................................................................................... 20
FIGURES
1. Map showing location of edge drain study site at Granville, Ohio....................................................... 32. Cross-sectional views and construction characteristics of edge drains used in this investigation........ 43. Plan view of edge drain study site at State Route 16, Granville, Ohio................................................. 64. Cross section of eastbound lane of State Route 16 at edge drain study site......................................... 75. Diagram showing design of dual tipping-bucket gage.......................................................................... 86. Graph showing distribution of maximum discharges for each edge drain for 72 events, 1991-93
for State Route 16 near Granville, Ohio ......................................................................................... 117. Graph showing distribution of volumes for each edge drain for 55 events, 1991-93 for State
Route 16 near Granville, Ohio......................................................................................................... 138. Graph showing distribution of the ratios of discharge volumes to rainfall volumes for each
edge drain for 55 events, 1991-93 for State Route 16 near Granville, Ohio.................................... 149. Diagram showing calculated lag times................................................................................................. 1610. Graph showing distribution of lag times between hydrograph centroid and hyetograph centroid
for each edge drain for 51 events, 1991-93 for State Route 16 near Granville, Ohio...................... 1711. Graph showing distribution of lag times between rainfall onset and maximum discharge for
each edge drain for 51 events, 1991-93 for State Route 16 near Granville, Ohio........................... 18
TABLES
1. Statistics for maximum discharges for each edge drain for 72 events, 1991-93 for StateRoute 16 near Granville, Ohio ........................................................................................................ 10
2. Statistics for volumes for each edge drain for 55 events, 1991-93 for State Route 16 nearGi^vffle, Ohio......................................._ 12
3. Statistics for discharge volumes as a percentage of rainfall volume for each edge drain for55 events, 1991-93 for State Route 16 near Granville, Ohio .......................................................... 12
Contents III
TABLES (continued)
4. Statistics for lag times between hydrograph centroid and hyetograph centroid for each edge drain for 51 events, 1991-93 for State Route 16 near Granville, Ohio ................................
5. Statistics for lag times between rainfall onset and discharge maximum for each edge drain for 51 events, 1991-93 for State Route 16 near Granville, Ohio...........................................
15
19
CONVERSION FACTORS AND ABBREVIATED UNITS
Multiply By To obtain
inch (in.)
foot (ft)
mile (mi)
square foot (ft2)
square mile (mi2)
cubic foot (ft3)
cubic foot per hour (f^/hr)
25.4 millimeter
0.3048 meter
1.609 kilometer
0.09290 square meter
2.590 square kilometer
0.02832 cubic meter
0.02832 cubic meter per hour
IV Discharge Characteristics of Four Highway Drainage Systems in Ohio

Discharge Characteristics of Four Highway Drainage Systems in Ohio
By David E. Straub
Abstract
Excessive water in the subbase of a high way combined with large traffic volumes and heavy loads is a major cause of road deteriora tion. Prompt removal of any excess water in a subbase will decrease the road deterioration and extend the effective life of a highway. This study presents discharge characteristics of four highway subbase drainage systems. These sys tems consisted of shallow, longitudinal trenches with geocomposite drain materials (edge drains made from a polyethylene core surrounded by a geotextile filter fabric) that underlie the joint between the shoulder and the traffic lane of State Route 16, approximately 1.0 mile southeast of Granville, Ohio. For selected rainfall-runoff events the maximum discharge, discharge volumes, and lag times for specific discharge characteristics from April 1991 through November 1993 were computed for three geocomposite products a post type, an oblong-pipe type, and a cusp type and a conventional perforated pipe edge drain.
In general, the discharge characteristics of the conventional edge drain and that of the oblong-pipe edge drain were similar for most of the rainfall-runoff event characteristics. Both produced most of the highest maximum discharges and largest discharge volumes among the four longitudinal edge drains. The post edge drain produced smaller maximum discharges and volumes than the conventional and oblong-pipe edge drains, but it had the shortest lag times for most of the event charac teristics. The cusp edge drain produced small
maximum discharges and small volumes simi lar to those from the post edge drain, but it had the longest lag times of all the edge drains for most of the event characteristics. The cusp edge drain may have also had some problems during installation which could have affected the discharge characteristics.
INTRODUCTION
A major cause of road deterioration is exces sive water in the subbase of the highway combined with large traffic volumes and heavy loads. To decrease the road deterioration and extend the effective life of a highway, any excess water in a subbase needs to be removed. Therefore, proper drainage of the subbase has become a major con cern in the design and rehabilitation of highways. The U.S. Geological Survey (USGS), in coopera tion with the Ohio Department of Transportation (ODOT), evaluated discharge characteristics of four selected subbase drainage systems that consist of shallow longitudinal trenches with geocompos ite drain materials (edge drains) that underlie the joint between the shoulder and the traffic lane. In Ohio, edge drains commonly consist of a 10-in.-wide longitudinal trench, backfilled with pea gravel, along the edge of the traffic lane. At the bottom of the trench is a 4-in.-diameter perforated drain pipe to channel water to outlet pipes. The edge drains function as sumps to intercept the lat eral flow of excess water from subbases and infil tration from joints and surface cracks. Because of the low permeability of the subgrade materials under the shoulder, which sometimes functions as a hydraulic barrier and impedes the drainage of the subbases, outlet pipes are used to channel the water away from the subbases through the shoulder.
Introduction

Three geocomposite edge drains and a conven tional edge drain were installed by ODOT accord ing to the manufacturers' specifications. The four edge drain systems were connected to outlet pipes which routed the excess water of the subbase through specially designed tipping-bucket gages to monitor the discharge characteristics through the drainage systems.
Purpose and Scope
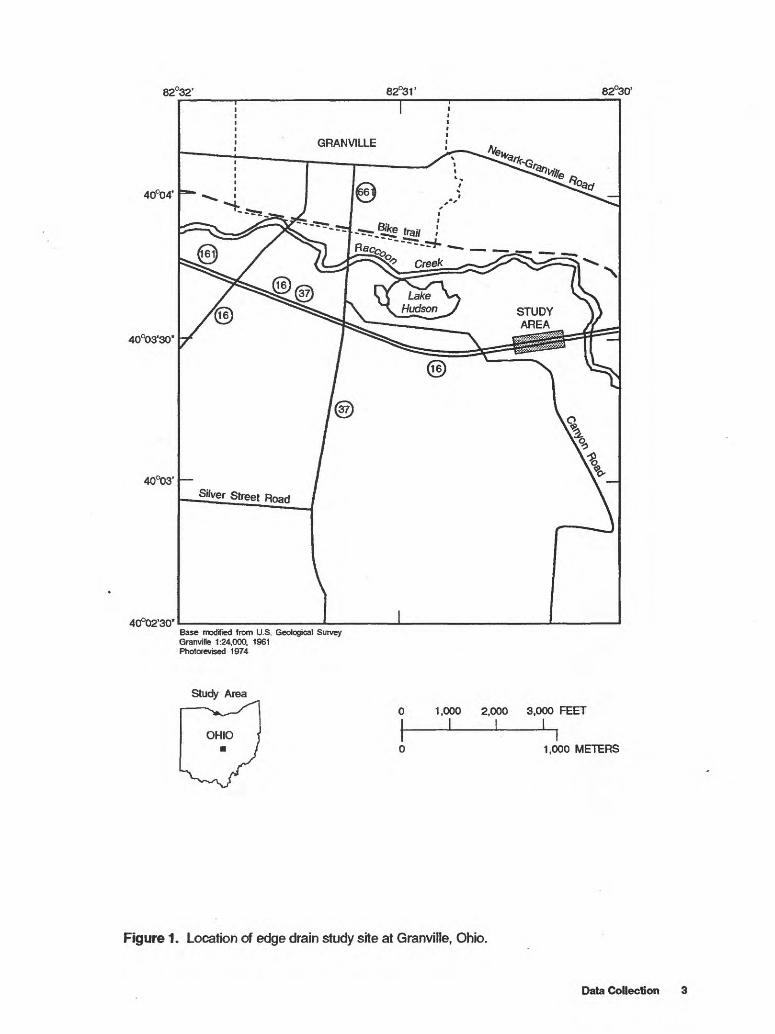
This report documents the discharge character istics of four highway drain materials (edge drains) under nearly equal geological and environmental conditions. The four edge drains were installed under State Route 16 approximately 1.0 mi south east of Granville, Ohio (fig. 1). Discharge from the four edge drains was monitored from April 1991 through November 1993. The discharge character istics presented from the four edge drains consist of maximum discharges, discharge volumes, and lag times of specific discharge characteristics during selected rainfall events. 1
Previous Studies
In a previous study (Jeffcoat and others, 1992), flow patterns underneath the highway surface were analyzed to determine how excess water escaped the subbases. On several occasions, piezometric water levels were above the roadway surface, which indicates that excess water was not escaping from the subbases very effectively. The study team concluded that edge drains and permeable subbases are critical aspects for the effective channeling of water away from the highway subbases. Although the previous study determined that effective edge drains extend the life of highways, it did not inves tigate the discharge characteristics of different shapes of geocomposite edge drains under similar geological and environmental conditions. Instru mentation was developed during the previous study by Jeffcoat and others (1992) to measure the discharge from the outlet pipes of the edge drains as well as the concurrent rainfall over the area.
Another previous study investigated the discharge characteristics of a post edge drain and a conven tional edge drain (Hinshaw, 1988), but the results of this study were inconclusive.
DATA COLLECTION
Discharge data from the edge drains were recorded by electronic data loggers in the field and retrieved by telemetry or with a laptop com puter. Maximum discharge, discharge volumes, and lag times for selected discharge characteristics were computed for selected events recorded from April 1991 through November 1993. Data-collec tion periods were generally from mid-April to the beginning of December to protect the instrumenta tion from freezing during the cold winter months.
Edge Drain Description and Installation
The three geocomposite edge drain products were chosen by ODOT to provide a representative sample of the designs on the market (fig. 2). The "conventional" edge drain is the typical 4-in.-diameter perforated polyethylene drain pipe in a 10-in.-wide trench backfilled with pea gravel used throughout Ohio for longitudinal edge drains. The "post" edge drain is constructed from a poly ethylene core consisting of many hollow posts con nected to a perforated mat and surrounded by a geotextile fabric2. The "oblong-pipe" edge drain is a polyethylene perforated oblong pipe surrounded by a geotextile fabric. The "cusp" edge drain is a polyethylene perforated mat with many raised ped estal-like cusps surrounded by a geotextile fabric.
The study site was selected because of the ele vated roadway relative to the adjacent land surface and constant, gently sloping road grade. The ele vated highway surface and the shallow depth of the edge drains (within 36 in. from the highway sur face) minimized the potential effects of ground water. Each edge drain was hydraulically isolated from the other by short independent edge drains installed directly upgradient from each edge drain.
1 An event is defined as the occurrence of rain with a resultant runoff discharge.
2A geotextile fabric is a manufactured material used to filter out the fine materials while allowing water to escape the subbase.
2 Discharge Characteristics of Four Highway Drainage Systems in Ohio
82°32' 82°31' 82°30'
40°04'
40°03'30"
40°03'
40°02'30"Base modified from U.S. Geological Survey Granville 1:24,000, 1961 Photorevised 1974
Study Area
1,000 2,000 3,000 FEET
1,000 METERS
Figure 1. Location of edge drain study site at Granville, Ohio.
Data Collection 3

OCONVENTIONAL
-l-h
IHSB«^ H
POST OBLONG PIPE
CUSP
EXPLANATION
POLYETHYLENE CORE
§ GEOTEXTILE FILTER FABRIC
I
O POLYETHYLENE PERFORATED PIPE
Figure 2. Cross-sectional views and construction characteristics of edge drains used in this investigation. (All dimensions are in inches.)
4 Discharge Characteristics of Four Highway Drainage Systems in Ohio
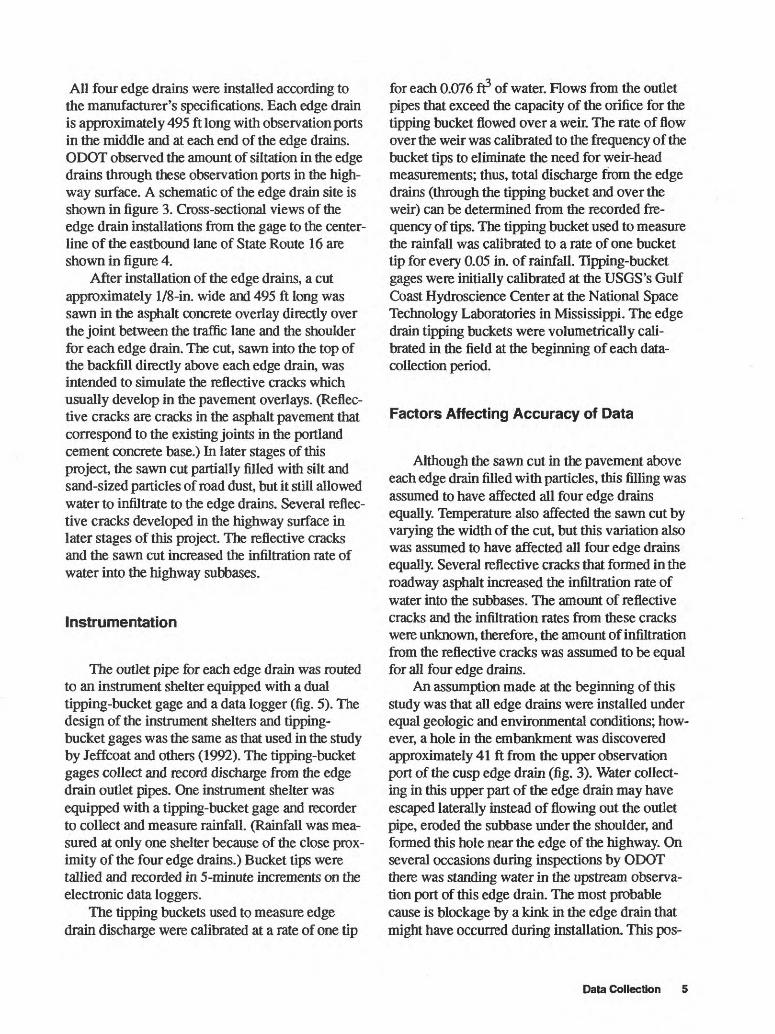
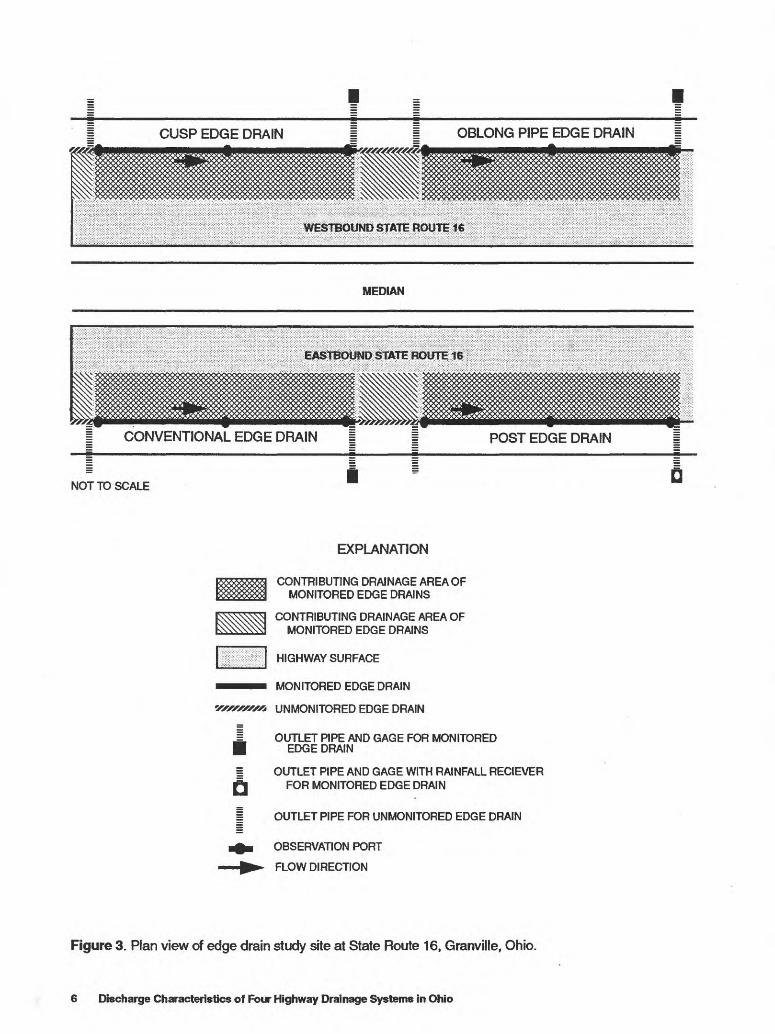
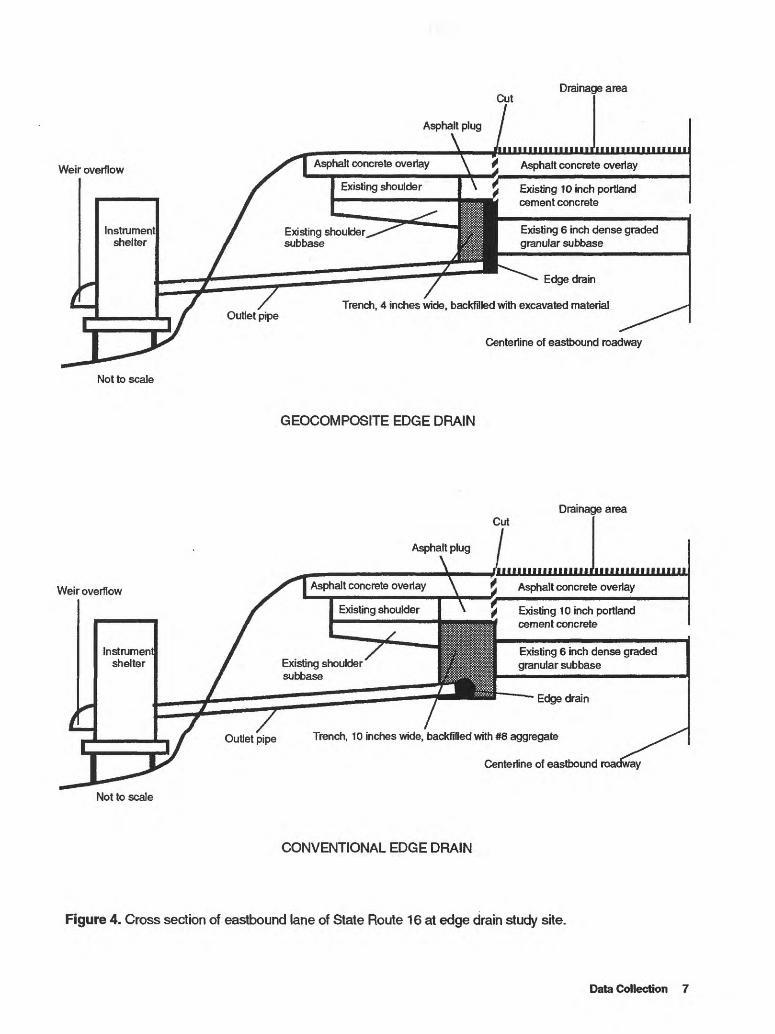
All four edge drains were installed according to the manufacturer's specifications. Each edge drain is approximately 495 ft long with observation ports in the middle and at each end of the edge drains. ODOT observed the amount of siltation in the edge drains through these observation ports in the high way surface. A schematic of the edge drain site is shown in figure 3. Cross-sectional views of the edge drain installations from the gage to the center- line of the eastbound lane of State Route 16 are shown in figure 4.
After installation of the edge drains, a cut approximately 1/8-in. wide and 495 ft long was sawn in the asphalt concrete overlay directly over the joint between the traffic lane and the shoulder for each edge drain. The cut, sawn into the top of the backfill directly above each edge drain, was intended to simulate the reflective cracks which usually develop in the pavement overlays. (Reflec tive cracks are cracks in the asphalt pavement that correspond to the existing joints in the portland cement concrete base.) In later stages of this project, the sawn cut partially filled with silt and sand-sized particles of road dust, but it still allowed water to infiltrate to the edge drains. Several reflec tive cracks developed in the highway surface in later stages of this project. The reflective cracks and the sawn cut increased the infiltration rate of water into the highway subbases.
Instrumentation
The outlet pipe for each edge drain was routed to an instrument shelter equipped with a dual tipping-bucket gage and a data logger (fig. 5). The design of the instrument shelters and tipping- bucket gages was the same as that used in the study by Jeffcoat and others (1992). The tipping-bucket gages collect and record discharge from the edge drain outlet pipes. One instrument shelter was equipped with a tipping-bucket gage and recorder to collect and measure rainfall. (Rainfall was mea sured at only one shelter because of the close prox imity of the four edge drains.) Bucket tips were tallied and recorded in 5-minute increments on the electronic data loggers.
The tipping buckets used to measure edge drain discharge were calibrated at a rate of one tip
for each 0.076 ft3 of water. Flows from the outlet pipes that exceed the capacity of the orifice for the tipping bucket flowed over a weir. The rate of flow over the weir was calibrated to the frequency of the bucket tips to eliminate the need for weir-head measurements; thus, total discharge from the edge drains (through the tipping bucket and over the weir) can be determined from the recorded fre quency of tips. The tipping bucket used to measure the rainfall was calibrated to a rate of one bucket tip for every 0.05 in. of rainfall. Tipping-bucket gages were initially calibrated at the USGS's Gulf Coast Hydroscience Center at the National Space Technology Laboratories in Mississippi. The edge drain tipping buckets were volumetrically cali brated in the field at the beginning of each data- collection period.
Factors Affecting Accuracy of Data
Although the sawn cut in the pavement above each edge drain filled with particles, this filling was assumed to have affected all four edge drains equally. Temperature also affected the sawn cut by varying the width of the cut, but this variation also was assumed to have affected all four edge drains equally. Several reflective cracks that formed in the roadway asphalt increased the infiltration rate of water into the subbases. The amount of reflective cracks and the infiltration rates from these cracks were unknown, therefore, the amount of infiltration from the reflective cracks was assumed to be equal for all four edge drains.
An assumption made at the beginning of this study was that all edge drains were installed under equal geologic and environmental conditions; how ever, a hole in the embankment was discovered approximately 41 ft from the upper observation port of the cusp edge drain (fig. 3). Water collect ing in this upper part of the edge drain may have escaped laterally instead of flowing out the outlet pipe, eroded the subbase under the shoulder, and formed this hole near the edge of the highway. On several occasions during inspections by ODOT there was standing water in the upstream observa tion port of this edge drain. The most probable cause is blockage by a kink in the edge drain that might have occurred during installation. This pos-
Data Collection
CUSP EDGE DRAIN OBLONG PIPE EDGE DRAIN
WESTBOUND STATE ROUTE 16
MEDIAN
EASTBOUND STATE ROUTE 16
vvI*I*IvI*I*IvX»IOI *»<XOKO>*IOIvIO>I^^
CONVENTIONAL EDGE DRAIN POST EDGE DRAIN
NOT TO SCALED
EXPLANATION
CONTRIBUTING DRAINAGE AREA OF MONITORED EDGE DRAINS
CONTRIBUTING DRAINAGE AREA OF MONITORED EDGE DRAINS
HIGHWAY SURFACE
MONITORED EDGE DRAIN
UNMONITORED EDGE DRAIN
OUTLET PIPE AND GAGE FOR MONITORED EDGE DRAIN
OUTLET PIPE AND GAGE WITH RAINFALL RECIEVER FOR MONITORED EDGE DRAIN
OUTLET PIPE FOR UNMONITORED EDGE DRAIN
OBSERVATION PORT
FLOW DIRECTION
Figure 3. Plan view of edge drain study site at State Route 16, Granville, Ohio.
6 Discharge Characteristics of Four Highway Drainage Systems in Ohio
Drainage area
Weir overflow
Not to scale
Weir overflow
Not to scale
Asphalt plug
\ iiiiiiiiiiiiiiiimiiiiiiiiiiiiiiiii
Asphalt concrete overlay
Existing 10 inch portiand cement concrete
Existing 6 inch dense graded granular subbase
Edge drain
Trench, 4 inches wide, backfilled with excavated material
Centeriine of eastbound roadway
GEOCOMPOSITE EDGE DRAIN
CutDrainage area
Asphalt plug
| Asphalt concrete overlay \ miiiiiiiiiiiiiirfiiiiiiiiiiiiiiiiii
5 Asphalt concrete overlay
Existing 10 inch Portland cement concrete
Existing 6 inch dense graded granular subbase
Edge drain
Outlet pipe Trench, 10 inches wide, backfilled with #8 aggregate
Centeriine of eastbound roai
CONVENTIONAL EDGE DRAIN
Figure 4. Cross section of eastbound lane of State Route 16 at edge drain study site.
Data Collection 7

EXPLANATION
1 RAINFALL RECEIVER2 SHELTER HOUSE3 RAINWATER TUBE4 RAINFALL TIPPING BUCKET5 EDGE DRAIN OUTLET PIPE6 ORIFICE FOR RUNOFF7 DISCHARGE TIPPING BUCKET8 OVERFLOW WEIR9 SUPPORT BRACKET10 BUMPER STOP11 MAGNETIC PROXIMITY SWITCH12 DATA LOGGER
CUTAWAY SIDE VIEW CUTAWAY FRONT VIEW
Figure 5. Design of dual tipping-bucket gage (modified from Jeffcoat and others, 1992, fig. 6).
8 Discharge Characteristics off Four Highway Drainage Systems in Ohio
sibility, however, can only be confirmed when the edge drain is repaired. Because of this suspected blockage or kink, the effective length of the cusp edge drain is reduced to approximately 454 ft. The maximum discharge, discharge volume, and lag times from the cusp edge drain were affected by an unknown amount.
Another possible problem that may have affected the data is a sag in the conventional edge drain about 15 ft from the lowest observation port. The low point of the perforated pipe in this sag appeared to be full of water but was not obstructed during an inspection. Depending on the event and the conditions before the event, this sag could have affected some of the discharge characteristics. It is not known whether the sag drained during dry peri ods, so the amount of the effect could have been recurring. If the sag did not drain during dry peri ods or become obstructed, then the effects were minimal for all events. If the sag drained during dry periods, however, the sag would affect the dis charge by an unknown amount for each rainfall event. The water would initially fill the sag and then flow as if the sag did not exist. Large and small discharge events would be affected by this sag, however, the percentage of error for the larger events would be less.
DISCHARGE CHARACTERISTICS OF HIGHWAY DRAINAGE SYSTEMS
Discharge characteristics presented for the four edge drains were the maximum discharges mea sured in cubic feet per hour, discharge volumes in cubic feet, and lag times in minutes between sev eral event characteristics for each edge drain from selected events. In general, the conventional edge drain was the most closely matched by the oblong- pipe edge drain. Most of the event characteristics for the conventional and oblong-pipe edge drain were similar for every event. The events ranged in total rairtfall from less than 0.05 in. to approxi mately 2.10 in. and are assumed to have covered the entire drainage area uniformly for each edge drain. (The drainage area of each edge drain as shown in figure 3 was surveyed and computed as the area enclosed by a rectangle from the sawn cut to the crown or center line of the highway surface.)
Event durations ranged from about 1 hour to 20 hours. Only data for those rainfall events during which all gages were functioning properly and accurately with respect to the characteristic being compared were used in this analysis. For several events, a small discharge was recorded but no bucket tips registered for the rainfall tipping- bucket gage; total rainfall was less than 0.05 in. for these events. Although lag times could not be computed for these events, maximum discharges and volumes for these events were still used in the analysis.
Five-minute-increment rainfall totals for the events ranged from less than 0.05 in. to approxi mately 0.30 in. The long-duration, low-intensity rainfall events produced some of the highest maxi mum discharges and volumes. For most of the events with high maximum discharges and vol umes, the intensity remained at 0.05 or 0.10 in. (one or two tips) per 5-minute interval for several consecutive intervals. For the high-intensity rain fall events, 0.15 to 0.30 in. (three to six tips) per 5-minute interval, the increase in the rate of dis charge from the edge drains was not significant The low-intensity events allowed more water to infiltrate into the subbase than the high-intensity events. For the high-intensity events, most of the water probably flowed over the sawn cut and over the shoulder, bypassing the edge drains.
Maximum Discharge
The maximum discharges of the four edge drains were presented only if all four edge drain gages were operating properly during an event. The comparison of the maximum discharges for the edge drains was based on 72 events. Several events consisted of multiple discharge peaks; in such cases, only the maximum discharges for each of the events were used in the comparison. During some of the events, for example, the maximum dis charges occurred shortly after the onset of the rain. As additional rain fell, second peaks occurred, but they were usually not as high as the initial peaks. If, however, the discharges during an event from all the edge drains decreased to about 0.73 ff/hr (one tip in 5 minutes) and then peaked again, the
Discharge Characteristics of Highway Drainage Systems 9
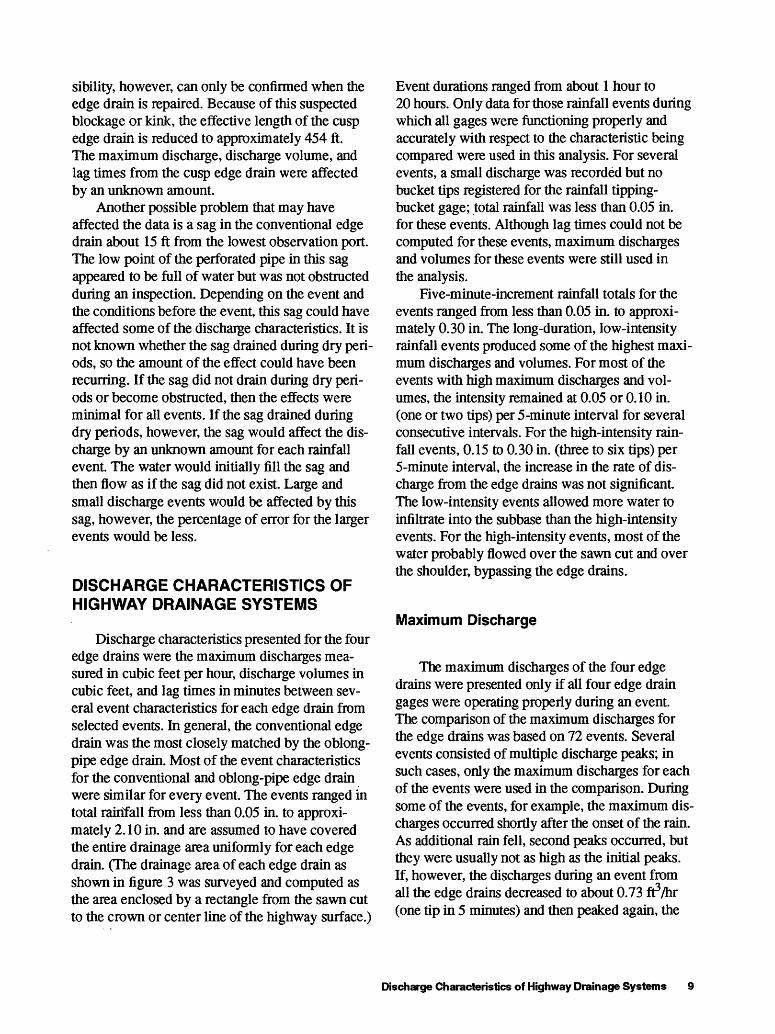
discharge peaks were separated and analyzed indi vidually. Maximum-discharge data for each edge drain are summarized in figure 6 and table 1.
Table 1 . Statistics for maximum discharges for each edge drain for 72 events, 1991-93 for State Route 16 near Granville, Ohio[All units are in cubic feet per hour and rounded to 3 significant digits; CV is the coefficient of variation; IQR is the interquartile range; Range is the maximum value minus the minimum value; Midrange is the value midway between the maximum and minimum values]
Edge drain type
Conven- Statistic tional
MeanStandard
deviationCVMinimumMaximumMedianIQR25th pereentile75th pereentileRangeMidrange
8.00
6.03.755.730
31.96.206.384.38
10.831.116.3
Post
3.38
3.31.980.730
18.12.553.65
.7304.38
17.3 .9.40
Oblong pipe
7.99
5.81.726.730
29.47.114.564.388.94
28.715.1
Cusp1
3.36
2.21.657.730
8.942.553.651.645.298.214.84
All edge drains were installed under nearly equal geological and environmental conditions; however, a hole in the embankment was dis covered approximately 41 feet from the upper observation port of the cusp edge drain (fig. 3). Some water flowing from the edge drain may have escaped laterally instead of flowing out the outlet pipe and through the gage.
The mean maximum discharges of the conven tional and oblong-pipe edge drains were approxi mately equal, and both were higher than the means of the post and cusp edge drains. For almost every event, the maximum discharges of the conventional and oblong-pipe edge drains were either equal to or higher than those from the post and cusp edge drains. The smallest maximum discharge for all the edge drains was 0.73 ft3/hr. A few of the large events pro duced maximum discharges from the conventional and oblong-pipe edge drains that were larger than the capacity of the orifice of the tipping-bucket gages and flowed over the weir. The post and cusp edge drains did not produce enough flow to overtop the weir during any of the events used in the analysis. The largest maximum discharges ranged from 8.94 ft3/hr for the cusp edge drain to 31.9 f^/hr for the conventional edge drain.
The mean maximum discharges for all the edge drains were computed to give a general idea of the discharge characteristics of the four edge drains. The standard deviation and coefficient of variation also were computed to measure the variability of the four edge drain data sets. The variability of the maximum discharge for each of the edge drains is a function of the amount of rain falling over the drainage areas and the effectiveness of the edge drains in channeling the water out of the subbase. Although the standard deviations relative to the means for the edge drains are nearly equal, the maximum discharges were usually much greater for the conventional and oblong-pipe edge drains than for the post and cusp edge drains.
Although the mean maximum discharge for the conventional edge drain was the highest among all the edge drains, the median maximum discharge for the oblong-pipe edge drain was the highest median among the four edge drains. The medians also were used for comparison because of the vari ability of the data sets and some extremely high discharges from the conventional and oblong-pipe edge drains. Extreme values do not affect the medi ans as much as they will affect the means of the maximum discharges. The median maximum dis charges for the post and cusp edge drains were much smaller than the median maximum dis charges for the conventional and the oblong-pipe edge drains. Median maximum discharges for the conventional and oblong-pipe edge drains were at least two times the median maximum discharges for the post and cusp edge drains.
Volumes
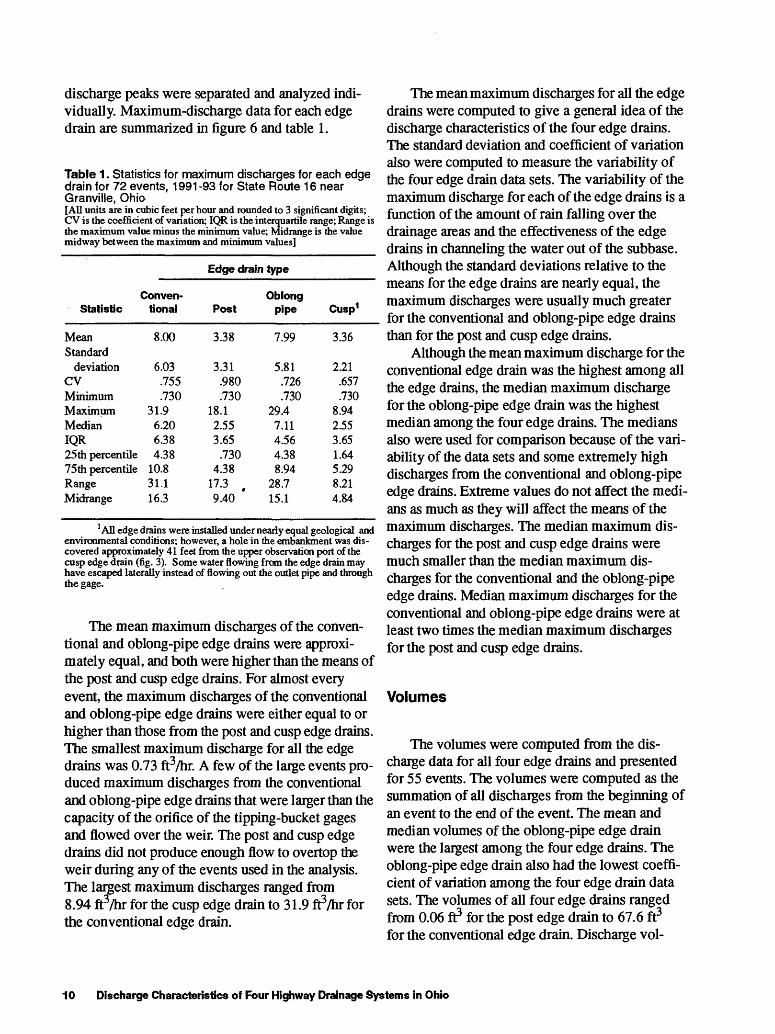
The volumes were computed from the dis charge data for all four edge drains and presented for 55 events. The volumes were computed as the summation of all discharges from the beginning of an event to the end of the event. The mean and median volumes of the oblong-pipe edge drain were the largest among the four edge drains. The oblong-pipe edge drain also had the lowest coeffi cient of variation among the four edge drain data sets. The volumes of all four edge drains ranged from 0.06 ft3 for the post edge drain to 67.6 ft3 for the conventional edge drain. Discharge vol-
10 Discharge Characteristics of Four Highway Drainage Systems in Ohio
40
DCZ>oI DC LU O_
LU LU LLOmZ>o
LU O LT <IoCO Q
30
20
10
*' Huy *
**
T IT
CONVENTIONAL POST OBLONG PIPE
EDGE DRAIN TYPE
CUSP
EXPLANATION
>j< Data point is greater than 1.5 times the interquartile range from the box.
p- Largest data point lessthan or equal to the upper quartile plus 1.5 times the interquartile range.
75th Percentile
Median
25th Percentile
Smallest data point greater than or equal to the lower quartile minus 1.5 times the interquartile range.
Figure 6. Distribution of maximum discharges for each edge drain for 72 events, 1991 -93 for State Route 16 near Granville, Ohio. (All edge drains were installed under nearly equal geological and environmental conditions; however, a hole in the embankment was discovered approximately 41 feet from the upper observation port of the cusp edge drain (fig. 3). Some water flowing from the edge drain may have escaped laterally instead of flowing out the outlet pipe and through the gage.)
Discharge Characteristics of Highway Drainage Systems 11

ume data for each edge drain are summarized in figure 7 and table 2.
Table 2. Statistics for volumes for each edge drain for 55 events, 1991-93 for State Route 16 near Granville, Ohio[All units are in cubic feet and rounded to 3 significant digits; CV is the coefficient of variation; IQR is the interquartile range; Range is the maximum value minus the minimum value; Midrange is the value midway between the maximum and minimum values]
Edge drain type
Conven-Statistic
MeanStandard
deviationCVMinimumMaximumMedianIQR25th percentile75th percentileRangeMidrange
tional
16.1
15.5.963.620
67.611.216.75.53
22.267.034.1
Post
. 5.75
8.651.51.060
38.62.817.10
.677.77
38.519.3
Oblongpipe
18.9
13.4.708
1.8963.015.118.47.63
26.061.132.4
Cusp1
12.1
11.5.950.120
57.68.53
12.24.15
16.457.528.9
1 All edge drains were installed under nearly equal geological and environmental conditions; however, a hole in the embankment was discovered approximately 41 feet from the upper observation port of the cusp edge drain (fig. 3). Some water flowing from the edge drain may have escaped laterally instead of flowing out the outlet pipe and through the gage.
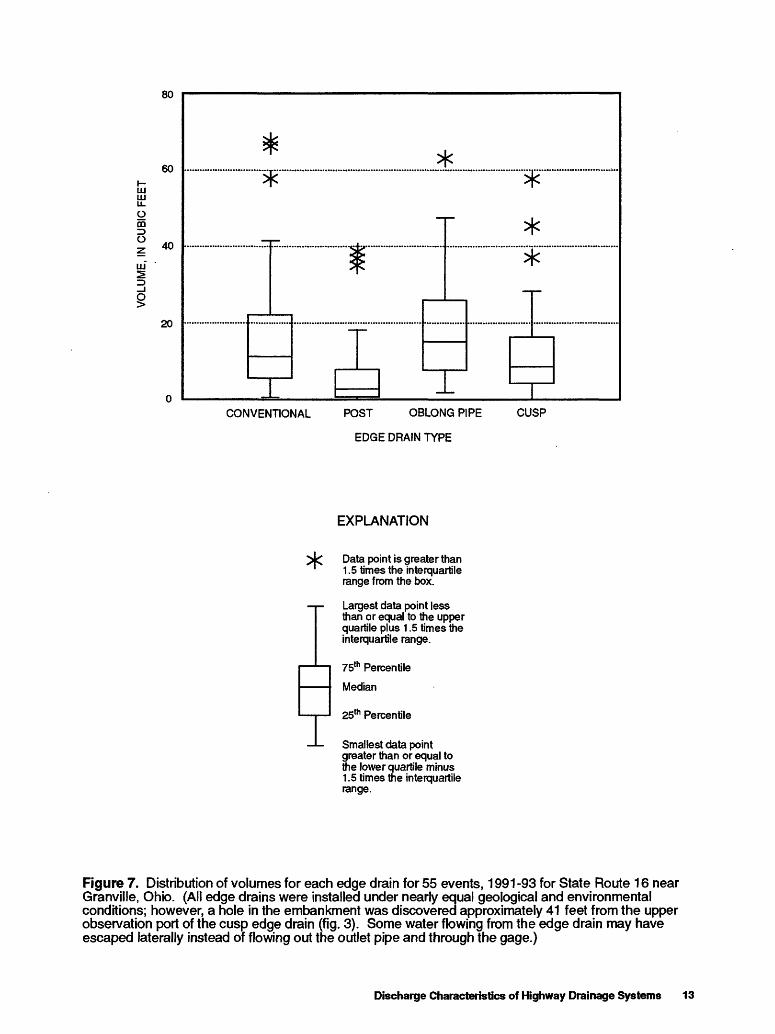
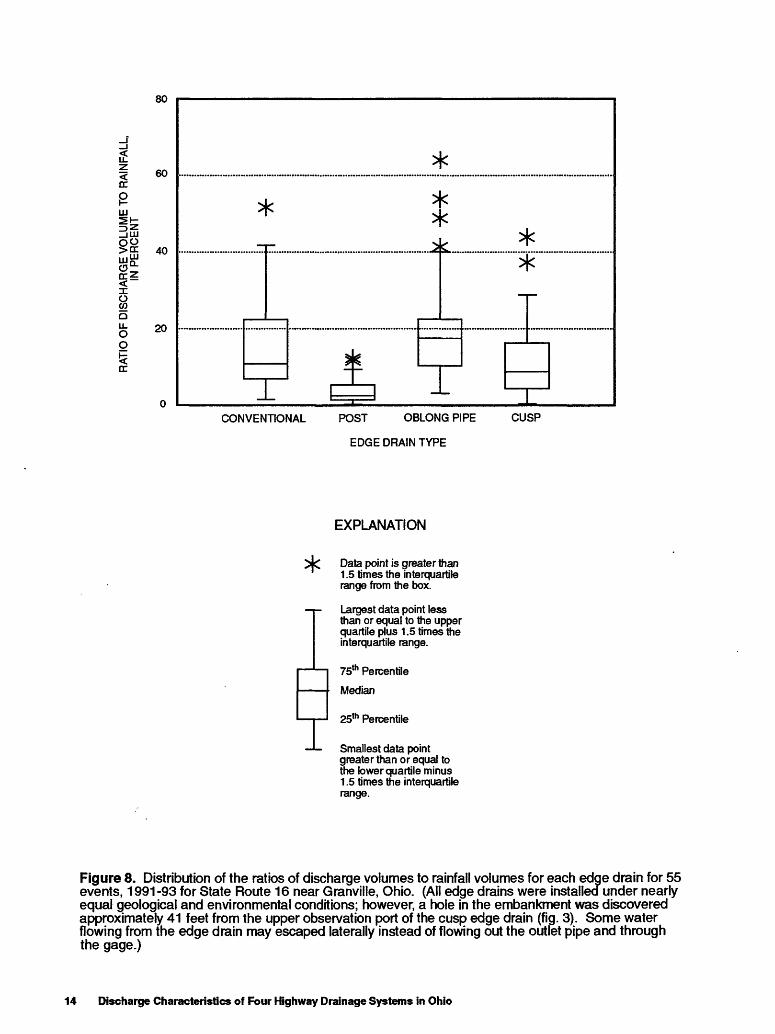
Runoff volumes for each edge drain were also presented as a ratio of the total rain falling over the contributing drainage areas. The rainfall volumes were computed as rainfall multiplied by the con tributing drainage area for each edge drain. Of course, not all the water falling onto the highway surface infiltrated into the edge drains; most of the water flowed over the sawn cut, across the shoulder surface and down the embankment, bypassing the edge drains altogether. The highest percentage of discharge volume to rainfall volume was 64.0 per cent for the oblong-pipe edge drain. The means and medians for this characteristic were all less than 20 percent for all four edge drains. The ratio of dis charge volumes to rainfall volumes is summarized in figure 8 and in table 3 to highlight the relation of the water exiting the edge drain to the amount of water entering the systems.
Table 3. Statistics for discharge volumes as a percent age of rainfall volume for each edge drain for 55 events, 1991-93 for State Route 16 near Granville, Ohio[All units are dimensionless and rounded to 3 significant digits; CV is the coefficient of variation; IQR is the interquartile range; Range is the maximum value minus the minimum value; Midrange is the value midway between the maximum and minimum values]
Edge drain type
Conven-Statistic
MeanStandard
deviationCVMinimumMaximumMedianIQR25th percentile75th percentileRangeMidrange
tional
15.0
11.6.772
1.4651.710.815.56.93
22.450.226.6
Post
3.49
2.98.855.210
12.32.533.971.365.33
12.16.26
Oblongpipe
19.0
12.2.641
3.1864.017.512.210.322.560.833.6
Cusp1
11.1
8.84.794.430
44.08.84
11.84.43
16.243.622.2
1 All edge drains were installed under nearly equal geological and environmental conditions; however, a hole in the embankment was discovered approximately 41 feet from the upper observation port of the cusp edge drain (fig. 3). Some water flowing from the edge drain may have escaped laterally instead of flowing out the outlet pipe and through the gage.
Threshold-based volumes also were computed for the comparison of the four edge drains. A threshold-based volume is defined as the quantity of water from the beginning of the selected event to the time when the discharge falls below 20 percent of the maximum discharge of the hydrograph of each edge drain. The threshold for most of the small events occurred when the discharge for an interval equaled zero. The threshold-based vol umes were computed to analyze the volumes of the edge drains without the long, flat recession discharge included in the hydrographs. The threshold-based volumes were smaller than the regular volumes for each edge drain, but the com parison of the threshold-based volumes was similar to the comparison of the regular volumes. There fore, the results of the threshold-based volumes are not presented in this report.
12 Discharge Characteristics of Four Highway Drainage Systems in Ohio
80
60
UJw u_o mO
UJ5
§
40
20
CONVENTIONAL POST OBLONG PIPE
EDGE DRAIN TYPE
CUSP
EXPLANATION
>j< Data point is greater than 1.5 times the interquartile range from the box.
p- Largest data point lessthan or equal to the upper quartile plus 1.5 times the interquartile range.
75th Percentile
Median
25th Percentile
Smallest data point greater than or equal to the lower quartile minus 1.5 times the interquartile range.
Figure 7. Distribution of volumes for each edge drain for 55 events, 1991-93 for State Route 16 near Granyille, Ohio. (All edge drains were installed under nearly equal geological and environmental conditions; however, a hole in the embankment was discovered approximately 41 feet from the upper observation port of the cusp edge drain (fig. 3). Some water flowing from the edge drain may have escaped laterally instead of flowing out the outlet pipe and through the gage.)
Discharge Characteristics of Highway Drainage Systems 13
80
60
UJII40
oCOo u_o 20
**
CONVENTIONAL POST OBLONG PIPE
EDGE DRAIN TYPE
CUSP
EXPLANATION
Data point is greater than 1.5 times the interquartile range from the box.
Largest data point less than or equal to the upper quartile plus 1.5 times the interquartile range.
75th Percentile
Median
25th Percentile
Smallest data point greater than or equal to the lower quartile minus 1.5 times the interquartile range.
Figure 8. Distribution of the ratios of discharge volumes to rainfall volumes for each edge drain for 55 events, 1991-93 for State Route 16 near Granville, Ohio. (All edge drains were installed under nearly equal geological and environmental conditions; however, a hole in the embankment was discovered approximately 41 feet from the upper observation port of the cusp edge drain (fig. 3). Some water flowing from the edge drain may escaped laterally instead of flowing out the outlet pipe and through the gage.)
14 Discharge Characteristics of Four Highway Drainage Systems in Ohio

Lag Times
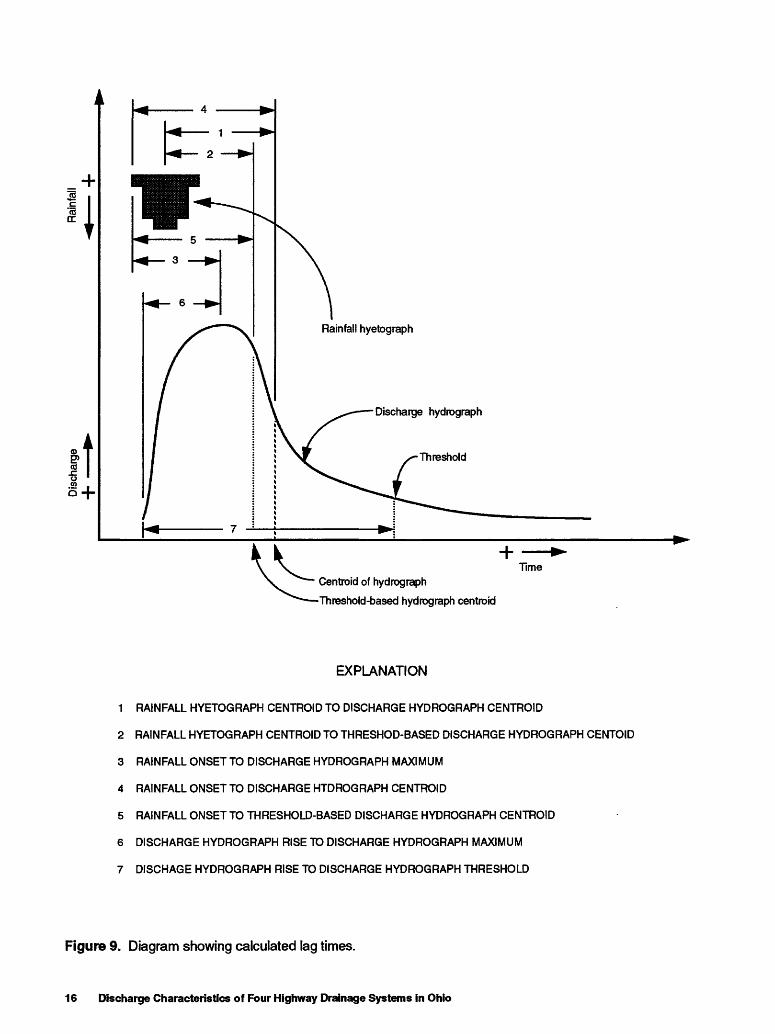
Events used to calculate lag times for this anal ysis were carefully selected on the assumption that all edge drain gages and the rainfall gage were functioning properly and that a clear beginning and ending of the event could be determined. Some event characteristics were avoided. In particular, multiple peaks, where the recession of the hydro- graph falls below the threshold and then increases again during an event, were discarded unless the peaks could be analyzed separately. A total of 51 events were used for the analysis of lag times. The centroid of each discharge hydrograph and the centroid of each rainfall hyetograph were calcu lated for each event for all four edge drains. The threshold-based hydrograph centroids were also calculated for each edge drain. Lag times were computed for the following event characteristics: (1) the time from the centroid of the rainfall hyeto graph to the centroid of the discharge hydrograph for each edge drain, (2) the time from the centroid of the rainfall hyetograph to the centroid of the threshold-based discharge hydrograph for each edge drain, (3) the time from the rainfall onset to the maximum discharge for each edge drain,(4) the time from the rainfall onset to the centroid of the discharge hydrograph for each edge drain,(5) the time from the rainfall onset to the threshold- based centroid of the discharge hydrograph for each edge drain, (6) the time from each hydrograph rise to its own maximum peak discharge, and (7) the time from each hydrograph rise to its own threshold. The lag times for the seven different event characteristics are illustrated in figure 9.
Because of the similarity of the data sets, only the lag times between rainfall centroid and hydro- graph centroid (number 1) and the rainfall onset and hydrograph maximum (number 3) are dis cussed in this report. Most of the other lag times produced similar results to the centroid to centroid lag time (number 1). The only exception to the similarity is the lag time between rainfall onset and maximum discharge (number 3). All the lag times were calculated to provide a detailed analysis of the event characteristics, but other than the two lag times presented, the additional lag time analyses do not contribute much additional information.
The existing conditions before each rainfall- runoff event were carefully examined. For many of the events, discharge registered on or before the same time interval as the rainfall. If the rainfall tip ping bucket was empty and the discharge tipping bucket was nearly full, then the discharge bucket probably tipped on or before the interval in which the rain registered. Also, the sawn cut in the high way surface and the reflective cracks increased the infiltration rate of the water to the edge drains. For events in which discharge registered in the interval before the rainfall registered, the lag times were computed as if the discharge and the rainfall occurred in the same time interval.
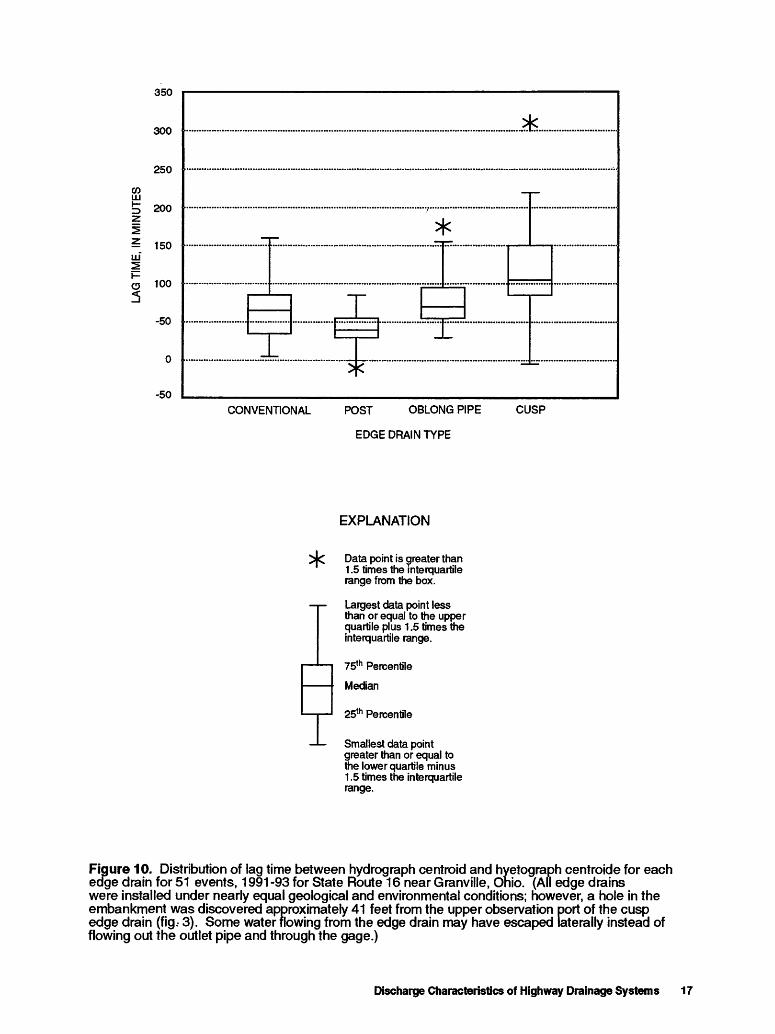
The lag times between the rainfall centroid and the discharge hydrograph centroid (number 1) were similar for the conventional and oblong- pipe edge drains. The post edge drain had the shortest mean lag time between the centroid of the rainfall hyetograph and the centroid of each edge drain hydrograph (table 4).
Table 4. Statistics for lag times between hydrograph centroid and hyetograph centroid for each edge drain for 51 events, 1991-93 for State Route 16 near Granville, Ohio[All units are in minutes and rounded to 3 significant digits; CV is the coefficient of variation; IQR is the interquartile range; Range is the maximum value minus the minimum value; Midrange is the value midway between the maximum and minimum values]
Edge drain type
Conven- Statistic tional
Mean 63.9Standard
deviation 33.2CV .520Minimum 5Maximum 160Median 65IQR 5025th percentile 3575th percentile 85Range 155Midrange 82.5
Post
37.4
20.8.557
-1085402530559537.5
Oblong pipe
78.3
31.0.395
3017570405595
145102
Cusp1
119
54.9.462
-53101056585
150315152
1 All edge drains were installed under nearly equal geological and environmental conditions; however, a hole in the embankment was discovered approximately 41 feet from the upper observation port of the cusp edge drain (fig. 3). Some water flowing from the edge drain may have escaped laterally instead of flowing out the outlet pipe and through the gage.
Discharge Characteristics of Highway Drainage Systems 15
ITime
Centroid of hydrograph
Threshold-based hydrograph centroid
EXPLANATION
1 RAINFALL HYETOGRAPH CENTROID TO DISCHARGE HYDROGRAPH CENTROID
2 RAINFALL HYETOGRAPH CENTROID TO THRESHOD-BASED DISCHARGE HYDROGRAPH CENTOID
3 RAINFALL ONSET TO DISCHARGE HYDROGRAPH MAXIMUM
4 RAINFALL ONSET TO DISCHARGE HTDROGRAPH CENTROID
5 RAINFALL ONSET TO THRESHOLD-BASED DISCHARGE HYDROGRAPH CENTROID
6 DISCHARGE HYDROGRAPH RISE TO DISCHARGE HYDROGRAPH MAXIMUM
7 DISCHAGE HYDROGRAPH RISE TO DISCHARGE HYDROGRAPH THRESHOLD
Figure 9. Diagram showing calculated lag times.
16 Discharge Characteristics of Four Highway Drainage Systems in Ohio
aou
OUV
£.\J\J
CO 111^> ^OOz 2
ui10 100
3ww
0
-50
JLI
j-
J _ .>K
1
_
l«
_
5|ls___
CONVENTIONAL POST OBLONG PIPE CUSP
EDGE DRAIN TYPE
EXPLANATION
>j< Data point is greater than 1.5 times the interquartile range from the box.
| Largest data point lessthan or equal to the upper quartile plus 1.5 times the interquartile range.
75th Percentile
Median
25th Percentile
Smallest data point greater than or equal to the lower quartile minus 1.5 times the interquartile range.
Figure 10. Distribution of lag time between hydrograph centroid and hyetograph centroide for each edge drain for 51 events, 1991-93 for State Route 16 near Granville, Ohio. (All edge drains were installed under nearly equal geological and environmental conditions; however, a hole in the embankment was discovered approximately 41 feet from the upper observation port of the cusp edge drain (fig.- 3). Some water flowing from the edge drain may have escaped laterally instead of flowing out the outlet pipe and through the gage.)
Discharge Characteristics of Highway Drainage Systems 17
«IUU
OOU
<0 ocnLU <»U
r> z OAA
Z
m 150
PO ^ irw^
-50
0
-SO
>|<
* ' *
* T T
*
CONVENTIONAL POST OBLONG PIPE
EDGE DRAIN TYPE
CUSP
EXPLANATION
>j< Data point is greater than 1.5 times the interquartile range from the box.
Largest data point less than or equal to the upper quartile plus 1.5 times the interquartile range.
75th Percentite
Median
25th Percentile
Smallest data point greater than or equal to the lower quartile minus 1.5 times the interquartile range.
Figure 11. Distribution of lag time between rainfall and maximum discharge for each edge drain for 51 events, 1991-93 for State Route 16 near Granyille, Ohio. (All edge drains were installed under nearly equal geological and environmental conditions; however, a hole in the embankment was discovered approximately 41 feet from the upper observation port of the cusp edge drain (fig. 3). Some water flowing from the edge drain may have escaped laterally instead of flowing out the outlet pipe and through the gage.)
18 Discharge Characteristics of Four Highway Drainage Systems in Ohio
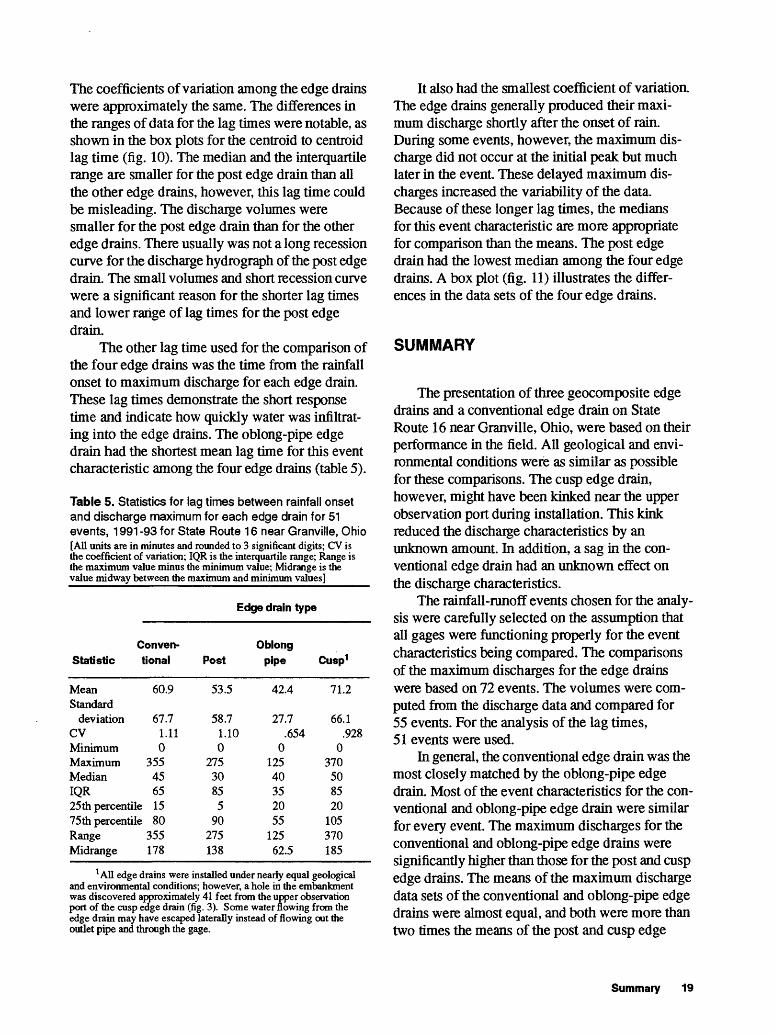
The coefficients of variation among the edge drains were approximately the same. The differences in the ranges of data for the lag times were notable, as shown in the box plots for the centroid to centroid lag time (fig. 10). The median and the interquartile range are smaller for the post edge drain than all the other edge drains, however, this lag time could be misleading. The discharge volumes were smaller for the post edge drain than for the other edge drains. There usually was not a long recession curve for the discharge hydrograph of the post edge drain. The small volumes and short recession curve were a significant reason for the shorter lag times and lower range of lag times for the post edge drain.
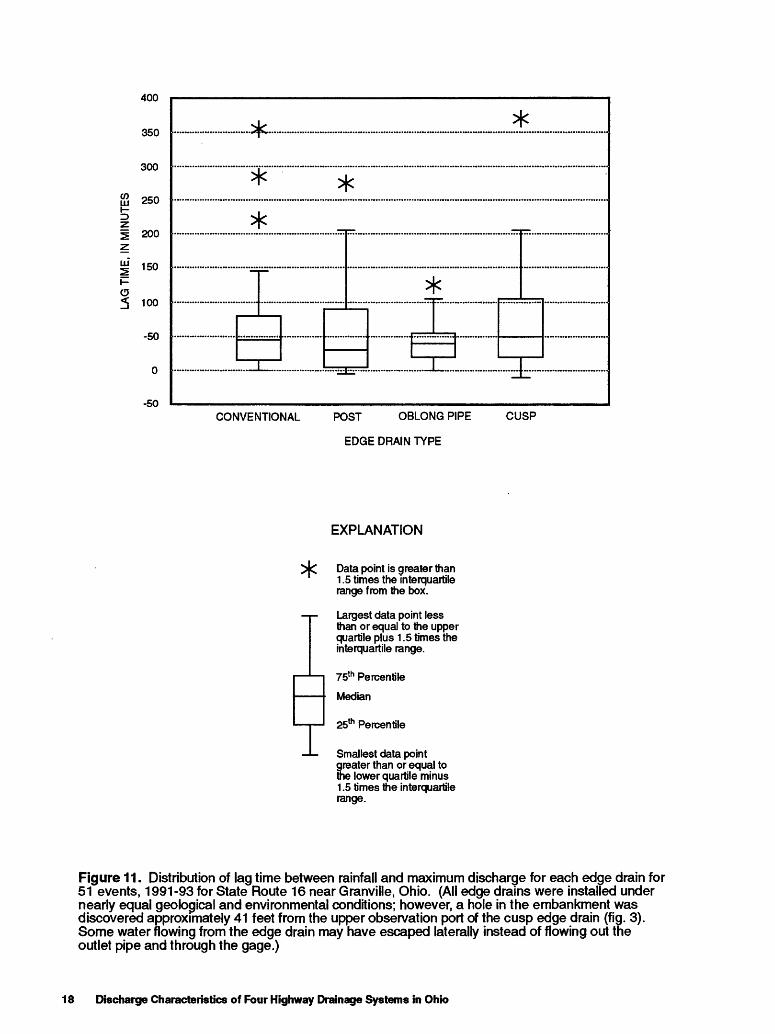
The other lag time used for the comparison of the four edge drains was the time from the rainfall onset to maximum discharge for each edge drain. These lag times demonstrate the short response time and indicate how quickly water was infiltrat ing into the edge drains. The oblong-pipe edge drain had the shortest mean lag time for this event characteristic among the four edge drains (table 5).
Table 5. Statistics for lag times between rainfall onset and discharge maximum for each edge drain for 51 events, 1991-93 for State Route 16 near Granville, Ohio[All units are in minutes and rounded to 3 significant digits; CV is the coefficient of variation; IQR is the interquartile range; Range is the maximum value minus the minimum value; Midrange is the value midway between the maximum and minimum values]
Edge drain type
Conven-
Slatistic tional
Mean 60.9Standard
deviation 67.7CV 1.11Minimum 0Maximum 355Median 45IQR 6525th percentile 1575th percentile 80Range 355Midrange 178
Post
53.5
58.71.100
27530855
90275138
Oblong pipe
42.4
27.7.654
012540352055
12562.5
Cusp1
71.2
66.1.928
0370508520
105370185
1 All edge drains were installed under nearly equal geological and environmental conditions; however, a hole in the embankment was discovered approximately 41 feet from the upper observation port of the cusp edge drain (fig. 3). Some water flowing from the edge drain may have escaped laterally instead of flowing out the outlet pipe and through the gage.
It also had the smallest coefficient of variation. The edge drains generally produced their maxi mum discharge shortly after the onset of rain. During some events, however, the maximum dis charge did not occur at the initial peak but much later in the event These delayed maximum dis charges increased the variability of the data. Because of these longer lag times, the medians for this event characteristic are more appropriate for comparison than the means. The post edge drain had the lowest median among the four edge drains. A box plot (fig. 11) illustrates the differ ences in the data sets of the four edge drains.
SUMMARY
The presentation of three geocomposite edge drains and a conventional edge drain on State Route 16 near Granville, Ohio, were based on their performance in the field. All geological and envi ronmental conditions were as similar as possible for these comparisons. The cusp edge drain, however, might have been kinked near the upper observation port during installation. This kink reduced the discharge characteristics by an unknown amount. In addition, a sag in the con ventional edge drain had an unknown effect on the discharge characteristics.
The rainfall-runoff events chosen for the analy sis were carefully selected on the assumption that all gages were functioning properly for the event characteristics being compared. The comparisons of the maximum discharges for the edge drains were based on 72 events. The volumes were com puted from the discharge data and compared for 55 events. For the analysis of the lag times, 51 events were used.
In general, the conventional edge drain was the most closely matched by the oblong-pipe edge drain. Most of the event characteristics for the con ventional and oblong-pipe edge drain were similar for every event. The maximum discharges for the conventional and oblong-pipe edge drains were significantly higher than those for the post and cusp edge drains. The means of the maximum discharge data sets of the conventional and oblong-pipe edge drains were almost equal, and both were more than two times the means of the post and cusp edge
Summary 19
drains. The median for the oblong-pipe, how ever, was higher than that of the conventional edge drain.
The results of the volumes comparison were similar to the results of the maximum-discharge comparison. The conventional and oblong-pipe edge drains produced the highest volumes and highest percentages of rain volumes among the four edge drains. The mean and median for the oblong-pipe, however, were slightly higher than those of the conventional edge drain. The means of the discharge volumes as a percentage of the rain fall volumes were all relatively low (less than 20 percent) because most of the rain falling on the highway was assumed to have bypassed the edge drains. The post edge drain had the smallest vol umes and percentages of rain volume among all four edge drains.
The lag times for the conventional and oblong- pipe edge drains were also similar for most of the event characteristics compared. The mean and median of the conventional edge drain were slightly shorter than those of the oblong-pipe edge drain for most of the lag times computed;
however, the post edge drain usually had the short est lag time for most of the selected event charac teristics. This finding could be attributed to the small amount of discharge from the post edge drain. The only lag time that does not follow this general pattern is the rainfall onset to maximum discharge lag time. The oblong-pipe edge drain usually had the shortest lag time for this event characteristic.
REFERENCES CITED
Jeffcoat, H.H., Kilpatrick, F.A., Atkins, J.B., and Pearman, J.L., 1992, Effectiveness of high way edge drains: U.S. Geological Survey Water-Resources Investigations Report 92-4147,79 p.
Hinshaw, K.T., 1988, Hydraway edge drain in Ohio, in National Research Council, Transportation Research Board, Prefabricate Washington, D.C., Transportation Research Record 1159, p. 30-38.
20 Discharge Characteristics of Four Highway Drainage Systems in Ohio