characteristics of watershed€¦ · characteristics of watershed restoration funding 3 abstract...
TRANSCRIPT
Characteristics of Watershed Restoration Funding 1The PoliTical economy of WaTershed resToraTion series 2009
Characteristics of Watershed Restoration Funding
By Josh hurd, Wildlands CPrin ConJunCtion With the national Forest restoration CollaBorative

Characteristics of Watershed Restoration Funding2
AcknowledgementsFunding to develop and produce this report was provided by the Ford Foundation (through a grant to the National Forest Restoration Collaborative) and the Page and Cinnabar Foundations (through grants to Wildlands CPR). J. Mark Baker, Ken Bierly, Marnie Criley, and Bethanie Walder all provided important feedback on this report. Any remaining errors or lack of clarity are the sole responsibility of the author.
About the AuthorBorn and raised in Montana, Josh Hurd graduated Phi Beta Kappa from Dartmouth College in 2008 with a degree in Environmental Studies and Public Policy. He has undertaken research for the Dartmouth College Sustainability Office, Rockefeller Center for Public Policy, and Vermont Fish, Wildlife, and Water Resources Committee. He joined Wildlands CPR’s staff in June 2007, and is currently pursuing a Master of Public Policy at the Harris School of Public Policy Studies at the University of Chicago.
Project PartnersThe National Forest Restoration Collaborative is comprised of environmental and community-based forestry groups dedicated to providing national leadership to advance comprehensive forest and watershed restoration that is ecologi-cally sound and benefits rural communities.
Wildlands CPR revives and protects wild places by promoting watershed restoration to improve fish and wildlife habitat, provide clean water and enhance community economies. We focus on reclaiming ecologically damaging, un-needed roads and on stopping off-road vehicle abuse.
American Lands Alliance’s mission is to protect and restore America’s forest ecosystems by providing national leader-ship, coordination and capacity building for the forest conservation movement.
Cite this report as:Hurd, Josh. 2009. Characteristics of Watershed Restoration Funding. In The Political Economy of Watershed Restoration Series. Missoula, MT: Wildlands CPR.
This report is also available online at:http://www.wildlandscpr.org/politicaleconomy/funding
Wildlands CPRP.O. Box 7516Missoula, MT 59807(406) 543-9551http://www.wildlandscpr.org

Characteristics of Watershed Restoration Funding 3
AbstractRestoration projects throughout the country are funded through a variety of means. By understand-ing what these mechanisms are, and general trends in their use, the public can be better informed about how to increase funding for restoration activities. This report analyzes funding in the states of California, Montana, and Oregon; Humboldt County within California; and the watersheds of Lake Tahoe, Puget Sound, the Everglades, and Chesapeake Bay. State and local governments in these places usually provide the majority of funds for watershed restoration projects, although the federal govern-ment does contribute significantly to the costs. Certain areas of federal spending are difficult to track, however, thus this report may underestimate federal funding levels. The large-scale and consistently viable restoration projects in this report have a variety of different funding mechanisms, coming from multiple levels of government. Bonds, general fund revenues, and dedicated funding streams fund most restoration efforts. A heavy reliance on issuing debt, however, may harm the continuance of some projects.

Characteristics of Watershed Restoration Funding4
types of restoration projects.2 This search yielded 2,027 different projects and 79 different funding programs be-tween 1980 and 2009. Some projects were funded by more than one program. Because this survey was key-word based (no specific restoration categories within the database exist), the analyzed projects are just a sample of all watershed restoration projects within California. Furthermore, the analysis just looked at specific fund-ing programs, not general agency support. For example, between 1997 and 2005 the U.S. National Park Service contributed $3.1 million to decommission unneeded facilities in the Giant Forest Village, restoring soil and
2 Information Center for the Environment. 2008. The Natural Resource Projects Inventory. University of California Davis 2008 [cited December 3 2008]. Available from http://www.ice.ucdavis.edu/nrpi/Home.aspx. The following keywords were searched: “culvert removal,” “culvert replacement,” “remove culvert,” “repair culvert,” “replace culvert,” “culvert repair,” “culvert installation,” “culvert removal,” “culvert upgrade,” “road decommission,” “road decommissioning,” “road removal,” “habitat improvement,” “habitat restoration,” “stream restoration,” “wetland restoration,” “river restoration,” and “watershed restoration.”
Local, state, and federal governments are the primary funders of watershed restoration activities. This occurs largely because few markets exist for the products that arise from healthy watersheds, and privately funded res-toration initiatives rarely have the capacity to fully fund
restoration. Other research has described many of these government-sponsored funding programs, but little analysis exists on the characteristics of watershed resto-ration funding as a whole. As described below, funding watershed restoration is complicated, and the current recession has affected the long-term viability of certain funding mechanisms.
This report analyzes the funding environment of water-shed restoration for major watershed restoration proj-ects.1 It describes the funding environment for water-shed restoration activities in the states of California, Montana, and Oregon; in Humboldt County, Califor-nia; and in the watersheds of Lake Tahoe, Puget Sound, the Everglades, and Chesapeake Bay. These areas were chosen because of their long-standing restoration efforts and documented funding history. Second, it analyzes the trends of watershed restoration funding that emerge from the eight case studies. The report concludes with a discussion of the trends within the current watershed restoration funding environment.
CaliforniaCalifornia is a leader in watershed restoration, with nu-merous programs to alleviate accumulated impacts of resource extraction and development. The state uses a variety of programs to fund this work. In order to bet-ter understand how the various watershed restoration projects are funded, a search of the California Natural Resource Projects Inventory, a comprehensive statewide database of natural resource projects administered by the University of California Davis, was conducted for various
1 The author deemed a project restoration-related if it fit the Society for Ecological Restoration’s definition of ecological restoration and watershed-related if the project intended to affect an entire watershed. SER’s definition is: “Ecological restoration is the process of assisting the recovery of an ecosystem that has been degraded, damaged, or destroyed.” Society for Ecological Restoration. 2005. The SER International Primer on Ecological Restoration. Tudson: Society for Ecological Restoration.
Funding ProgramProjects Funded
Fisheries Restoration Grant Program 992US EPA 319(h) Grant 182CALFED Ecosystem Restoration Program 113Urban Streams Restoration Program 92Resource Enhancement Program 71Commercial Salmon Stamp Account 63Noxious Weed Program 63US EPA 205j Grant 56CALFED Watershed Program 37Environmental Quality Incentive Program 31San Francisco Bay Program 29Non-point Source Pollution Control Program 26San Francisco Bay Fund 20Jobs-in-the-Woods Watershed Restoration Program
15
Integrated Coastal and Marine Resources Program
13
Anadromous Fisheries Restoration Program 11Coastal Non-point Source Pollution Control Program
11
Integrated Watershed Management Program 11Watershed Management Program 10
Table 1: Top 20 California funding programs and the num-ber of projects they have funded between 1980 and 2009, based on keyword search of California Natural Resource Projects Inventory for watershed restoration projects.2
Local, state, and national governments are the primary funders of restoration activities

Characteristics of Watershed Restoration Funding 5
native vegetation in their sites.3 According to the Cali-fornia Natural Resource Projects Inventory, this project was supported by general agency funds, not a specific funding program. Because of this it was unable to be in-cluded in the analysis on California funding programs.
According to the survey, the Fisheries Restoration Grant Program (FRGP) of the California Department of Fish and Game funded the majority (50 percent) of water-shed restoration projects (Table 1). The California Leg-
islature created the FRGP in 1981 to protect salmon and steelhead trout populations. The Pacific Coastal Salmon Recovery Fund (PCSRF), administered by the National Oceanic and Atmospheric Administration, in turn capitalizes the majority of the FRGP. The PC-SRF, in turn, is funded through general appropriations by the U.S. Congress, but requires at least a 25-percent match from the state.4 Many state sources, including the
3 Information Center for the Environment. 2008. NRPI - Giant Forest Restoration 2008 [cited December 3 2008]. Available from http://www.ice.ucdavis.edu/nrpi/project.asp?ProjectPK=4167.4 California Department of Fish and Game. 2008. Fisheries Restoration Grant Program: Salmon and Steelhead Fire Relief: 2008 Proposal Solicitation Notice. Sacramento, CA.
California Resource Trust Fund, Proposition 13 (2000), Proposition 40 (2002), and the State General Fund, contribute to the FRGP as well.5 Overall, from 2000 to 2008, the federal government contributed $73 million and the state contributed $56 million to the fund. Of that $56 million state contribution, $41 million came
from bond revenues.6 After the FRGP, the second most common funding stream for California watershed res-toration projects is Environmental Protection Agency 319(h) Grants, which the US Congress implemented in 1987 to help states control non-point source pollution. Section 319(h) Grants, named after their enabling sec-tion in the Clean Water Act, are distributed from the federal government directly to the states, and require a local match.7 The third most common funding program is the CALFED Watershed Program. This program was initiated in 1998 in order to protect water quality within the Sacramento-San Joaquin Delta. Bond revenues from Proposition 50 (2002), a $3.4 billion citizen-sponsored initiative passed by California voters in 2002; Proposi-
5 Ibid.6 Ibid.7 Environmental Protection Agency. 2008. Clean Waters Act Section 319 2008 [cited December 16 2008]. Available from http://www.epa.gov/nps/cwact.html.
Date Number Title Method% Ap-proving
Restoration Revenues
Total Rev-enues
Total Costs
7-Mar-00 Prop 13 Safe Drinking Water, Clean Water, Watershed Protection, and Flood Protection Bond Act
Act 64.8 $468 $1,970 $3,400
5-Mar-02 Prop 40 The California Clean Water, Clean Air, Safe Neighborhood Parks, and Coastal Protection Act of 2002
Act 56.9 $1,045 $2,600 $4,300
5-Nov-02 Prop 50 Water Quality, Supply and Safe Drinking Water Projects. Coastal Wetlands Purchase and Protection
Initiative 55.4 $860 $3,440 $5,700
7-Nov-06 Prop 84 Water Quality, Safety and Supply. Flood Control. Natural Resource Protection. Park Improvements
Initiative 53.7 $928 $5,400 $10,500
Table 2: Partial listing of California general obligations bonds whose revenues went to fund watershed restoration. Pro-grams were deemed to be restoration-related if they fit the Society for Ecological Restoration’s definition of ecological restoration and watershed-related if the programs intended to affect an entire watershed.9
General obligation bonds finance the majority of California’s restoration activities, with over $13 billion raised for water-related projects this way
The Fisheries Restoration Grant Program of the California Department of Fish and Game funded the majority of watershed restoration projects in
California

Characteristics of Watershed Restoration Funding6
tion 84, a $5.4 billion citizen-sponsored initiative passed by California voters in 2006; money from California’s general fund, and matching federal contributions, cur-rently fund the CALFED watershed program.8
As seen in the above analysis, general obligation bonds, approved through ballot initiatives, finance much of California’s restoration activities. Since 2000, the state has raised over $13 billion for water-related projects through the issuance of these bonds (Table 2). Of this, $3.3 billion has gone to watershed restoration and pro-tection. One issue with bonds, however, is that they cost significantly more money than they raise. In order to raise such large sums of money up front, the state must offer a return on investment for the bondholders. This interest rate is usually between four and six percent per year.9 Therefore, even though California received $13 billion to spend on water-related projects through the four bond propositions listed above, the state must ultimately pay $23.9 billion.10 The general public ap-pears increasingly less willing to support bond-funded restoration programs, as the margin of victory for the measures has steadily decreased, from 30-percent in 2000 to 8-percent in 2006.11 Most important for future prospects of paying for California’s restoration programs through debt, California now has the lowest credit rat-ing out of all 50 states,12 which likely will significantly increase the cost of borrowing money, assuming buyers of the debt can be found.13
8 State of California. 2008. CALFED Bay-Delta Program 2007 [cited December 16 2008]. Available from http://calwater.ca.gov/index.aspx; California Attorney General. 2006. Proposition 84: Water Quality, Safety and Supply. Flood Control. Natural Resources Protection. Park Improvements. Bonds. Initiative Statute. Sacramento, CA.9 California Attorney General. 2006. Proposition 84: Water Quality, Safety and Supply. Flood Control. Natural Resources Protection. Park Improvements. Bonds. Initiative Statute. Sacramento, CA, California Resources Agency. 2003. Summary of Programs in Proposition 40, Institute of Governmental Studies. 2008. Proposition 84: Safe Drinking Water Act of 2006. University of California Berkeley 2006 [cited December 17 2008]. Available from http://igs.berkeley.edu/library/election2006/Prop84.html, League of Women Voters of California. 2009. Lwvc Position on Proposition 13 2000 [cited March 5 2009]. Available from http://ca.lwv.org/action/prop0003/prop13.html, ———. 2009. Proposition 50 in Depth 2002 [cited March 5 2009]. Available from http://ca.lwv.org/lwvc/edfund/elections/2002nov/id/prop50.html, ———. 2009. In Depth Analysis of Prop 40 2002 [cited March 5 2009]. Available from http://ca.lwv.org/lwvc/edfund/elections/2002mar/id/prop40.html.10 Ibid.11 Ibid.12 Palmeri, Christopher, and Elise Craig. 2009. Banks Turn the Screws on California. Business Week, July 9, 2009.13 Beckett-Camarata, Jane. 2009. The Current Impact of the Tightening Credit Market on Municipal Borrowing Costs: A Case Study. Municipal Finance Journal 29:77-86.
MontanaSince the election of Brian Schweitzer as governor in 2004, Montana has touted the importance of building a restoration economy.14 The state funds watershed res-toration efforts through an unusual mix of mechanisms. Liability settlements—resulting from state-initiated law-
suits against polluting mining companies—historically have financed the majority of restoration activities within the state (Figure 1).15 Also important are grant programs funded by state severance taxes on resource extraction, such as the Resource Indemnity Trust or the Coal Sev-erance Tax Trust Fund. The Resource Indemnity Trust generates revenue through interest on the trust, and an extraction tax on mining, extracting, and producing min-erals, at a rate between 0.5-percent and 10-percent, de-
14 Frederick, Morgan. 2009. Environmental Restoration Is Big Business. The Missoulian, February 25, 2008.15 Johnson, Breeann. 2006. Opportunities for Investing in Restoration Work in Montana. Missoula, MT: Wildlands CPR.
Figure 1: Montana spending on watershed restora-tion activities according to the sources of funding
for programs, 2000-2005. Does not include all federal sources.15
Severance Taxes!
32%!
General Appropriations!
0%!
Litigation!
54%!
Federal Gov't!
14%!
Lawsuits against polluting mining companies have financed much of Montana’s restoration
activities
Characteristics of Watershed Restoration Funding 7
more funding mechanisms exist that are either not easily tracked or not run by the state. The Forest Service funds many watershed restoration activities each year on its lands in Montana, including approximately $3 million in 2008 from the Legacy Roads and Trails Remediation
Initiative.21 Furthermore, the Milltown Dam removal and restoration on the Clark Fork River is costing more than $200 million over the course of a decade, with the majority of funds coming from the Atlantic Richfield Company.22 The variety of funding sources and con-stantly changing restoration programs make Montana’s watershed restoration economy difficult to generalize.
OregonA variety of watershed restoration activities take place in Oregon, largely to restore salmon and steelhead habi-tat after years of resource-extraction and development-caused ecological decline.23 Little data exists that sum-marizes the funding of restoration in the state as a whole, but data does exist on the Oregon Plan for Salmon and Watersheds (Oregon Plan), which the Oregon Watershed Enhancement Board (OWEB) administers. The Oregon Plan, which is the state-coordinated plan to protect and restore water quality and wildlife habitat, received a total of $123.8 million in funding between 2006 and 2007.24 Of that amount, 44 percent came from the federal gov-ernment, 23 percent from the state, 13 percent from pri-vate parties, 5 percent from municipal and county gov-ernments, and 16 percent from other sources.25 While OWEB administers the Oregon Plan, it has a dedicated
21 Wildlands CPR. 2009. Legacy Roads and Trails Funding Data Released. United States Forest Service 2008 [cited April 1 2009]. Available from http://www.wildlandscpr.org/our-news/legacy-roads-and-trails-funding-data-released.22 Frederick, Morgan. 2009. Environmental Restoration Is Big Business. The Missoulian, February 25, 2008.23 Oregon Watershed Enhancement Board. 2008. Oregon Plan Biennial Report 2007 - 2009. Salem, Oregon.24 Ibid.25 Oregon Watershed Enhancement Board. 2008. Oregon Plan Biennial Report 2007 - 2009. Salem, Oregon.
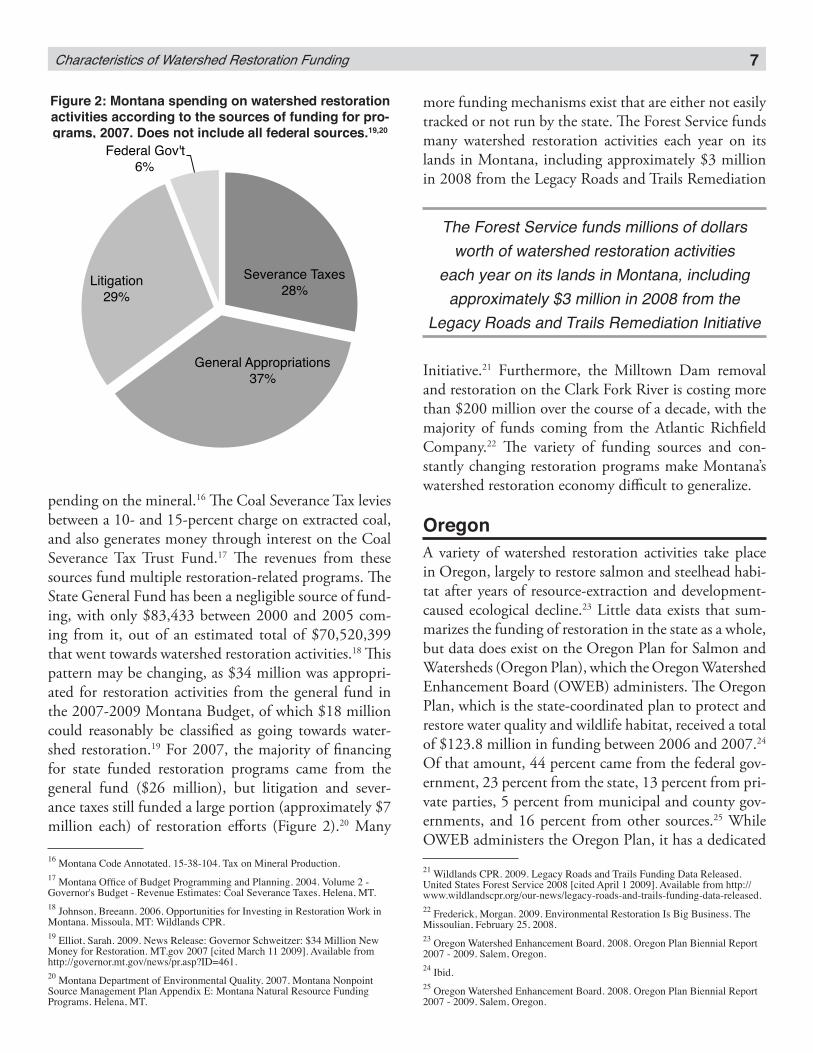
pending on the mineral.16 The Coal Severance Tax levies between a 10- and 15-percent charge on extracted coal, and also generates money through interest on the Coal Severance Tax Trust Fund.17 The revenues from these sources fund multiple restoration-related programs. The State General Fund has been a negligible source of fund-ing, with only $83,433 between 2000 and 2005 com-ing from it, out of an estimated total of $70,520,399 that went towards watershed restoration activities.18 This pattern may be changing, as $34 million was appropri-ated for restoration activities from the general fund in the 2007-2009 Montana Budget, of which $18 million could reasonably be classified as going towards water-shed restoration.19 For 2007, the majority of financing for state funded restoration programs came from the general fund ($26 million), but litigation and sever-ance taxes still funded a large portion (approximately $7 million each) of restoration efforts (Figure 2).20 Many
16 Montana Code Annotated. 15-38-104. Tax on Mineral Production.17 Montana Office of Budget Programming and Planning. 2004. Volume 2 - Governor's Budget - Revenue Estimates: Coal Severance Taxes. Helena, MT.18 Johnson, Breeann. 2006. Opportunities for Investing in Restoration Work in Montana. Missoula, MT: Wildlands CPR.19 Elliot, Sarah. 2009. News Release: Governor Schweitzer: $34 Million New Money for Restoration. MT.gov 2007 [cited March 11 2009]. Available from http://governor.mt.gov/news/pr.asp?ID=461.20 Montana Department of Environmental Quality. 2007. Montana Nonpoint Source Management Plan Appendix E: Montana Natural Resource Funding Programs. Helena, MT.
The Forest Service funds millions of dollars worth of watershed restoration activities
each year on its lands in Montana, including approximately $3 million in 2008 from the
Legacy Roads and Trails Remediation Initiative
Figure 2: Montana spending on watershed restoration activities according to the sources of funding for pro-grams, 2007. Does not include all federal sources.19,20
Severance Taxes!
28%!
General Appropriations!
37%!
Litigation!
29%!
Federal Gov't!
6%!
Characteristics of Watershed Restoration Funding8
Humboldt CountyHumboldt County, California is a leader in watershed restoration, with more than $65 million in restoration activities between 1995 and 2002.33 Citizen-initiated restoration in Humboldt County began in the early 1960s. In 1978 the U.S. Congress appropriated $33 mil-
lion to restore damaged lands within Redwood National Park.34 This infusion jump-started Humboldt County’s restoration economy. Subsequent federal programs, such as the Northwest Economic Assistance Program and the Northwest Forest Plan, both launched in 1994, provided additional federal support for restoration in the area.35
Since 1994 state funding sources have increased, and as of 2008, the State of California funds more restoration work than the federal government in California. Be-tween 1995 and 2002, state-funded programs paid for 63-percent of restoration work within Humboldt Coun-ty.36 The largest of these state sources is the Department of Fish and Game’s Fisheries Restoration Grant Program (Figure 3), which was described in the California section of this report. Another avenue of funding is the Cali-fornia Off-Highway Motor Vehicle Recreation Program (OHMVR). This program appropriates 25-percent of off-highway vehicle registration fees to restoration-relat-ed activities.37 Between 1995 and 2002, the California Department of Parks and Recreation, which the OHM-VR falls under, contributed approximately $3 million to restoration activities in Humboldt County. Of the fed-eral programs that fund restoration work in Humboldt County, the National Park Service contributes the most ($9.4 million, 1995 to 2002), followed by the Bureau of
33 Baker, J. Mark. 2005. Socio-Economic Characteristics and Contributions of the Natural Resources Restoration System in Humboldt County, California. Ecological Restoration 23 (1):5-14.34 Ibid.35 Ibid.36 Ibid.37 Janis, Robert. 2009. California State Program Provides Help to Off-Highway Recreationists. ATVSource.com 2008 [cited March 5 2009]. Available from http://www.atvsource.com/articles/articles/2008/041108_ca_state_program_provides_help_ohv_recreationists.htm.
budget of its own. OWEB was created by the state leg-islature in 1999 in order to fund voluntary restoration activities on private lands, such as fish passage improve-ments, revegetation, damn removal, and monitoring.26 Currently, the Pacific Coastal Salmon Recovery Fund (detailed in California section of this report), Oregon Lottery, and Oregon Salmon License Plate fund OWEB’s work. OWEB had $110 million in funding between July 2007 and September 2008. Lottery funds contributed 83 percent of this, PCSRF 11 percent, lottery research funds five percent, salmon license plate funds less than one percent, and other sources about one percent.27
The State Lottery is a largely predictable funding source, and the approximately $30 million per year that comes from it adequately supports the majority of OWEB’s projects.28 This State Lottery funding was initiated through Ballot Measure 66, which Oregon voters ap-
proved on November 3, 1998.29 The measure amended the Oregon Constitution to dedicate 15-percent of lot-tery revenues to the Parks and Natural Resources Fund, half of which goes to salmon and watershed restoration projects.30 Because Oregon restoration work is largely in the form of pay-as-you-go financing from a dedicated source, the current financial crisis has not adversely af-fected OWEB’s work,31 even though lottery revenues have slightly declined during 2009.32
26 Oregon Watershed Enhancement Board. 2008. Annual Performance Progress Report for Fiscal Year 2007-2008.27 Oregon Watershed Enhancement Board. 2008. Oregon Plan Biennial Report 2007 - 2009. Salem, Oregon.28 Bierly, Ken. February 19, 2009. Deputy Director, Oregon Watershed Enhancement Board. Interview by Author.29 Oregon Legislative Committee Services. 2004. Oregon Plan for Salmon and Watersheds. Salem, OR.30 Ibid.31 Bierly, Ken. February 19, 2009. Deputy Director, Oregon Watershed Enhancement Board. Interview by Author.32 Lies, Mitch. 2009. Despite Shortfall, Oregon Spending Rises. Capital Press, July 9, 2009.
The Oregon Watershed Enhancement Board funds restoration on private lands within Oregon,
mostly through State Lottery proceeds
Large-scale restoration within Humboldt County started in 1978, when the U.S. Congress
appropriated $33 million to restore damaged lands within Redwood National Park

Characteristics of Watershed Restoration Funding 9
Land Management ($7.8 million, 1995-2002).38 These two agencies likely lead because of their major landhold-ings within the county.
Lake TahoeIn the mountains between California and Nevada lies the spectacularly clear Lake Tahoe. Unfortunately, many years of development and actions on adjacent public lands has caused water quality in the lake—primarily measured by feet of water clarity—to decline.39 Local, state, and national restoration efforts currently attempt to alleviate this problem, turning the Lake Tahoe resto-ration effort into one of the largest restoration initiatives in the country.
The Lake Tahoe Environmental Improvement Program (EIP) coordinates the majority of the watershed restora-tion projects within the basin, and a variety of sources go to fund EIP projects. Between 1997 and 2006, the State of California contributed the most to the EIP ($446 million), followed by the Federal Government ($293 38 Baker, J. Mark. 2005. Socio-Economic Characteristics and Contributions of the Natural Resources Restoration System in Humboldt County, California. Ecological Restoration 23 (1):5-14.39 Tahoe Regional Planning Agency. 2008. Environmental Improvement Program Progress Report: 1997-2008. Stateline, NV.
million), private citizens and businesses ($216 million), and the State of Nevada ($82 million) (Figure 4).40 This proportion of funding has held relatively stable over
time. For example, between 1997 and 2000, state-level funding accounted for 49-percent of EIP funding, and the federal government accounted for 28-percent.41
A multitude of mechanisms generate these monies for the EIP. Appropriations from the general funds of California and Nevada, along with bond initiatives, as described in the California section of this report, pro-vide the majority of money at the state level. California Propositions 204 ($5 million, 1996), 12 ($50 million, 2000), 13 (undetermined, 2000), and 50 ($40 million,
40 Ibid.41 Tahoe Regional Planning Agency. 2001. Finance Plan to Implement the Environmental Improvement Program for the Tahoe Basin.
Unlike most federal funding programs for watershed restoration, the Lake Tahoe
Restoration Act funds $300 million in restoration activities through selling excess federal lands
outside of Las Vegas, Nevada
Figure 3: State and federal funding sources from 1995–2002 for watershed restoration work in Humboldt County, California.33
$0!
$4,000,000!
$8,000,000!
$12,000,000!
$16,000,000!
$20,000,000!
$24,000,000!
Nat
iona
l Par
k S
ervi
ce!
Bur
eau
of L
and
Man
agem
ent!
Bur
eau
of In
dian
Affa
irs!
U.S
. For
est S
ervi
ce!
U.S
. Fis
h an
d W
ildlif
e S
ervi
ce!
Dep
artm
ent o
f Fis
h an
d G
ame!
Cal
iforn
ia C
onse
rvat
ion
Cor
ps!
Dep
artm
ent o
f Par
ks a
nd R
ecre
atio
n!
Dep
artm
ent o
f Wat
er R
esou
rces!
Sta
te: C
oast
al C
onse
rvan
cy!
Sta
te W
ater
Res
ourc
es C
ontr
ol B
oard!
Wild
life
Con
serv
atio
n B
oard!
Federal! Federal! Federal! Federal! Federal! State! State! State! State! State! State! State!
Fu
nd
ing
Am
ou
nt!

Characteristics of Watershed Restoration Funding10
LTRA monies flow through the Forest Service, followed by the Department of Transportation and Environmen-tal Protection Agency.46
Overall, more than 50 separate funding sources at vari-ous levels go to pay for the EIP. This diversity of funding sources, and national recognition of the restoration pro-gram, should ensure that restoration continues into the future. The heavy reliance on general funds and general obligation bonds, however, means that monies may be short during the current financial downtown.47
Puget SoundThe Puget Sound, on Washington’s northwestern coast, faces water quality and habitat degradation after years of unregulated development and resource extraction.48 The Puget Sound Conservation and Recovery Plan (PSCRP) guides restoration efforts in the watershed. The primary goals of the PSCRP are to improve water quality, protect
and restore habitat, clean up contaminated sites, and better handle storm water runoff.49 About half of the project funds go to mitigate the impacts of development and half go to protect and restore habitat, especially for salmon. Local governments provide the majority of the funding for Puget Sound restoration projects (44-per-cent), followed by the Federal Government (30-percent) and State of Washington (26-percent).50
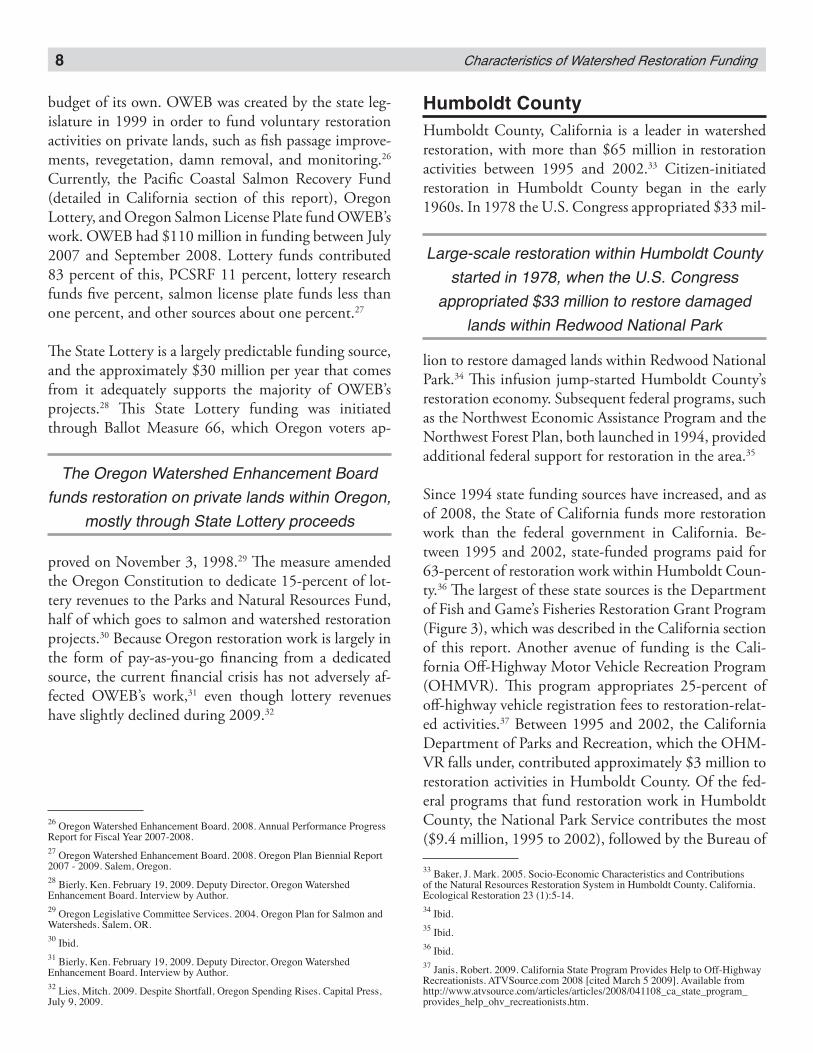
Thirty different agencies from all levels of government fi-nance the PSCRP (Figure 5). The majority of the federal money comes from general appropriations. However, at
46 Lake Tahoe Federal Interagency Partnership. 2006. Progress Report: Federal Actions at Lake Tahoe FY 2003-2005.47 Samuels, Nick. 2009. The Impact of the Credit Crisis and Weaker Economy on U.S. States and Municipal Entities. Municipal Finance Journal 29:1-11.48 Puget Sound Partnership. 2007. Puget Sound Conservation and Recovery Plan. State of Washington.49 Ibid.50 Puget Sound Partnership. 2009. Estimates of Spending Related to Puget Sound.
2002), along with Nevada Assembly Bill 285 ($56 mil-lion, 1999) fund EIP projects through general obliga-tion bonds.42 A variety of individual mechanisms put in place locally around Lake Tahoe fund restoration efforts as well, such as Shorezone Mitigation Fees, Air Qual-ity Mitigation Fees, Water Quality Mitigation Fees, and Rental Car Mitigation Fees.43 At the federal level, much funding comes from the Lake Tahoe Restoration Act (LTRA) of 2000. Campaigned for by President Clinton and Senator Feinstein, the LTRA authorized $300 mil-lion in restoration spending to fund the federal share of the EIP.44 Unlike most federal funding for watershed restoration, the LTRA did not fund restoration efforts through general appropriations. Rather it sold excess federal lands in the area surrounding Las Vegas, Nevada, which was highly controversial.45 The majority of the
42 California Legislative Analyst’s Office. 1996. Proposition 204: Safe, Clean, Reliable, Water Supply Act. Sacramento, CA, ———. 2000. Proposition 12: Safe Neighborhood Parks, Clean Water, Clean Air, and Coastal Protection Bond Act of 2000. Sacramento, CA, League of Women Voters of California. 2009. Lwvc Position on Proposition 13 2000 [cited March 5 2009]. Available from http://ca.lwv.org/action/prop0003/prop13.html, ———. 2009. Proposition 50 in Depth 2002 [cited March 5 2009]. Available from http://ca.lwv.org/lwvc/edfund/elections/2002nov/id/prop50.html, Nevada Committee on Natural Resources. 1999. Assembly Bill No. 285.43 Tahoe Regional Planning Agency. 2001. Finance Plan to Implement the Environmental Improvement Program for the Tahoe Basin.44 Lake Tahoe Federal Interagency Partnership. 2006. Progress Report: Federal Actions at Lake Tahoe FY 2003-2005.45 Bureau of Land Management. 2008. Southern Nevada Public Land Management Act: 10-Year Report to Congress. Denver, Colorado.
Figure 4: Lake Tahoe EIP watershed restoration fun-ding sources, 1997-2006.39
Federal!
27%!
State of
California!
41%!
State of
Nevada!
7%!
Local!
5%!
Private!
20%!
Local governments provide the majority of the funding for Puget Sound restoration
projects (44-percent), followed by the Federal Government (30-percent) and State of
Washington (26-percent)
Characteristics of Watershed Restoration Funding 11
EvergladesAfter nearly a century of draining the Everglades to pro-mote agricultural and residential development, the resto-ration of the Everglades has gained national importance.54 In 1999 restoration efforts were formalized when state and federal agencies came together to form the Compre-hensive Everglades Restoration Plan (CERP).55 CERP is now a multi-billion dollar effort with over 68 individual projects, a variety of funding sources, and strong con-gressional support. While funded by a variety of sources (Figure 6), the U.S. Army Corps of Engineers (USACE) and the South Florida Water Management District (SF-WMD) provide the vast majority of its funds.56 USACE obtains its funding through congressional appropria-
54 Committee on Independent Scientific Review of Everglades Restoration Progress. 2008. Progress toward Restoring the Everglades: The Second Biennial Review. Washington, DC: National Academies Press.55 Ibid.56 Ibid.
the state and local levels, specialized funding mechanisms have helped facilitate a strong restoration program. The Washington Department of Ecology draws the major-ity of its funds from the State Building Construction Account,51 which is a general catchall account funded primarily from bond proceeds, in addition to grants, do-nations, general funds, and other monies.52 At the local level, the majority of funds for Puget Sound restoration come from storm drainage utilities agencies, with King County’s utility agencies contributing the most. Munici-pal fees largely fund the agencies.53 However, most of this revenue goes to stormwater mitigation, which may or not be restoration according to the Society for Eco-logical Restoration’s definition.
51 Washington Department of Ecology. 2008. Focus Sheet: Water Quality Program: Water Quality Grants and Loans.52 Revised Code of Washington. 2008. Section 15.24.806.53 Puget Sound Partnership. 2009. Estimates of Spending Related to Puget Sound.
Figure 5: Estimated annual federal, state, and local agencies that fund Puget Sound watershed restoration efforts.50 (scale is logarithmic)
$1!
$10!
$100!
$1,000!
Arm
y C
orp
s o
f E
ng
ine
ers!
US
En
viro
nm
en
tal P
rote
ctio
n A
ge
ncy!
US
Fis
h a
nd
Wild
life
Se
rvic
e!
Sa
lmo
n G
ran
ts!
Oth
er
Fe
de
ral G
ran
ts!
Na
vy R
eg
ion
No
rth
we
st!
US
Ge
olo
gic
al S
urv
ey!
US
Fo
rest
Se
rvic
e!
US
De
pa
rtm
en
t o
f A
gricu
ltu
re R
ura
l D
eve
lop
me
nt!
Fo
rt L
ew
is!
De
pa
rtm
en
t o
f E
co
log
y (
DO
E)
- o
the
r g
ran
ts!
DO
E -
Re
me
dia
l Actio
n G
ran
ts!
Re
cre
atio
n a
nd
Co
nse
rva
tio
n O
ffice
(R
CO
)!
DO
E -
Lo
ca
l G
ov't
Sto
rmw
ate
r G
ran
ts !
Wa
sh
ing
ton
Wild
life
an
d R
ecre
atio
n G
ran
ts (
WW
RP
) !
DO
E –
oth
er
dire
ct
sp
en
din
g!
De
pa
rtm
en
t o
f F
ish
an
d W
ildlif
e (
DF
W)!
Pu
ge
t S
ou
nd
Pa
rtn
ers
hip
(P
SP
)!
Pu
blic
Wo
rks A
ssis
tan
ce
Acco
un
t (P
WA
A)!
De
pa
rtm
en
t o
f N
atu
ral R
eso
urc
es (
DN
R)!
Sta
te P
ark
s!
Sa
lmo
n R
eco
ve
ry F
un
din
g B
oa
rd (
SR
FB
)!
Co
nse
rva
tio
n C
om
mis
sio
n!
Aq
ua
tic L
an
ds E
nh
an
ce
me
nt A
cco
un
t (A
LE
A)!
UW
/WS
U!
De
pa
rtm
en
t o
f H
ea
lth
(D
OH
)!
Oth
er
sp
en
din
g!
Sto
rm D
rain
ag
e U
tilit
ies A
ge
ncie
s!
Na
tura
l R
eso
urc
es/E
nviro
nm
en
tal P
rese
rva
tio
n A
ge
ncie
s!
Se
we
r U
tilit
ies A
ge
ncie
s!
F! F! F! F! F! F! F! F! F! F! S! S! S! S! S! S! S! S! S! S! S! S! S! S! S! S! S! L! L! L!
Am
ou
nt
of
Mo
ne
y S
pe
nt
(in
Mil
lio
ns
)!
Funding Agency and Governmental Level: Federal (F), State (S), Local (L)!

Characteristics of Watershed Restoration Funding12
MD projects account for 66-percent of all restoration-related expenses for the Everglades in 2009. A variety of sources finance SFWMD endeavors (Figure 7). Cer-tificates of Participation (COPs), which do not require voter approval, fund the majority of SFWMD Ever-glades restoration work. COPs are a type of bond, with
tions, such as the Water Resources Development Act of 2000. In 2009, the USACE will contribute $92 million to CERP and spend $93 million on non-CERP restora-
tion projects, which is 15-percent of total Everglades res-toration-related spending for the year.57 The non-CERP USACE projects include maintenance and construction of dikes, levees, and dams.58
The South Florida Water Management District funds the majority of CERP and non-CERP Everglades res-toration work. In 2009, SFWMD is expected to spend $449 million on over 50 CERP projects, and $367 mil-lion on non-CERP restoration projects.59 These SFW-
57 South Florida Ecosystem Restoration Program. 2008. Cross-Cut Budget: Task Force Working Document.58 South Florida Water Management District. 2008. Budget Document: Fiscal Year 2009. West Palm Beach, Florida.59 South Florida Ecosystem Restoration Program. 2008. Cross-Cut Budget: Task Force Working Document.
Figure 7: 2009 South Florida Water Management Dis-trict revenue sources.58
COPs (Debt)!
66%!
Local
Sources!
0%!
State
Sources!
7%!
Federal
Sources!
0%!
Property Tax!
18%!
Agricultural
Privilege Tax!
0%!Balances
& Fees!
9%!
Investment!
0%!
Figure 6: 2009 State and federal agency budgets for Everglades watershed restoration efforts.57
(scale is logarithmic)
$1!
$10!
$100!
$1,000!S
ou
th F
lorid
a W
ate
r M
an
ag
em
en
t D
istr
ict!
Flo
rid
a D
ep
art
me
nt
of
En
viro
nm
en
tal P
rote
ctio
n!
Flo
rid
a D
ep
art
me
nt
of A
gricu
ltu
re
an
d C
on
su
me
r S
erv
ice
s!
Flo
rid
a F
ish
an
d W
ildlif
e
Co
nse
rva
tio
n C
om
mis
sio
n!
Flo
rid
a D
ep
art
me
nt
of
Tra
nsp
ort
atio
n!
U.S
. A
rmy C
orp
of
En
gin
ee
rs!
Na
tio
na
l P
ark
Se
rvic
e!
U.S
. F
ish
an
d W
ildlif
e S
erv
ice!
U.S
. G
eo
log
ica
l S
urv
ey!
Ag
ricu
ltu
ral R
ese
arc
h S
erv
ice!
State! State! State! State! State! Federal! Federal! Federal! Federal! Federal!
!"#$%&'#(')#%*+',-*%&'./%')
/00/#%12'
3$%4/%5'!5*%6+'7%4'8*9*0'
The South Florida Water Management District will fund $816 million in Everglades restoration projects, with the vast majority of these funds
coming from the sale of bonds

Characteristics of Watershed Restoration Funding 13
habitat restoration, sewage treatment plant upgrades, agricultural best management practices, and other non-point source control programs.63
A combination of federal, state, local, and private sources fund restoration efforts within the Chesapeake Bay (Figure 8). States provide the vast majority of the funds, with over 64-percent of cleanup dollars coming from Maryland, Virginia, and Pennsylvania.64 Discern-
ing the total amount of money spent on bay restoration activities is difficult, because spending can be direct, in which the programs are specifically crafted for restora-tion purposes, or indirect, in which already existing pro-grams coincidentally help restore the bay.65 Direct fund-ing mechanisms, such as the Maryland Chesapeake Bay
63 Chesapeake Bay Commission. 2003. The Cost of a Clean Bay: Assessing Funding Needs Throughout the Watershed. Annapolis, MD.64 Ibid.65 General Accountability Office. 2005. Chesapeake Bay Program: Improved Strategies Are Needed to Better Assess, Report, and Manage Restoration Progress. Washington, DC.
the annual debt service (around $100 million) financed through property tax proceeds. SFWMD owed a total of $593 million at the end of fiscal year 2008, but in 2009 expected to add $1.7 billion to that amount, due to the purchase of 180,000 acres of former sugar land.60 However, future use of COPs is in question. Due to the financial crisis, the municipal bond market has deterio-rated, and uncertainties exist as to whether enough in-vestors can be found to buy increasingly large amounts of SFWMD bonds.61
Chesapeake BayCenturies of development and agriculture in the Chesa-peake Bay Area—in Washington D.C., Maryland, Vir-ginia, and Pennsylvania—has led to precipitous declines in blue crab populations, hazardous levels of nitrogen and pollution, and algal blooms that create “dead zones” in the bay where few animals can live.62 The rising soci-etal importance of a healthy bay ecosystem, along with the livelihoods that depend upon a thriving Chesapeake Bay, have led to a decades-long multi-billion dollar clean-up of the bay. These cleanup activities involve aquatic
60 South Florida Water Management District. 2008. Budget Document: Fiscal Year 2009. West Palm Beach, Florida.61 Skoloff, Brian. 2009. Everglades Land Deal in Jeopardy from Competition. Associated Press, February 24, 2009.62 Chesapeake Bay Foundation. 2008. Annual Report: A Year of Significant Victories.
Figure 8: 2003-2010 estimated funding levels for all restoration activities within the Chesapeake Bay, with all levels of funding on the left, and a breakdown of various types of state funding on the right.63
Federal!
18%!
Local!
11%!
Non-Governmental!
6%!
State - General
Fund!
15%!
State - Special
Fund!
35%!
State -
Other!
7%!
State -
Capital
Budget!8%!
State!
64%!
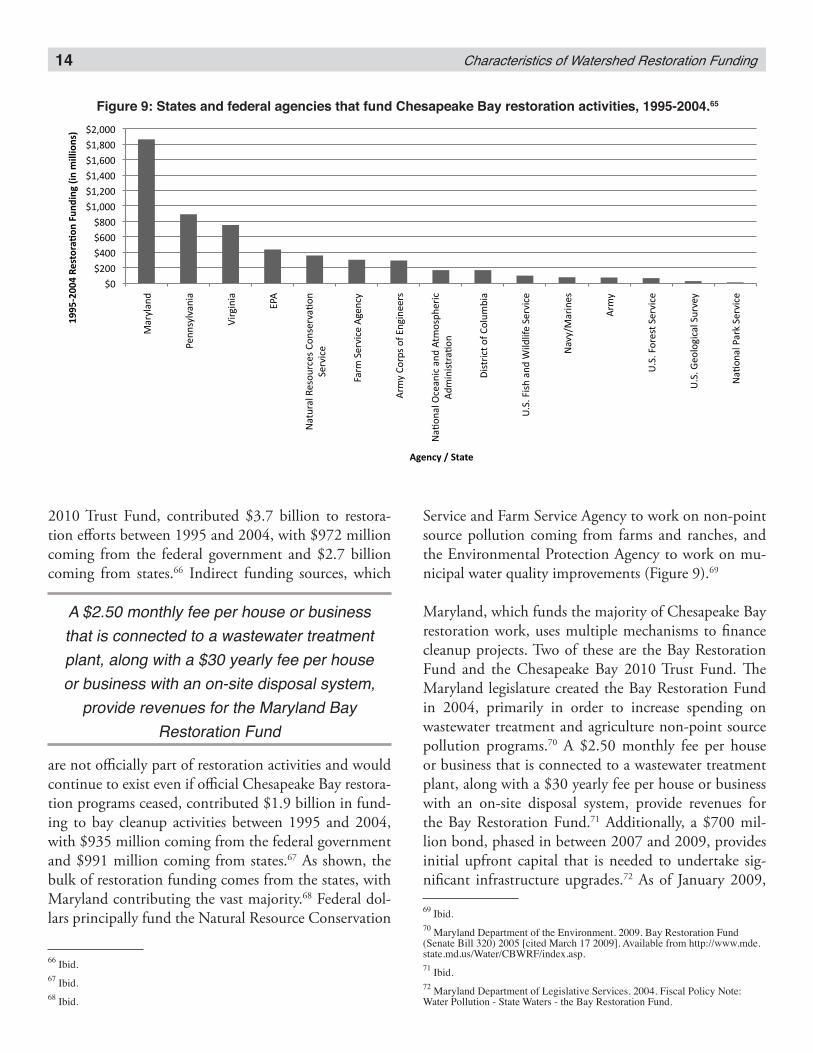
Direct funding mechanisms contributed $3.7 billion to Chesapeake Bay restoration efforts between 1995 and 2004, with $972 million
coming from the federal government and $2.7 billion coming from states
Characteristics of Watershed Restoration Funding14
Service and Farm Service Agency to work on non-point source pollution coming from farms and ranches, and the Environmental Protection Agency to work on mu-nicipal water quality improvements (Figure 9).69
Maryland, which funds the majority of Chesapeake Bay restoration work, uses multiple mechanisms to finance cleanup projects. Two of these are the Bay Restoration Fund and the Chesapeake Bay 2010 Trust Fund. The Maryland legislature created the Bay Restoration Fund in 2004, primarily in order to increase spending on wastewater treatment and agriculture non-point source pollution programs.70 A $2.50 monthly fee per house or business that is connected to a wastewater treatment plant, along with a $30 yearly fee per house or business with an on-site disposal system, provide revenues for the Bay Restoration Fund.71 Additionally, a $700 mil-lion bond, phased in between 2007 and 2009, provides initial upfront capital that is needed to undertake sig-nificant infrastructure upgrades.72 As of January 2009,
69 Ibid.70 Maryland Department of the Environment. 2009. Bay Restoration Fund (Senate Bill 320) 2005 [cited March 17 2009]. Available from http://www.mde.state.md.us/Water/CBWRF/index.asp.71 Ibid.72 Maryland Department of Legislative Services. 2004. Fiscal Policy Note: Water Pollution - State Waters - the Bay Restoration Fund.
2010 Trust Fund, contributed $3.7 billion to restora-tion efforts between 1995 and 2004, with $972 million coming from the federal government and $2.7 billion coming from states.66 Indirect funding sources, which
are not officially part of restoration activities and would continue to exist even if official Chesapeake Bay restora-tion programs ceased, contributed $1.9 billion in fund-ing to bay cleanup activities between 1995 and 2004, with $935 million coming from the federal government and $991 million coming from states.67 As shown, the bulk of restoration funding comes from the states, with Maryland contributing the vast majority.68 Federal dol-lars principally fund the Natural Resource Conservation
66 Ibid.67 Ibid.68 Ibid.
Figure 9: States and federal agencies that fund Chesapeake Bay restoration activities, 1995-2004.65
!"#
!$""#
!%""#
!&""#
!'""#
!()"""#
!()$""#
!()%""#
!()&""#
!()'""#
!$)"""#
*+,-
.+/0#
12//3-
.4+/5+
#
65,75/
5+#
819
#
:+;<
,+.#=
23>
<,?
23#@>/32
,4+A>/#
B2,4
5?2#
C+,D
#B2,4
5?2#9
72/?-
#
9,D
-#@>,E
3#>F#8/75/
22,3
#
:+A>/+.#G
?2+/5?#+
/0#9
;D>3E
H2,5?#
90D
5/53;,+A>/#
I53;,5?;#>F#@>.<
DJ5+
#
KLB
L#C53H
#+/0#M
5.0.5F
2#B2,4
5?2#
:+4
-N*
+,5/23#
9,D
-#
KLB
L#C>
,23;
#B2,4
5?2#
KLB
L#O2>.>
75?+.#B
<,4
2-#
:+A>/+.#1
+,P
#B2,4
5?2#
!""#$%&&'()*+,-./0-1(2314516(751(8
5995-1+:(
;6*1<=(>(?,/,*(
A $2.50 monthly fee per house or business that is connected to a wastewater treatment plant, along with a $30 yearly fee per house or business with an on-site disposal system,
provide revenues for the Maryland Bay Restoration Fund
Characteristics of Watershed Restoration Funding 15
Chesapeake Bay, have received dedicated congressional appropriations to help fund the projects, but even these appropriations are smaller than state spending. For ex-ample, the Lake Tahoe Restoration Act of 2000 funded $300 million in restoration work around Lake Tahoe.78 While a significant amount of money, it still pales in
comparison to the $990 million in watershed restoration and forest and wildlife conservation that California vot-ers approved with Proposition 84 in 2006.79 There is a chance that this trend will slow, if not reverse, as the cur-rent recession has caused states to cut programs to ad-dress declining state revenues,80 while the federal govern-ment has increased its spending on states and localities.81 However, states and localities have many more avenues to implement innovative funding mechanisms.82 Thus in the next decade the various ways states and localities fund watershed restoration will continue to evolve.
A second trend is that long-term and consistently-viable watershed restoration programs have a variety of funding sources. For example, the Puget Sound restoration effort has over 30 different funding mechanisms, through lo-cal, state, and federal programs, as well as private foun-dations and businesses, that make the large-scale nature of the restoration possible. The funding environment for a given restoration initiative can be diverse in many ways. It can have a mix of local, state, and federal fund-ing. It can also be financed from general appropriations, bond revenue, and dedicated funding streams. The high-lighted case studies are all diversified to various degrees in these realms, and as such, if any given component disappears, such as when the Maryland legislature with-drew $25 million from the Chesapeake Bay 2010 Trust
78 Bureau of Land Management. 2008. Southern Nevada Public Land Management Act: 10-Year Report to Congress. Denver, Colorado.79 Institute of Governmental Studies. 2008. Proposition 84: Safe Drinking Water Act of 2006. University of California Berkeley 2006 [cited December 17 2008]. Available from http://igs.berkeley.edu/library/election2006/Prop84.html.80 Samuels, Nick. 2009. The Impact of the Credit Crisis and Weaker Economy on U.S. States and Municipal Entities. Municipal Finance Journal 29:1-11.81 Wildasin, David E. Ibid.State and Local Government Finance in the Current Crisis: Time for Emergency Federal Relief? :49-64.82 Hurd, Josh. 2009. Innovative Financial Mechanisms to Fund Watershed Restoration. In The Political Economy of Watershed Restoration Series. Missoula, MT: Wildlands CPR.
the fund had $253 million, with $189 million from fee-levied cash deposits, $13 million from interest, and $52 million from bond proceeds.73 In 2009, the state plans to spend $123 million of this, with $115 million for projects, $2.8 million for administrative expenses, and $4.7 million for bond service fees.74 Another Maryland funding program is the Chesapeake Bay 2010 Trust Fund, which funds non-point source pollution control measures. Retail Sales and Use Taxes, which brought in $37 million in 2008, and the Motor Fuel Tax, which brought in $7 million in 2008, fund the program.75 However, these funding streams for the Chesapeake Bay 2010 Trust Fund are not politically secure, and faced with a $300 million budget deficit, the Maryland legis-lature cut the fund by $25 million in March of 2008.76
Overall, enough political will and societal urgency exists within the greater Chesapeake Bay area to fund restora-tion efforts. No single source provides the majority of funds, either at the state level or at the federal level. Even the Chesapeake Bay Program, ran by the Environmental Protection Agency to coordinate all Chesapeake Bay res-toration activities, receives only $20 million in funding annually through congressional appropriations.77 Thus the strength of Chesapeake Bay restoration efforts lies in its diversity of funding sources and multitude of partners working together towards a common goal, rather than a single champion and funding source predominating.
Restoration Funding TrendsMany trends emerge from the case studies described above. First, most funding for watershed restoration proj-ects comes from states and localities. While the federal government does significantly contribute, overall its con-tribution is smaller than those of cities and states. Many federal programs provide grants to states, such as the EPA’s Section 319(h) Grants, but these programs often require matching funds. Some notorious and large-scale restoration projects, such as Lake Tahoe, Everglades, and
73 Summers, Robert M. 2009. Bay Restoration Fund Advisory Committee: Annual Status Report. State of Maryland.74 Ibid.75 Maryland Department of Budget and Management. 2009. Fiscal Digest Fiscal Year 2009 Exhibit A: General Fund Budget Summary.76 Wilson, Kelly. 2008. Senate Committee Reduces Chesapeake Bay Fund, Higher Education Budget. Capital News Service, March 7, 2008.77 Chesapeake Bay Program. 2009. Funding and Financing 2007 [cited March 17 2009]. Available from http://www.chesapeakebay.net/fundingandfinancing.aspx?menuitem=14907.
Most funding for watershed restoration projects comes from states and localities

Characteristics of Watershed Restoration Funding16
ously facilitated the bond market further exacerbates the problem.88 Complicating this as well is increased politi-cal opposition. For example, a Florida State Legislator has introduced legislation to require voter approval for debt issuance within the South Florida Water Manage-ment District.89
The most predictable bonds are those that are funded through dedicated revenue streams, where the revenue streams are structured in such a way that the fee or tax is directly related to the restoration efforts at hand. For example, Maryland’s Bay Restoration Fund collects
revenues through fees on sewer connections and septic tank usage, both of which contribute to degraded water quality in the Chesapeake Bay.90 Some of these revenues go to pay for bonds issued by Maryland to fund water treatment plant upgrades. Only 20-percent of the mon-ey within the Bay Restoration Fund comes from bonds, however.91 This is an economically efficient funding mechanism, as one of the causes of the ecological degra-dation is being taxed to pay for some of the restoration, and those people who pay the taxes receive its benefits.
Whether one uses bonds or not depends on the scope of restoration activities. Overall, bonds cost much more than typical pay-as-you-go restoration, as much as dou-bling the amount borrowed due to long-term debt re-payments at four to seven percent interest per year. However, if the restoration work needing to be done requires large up-front payments, such as in the Ever-glades for massive land purchases, or if project timelines require restoration work immediately, such as in the Chesapeake Bay for several multi-million dollar sewage treatment plant upgrades, then issuing debt may be the
88 Kwiatkoski, Paul. 2009. Municipal Market Struggles to Maintain Broad Retail Participation without Bond Insurance. Municipal Finance Journal 29:23-35.89 Brinkmann, Paul. 2009. Bill Could Halt U.S. Sugar Land Purchase. South Florida Business Journal, February 11, 2009.90 Maryland Department of Legislative Services. 2004. Fiscal Policy Note: Water Pollution - State Waters - the Bay Restoration Fund.91 Summers, Robert M. 2009. Bay Restoration Fund Advisory Committee: Annual Status Report. State of Maryland.
Fund, the initiative as a whole still continues. However, this diversity of funding mechanisms has its drawbacks as well. Dealing with multiple funders can be frustrat-ing to restoration practitioners and program adminis-trators.83 Monies come at different times, a variety of
different reporting requirements must be dealt with, and sometimes upfront costs are not covered.84 Therefore, for long-term program viability, funding diversity is desired, but it does not come without costs. For small-scale resto-ration projects, it may be easier to deal with fewer fund-ing sources.
A third trend, related to the importance of diversity in funding mechanisms, is a growing overreliance on issu-ing debt (usually through general obligation bonds) to fund restoration activities. Voters often approve these bonds, which are then paid off through states’ gener-
al fund revenues.85 While bonds appear inviting when projections forecast continued economic growth, in the current economic climate many restoration efforts may be thwarted due to declining municipal revenues, increasing costs of long-term borrowing, and spend-ing reductions.86 Also, paying for restoration through bonds may cost too much money, especially for states like California with low credit ratings.87 The decline of auxiliary industries, such as bond insurers, that previ-
83 California Task Force on Removing Barriers to Restoration. 2002. Removing Barriers to Restoration. California Resources Agency.84 Ibid.85 Smith, Kevin B., Alan Greenblatt, and Michele Mariani. 2008. Governing States and Localities. Washington, DC: CQ Press.86 Samuels, Nick. 2009. The Impact of the Credit Crisis and Weaker Economy on U.S. States and Municipal Entities. Municipal Finance Journal 29:1-11.87 Palmeri, Christopher, and Elise Craig. 2009. Banks Turn the Screws on California. Business Week, July 9, 2009.
The best bonds are those that are funded by dedicated revenue streams, where these
revenue streams are structured in a way such that the fee or tax is directly related to the
restoration efforts at hand
If the restoration work needing to be done requires large up-front payments, then issuing
debt is often the only option
Long-term and consistently viable restoration programs have a variety of funding sources

Characteristics of Watershed Restoration Funding 17
Brinkmann, Paul. 2009. Bill Could Halt U.S. Sugar Land Purchase. South Florida Business Journal, February 11, 2009.
Bureau of Land Management. 2008. Southern Nevada Public Land Management Act: 10-Year Report to Congress. Denver, Col-orado.
Burke, Patrick. December 16, 2008. Former President, Bitterroot Restoration. Interview by Author.
California Attorney General. 2006. Proposition 84: Water Quality, Safety and Supply. Flood Control. Natural Resources Protec-tion. Park Improvements. Bonds. Initiative Statute. Sacra-mento, CA.
California Department of Fish and Game. 2008. Fisheries Restora-tion Grant Program: Salmon and Steelhead Fire Relief: 2008 Proposal Solicitation Notice. Sacramento, CA.
California Legislative Analyst’s Office. 1996. Proposition 204: Safe, Clean, Reliable, Water Supply Act. Sacramento, CA.
———. 2000. Proposition 12: Safe Neighborhood Parks, Clean Water, Clean Air, and Coastal Protection Bond Act of 2000. Sacramento, CA.
California Resources Agency. 2003. Summary of Programs in Prop-osition 40.
California Task Force on Removing Barriers to Restoration. 2002. Removing Barriers to Restoration. California Resources Agency.
Chesapeake Bay Commission. 2003. The Cost of a Clean Bay: As-sessing Funding Needs Throughout the Watershed. Annapo-lis, MD.
Chesapeake Bay Foundation. 2008. Annual Report: A Year of Sig-nificant Victories.
Chesapeake Bay Program. 2009. Funding and Financing 2007 [cit-ed March 17 2009]. Available from http://www.chesapeake-bay.net/fundingandfinancing.aspx?menuitem=14907.
Colman, William G. 1989. State and Local Government and Pub-lic-Private Partnerships: A Policy Issues Handbook. Westport, CT: Greenwood Publishing Group.
Committee on Independent Scientific Review of Everglades Res-toration Progress. 2008. Progress toward Restoring the Ever-glades: The Second Biennial Review. Washington, DC: Na-tional Academies Press.
Congressional Budget Office. 2008. Issues and Options in Infra-structure Investment. Washington, DC: Congressional Bud-get Office.
De Groot, Rudolf, Martin De Wit, Erica J. Brown Gaddis, Carolyn Kousky, William Mcghee, and Mike D. Young. 2007. Mak-ing Restoration Work: Financial Mechanisms. In Restoring Natural Capital, edited by J. Aronson, S. J. Milton, J. N. Blignaut and P. Raven. Washington, DC: Island Press.
Department of Fish and Game. 2008. Fisheries Restoration Grant Program [cited December 16 2008]. Available from http://www.dfg.ca.gov/fish/Administration/Grants/FRGP/index.asp.
only option. For restoration initiatives that do not meet these criteria, such as the work of the Oregon Watershed Enhancement Board (OWEB), paying for restoration projects as the money comes in works well.
ConclusionAnalyzing states engaged in watershed restoration and individual large-scale restoration projects provides valu-able information into the nature of how watershed res-toration is funded. Long-term restoration projects usu-ally have consistent funding. The funding mechanisms
tend to be diverse in nature, coming from multiple lev-els of government and a variety of private interests. The mechanisms are spread out between bonds, general fund revenues, and dedicated funding streams. However, an overreliance on bonds, especially when financed through general funds, has threatened to harm some restoration efforts during this economic downturn.
Translating these results from individual states and res-toration projects into lessons that can build up the resto-ration economy as a whole is difficult. Each restoration area has unique characteristics that prevent exact repli-cation to other areas. However, each of these projects, when aggregated, comprises the restoration economy. Thus, in order for the restoration economy to grow, new funding mechanisms at local, state, and federal levels must be created.
ReferencesBaker, J. Mark. 2005. Socio-Economic Characteristics and Con-
tributions of the Natural Resources Restoration System in Humboldt County, California. Ecological Restoration 23 (1):5-14.
Beckett-Camarata, Jane. 2009. The Current Impact of the Tighten-ing Credit Market on Municipal Borrowing Costs: A Case Study. Municipal Finance Journal 29:77-86.
Bierly, Ken. February 19, 2009. Deputy Director, Oregon Water-shed Enhancement Board. Interview by Author.
Translating these results from individual states and restoration projects into lessons that can
build up the restoration economy as a whole is difficult

Characteristics of Watershed Restoration Funding18
Elliot, Sarah. 2009. News Release: Governor Schweitzer: $34 Mil-lion New Money for Restoration. MT.gov 2007 [cited March 11 2009]. Available from http://governor.mt.gov/news/pr.asp?ID=461.
Environmental Protection Agency. 2008. Clean Waters Act Section 319 2008 [cited December 16 2008]. Available from http://www.epa.gov/nps/cwact.html.
Frederick, Morgan. 2009. Environmental Restoration Is Big Busi-ness. The Missoulian, February 25, 2008.
General Accountability Office. 2005. Chesapeake Bay Program: Improved Strategies Are Needed to Better Assess, Report, and Manage Restoration Progress. Washington, DC.
Government Finance Research Center. 1990. Building Together: Investing in Community Infrastructure. Washington, DC: Government Finance Research Center.
Hurd, Josh. 2009. Innovative Financial Mechanisms to Fund Wa-tershed Restoration. In The Political Economy of Watershed Restoration Series. Missoula, MT: Wildlands CPR.
Information Center for the Environment. 2008. NRPI - Gi-ant Forest Restoration 2008 [cited December 3 2008]. Available from http://www.ice.ucdavis.edu/nrpi/project.asp?ProjectPK=4167.
———. 2008. The Natural Resource Projects Inventory. University of California Davis 2008 [cited December 3 2008]. Available from http://www.ice.ucdavis.edu/nrpi/Home.aspx.
Institute of Governmental Studies. 2008. Proposition 84: Safe Drinking Water Act of 2006. University of California Berke-ley 2006 [cited December 17 2008]. Available from http://igs.berkeley.edu/library/election2006/Prop84.html.
Janis, Robert. 2009. California State Program Provides Help to Off-Highway Recreationists. ATVSource.com 2008 [cited March 5 2009]. Available from http://www.atvsource.com/articles/articles/2008/041108_ca_state_program_provides_help_ohv_recreationists.htm.
Johnson, Breeann. 2006. Opportunities for Investing in Restora-tion Work in Montana. Missoula, MT: Wildlands CPR.
Kok, Kris. December 10, 2008. Interview by Author.
Kwiatkoski, Paul. 2009. Municipal Market Struggles to Maintain Broad Retail Participation without Bond Insurance. Munici-pal Finance Journal 29:23-35.
Lake Tahoe Federal Interagency Partnership. 2006. Progress Report: Federal Actions at Lake Tahoe FY 2003-2005.
Lavendel, B. 2002. The Business of Ecological Restoration Ecologi-cal Restoration 20 (3):173-178.
League of Women Voters of California. 2009. Lwvc Position on Proposition 13 2000 [cited March 5 2009]. Available from http://ca.lwv.org/action/prop0003/prop13.html.
———. 2009. In Depth Analysis of Prop 40 2002 [cited March 5 2009]. Available from http://ca.lwv.org/lwvc/edfund/elections/2002mar/id/prop40.html.
———. 2009. Proposition 50 in Depth 2002 [cited March 5 2009]. Available from http://ca.lwv.org/lwvc/edfund/elections/2002nov/id/prop50.html.
Lies, Mitch. 2009. Despite Shortfall, Oregon Spending Rises. Capi-tal Press, July 9, 2009.
Maryland Department of Budget and Management. 2008. Operat-ing Budget Instructions FY 2008: Non-General Funds.
———. 2009. Fiscal Digest Fiscal Year 2009 Exhibit A: General Fund Budget Summary.
Maryland Department of Legislative Services. 2004. Fiscal Policy Note: Water Pollution - State Waters - the Bay Restoration Fund.
———. 2007. Fiscal Policy Note: Chesapeake Bay 2010 Trust Fund.
Maryland Department of the Environment. 2009. Bay Restoration Fund (Senate Bill 320) 2005 [cited March 17 2009]. Avail-able from http://www.mde.state.md.us/Water/CBWRF/in-dex.asp.
Montana Code Annotated. 15-38-104. Tax on Mineral Produc-tion.
Montana Department of Environmental Quality. 2007. Montana Nonpoint Source Management Plan Appendix E: Montana Natural Resource Funding Programs. Helena, MT.
Montana Office of Budget Programming and Planning. 2004. Vol-ume 2 - Governor’s Budget - Revenue Estimates: Coal Sever-ance Taxes. Helena, MT.
Nevada Committee on Natural Resources. 1999. Assembly Bill No. 285.
Oregon Legislative Committee Services. 2004. Oregon Plan for Salmon and Watersheds. Salem, OR.
Oregon Watershed Enhancement Board. 2008. Annual Perfor-mance Progress Report for Fiscal Year 2007-2008.
———. 2008. Oregon Plan Biennial Report 2007 - 2009. Salem, Oregon.
Palmeri, Christopher, and Elise Craig. 2009. Banks Turn the Screws on California. Business Week, July 9, 2009.
Progressive States Network, and Western Progress. 2007. Building a Restoration Economy: Legislation and Practice at the State Level.
Puget Sound Partnership. 2007. Puget Sound Conservation and Recovery Plan. State of Washington.
———. 2009. Estimates of Spending Related to Puget Sound.
Revised Code of Washington. 2008. Section 15.24.806.
Ribaudo, Marc, Leroy Hansen, Daniel Hellerstein, and Catherine Greene. 2008. The Use of Markets to Increase Private Invest-ment in Environmental Stewardship. Washington, DC: US Department of Agriculture Economic Research Service.
Samuels, Nick. 2009. The Impact of the Credit Crisis and Weaker Economy on U.S. States and Municipal Entities. Municipal Finance Journal 29:1-11.

Characteristics of Watershed Restoration Funding 19
Skoloff, Brian. 2009. Everglades Land Deal in Jeopardy from Com-petition. Associated Press, February 24, 2009.
Smith, Kevin B., Alan Greenblatt, and Michele Mariani. 2008. Gov-erning States and Localities. Washington, DC: CQ Press.
Society for Ecological Restoration. 2005. The SER International Primer on Ecological Restoration. Tudson: Society for Eco-logical Restoration.
South Florida Ecosystem Restoration Program. 2008. Cross-Cut Budget: Task Force Working Document.
South Florida Water Management District. 2007. Strategic Plan: 2008-2018. West Palm Beach, Florida.
———. 2008. Budget Document: Fiscal Year 2009. West Palm Beach, Florida.
State of California. 2008. CALFED Bay-Delta Program 2007 [cited December 16 2008]. Available from http://calwater.ca.gov/index.aspx.
Summers, Robert M. 2009. Bay Restoration Fund Advisory Com-mittee: Annual Status Report. State of Maryland.
Tahoe Regional Planning Agency. 2001. Finance Plan to Imple-ment the Environmental Improvement Program for the Ta-hoe Basin.
———. 2008. Environmental Improvement Program Progress Re-port: 1997-2008. Stateline, NV.
U.S. Senator Diane Feinstein. 2003. The Lake Tahoe Restoration Act: Sponsored by Senator Dianne Feinstein; Signed into Law on November 13, 2000. Washington, DC.
Virginia Department of Conservation and Recreation. 2009. Ches-apeake Bay Restoration Fund 2006 [cited March 17 2009]. Available from http://www.dcr.virginia.gov/soil_&_water/bayfund.shtml.
Walder, Bethanie. 2008. New Partnerships Bring Funding and Res-toration to National Forest Watersheds. Road-RIPorter 13 (1).
Washington Department of Ecology. 2008. Focus Sheet: Water Quality Program: Water Quality Grants and Loans.
Wildasin, David E. 2009. State and Local Government Finance in the Current Crisis: Time for Emergency Federal Relief? Mu-nicipal Finance Journal 29:49-64.
Wildlands CPR. 2009. Legacy Roads and Trails Funding Data Released. United States Forest Service 2008 [cited April 1 2009]. Available from http://www.wildlandscpr.org/our-news/legacy-roads-and-trails-funding-data-released.
Wilson, Kelly. 2008. Senate Committee Reduces Chesapeake Bay Fund, Higher Education Budget. Capital News Service, March 7, 2008.