characteristics of pm2.5-bound secondary organic aerosol
TRANSCRIPT
Atmospheric Environment 237 (2020) 117710
Available online 17 June 20201352-2310/© 2020 Elsevier Ltd. All rights reserved.
Characteristics of PM2.5-bound secondary organic aerosol tracers in a coastal city in Southeastern China: Seasonal patterns and pollution identification
Taotao Liu a,b,c, Baoye Hu a,b,c, Xinbei Xu b,c,d, Youwei Hong a,b,*, Yanru Zhang a,b,c, Xin Wu a,b,c, Lingling Xu a,b, Mengren Li a,b, Yanting Chen a,b, Xiaoqiu Chen e, Jinsheng Chen a,b,**
a Center for Excellence in Regional Atmospheric Environment, Institute of Urban Environment, Chinese Academy of Sciences, Xiamen, 361021, China b Key Lab of Urban Environment and Health, Institute of Urban Environment, Chinese Academy of Sciences, Xiamen, 361021, PR China c University of Chinese Academy of Sciences, Beijing, 100086, PR China d College of Resource and Environment, Fujian Agriculture and Forestry University, Fuzhou, 350002, China e Fujian Environmental Monitoring Station, Fuzhou, 350001, China
H I G H L I G H T S
� SO42� and Hþinsitu had an increased impact on low-NOx SOAI products and later-generation SOAM products.
� The HO2 channel was the main chemical reaction of SOA during haze periods. � Biomass-burning plumes promoted precursor emissions and the formation of SOA during haze events with regional transport.
A R T I C L E I N F O
Keywords: Secondary organic aerosol (SOA) tracers PM2.5
Coastal area Air pollution Formation mechanisms
A B S T R A C T
Secondary organic aerosol (SOA) plays an important role in global climate change and air quality, and SOA tracers most directly characterize the sources and formation mechanisms of SOA. Four seasons of observation of SOA tracers was carried out in a coastal city of southeastern China. Fourteen PM2.5-bound SOA tracers, including isoprene (SOAI), α/β-pinene (SOAM), β-caryophyllene (SOAC), and toluene (SOAA), were measured using the GC–MS method. The concentrations of SOA tracers in Fuzhou were 25.9 � 19.9 ng m� 3 (SOAM), 7.45 � 8.53 ng m� 3 (SOAI), 3.15 � 1.99 ng m� 3 (SOAC), and 2.63 � 1.54 ng m� 3 (SOAA). The elevated SOAI concentration in summer was mainly controlled by high biogenic isoprene emission and strong oxidation, and biomass burning contributed strongly to DHOPA (SOAA) in fall. SO4
2� and Hþinsitu had an increased impact on later-generation SOAI products and low-NOx SOAM products. Based on the ratio of MGA/MTLs and MBTCA/(PA þ PNA), at-mospheric oxidation capacity (Ox, ¼NO2þO3) had a significant impact on the aerosol aging of SOA tracers. The increased proportions of low-NOx SOAI products were 3.23–7.21 times higher than those of high-NOx products from non-haze to haze periods, suggesting the influence of high SO4
2� concentration and RH on the reaction channel for SOAI formation. The percentages of later-generation SOAM products during RT were 2.46 times higher than those of first-generation products, suggesting the influence of aerosol aging during the regional transport. Both continental Asian outflow and biomass-burning plumes promoted precursor emissions and the formation process of SOA during the haze pollution events. These related findings help to understand the occurrence, sources and formation of SOA in coastal areas.
* Corresponding author. Center for Excellence in Regional Atmospheric Environment, Institute of Urban Environment, Chinese Academy of Sciences, Xiamen, 361021, China. ** Corresponding author. Center for Excellence in Regional Atmospheric Environment, Institute of Urban Environment, Chinese Academy of Sciences, Xiamen,
361021, China. E-mail addresses: [email protected] (Y. Hong), [email protected] (J. Chen).
Contents lists available at ScienceDirect
Atmospheric Environment
journal homepage: http://www.elsevier.com/locate/atmosenv
https://doi.org/10.1016/j.atmosenv.2020.117710 Received 4 January 2020; Received in revised form 29 April 2020; Accepted 13 June 2020
Atmospheric Environment 237 (2020) 117710
2
1. Introduction
Secondary organic aerosol (SOA) is an important component of at-mospheric aerosols, which have important effects on visibility, climate change and human health (Ervens et al., 2011; Ehn et al., 2014; Liu et al., 2019). SOA is believed to be made up of biogenic SOA (BSOA), which is transformed from biogenic volatile organic compounds, with anthropogenic SOA (ASOA) also playing an important role in urban areas (Fu et al., 2016; Stone et al., 2010; Rattanavaraha et al., 2016). Due to the complexity of SOA precursors and formation mechanisms, there remains a lack of comprehensive understanding of the chemical composition, sources, condensation, and distribution of SOA.
The composition, main sources and reaction mechanisms of SOA can be characterized most directly using SOA tracers (Jaoui et al., 2007; Feng et al., 2013). The temporal and spatial distribution and sources of SOA tracers have been investigated based on field observations (Tang et al., 2018; Ding et al., 2011); related results have shown that emissions of NOx, SO2, Ox (Ox ¼ O3þNO2), sulfate, and POA (primary organic aerosol) originating from anthropogenic activities can increase BSOA yields by different amounts (Carlton et al., 2018; Zhang et al., 2019). Moreover, aerosol acidity, controlled by sulfate, relative humidity (RH), and liquid water content (LWC), increases SOA amounts via the salting-in effect and acid-catalyzed reactions (Li et al., 2013; McFiggans et al., 2019). NOx levels impact the proportions of low- and high-NOx products of isoprene (Hong et al., 2019) and enhance secondary monoterpene reactions via nitrate radical oxidation (Xu et al., 2015). Ox and POA increase SOA yields via atmospheric oxidation and emissions of precursors, respectively (Zhang et al., 2019). SO2 and sulfate can in-crease aerosol acidity by providing abundant acidic particles to accel-erate SOA production, while high RH and LWC reduce aerosol acidity by influencing viscosity and the phase diffusion of the aerosol particulates to inhibit SOA production (Li et al., 2013; Liu et al., 2014b; Slade et al., 2014). However, there are still uncertainties as to the distribution and sources of SOA tracers, due to the complexity of the different precursors and environmental conditions.
Globally, studies on the distribution characteristics of SOA tracers have mainly concentrated on densely populated areas, rural areas neighboring cities, and remote areas (such as plateau areas and moun-tain background sites) (Shen et al., 2015; Ghirardo et al., 2016; Lyu et al., 2017; Kleindienst et al., 2012). In China, such studies have mainly
concentrated on areas with severe air pollution, such as Beijing-Tianjin-Hebei, the Yangtze River Delta, and the Pearl River Delta region (Hu et al., 2008; Feng et al., 2013; Liu et al., 2014a). However, there is a lack of research on southeastern coastal areas with subtropical features, relatively high humidity, dense vegetation, and strong atmo-spheric oxidation. The typical geographical environment in the south-eastern coastal areas provides a good opportunity to study the pollution characteristics of aerosol under the influence of multiple factors. Our previous ground-based observations in a mountainous forest area showed that BSOA tracers were the largest contributor to SOA (Hong et al., 2019). Moreover, in urban regions, the combined effects of port shipping emission, sea salt aerosol, and monsoon on the formation and transformation of atmospheric aerosols have been observed (Fu et al., 2009; Xu et al., 2018). An in-depth study on the characteristics and sources of SOA tracers in urban agglomerations will therefore be of great significance for understanding the formation of SOA in coastal areas.
In this study, we chose the coastal city of Fuzhou to conduct field monitoring of SOA tracers for one year, and focused on (1) the seasonal pattern of SOA tracers and their contribution to secondary organic carbon (SOC), (2) the effects of high and low NOx, aerosol aging degree, acidity, sulfate, and regional transport on SOA tracers, and (3) source and pollution identification by SOA tracers during typical haze events. These findings will help to understand the formation mechanisms of SOA in coastal areas, and provide a scientific basis for more in-depth research on haze pollution.
2. Materials and methods
2.1. Field sampling
The coastal city of Fuzhou (26.11�N, 119.29�E), with 54.7% forest coverage, is the core area for rapid urbanization in the southeast of China. Fuzhou is located at the west coast of the Taiwan Strait, and haze events occasionally occur in winter due to local sources and long-range transport from the Yangtze River Delta. Aerosol sampling campaigns were carried out on the rooftop of a 15 m high building in the old town of the city, surrounded by residential areas. Daily PM2.5 filter samples were collected, using an air sampler (TH1000H, Wuhan Tianhong, China) at a flow rate of 1.05 m3 min� 1, during Oct.–Nov. of 2016 (fall) and Jan.– Feb. (winter), Apr.–May (spring), and Jul.–Aug. (summer) of 2017.
Table 1 Concentrations of secondary organic aerosol (SOA) tracers (ng⋅m� 3), secondary organic carbon (SOC) (μgC⋅m� 3), and criteria air pollutants (μg⋅m� 3) in four seasons.
Components Fall Winter Spring Summer
avg.�std. min-max avg.�std. min-max avg.�std. min-max avg.�std. min-max
2-methylglyceric acid (MGA) 0.57 � 0.35 0.12–1.45 0.83 � 0.36 0.42–1.69 1.4 � 1.29 0.51–5.15 3.28 � 1.61 1.43–6.39 C5-alkene triols 0.67 � 0.9 0.06–3.04 0.19 � 0.15 0.03–0.58 0.44 � 0.33 0.09–1.01 1.5 � 1.24 0.31–4.24 2-methyltetrols (MTLs) 5.15 � 5.16 0.51–19.2 1.33 � 0.76 0.5–3.33 4.69 � 4.95 0.57–16 15 � 8.27 4.33–32.7 Sum of isoprene SOA tracer (SOAI) 6.4 ± 6.28 0.78–23 2.36 ± 1.19 1.12–5.5 6.52 ± 6.2 1.23–22.2 19.8 ± 10.2 7.61–39.4 Pinic acid (PA) 4.24 � 3.17 1.22–12 4.4 � 4.12 0.58–17.1 4.22 � 3.36 1.04–12.1 3.8 � 1.66 1.62–7.24 Pinonic acid (PNA) 1.83 � 1.6 0.37–5.73 3.61 � 2.26 0.44–8.26 6.52 � 3.72 1.26–12.2 9.16 � 5.05 2.48–16.1 3-hydroxyglutaric acid (HGA) 7.15 � 6.98 0.4–25.9 6.29 � 4.58 0.55–17.2 9.95 � 8.54 0.57–32.1 13.1 � 8.59 2.6–24.8 3-acetylglutaric acid (AGA) 0.61 � 0.51 0.13–1.81 0.45 � 0.35 0.02–1.53 0.65 � 0.58 0.06–2.22 1.12 � 0.9 0.06–2.94 3-hydroxy-4,4-dimethylglutaric acid (HDMGA) 2.64 � 2.87 0.37–11.5 2.73 � 1.9 0.23–7.22 4.82 � 4.13 0.32–13.4 6.52 � 4.04 1.23–12.1 3-methyl-1,2,3 butanetricarboxylic acid (MBTCA) 3.28 � 3.61 0.44–11.6 1.26 � 1.07 0.18–3.93 3.86 � 4.09 0.47–15.5 8.98 � 6.26 1.78–18.4 Sum of α/β-pinene SOA tracer (SOAM) 19.8 ± 17.1 3.78–57.1 18.7 ± 12.4 3.5–53.1 30.0 ± 21.2 4.35–77.5 42.7 ± 24.0 13.1–76.3 2,3-Dihydroxy-4-oxopentanoic acid (DHOPA/SOAA) 2.43 � 1.58 0.83–6.3 2.84 � 1.66 0.52–6.31 2.3 � 1.56 0.1–6.01 2.92 � 1.29 1.25–4.6 β-caryophyllinic acid (CPA/SOAC) 2.41 � 1.55 1.01–5.57 4.46 � 2.31 0.36–8.82 2.59 � 1.55 0.37–5.1 2.38 � 1.02 1.09–3.92 malic acid 7.99 � 7.53 1.59–30.2 8.03 � 5.43 0.77–20.1 9.66 � 8.72 0.19–34.4 14.7 � 11.4 0.84–34.6 levoglucosan 39.5 � 27.1 7.6–105 62.3 � 28.3 21.3–121.5 58.3 � 71.5 15–279 28.1 � 20.6 6.74–75.6 SOC isoprene (SOCI) 0.04 � 0.04 0.01–0.15 0.02 � 0.01 0.01–0.04 0.04 � 0.04 0.01–0.14 0.13 � 0.07 0.05–0.25 SOC α/β-pinene (SOCM) 0.33 � 0.29 0.06–0.97 0.32 � 0.21 0.06–0.9 0.51 � 0.36 0.07–1.31 0.72 � 0.41 0.22–1.29 SOCβ-caryophyllene (SOCC) 0.1 � 0.07 0.04–0.24 0.19 � 0.1 0.02–0.38 0.11 � 0.07 0.02–0.22 0.1 � 0.04 0.05–0.17 SOC tolune (SOCA) 0.31 � 0.2 0.11–0.8 0.36 � 0.21 0.07–0.8 0.29 � 0.2 0.01–0.76 0.37 � 0.16 0.16–0.58 NO2 32 � 12.1 15–52.2 29.3 � 10.5 15.5–46.9 36.2 � 15.5 19.9–62.3 32.1 � 12.2 14.7–54.2 O3 47.5 � 19.3 17.6–75.2 71.5 � 48.4 9.35–168 41.2 � 26.8 7.98–102 60.5 � 23.4 17.6–104 PM10 39.7 � 17.7 18.7–70.8 42.4 � 13.4 15.9–73.7 60.9 � 34.2 27–152 48.8 � 23.1 21.4–85.1 PM2.5 26 � 12.3 11–48 33.2 � 10.7 16.6–53.8 39.1 � 25.7 15–115 23.6 � 10.6 9.02–41.3
T. Liu et al.
Atmospheric Environment 237 (2020) 117710
3
Quartz filters (Whatman, USA, 47 mm and 8 � 10 inch) were used for water-soluble inorganic ions, organic carbon (OC), elemental carbon (EC) and SOA tracers. 61 sets of PM2.5 samples (15 sets of PM2.5 samples in fall, 21 in winter, 14 in spring, 11 in summer) and 4 sets of blank samples were collected. Due to the rainfall during the sampling period, there are fewer samples in summer. Meanwhile, strict quality assurance and quality control were applied throughout the sampling period, including checking the flow of the samplers and cleaning the PM2.5 cyclone. The sampled filters were stored at � 20 �C, covered with aluminum foil, until pretreatment analysis. During the sampling campaign, meteorological data were measured at the monitoring sites.
2.2. Chemical analysis
Aliquots of the filters were extracted three times each with dichloromethane/methanol (2:1 vol ratio) under ultrasonication for 10 min. The solvent extracts were filtered through a polytetrafluorethylene (PTFE) syringe filter (SCAA-214, Shanghai ANPEL, China, 0.22 μm pore size), concentrated using a water bath nitrogen blower (WD-12, Hang-zhou AOSHENG, China), and dried with a flow of high-purity nitrogen. The extracts were then derivatized with 50 μL of N,O-bis-(trimethylsilyl) trifluoroacetamide (BSTFA) with 1% trimethylsilyl chloride, and 10 μL of pyridine at 70 �C for 3 h. The derivatives were diluted by the addition of 140 μL of n-hexane containing 1.057 ng μL� 1 of the internal standard (C13 n-alkane) prior to gas chromatography/mass spectrometer (GC–MS) analysis. The SOA tracer analysis procedure is described in detail in our previous study (Hong et al., 2019). The derivatized extracts were analyzed using GC–MS (Agilent 7890A/5975C, Agilent Technol-ogies, Inc., USA) with a DB-5MS fused silica capillary column (i.d. 30 �0.25 mm, 0.5 μm film thickness). One microliter of the sample was injected in splitless mode, and high-purity helium (99.99%) was used as the carrier gas at a constant flow of 1.0 mL min� 1. The GC temperature was initiated at 100 �C (held for 2 min), then increased to 300 �C at 6 �C⋅min� 1, and finally kept at 300 �C for 10 min. The MS was operated in electron ionization (EI) mode at 70 eV and the MS scanned from m/z 50 to m/z 650.
This study analyzed isoprene tracers (SOAI: 2-methylglyceric acid (MGA), two 2-methyltetrols (MTLs: 2-methylthreitol and 2-methylery-thritol), and three C5-alkene triols (cis-2-methyl-1,3,4-trihydroxy-1- butene, trans-2-methyl-1,3,4-trihydroxy-1-butene, and 3-methyl-2,3,4- trihydroxy-1-butene)), α/β-pinene tracers (SOAM: 3-hydroxyglutaric acid (HGA), pinic acid (PA), pinonic acid (PNA), 3-methyl-1,2,3-butane-tricarboxylic acid (MBTCA), 3-hydro-4,4-dimethyglutaric acid (HDMGA), and 3-acetylglutaric acid (AGA)), one sesquiterpene tracer (SOAC: β-carophyllene (CPA)), one toluene tracer (SOAA: 2,3-dicarboxy-levulinic acid (DHOPA)), a biomass burning tracer (levoglucosan) and a small-molecule carboxylic acid (malic acid) (Table 1). For the quanti-fication of levoglucosan, malic acid, HGA, PA, and PNA concentrations, their GC/MS response factors were determined using authentic stan-dards. Owing to the lack of commercial standards, MBTCA, HDMGA and AGA (SOAM tracers) concentrations were determined using malic acid as a standard (Fu et al., 2010). Concentrations of MGA, the C5-alkene triols, and the MTLs (SOAI tracers) were quantified using erythritol as a stan-dard. The CPA concentration was estimated using the response factor of PA, and the DHOPA concentration was calculated assuming that the response factor of this acid was equivalent to that of citramalic acid (Fu et al., 2010; Ding et al., 2017).
Cations (Naþ, NH4þ, Kþ, Ca2þand Mg2þ) and anions (F� , Cl� , NO3
�
and SO42� ) were measured via by an ion chromatography (IC) analyzer
(ICS-3000, Dionex Inc., USA). The filter was extracted with ultrapure water via ultrasonic bath, and the extracts were then filtered. Cations were analyzed with an IonPac CSRS-4 suppressor with an IonPac CS12A�250 mm analytical column and anions were analyzed with an IonPac ASRS-4 suppressor with an IonPac AS11HC � 250 mm analytical column.
EC and OC in PM2.5 were measured using a thermal-optical
transmittance (TOT) carbon analyzer (Sunset Model-4, USA), following the National Institute for Occupational Safety and Health (NIOSH) protocol. The filter placed in the oven was heated in a pure helium (He) and a mixed atmosphere (98% Heþ2% O2) up to 850 �C in stepwise increments to convert all organic compounds into CO2 by a manganese dioxide (MnO2) catalyst. Then non-dispersive infrared (NDIR) system detected CO2. In this stage, OC and EC split was corrected as the laser transmittance returned to the initial value. The detailed analytical procedure is described in our previous study (Deng et al., 2018; Liu et al., 2020).
The atmospheric pollutants O3, SO2, NO–NO2–NOx, and CO were measured using online Thermo Instruments TEI 49i, 43i, 42i, and 48i (Thermo Fisher Scientific, Waltham, MA, USA), respectively. The meteorological parameters temperature (T), pressure (P), wind direction (WD), wind speed (WS), and relative humidity (RH) (MAWS 301, Vai-sala, Finland) were measured simultaneously.
2.3. Quality control and quality assurance
Using the same analytical method, none of the targeted compounds was detected in the field or laboratory blanks. The recovery rates of citramalic acid, erythritol, PA, PNA, HGA, malic acid, and levoglucosan (authentic standards spiked into solvent with prebaked quartz filters) were 90 � 16%, 79 � 11%, 68 � 8%, 79 � 18%, 94 � 23%, 67 � 7%, and 108 � 36%, respectively. In the duplicate samples (n ¼ 6), the targeted compounds differed by less than 15%. The reported concentrations of SOA tracers were not corrected for recovery. Ketopinic acid (KPA), used as the surrogate for the quantification of all SOA tracers, was added into each filter (Kleindienst et al., 2007) and the recovery rates of KPA were kept at 101 � 27%. The errors in analysts measurement were included the uncertainties in field blanks, spike recoveries, repeatability, and surrogate quantification. Based on the empirical approach of calculating uncertainties from surrogate quantification (Stone et al., 2012), the estimated uncertainties of SOA tracers’ measurement ranged from 10% (MTLs) to 124% (CPA) (Table S1).
To measure the concentrations of water-soluble ions in PM2.5, a point concentration of 10 ppm of standard solution was tested for every 10 samples, and the correlation coefficient of the standard curve applied to these tests should be greater than 0.995. The detailed analytical pro-cedure is described in our previous study (Liu et al., 2020). The error in the repeated samples of ions was less than 10%, while the measurement error of PM2.5 was less than 5%.
2.4. Data analysis
2.4.1. Aerosol acidity calculation Aerosol acidity was estimated using a thermodynamic model,
ISORROPIA-II (http://isorropia.eas.gatech.edu), according to our pre-vious studies (Wu et al., 2020). The daily averaged SO4
2� , NO3� , NH4
þ, Naþ, Cl� , Kþ, Ca2þ, and Mg2þ concentrations measured in PM2.5 as well as RH, T, and NH3 were used as inputs into the model. The ISORROPIA-II model estimates the concentrations of free Hþ (Hþinsitu, μg⋅m� 3) and liquid water content (LWC, μg⋅m� 3) (Hennigan et al., 2015). The pH values from ISORROPIA II were calculated using the following equation:
pH¼—lg�
1000� Hþ insitu
LWC
�
(1)
2.4.2. Estimation of SOC using a tracer-based method A tracer-based method was applied to estimate the SOC formed
through the oxidation of isoprene (SOCI), α/β-pinene (SOCM), β-car-yophyllene (SOCC), or toluene (SOCA) (Kleindienst et al., 2007; Offen-berg et al., 2007). Kleindienst et al. (2007) obtained the mass fraction of tracers in SOC (fSOC) for individual precursors by using smog-chamber experimental data for different hydrocarbon/NOx mixtures:
T. Liu et al.
Atmospheric Environment 237 (2020) 117710
4
[SOC] ¼P
i[tri]/fSOC (2)
where [SOC] is the mass concentration of SOC and P
i [tri] is the con-centration of various types of SOA tracers. The fSOC values of isoprene, α/β-pinene, β-caryophyllene, and toluene were 0.155 � 0.111, 0.059 �0.111, 0.023 � 0.0046, and 0.0079 � 0.0026, respectively. It is assumed that the smog-chamber fSOC values are the same as those in the ambient air. The SOC from different SOA tracers was estimated using the above equation.
The correlations between different SOA tracers and meteorological parameters were examined using the Pearson correlation method (IBM SPSS Statistics for Windows, Version 19.0., SPSS Inc., US). The differ-ences for chemical species in different seasons were studied using an ANOVA test.
3. Results and discussion
3.1. Concentrations of SOA tracers and estimated SOC concentrations
As shown in Table 1, SOAM (25.9 � 19.9 ng m� 3) was the predom-inant component of total SOA tracers, followed by SOAI (7.45 � 8.53 ng m� 3), SOAC (3.15 � 1.99 ng m� 3) and SOAA (2.63 � 1.54 ng m� 3). Isoprene mostly originates from deciduous plants and broad-leaved trees, while monoterpene, including α/β-pinene, is mainly emitted by citrus and coniferous plants (Carlton et al., 2009; Fu et al., 2009; Ding et al., 2014; Shrivastava et al., 2017). The ratio of coniferous to broad-leaved forest in Fuzhou is roughly 13:1 (Xie et al., 2016), resulting in the highest proportion of SOAM during the whole year. For the esti-mated SOC, the descending order of SOA tracers is as follows: SOCM (0.44 � 0.34 μg m� 3) > SOCA (0.33 � 0.19 μg m� 3) > SOCC (0.14 � 0.09 μg m� 3) > SOCI (0.04 � 0.05 μg m� 3). Although the percentage of SOAA tracer was the lowest (8 � 4%), SOCA made a relatively high contribu-tion (36 � 10%) to the total SOC. The results indicated that aromatic hydrocarbon emitted from anthropogenic activities potentially have a great impact on SOC in urban areas.
The characteristics of total SOA tracers and the estimated SOC had significant differences in four seasons (PANOVA < 0.05). The concentra-tions of total SOA tracers in Fuzhou were: summer (72.2 � 37 ng m� 3) >spring (45 � 29.4 ng m� 3) > fall (31 � 26 ng m� 3) > winter (28.6 �
15.7 ng m� 3). Because of flourishing vegetation and photoreactions, the concentrations of SOAI and SOAM were the largest in summer and lowest in winter (Fu et al., 2010; Lin et al., 2013). SOAC concentration was the highest in winter. CPA, the only tracer of SOAC, had a significant positive correlation with levoglucosan (P < 0.05), indicating the impact of biomass burning (Kawamura et al., 2005; Wang et al., 2010; Ding et al., 2017; Ciccioli et al., 2014). The variations of SOAA (2.31–2.84 ng m� 3) and SOCA (0.29–0.37 μg m� 3) concentrations in four seasons were neglected, but the proportion of SOCA were relatively high in fall and winter. As shown in Fig. S1, air masses originated from inland China to the monitoring site were frequently observed, suggesting the influence of continental Asian outflow. And fossil fuels combustion, solvent use and biomass burning were the main sources of aromatic hydrocarbons in urban areas. Ding et al. (2017) also found that the increase of biomass burning emissions and heating for warmth promoted the elevated SOAA concentration in fall and winter.
Many studies have shown that atmospheric oxidation (Ox) has various effects on SOA tracers in different seasons. (Ding et al., 2011; Pathak et al., 2004; Fu et al., 2009; Shrivastava et al., 2017). In this study, significant correlations between SOA tracers and Ox (P < 0.05) were found in summer and fall, while insignificant correlations were observed in winter and spring (Table S2). Seasonal variations of corre-lation parameter were consisted with the pattern of Ox level (Table S4). CPA and DHOPA showed significant correlations with levoglucosan in fall (r > 0.47, P < 0.05), indicating the influence of biomass burning. Crop residue burning during harvest periods was frequently happened in central and eastern China, and affected the monitoring site under long-range transport (Feng et al., 2013; Hong et al., 2019; Al-Naiema et al., 2020). In addition, positive significant correlations among malic acid and CPA with DHOPA were observed in all seasons, suggesting that the formation of SOA in urban areas was obviously affected by anthro-pogenic activities.
In Table 2, the concentrations of isoprene, α/β-pinene, β-car-yophyllene and toluene SOA tracers and the estimated SOC in different areas around the world are presented. In this study, the concentrations of SOAI were much lower than those at suburban, rural and mountainous forest sites, such as Wuxi, Sanya, Guangzhou, Mt. Wutyi and Birming-ham (Kleindienst et al., 2010; Ding et al., 2014; Rattanavaraha et al.,
Table 2 Concentrations (ng⋅m� 3) of SOA tracers and the estimated SOC (μgC⋅m� 3) around the world.
Site Season Isoprene products α/β-pinene products β-caryophyllene products Toluene products Reference
SOAa SOCb SOA SOC SOA SOC SOA SOC
Urban Fuzhou, China (PM2.5) Four seasons 7.45 0.04 25.9 0.42 3.15 0.13 2.63 0.33 This study Jinan, China (PM2.5) Four seasons 41.8 0.27 19.4 0.06 NA NA 1.1 0.13 Liu et al. (2019) Pearl River Delta, China Four seasons 23.2 0.11 47.2 0.8 3.85 0.17 NA NA Zhang et al. (2019) Kathmandu, Nepal Four seasons 174 0.83 59.3 1.01 6.31 0.27 19.4 2.45 Wan et al. (2019) Shanghai, China (PM2.5) Four seasons 15.3 0.1 4.13 0.02 0.58 0.03 1.33 0.17 Feng et al. (2013) Mumbai, India (PM10) Summer-winter 2.6 0.01 19.2 0.08 3.15 0.137 25.5 3.23 Fu et al. (2016) Birmingham, AL, USA (PM2.5) Spring-summer 202 1.92 126 2.11 1.97 0.05 1.92 0.24 Kleindienst et al. (2010) Mexico City, Mexico (PM2.5) Spring 33.9 0.22 48.4 0.21 3.4 0.15 14.7 1.86 Stone et al. (2010) Fuzhou, China (PM2.5) Summer 19.8 0.11 42.7 0.72 2.38 0.1 2.92 0.37 This study Hong Kong, China (PM2.5) Summer 30 0.19 198 3.36 13 0.57 NAc NA Hu et al. (2008) Riverside, CA, USA (PM2.5) Summer 23.3 0.15 43.89 0.74 0.92 0.04 NA NA Kleindienst et al. (2012) Suburban/Rural Guangzhou, China (PM2.5) Four seasons 56.6 0.18 35.1 0.6 4.04 0.18 1.51 0.19 Yuan et al. (2018) Wuxi, China (TSP) Summer 152 0.87 15.3 0.26 6.73 0.29 3.62 0.46 Ding et al. (2014) Sanya, China (TSP) Summer 65.3 0.37 3.12 0.05 3.05 0.13 1.51 0.19 Ding et al. (2014) Mountain/valley Mt. Wuyi, China (PM2.5) Four seasons 45.3 0.21 29.6 0.13 5.99 0.23 0.24 0.03 Hong et al. (2019) Mt. Fuji, Japan (TSP) Summer 69 0.34 39 0.17 0.74 0.03 NA NA Fu et al. (2014) Marine Alert, Canada (PM2.5) Winter-summer 0.3 0.002 1.65 0.008 0.12 0.005 NA NA Fu et al. (2009) East China Sea (TSP) Summer 8.4 0.04 11.6 0.05 2.9 0.13 NA NA Kang et al. (2018) Arctic Ocean (PM2.5) Summer 4 0.06 4.8 0.04 0.017 0.0006 NA NA Fu et al. (2013)
a The SOA is the sum of all the corresponding tracers. b SOC are estimated using the tracer-based method. c “NA” means not available.
T. Liu et al.
Atmospheric Environment 237 (2020) 117710
5
2016; Hong et al., 2019). SOAM concentrations were comparable to those in most cities, but much lower than in Hong Kong and Birming-ham, which might be mainly due to strong emissions of biogenic VOCs and atmospheric oxidation conditions (Hu et al., 2008; Fu et al., 2016; Feng et al., 2013). Overall, the SOAA concentrations at urban sites were higher than in mountains, and the lowest concentrations of SOA tracers in marine studies were found. For the estimated SOC, major precursor of SOA tracers at urban sites was mainly from aromatic hydrocarbon and α/β-pinene, relying on the difference of local sources and the gas-particle partitioning of the oxidation products (Fu et al., 2016; Stone et al., 2010). The largest contribution of SOAC on the total SOC at Mt. Wuyi and Mumbai were observed, indicating the impact from local and regional biomass burning (Hong et al., 2019; Fu et al., 2016). For oceans, the emissions of BSOC originated mainly from continental outflow and marine phytoplankton (Kang et al., 2018; Fu et al., 2009, 2013). High concentrations of SOA tracers and SOC were found over the East China Sea, compared with polar oceans (Kang et al., 2018).
3.2. Pollution identification by SOA tracers
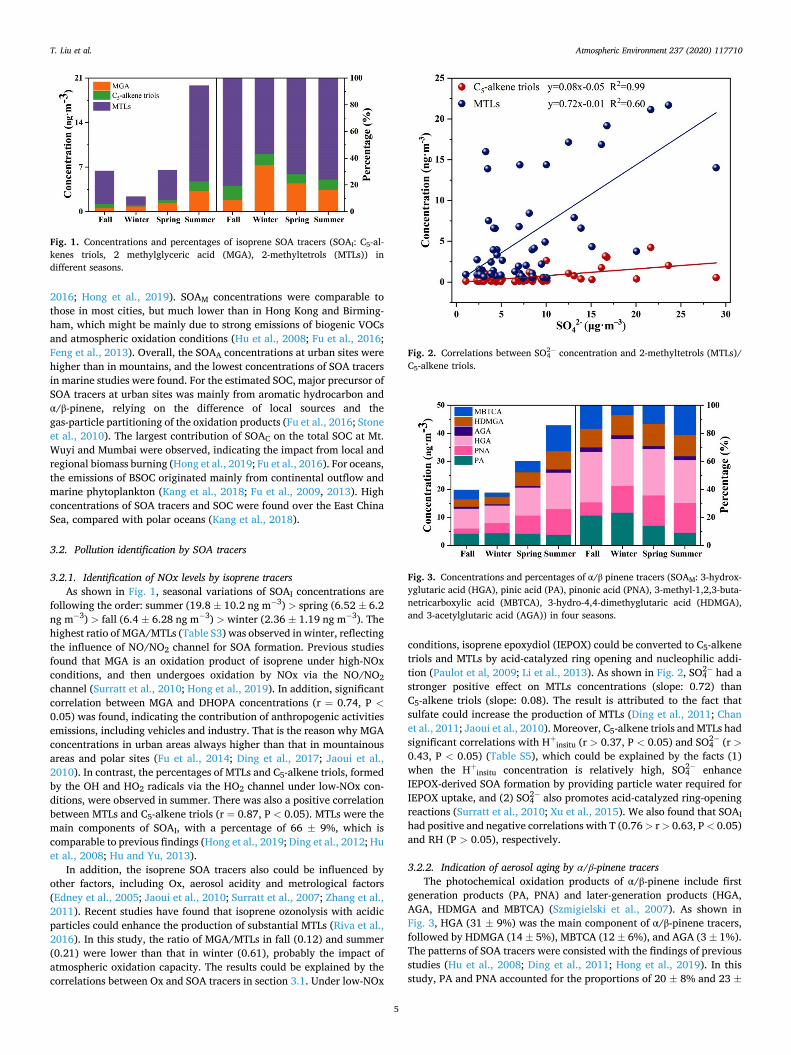
3.2.1. Identification of NOx levels by isoprene tracers As shown in Fig. 1, seasonal variations of SOAI concentrations are
following the order: summer (19.8 � 10.2 ng m� 3) > spring (6.52 � 6.2 ng m� 3) > fall (6.4 � 6.28 ng m� 3) > winter (2.36 � 1.19 ng m� 3). The highest ratio of MGA/MTLs (Table S3) was observed in winter, reflecting the influence of NO/NO2 channel for SOA formation. Previous studies found that MGA is an oxidation product of isoprene under high-NOx conditions, and then undergoes oxidation by NOx via the NO/NO2 channel (Surratt et al., 2010; Hong et al., 2019). In addition, significant correlation between MGA and DHOPA concentrations (r ¼ 0.74, P <0.05) was found, indicating the contribution of anthropogenic activities emissions, including vehicles and industry. That is the reason why MGA concentrations in urban areas always higher than that in mountainous areas and polar sites (Fu et al., 2014; Ding et al., 2017; Jaoui et al., 2010). In contrast, the percentages of MTLs and C5-alkene triols, formed by the OH and HO2 radicals via the HO2 channel under low-NOx con-ditions, were observed in summer. There was also a positive correlation between MTLs and C5-alkene triols (r ¼ 0.87, P < 0.05). MTLs were the main components of SOAI, with a percentage of 66 � 9%, which is comparable to previous findings (Hong et al., 2019; Ding et al., 2012; Hu et al., 2008; Hu and Yu, 2013).
In addition, the isoprene SOA tracers also could be influenced by other factors, including Ox, aerosol acidity and metrological factors (Edney et al., 2005; Jaoui et al., 2010; Surratt et al., 2007; Zhang et al., 2011). Recent studies have found that isoprene ozonolysis with acidic particles could enhance the production of substantial MTLs (Riva et al., 2016). In this study, the ratio of MGA/MTLs in fall (0.12) and summer (0.21) were lower than that in winter (0.61), probably the impact of atmospheric oxidation capacity. The results could be explained by the correlations between Ox and SOA tracers in section 3.1. Under low-NOx
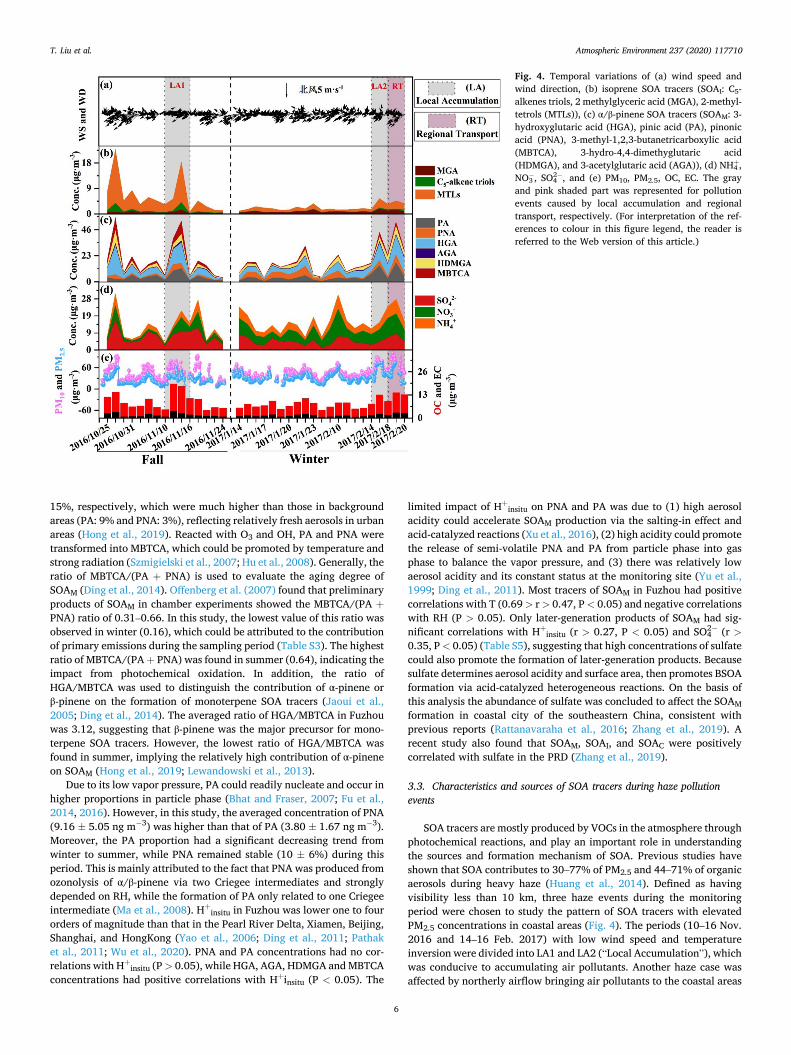
conditions, isoprene epoxydiol (IEPOX) could be converted to C5-alkene triols and MTLs by acid-catalyzed ring opening and nucleophilic addi-tion (Paulot et al, 2009; Li et al., 2013). As shown in Fig. 2, SO4
2� had a stronger positive effect on MTLs concentrations (slope: 0.72) than C5-alkene triols (slope: 0.08). The result is attributed to the fact that sulfate could increase the production of MTLs (Ding et al., 2011; Chan et al., 2011; Jaoui et al., 2010). Moreover, C5-alkene triols and MTLs had significant correlations with Hþinsitu (r > 0.37, P < 0.05) and SO4
2� (r >0.43, P < 0.05) (Table S5), which could be explained by the facts (1) when the Hþinsitu concentration is relatively high, SO4
2� enhance IEPOX-derived SOA formation by providing particle water required for IEPOX uptake, and (2) SO4
2� also promotes acid-catalyzed ring-opening reactions (Surratt et al., 2010; Xu et al., 2015). We also found that SOAI had positive and negative correlations with T (0.76 > r > 0.63, P < 0.05) and RH (P > 0.05), respectively.
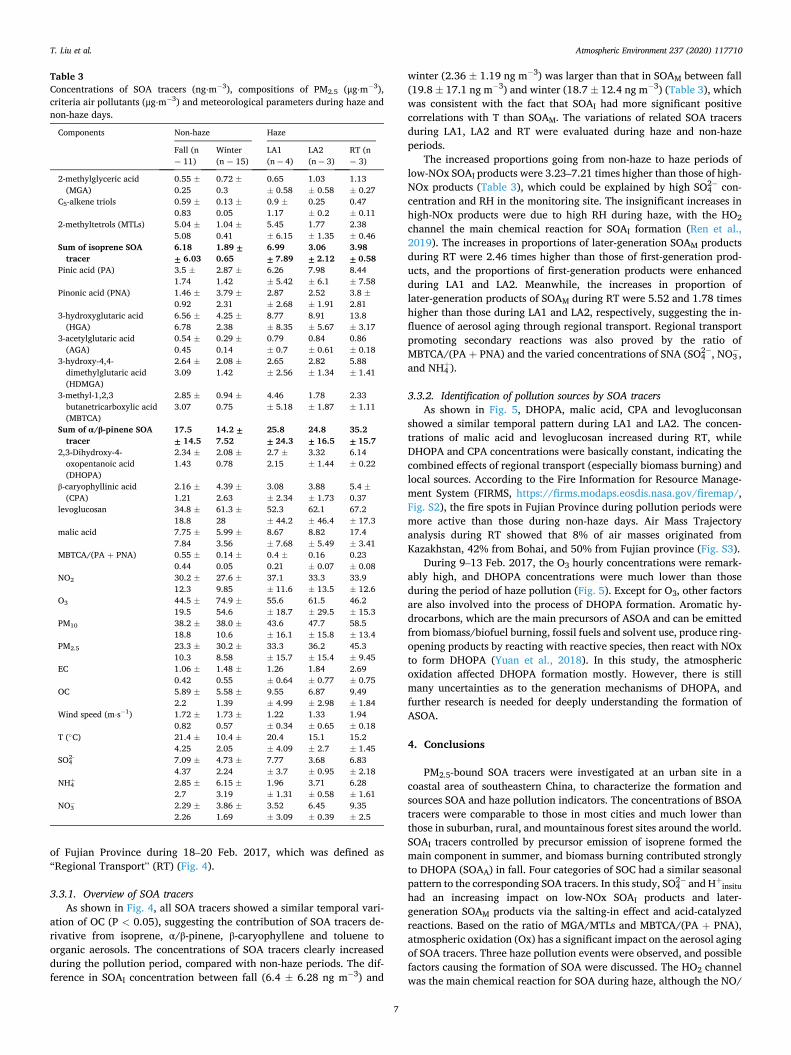
3.2.2. Indication of aerosol aging by α/β-pinene tracers The photochemical oxidation products of α/β-pinene include first
generation products (PA, PNA) and later-generation products (HGA, AGA, HDMGA and MBTCA) (Szmigielski et al., 2007). As shown in Fig. 3, HGA (31 � 9%) was the main component of α/β-pinene tracers, followed by HDMGA (14 � 5%), MBTCA (12 � 6%), and AGA (3 � 1%). The patterns of SOA tracers were consisted with the findings of previous studies (Hu et al., 2008; Ding et al., 2011; Hong et al., 2019). In this study, PA and PNA accounted for the proportions of 20 � 8% and 23 �
Fig. 1. Concentrations and percentages of isoprene SOA tracers (SOAI: C5-al-kenes triols, 2 methylglyceric acid (MGA), 2-methyltetrols (MTLs)) in different seasons.
Fig. 2. Correlations between SO42� concentration and 2-methyltetrols (MTLs)/
C5-alkene triols.
Fig. 3. Concentrations and percentages of α/β pinene tracers (SOAM: 3-hydrox-yglutaric acid (HGA), pinic acid (PA), pinonic acid (PNA), 3-methyl-1,2,3-buta-netricarboxylic acid (MBTCA), 3-hydro-4,4-dimethyglutaric acid (HDMGA), and 3-acetylglutaric acid (AGA)) in four seasons.
T. Liu et al.
Atmospheric Environment 237 (2020) 117710
6
15%, respectively, which were much higher than those in background areas (PA: 9% and PNA: 3%), reflecting relatively fresh aerosols in urban areas (Hong et al., 2019). Reacted with O3 and OH, PA and PNA were transformed into MBTCA, which could be promoted by temperature and strong radiation (Szmigielski et al., 2007; Hu et al., 2008). Generally, the ratio of MBTCA/(PA þ PNA) is used to evaluate the aging degree of SOAM (Ding et al., 2014). Offenberg et al. (2007) found that preliminary products of SOAM in chamber experiments showed the MBTCA/(PA þPNA) ratio of 0.31–0.66. In this study, the lowest value of this ratio was observed in winter (0.16), which could be attributed to the contribution of primary emissions during the sampling period (Table S3). The highest ratio of MBTCA/(PA þ PNA) was found in summer (0.64), indicating the impact from photochemical oxidation. In addition, the ratio of HGA/MBTCA was used to distinguish the contribution of α-pinene or β-pinene on the formation of monoterpene SOA tracers (Jaoui et al., 2005; Ding et al., 2014). The averaged ratio of HGA/MBTCA in Fuzhou was 3.12, suggesting that β-pinene was the major precursor for mono-terpene SOA tracers. However, the lowest ratio of HGA/MBTCA was found in summer, implying the relatively high contribution of α-pinene on SOAM (Hong et al., 2019; Lewandowski et al., 2013).
Due to its low vapor pressure, PA could readily nucleate and occur in higher proportions in particle phase (Bhat and Fraser, 2007; Fu et al., 2014, 2016). However, in this study, the averaged concentration of PNA (9.16 � 5.05 ng m� 3) was higher than that of PA (3.80 � 1.67 ng m� 3). Moreover, the PA proportion had a significant decreasing trend from winter to summer, while PNA remained stable (10 � 6%) during this period. This is mainly attributed to the fact that PNA was produced from ozonolysis of α/β-pinene via two Criegee intermediates and strongly depended on RH, while the formation of PA only related to one Criegee intermediate (Ma et al., 2008). Hþinsitu in Fuzhou was lower one to four orders of magnitude than that in the Pearl River Delta, Xiamen, Beijing, Shanghai, and HongKong (Yao et al., 2006; Ding et al., 2011; Pathak et al., 2011; Wu et al., 2020). PNA and PA concentrations had no cor-relations with Hþinsitu (P > 0.05), while HGA, AGA, HDMGA and MBTCA concentrations had positive correlations with Hþinsitu (P < 0.05). The
limited impact of Hþinsitu on PNA and PA was due to (1) high aerosol acidity could accelerate SOAM production via the salting-in effect and acid-catalyzed reactions (Xu et al., 2016), (2) high acidity could promote the release of semi-volatile PNA and PA from particle phase into gas phase to balance the vapor pressure, and (3) there was relatively low aerosol acidity and its constant status at the monitoring site (Yu et al., 1999; Ding et al., 2011). Most tracers of SOAM in Fuzhou had positive correlations with T (0.69 > r > 0.47, P < 0.05) and negative correlations with RH (P > 0.05). Only later-generation products of SOAM had sig-nificant correlations with Hþinsitu (r > 0.27, P < 0.05) and SO4
2� (r >0.35, P < 0.05) (Table S5), suggesting that high concentrations of sulfate could also promote the formation of later-generation products. Because sulfate determines aerosol acidity and surface area, then promotes BSOA formation via acid-catalyzed heterogeneous reactions. On the basis of this analysis the abundance of sulfate was concluded to affect the SOAM formation in coastal city of the southeastern China, consistent with previous reports (Rattanavaraha et al., 2016; Zhang et al., 2019). A recent study also found that SOAM, SOAI, and SOAC were positively correlated with sulfate in the PRD (Zhang et al., 2019).
3.3. Characteristics and sources of SOA tracers during haze pollution events
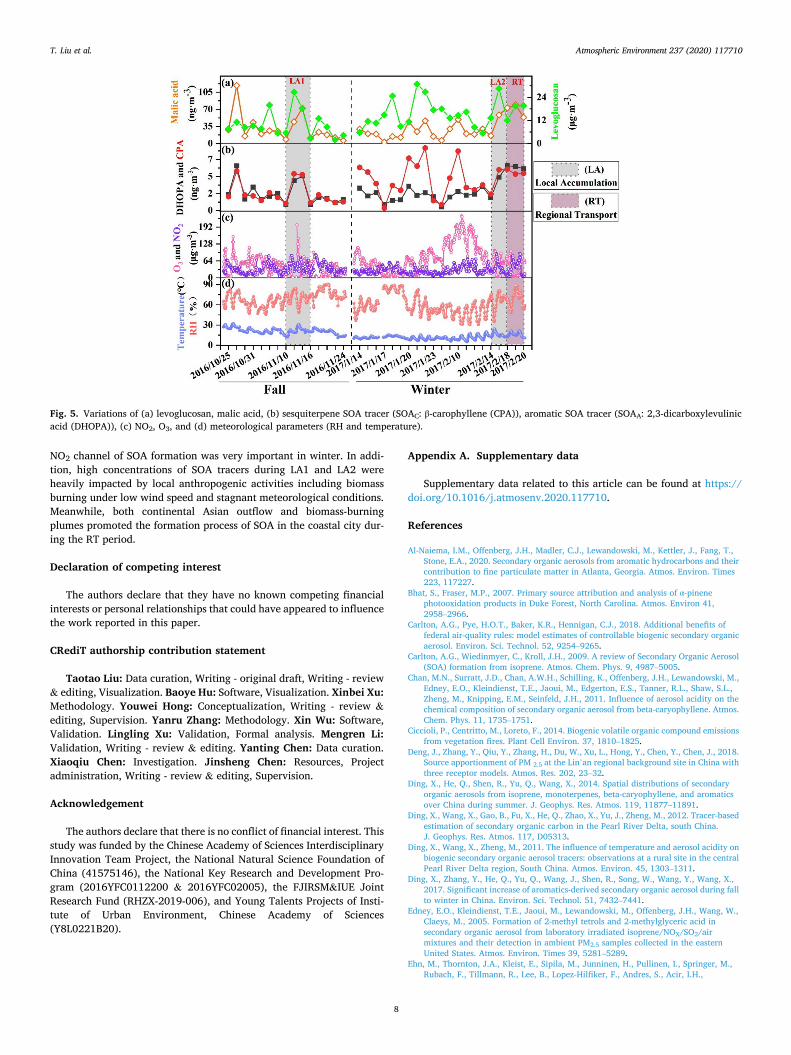
SOA tracers are mostly produced by VOCs in the atmosphere through photochemical reactions, and play an important role in understanding the sources and formation mechanism of SOA. Previous studies have shown that SOA contributes to 30–77% of PM2.5 and 44–71% of organic aerosols during heavy haze (Huang et al., 2014). Defined as having visibility less than 10 km, three haze events during the monitoring period were chosen to study the pattern of SOA tracers with elevated PM2.5 concentrations in coastal areas (Fig. 4). The periods (10–16 Nov. 2016 and 14–16 Feb. 2017) with low wind speed and temperature inversion were divided into LA1 and LA2 (“Local Accumulation”), which was conducive to accumulating air pollutants. Another haze case was affected by northerly airflow bringing air pollutants to the coastal areas
Fig. 4. Temporal variations of (a) wind speed and wind direction, (b) isoprene SOA tracers (SOAI: C5- alkenes triols, 2 methylglyceric acid (MGA), 2-methyl-tetrols (MTLs)), (c) α/β-pinene SOA tracers (SOAM: 3- hydroxyglutaric acid (HGA), pinic acid (PA), pinonic acid (PNA), 3-methyl-1,2,3-butanetricarboxylic acid (MBTCA), 3-hydro-4,4-dimethyglutaric acid (HDMGA), and 3-acetylglutaric acid (AGA)), (d) NH4
þ, NO3� , SO4
2� , and (e) PM10, PM2.5, OC, EC. The gray and pink shaded part was represented for pollution events caused by local accumulation and regional transport, respectively. (For interpretation of the ref-erences to colour in this figure legend, the reader is referred to the Web version of this article.)
T. Liu et al.
Atmospheric Environment 237 (2020) 117710
7
of Fujian Province during 18–20 Feb. 2017, which was defined as “Regional Transport” (RT) (Fig. 4).
3.3.1. Overview of SOA tracers As shown in Fig. 4, all SOA tracers showed a similar temporal vari-
ation of OC (P < 0.05), suggesting the contribution of SOA tracers de-rivative from isoprene, α/β-pinene, β-caryophyllene and toluene to organic aerosols. The concentrations of SOA tracers clearly increased during the pollution period, compared with non-haze periods. The dif-ference in SOAI concentration between fall (6.4 � 6.28 ng m� 3) and
winter (2.36 � 1.19 ng m� 3) was larger than that in SOAM between fall (19.8 � 17.1 ng m� 3) and winter (18.7 � 12.4 ng m� 3) (Table 3), which was consistent with the fact that SOAI had more significant positive correlations with T than SOAM. The variations of related SOA tracers during LA1, LA2 and RT were evaluated during haze and non-haze periods.
The increased proportions going from non-haze to haze periods of low-NOx SOAI products were 3.23–7.21 times higher than those of high- NOx products (Table 3), which could be explained by high SO4
2� con-centration and RH in the monitoring site. The insignificant increases in high-NOx products were due to high RH during haze, with the HO2 channel the main chemical reaction for SOAI formation (Ren et al., 2019). The increases in proportions of later-generation SOAM products during RT were 2.46 times higher than those of first-generation prod-ucts, and the proportions of first-generation products were enhanced during LA1 and LA2. Meanwhile, the increases in proportion of later-generation products of SOAM during RT were 5.52 and 1.78 times higher than those during LA1 and LA2, respectively, suggesting the in-fluence of aerosol aging through regional transport. Regional transport promoting secondary reactions was also proved by the ratio of MBTCA/(PA þ PNA) and the varied concentrations of SNA (SO4
2� , NO3� ,
and NH4þ).
3.3.2. Identification of pollution sources by SOA tracers As shown in Fig. 5, DHOPA, malic acid, CPA and levogluconsan
showed a similar temporal pattern during LA1 and LA2. The concen-trations of malic acid and levoglucosan increased during RT, while DHOPA and CPA concentrations were basically constant, indicating the combined effects of regional transport (especially biomass burning) and local sources. According to the Fire Information for Resource Manage-ment System (FIRMS, https://firms.modaps.eosdis.nasa.gov/firemap/, Fig. S2), the fire spots in Fujian Province during pollution periods were more active than those during non-haze days. Air Mass Trajectory analysis during RT showed that 8% of air masses originated from Kazakhstan, 42% from Bohai, and 50% from Fujian province (Fig. S3).
During 9–13 Feb. 2017, the O3 hourly concentrations were remark-ably high, and DHOPA concentrations were much lower than those during the period of haze pollution (Fig. 5). Except for O3, other factors are also involved into the process of DHOPA formation. Aromatic hy-drocarbons, which are the main precursors of ASOA and can be emitted from biomass/biofuel burning, fossil fuels and solvent use, produce ring- opening products by reacting with reactive species, then react with NOx to form DHOPA (Yuan et al., 2018). In this study, the atmospheric oxidation affected DHOPA formation mostly. However, there is still many uncertainties as to the generation mechanisms of DHOPA, and further research is needed for deeply understanding the formation of ASOA.
4. Conclusions
PM2.5-bound SOA tracers were investigated at an urban site in a coastal area of southeastern China, to characterize the formation and sources SOA and haze pollution indicators. The concentrations of BSOA tracers were comparable to those in most cities and much lower than those in suburban, rural, and mountainous forest sites around the world. SOAI tracers controlled by precursor emission of isoprene formed the main component in summer, and biomass burning contributed strongly to DHOPA (SOAA) in fall. Four categories of SOC had a similar seasonal pattern to the corresponding SOA tracers. In this study, SO4
2� and Hþinsitu had an increasing impact on low-NOx SOAI products and later- generation SOAM products via the salting-in effect and acid-catalyzed reactions. Based on the ratio of MGA/MTLs and MBTCA/(PA þ PNA), atmospheric oxidation (Ox) has a significant impact on the aerosol aging of SOA tracers. Three haze pollution events were observed, and possible factors causing the formation of SOA were discussed. The HO2 channel was the main chemical reaction for SOA during haze, although the NO/
Table 3 Concentrations of SOA tracers (ng⋅m� 3), compositions of PM2.5 (μg⋅m� 3), criteria air pollutants (μg⋅m� 3) and meteorological parameters during haze and non-haze days.
Components Non-haze Haze
Fall (n ¼ 11)
Winter (n ¼ 15)
LA1 (n ¼ 4)
LA2 (n ¼ 3)
RT (n ¼ 3)
2-methylglyceric acid (MGA)
0.55 �0.25
0.72 �0.3
0.65 � 0.58
1.03 � 0.58
1.13 � 0.27
C5-alkene triols 0.59 �0.83
0.13 �0.05
0.9 �1.17
0.25 � 0.2
0.47 � 0.11
2-methyltetrols (MTLs) 5.04 �5.08
1.04 �0.41
5.45 � 6.15
1.77 � 1.35
2.38 � 0.46
Sum of isoprene SOA tracer
6.18 ± 6.03
1.89 ± 0.65
6.99 ± 7.89
3.06 ± 2.12
3.98 ± 0.58
Pinic acid (PA) 3.5 �1.74
2.87 �1.42
6.26 � 5.42
7.98 � 6.1
8.44 � 7.58
Pinonic acid (PNA) 1.46 �0.92
3.79 �2.31
2.87 � 2.68
2.52 � 1.91
3.8 �2.81
3-hydroxyglutaric acid (HGA)
6.56 �6.78
4.25 �2.38
8.77 � 8.35
8.91 � 5.67
13.8 � 3.17
3-acetylglutaric acid (AGA)
0.54 �0.45
0.29 �0.14
0.79 � 0.7
0.84 � 0.61
0.86 � 0.18
3-hydroxy-4,4- dimethylglutaric acid (HDMGA)
2.64 �3.09
2.08 �1.42
2.65 � 2.56
2.82 � 1.34
5.88 � 1.41
3-methyl-1,2,3 butanetricarboxylic acid (MBTCA)
2.85 �3.07
0.94 �0.75
4.46 � 5.18
1.78 � 1.87
2.33 � 1.11
Sum of α/β-pinene SOA tracer
17.5 ± 14.5
14.2 ± 7.52
25.8 ± 24.3
24.8 ± 16.5
35.2 ± 15.7
2,3-Dihydroxy-4- oxopentanoic acid (DHOPA)
2.34 �1.43
2.08 �0.78
2.7 �2.15
3.32 � 1.44
6.14 � 0.22
β-caryophyllinic acid (CPA)
2.16 �1.21
4.39 �2.63
3.08 � 2.34
3.88 � 1.73
5.4 �0.37
levoglucosan 34.8 �18.8
61.3 �28
52.3 � 44.2
62.1 � 46.4
67.2 � 17.3
malic acid 7.75 �7.84
5.99 �3.56
8.67 � 7.68
8.82 � 5.49
17.4 � 3.41
MBTCA/(PA þ PNA) 0.55 �0.44
0.14 �0.05
0.4 �0.21
0.16 � 0.07
0.23 � 0.08
NO2 30.2 �12.3
27.6 �9.85
37.1 � 11.6
33.3 � 13.5
33.9 � 12.6
O3 44.5 �19.5
74.9 �54.6
55.6 � 18.7
61.5 � 29.5
46.2 � 15.3
PM10 38.2 �18.8
38.0 �10.6
43.6 � 16.1
47.7 � 15.8
58.5 � 13.4
PM2.5 23.3 �10.3
30.2 �8.58
33.3 � 15.7
36.2 � 15.4
45.3 � 9.45
EC 1.06 �0.42
1.48 �0.55
1.26 � 0.64
1.84 � 0.77
2.69 � 0.75
OC 5.89 �2.2
5.58 �1.39
9.55 � 4.99
6.87 � 2.98
9.49 � 1.84
Wind speed (m⋅s� 1) 1.72 �0.82
1.73 �0.57
1.22 � 0.34
1.33 � 0.65
1.94 � 0.18
T (�C) 21.4 �4.25
10.4 �2.05
20.4 � 4.09
15.1 � 2.7
15.2 � 1.45
SO42- 7.09 �
4.37 4.73 �2.24
7.77 � 3.7
3.68 � 0.95
6.83 � 2.18
NH4þ 2.85 �
2.7 6.15 �3.19
1.96 � 1.31
3.71 � 0.58
6.28 � 1.61
NO3� 2.29 �
2.26 3.86 �1.69
3.52 � 3.09
6.45 � 0.39
9.35 � 2.5
T. Liu et al.
Atmospheric Environment 237 (2020) 117710
8
NO2 channel of SOA formation was very important in winter. In addi-tion, high concentrations of SOA tracers during LA1 and LA2 were heavily impacted by local anthropogenic activities including biomass burning under low wind speed and stagnant meteorological conditions. Meanwhile, both continental Asian outflow and biomass-burning plumes promoted the formation process of SOA in the coastal city dur-ing the RT period.
Declaration of competing interest
The authors declare that they have no known competing financial interests or personal relationships that could have appeared to influence the work reported in this paper.
CRediT authorship contribution statement
Taotao Liu: Data curation, Writing - original draft, Writing - review & editing, Visualization. Baoye Hu: Software, Visualization. Xinbei Xu: Methodology. Youwei Hong: Conceptualization, Writing - review & editing, Supervision. Yanru Zhang: Methodology. Xin Wu: Software, Validation. Lingling Xu: Validation, Formal analysis. Mengren Li: Validation, Writing - review & editing. Yanting Chen: Data curation. Xiaoqiu Chen: Investigation. Jinsheng Chen: Resources, Project administration, Writing - review & editing, Supervision.
Acknowledgement
The authors declare that there is no conflict of financial interest. This study was funded by the Chinese Academy of Sciences Interdisciplinary Innovation Team Project, the National Natural Science Foundation of China (41575146), the National Key Research and Development Pro-gram (2016YFC0112200 & 2016YFC02005), the FJIRSM&IUE Joint Research Fund (RHZX-2019-006), and Young Talents Projects of Insti-tute of Urban Environment, Chinese Academy of Sciences (Y8L0221B20).
Appendix A. Supplementary data
Supplementary data related to this article can be found at https:// doi.org/10.1016/j.atmosenv.2020.117710.
References
Al-Naiema, I.M., Offenberg, J.H., Madler, C.J., Lewandowski, M., Kettler, J., Fang, T., Stone, E.A., 2020. Secondary organic aerosols from aromatic hydrocarbons and their contribution to fine particulate matter in Atlanta, Georgia. Atmos. Environ. Times 223, 117227.
Bhat, S., Fraser, M.P., 2007. Primary source attribution and analysis of α-pinene photooxidation products in Duke Forest, North Carolina. Atmos. Environ 41, 2958–2966.
Carlton, A.G., Pye, H.O.T., Baker, K.R., Hennigan, C.J., 2018. Additional benefits of federal air-quality rules: model estimates of controllable biogenic secondary organic aerosol. Environ. Sci. Technol. 52, 9254–9265.
Carlton, A.G., Wiedinmyer, C., Kroll, J.H., 2009. A review of Secondary Organic Aerosol (SOA) formation from isoprene. Atmos. Chem. Phys. 9, 4987–5005.
Chan, M.N., Surratt, J.D., Chan, A.W.H., Schilling, K., Offenberg, J.H., Lewandowski, M., Edney, E.O., Kleindienst, T.E., Jaoui, M., Edgerton, E.S., Tanner, R.L., Shaw, S.L., Zheng, M., Knipping, E.M., Seinfeld, J.H., 2011. Influence of aerosol acidity on the chemical composition of secondary organic aerosol from beta-caryophyllene. Atmos. Chem. Phys. 11, 1735–1751.
Ciccioli, P., Centritto, M., Loreto, F., 2014. Biogenic volatile organic compound emissions from vegetation fires. Plant Cell Environ. 37, 1810–1825.
Deng, J., Zhang, Y., Qiu, Y., Zhang, H., Du, W., Xu, L., Hong, Y., Chen, Y., Chen, J., 2018. Source apportionment of PM 2.5 at the Lin’an regional background site in China with three receptor models. Atmos. Res. 202, 23–32.
Ding, X., He, Q., Shen, R., Yu, Q., Wang, X., 2014. Spatial distributions of secondary organic aerosols from isoprene, monoterpenes, beta-caryophyllene, and aromatics over China during summer. J. Geophys. Res. Atmos. 119, 11877–11891.
Ding, X., Wang, X., Gao, B., Fu, X., He, Q., Zhao, X., Yu, J., Zheng, M., 2012. Tracer-based estimation of secondary organic carbon in the Pearl River Delta, south China. J. Geophys. Res. Atmos. 117, D05313.
Ding, X., Wang, X., Zheng, M., 2011. The influence of temperature and aerosol acidity on biogenic secondary organic aerosol tracers: observations at a rural site in the central Pearl River Delta region, South China. Atmos. Environ. 45, 1303–1311.
Ding, X., Zhang, Y., He, Q., Yu, Q., Wang, J., Shen, R., Song, W., Wang, Y., Wang, X., 2017. Significant increase of aromatics-derived secondary organic aerosol during fall to winter in China. Environ. Sci. Technol. 51, 7432–7441.
Edney, E.O., Kleindienst, T.E., Jaoui, M., Lewandowski, M., Offenberg, J.H., Wang, W., Claeys, M., 2005. Formation of 2-methyl tetrols and 2-methylglyceric acid in secondary organic aerosol from laboratory irradiated isoprene/NOX/SO2/air mixtures and their detection in ambient PM2.5 samples collected in the eastern United States. Atmos. Environ. Times 39, 5281–5289.
Ehn, M., Thornton, J.A., Kleist, E., Sipila, M., Junninen, H., Pullinen, I., Springer, M., Rubach, F., Tillmann, R., Lee, B., Lopez-Hilfiker, F., Andres, S., Acir, I.H.,
Fig. 5. Variations of (a) levoglucosan, malic acid, (b) sesquiterpene SOA tracer (SOAC: β-carophyllene (CPA)), aromatic SOA tracer (SOAA: 2,3-dicarboxylevulinic acid (DHOPA)), (c) NO2, O3, and (d) meteorological parameters (RH and temperature).
T. Liu et al.
Atmospheric Environment 237 (2020) 117710
9
Rissanen, M., Jokinen, T., Schobesberger, S., Kangasluoma, J., Kontkanen, J., Nieminen, T., Kurten, T., Nielsen, L.B., Jorgensen, S., Kjaergaard, H.G., Canagaratna, M., Maso, M.D., Berndt, T., Petaja, T., Wahner, A., Kerminen, V.M., Kulmala, M., Worsnop, D.R., Wildt, J., Mentel, T.F., 2014. A large source of low- volatility secondary organic aerosol. Nature 506, 476–479.
Ervens, B., Turpin, B.J., Weber, R.J., 2011. Secondary organic aerosol formation in cloud droplets and aqueous particles (aqSOA): a review of laboratory, field and model studies. Atmos. Chem. Phys. 11, 11069–11102.
Feng, J., Li, M., Zhang, P., Gong, S., Zhong, M., Wu, M., Zheng, M., Chen, C., Wang, H., Lou, S., 2013. Investigation of the sources and seasonal variations of secondary organic aerosols in PM2.5 in Shanghai with organic tracers. Atmos. Environ. 79, 614–622.
Fu, P., Kawamura, K., Chen, J., Barrie, L.A., Isoprene, 2009. Monoterpene, and sesquiterpene oxidation products in the high arctic aerosols during late winter to early summer. Environ. Sci. Technol. 43, 4022–4028.
Fu, P., Kawamura, K., Chen, J., Charri�ere, B., Semp�er�e, R., 2013. Organic molecular composition of marine aerosols over the Arctic Ocean in summer: contributions of primary emission and secondary aerosol formation. Biogeosciences 10, 653–667.
Fu, P., Kawamura, K., Kanaya, Y., Wang, Z., 2010. Contributions of biogenic volatile organic compounds to the formation of secondary organic aerosols over Mt. Tai, Central East China. Atmos. Environ. 44, 4817–4826.
Fu, P., Zhuang, G., Sun, Y., Wang, Q., Chen, J., Ren, L., Yang, F., Wang, Z., Pan, X., Li, X., Kawamura, K., 2016. Molecular markers of biomass burning, fungal spores and biogenic SOA in the Taklimakan desert aerosols. Atmos. Environ. 130, 64–73.
Fu, P., Kawamura, K., Chen, J., Miyazaki, Y., 2014. Secondary production of organic aerosols from biogenic VOCs over Mt. Fuji, Japan. Environ. Sci. Technol. 48, 8491–8497.
Ghirardo, A., Xie, J., Zheng, X., Wang, Y., 2016. Urban stress-induced biogenic VOC emissions and SOA-forming potentials in Beijing. Atmos. Chem. Phys. 16, 2901–2920.
Hennigan, C.J., Izumi, J., Sullivan, A.P., Weber, R.J., Nenes, A., 2015. A critical evaluation of proxy methods used to estimate the acidity of atmospheric particles. Atmos. Chem. Phys. 15, 2775–2790.
Hong, Z., Zhang, H., Zhang, Y., Xu, L., Liu, T., Xiao, H., Hong, Y., Chen, J., Li, M., Deng, J., Wu, X., Hu, B., Chen, X., 2019. Secondary organic aerosol of PM2.5 in a mountainous forest area in southeastern China: molecular compositions and tracers implication. Sci. Total Environ. 653, 496–503.
Hu, D., Bian, Q., Li, T.W.Y., Lau, A.K.H., Yu, J.Z., 2008. Contributions of isoprene, monoterpenes,β-caryophyllene, and toluene to secondary organic aerosols in Hong Kong during the summer of 2006. J. Geophys. Res. 113, D22206.
Hu, D., Yu, J., 2013. Secondary organic aerosol tracers and malic acid in Hong Kong: seasonal trends and origins. Environ. Chem. 10, 81–394.
Huang, R., Zhang, Y., Bozzetti, C., Ho, K.F., Cao, J., Han, Y., Daellenbach, K.R., Slowik, J. G., Platt, S.M., Canonaco, F., Zotter, P., Wolf, R., Pieber, S.M., Bruns, E.A., Crippa, M., Ciarelli, G., Piazzalunga, A., Schwikowski, M., Abbaszade, G., Schnelle- Kreis, J., Zimmermann, R., An, Z., Szidat, S., Baltensperger, U., El Haddad, I., Prevot, A.S., 2014. High secondary aerosol contribution to particulate pollution during haze events in China. Nature 514, 218–222.
Jaoui, M., Corse, E.W., Lewandowski, M., Offenberg, J.H., Kleindienst, T.E., Edney, E.O., 2010. Formation of organic tracers for isoprene SOA under acidic conditions. Atmos. Environ. 44, 1798–1805.
Jaoui, M., Kleindienst, T.E., Lewandowski, M., Offenberg, J.H., Edney, E.O., 2005. Identification and quantification of aerosol polar oxygenated compounds bearing carboxylic or hydroxyl groups. 2. Organic tracer compounds from monoterpenes. Environ. Sci. Technol. 39, 5661–5673.
Jaoui, M., Lewandowski, M., Kleindienst, T.E., Offenberg, J.H., Edney, E.O., 2007. β-caryophyllinic acid: an atmospheric tracer for β-caryophyllene secondary organic aerosol. Geophys. Res. Lett. 34, L05816.
Kang, M., Fu, P., Kawamura, K., Yang, F., Zhang, H., Zang, Z., Ren, H., Ren, L., Zhao, Y., Sun, Y., Wang, Z., 2018. Characterization of biogenic primary and secondary organic aerosols in the marine atmosphere over the East China Sea. Atmos. Chem. Phys. 18, 13947–13967.
Kawamura, K., Yasui, O., 2005. Diurnal changes in the distribution of dicarboxylic acids, ketocarboxylic acids and dicarbonyls in the urban Tokyo atmosphere. Atmos. Environ. 39, 1945–1960.
Kleindienst, T.E., Jaoui, M., Lewandowski, M., Offenberg, J.H., Lewis, C.W., Bhave, P.V., Edney, E.O., 2007. Estimates of the contributions of biogenic and anthropogenic hydrocarbons to secondary organic aerosol at a southeastern us location. Atmos. Environ. 41, 8288–8300.
Kleindienst, T.E., Jaoui, M., Lewandowski, M., Offenberg, J.H., Docherty, K.S., 2012. The formation of SOA and chemical tracer compounds from the photooxidation of naphthalene and its methyl analogs in the presence and absence of nitrogen oxides. Atmos. Chem. Phys. 12, 8711–8726.
Kleindienst, T.E., Lewandowski, M., Offenberg, J.H., Edney, E.O., Jaoui, M., Zheng, M., Ding, X., Edgerton, E.S., 2010. Contribution of primary and secondary sources to organic aerosol and PM2.5 at SEARCH network sites. J. Air Waste Manage. 60, 1388–1399.
Lewandowski, M., Piletic, I.R., Kleindienst, T.E., Offenberg, J.H., Beaver, M.R., Jaoui, M., Docherty, K.S., Edney, E.O., 2013. Secondary organic aerosol characterisation at field sites across the United States during the spring–summer period. Int. J. Environ. Anal. Chem. 93, 1084–1103.
Li, L., Dai, D., Deng, S., Feng, J., Zhao, M., Wu, J., Liu, L., Yang, X., Wu, S., Qi, H., Yang, G., Zhang, X., Wang, Y., Zhang, Y., 2013. Concentration, distribution and variation of polar organic aerosol tracers in Ya’an, a middle-sized city in western China. Atmos. Res. 120, 29–42.
Lin, Y., Knipping, E.M., Edgerton, E.S., Shaw, S.L., Surratt, J.D., 2013. Investigating the influences of SO2 and NH3 levels on isoprene-derived secondary organic aerosol formation using conditional sampling approaches. Atmos. Chem. Phys. 13, 8457–8470.
Liu, J., Li, J., Zhang, Y., Liu, D., Ding, P., Shen, C., Shen, K., He, Q., Ding, X., Wang, X., Chen, D., Szidat, S., Zhang, G., 2014a. Source apportionment using radiocarbon and organic tracers for PM2.5 carbonaceous aerosols in guangzhou, south China: contrasting local- and regional-scale haze events. Environ. Sci. Technol. 48, 12002–12011.
Liu, T., Hu, B., Yang, Y., Li, M., Hong, Y., Xu, X., Xu, L., Chen, Y., Xiao, H., Chen, J., 2020. Characteristics and source apportionment of PM2.5 on an island in Southeast China: impact of sea-salt and monsoon. Atmos. Res. 235, 104786.
Liu, Y., Huang, L., Li, S., Harner, T., Liggio, J., 2014b. OH-initiated heterogeneous oxidation of tris-2-butoxyethyl phosphate: implications for its fate in the atmosphere. Atmos. Chem. Phys. 14, 12195–12207.
Liu, Y., Li, X., Tang, G., Wang, L., Lv, B., Guo, X., Wang, Y., 2019. Secondary organic aerosols in Jinan, an urban site in North China: significant anthropogenic contributions to heavy pollution. J. Environ. Sci. (China) 80, 107–115.
Lyu, X.P., Guo, H., Cheng, H., Wang, X., Ding, X., Lu, H., Yao, D., Xu, C., 2017. Observation of soa tracers at a mountainous site in Hong Kong: chemical characteristics, origins and implication on particle growth. Sci. Total Environ. 605, 180–189.
Ma, Y., Russell, A.T., Marston, G., 2008. Mechanisms for the formation of secondary organic aerosol components from the gasphase ozonolysis of α-pinene. Phys. Chem. Chem. Phys. 10, 4294–4312.
McFiggans, G., Mentel, T.F., Wildt, J., Pullinen, I., Kang, S., Kleist, E., Schmitt, S., Springer, M., Tillmann, R., Wu, C., Zhao, D., Hallquist, M., Faxon, C., Le Breton, M., Hallquist, A.M., Simpson, D., Bergstrom, R., Jenkin, M.E., Ehn, M., Thornton, J.A., Alfarra, M.R., Bannan, T.J., Percival, C.J., Priestley, M., Topping, D., Kiendler- Scharr, A., 2019. Secondary organic aerosol reduced by mixture of atmospheric vapours. Nature 565, 587–593.
Offenberg, J.H., Lewis, C.W., Lewandowski, M., Jaoui, M., Kleindienst, T.E., Edney, E.O., 2007. Contributions of toluene and α-pinene to SOA formed in an irradiated toluene/ α-pinene/NOx/air mixture: comparison of results using 14C content and SOA organic tracer methods. Environ. Sci. Technol. 41, 3972–3976.
Pathak, R.K., Louie, P.K.K., Chan, C.K., 2004. Characteristics of aerosol acidity in Hong Kong. Atmos. Environ. 38, 2965–2974.
Pathak, R.K., Wang, T., Ho, K.F., Lee, S.C., 2011. Characteristics of summertime pm2.5 organic and elemental carbon in four major Chinese cities: implications of high acidity for water-soluble organic carbon (WSOC). Atmos. Environ. 45, 318–325.
Paulot, F., Wennberg, P.O., 2009. Unexpected epoxide formation in the gas-phase photooxidation of isoprene. Science 325, 730–733.
Rattanavaraha, W., Chu, K., Budisulistiorini, H., Riva, M., Lin, Y.-H., Edgerton, E.S., Baumann, K., Shaw, S.L., Guo, H., King, L., Weber, R.J., Neff, M.E., Stone, E.A., Offenberg, J.H., Zhang, Z., Gold, A., Surratt, J.D., 2016. Assessing the impact of anthropogenic pollution on isoprene-derived secondary organic aerosol formation in PM2.5 collected from the Birmingham, Alabama, ground site during the 2013 Southern Oxidant and Aerosol Study. Atmos. Chem. Phys. 16, 4897–4914.
Ren, Y., Wang, G., Tao, J., Zhang, Z., Wu, C., Wang, J., Li, J., Wei, J., Li, H., Meng, F., 2019. Seasonal characteristics of biogenic secondary organic aerosols at Mt. Wuyi in Southeastern China: influence of anthropogenic pollutants. Environ. Pollut. 252, 493–500.
Riva, M., Budisulistiorini, S.H., Zhang, Z., Gold, A., Surratt, J.D., 2016. Chemical characterization of secondary organic aerosol constituents from isoprene ozonolysis in the presence of acidic aerosol. Atmos. Environ. 130, 5–13.
Shen, R., Ding, X., He, Q., Cong, Z., Yu, Q., Wang, X., 2015. Seasonal variation of secondary organic aerosol tracers in Central Tibetan Plateau. Atmos. Chem. Phys. 15, 8781–8793.
Shrivastava, M., Cappa, C.D., Fan, J., Goldstein, A.H., 2017. Recent advances in understanding secondary organic aerosol: implications for global climate forcing. Rev. Geophys. 55, 509–559.
Slade, J.H., Knopf, D.A., 2014. Multiphase OH oxidation kinetics of organic aerosol: the role of particle phase state and relative humidity. Geophys. Res. Lett. 41, 5297–5306.
Stone, E.A., Hedman, C.J., Zhou, J., Mieritz, M., Schauer, J.J., 2010. Insights into the nature of secondary organic aerosol in Mexico City during the MILAGRO experiment 2006. Atmos. Environ. 44, 312–319.
Stone, E.A., Nguyen, T.T., Pradhan, B.B., Man, D.P., 2012. Assessment of biogenic secondary organic aerosol in the Himalayas. Environ. Chem. 9, 263–272.
Surratt, J.D., Chan, A.W., Eddingsaas, N.C., Chan, M., Loza, C.L., Kwan, A.J., Hersey, S. P., Flagan, R.C., Wennberg, P.O., Seinfeld, J.H., 2010. Reactive intermediates revealed in secondary organic aerosol formation from isoprene. Proc. Natl. Acad. Sci. U.S.A. 107, 6640–6645.
Surratt, J.D., Lewandowski, M., Offenberg, J.H., Jaoui, M., Kleindienst, T.E., Edney, E.O., Seinfeld, J.H., 2007. Effect of acidity on secondary organic aerosol formation from isoprene. Environ. Sci. Technol. 41, 5363–5369.
Szmigielski, R., Surratt, J.D., G�omez-Gonz�alez, Y., Veken, P.V.D., Kourtchev, I., Vermeylen, R., Blockhuys, F., Jaoui, M., Kleindienst, T.E., Lewandowski, M., 2007. 3-methyl-1,2,3-butanetricarboxylic acid: an atmospheric tracer for terpene secondary organic aerosol. Geophys. Res. Lett. 34, 497–507.
Tang, R., Wu, Z., Li, X., Wang, Y., Shang, D., Xiao, Y., Li, M., Zeng, L., Wu, Z., Hallquist, M., Hu, M., Guo, S., 2018. Primary and secondary organic aerosols in summer 2016 in Beijing. Atmos. Chem. Phys. 18, 4055–4068.
Wan, X., Kang, S., Rupakheti, M., Zhang, Q., Tripathee, L., Guo, J., Chen, P., Rupakheti, D., Panday, A.K., Lawrence, M.G., Kawamura, K., Cong, Z., 2019.
T. Liu et al.
Atmospheric Environment 237 (2020) 117710
10
Molecular characterization of organic aerosols in the Kathmandu Valley, Nepal: insights into primary and secondary sources. Atmos. Chem. Phys. 19, 2725–2747.
Wang, G., Xie, M., Hu, S., Gao, S., Tachibana, E., Kawamura, K., 2010. Dicarboxylic acids, metals and isotopic compositions of C and N in atmospheric aerosols from inland China: implications for dust and coal burning emission and secondary aerosol formation. Atmos. Chem. Phys. 10, 6087–6096.
Wu, X., Li, M., Chen, J., Wang, H., Xu, L., Hong, Y., Zhao, G., Hu, B., Zhang, Y., Dan, Y., Yu, S., 2020. The characteristics of air pollution induced by the quasi-stationary front: formation processes and influencing factors. Sci. Total Environ. 707, 136194.
Xie, C., Lin, K., Jiao, H., Wu, Y., Duan, S., Tian, G., Yan, S., 2016. Analysis of urban square plant community and its diversity in fuzhou city. J. Chinese Urban Forestry 14, 34–38.
Xu, L., Guo, H., Boyd, C.M., Klein, M., Bougiatioti, A., Cerully, K.M., Hite, J.R., Isaacman- VanWertz, G., Kreisberg, N.M., Knote, C., Olson, K., Koss, A., Goldstein, A.H., Hering, S.V., de Gouw, J., Baumann, K., Lee, S.H., Nenes, A., Weber, R.J., Ng, N.L., 2015. Effects of anthropogenic emissions on aerosol formation from isoprene and monoterpenes in the southeastern United States. Proc. Natl. Acad. Sci. U.S.A. 112, 37–42.
Xu, L., Jiao, L., Hong, Z., Zhang, Y., Du, W., Wu, X., Chen, Y., Deng, J., Hong, Y., Chen, J., 2018. Source identification of PM2.5 at a port and an adjacent urban site in a coastal city of China: impact of ship emissions and port activities. Sci. Total Environ. 634, 1205–1213.
Xu, L., Middlebrook, A.M., Liao, J., de Gouw, J.A., Guo, H., Weber, R.J., Nenes, A., Lopez-Hilfiker, F.D., Lee, B.H., Thornton, J.A., Brock, C.A., Neuman, J.A., Nowak, J. B., Pollack, I.B., Welti, A., Graus, M., Warneke, C., Ng, N.L., 2016. Enhanced formation of isoprene-derived organic aerosol in sulfur-rich power plant plumes during Southeast Nexus. J. Geophys. Res. Atmos. 121, 11137–11153.
Yao, X., Ling, T., Fang, M., Chan, C.K., 2006. Comparison of thermodynamic predictions for in situ pH in PM2.5. Atmos. Environ. 40, 2835–2844.
Yu, J., Griffin, R.J., Cocker III, D.R., Flagan, R.C., Seinfeld, J.H., Blanchard, P., 1999. Observation of gaseous and particulate products of monoterpene oxidation in forest atmospheres. Geophys. Res. Lett. 26, 1145–1148.
Yuan, Q., Lai, S., Song, J., Ding, X., Zheng, L., Wang, X., Zhao, Y., Zheng, J., Yue, D., Zhong, L., Niu, X., Zhang, Y., 2018. Seasonal cycles of secondary organic aerosol tracers in rural Guangzhou, Southern China: the importance of atmospheric oxidants. Environ. Pollut. 240, 884–893.
Zhang, H., Surratt, J.D., Lin, Y., Bapat, J., Kamens, R.M., 2011. Effect of relative humidity on SOA formation from isoprene/NO photooxidation: enhancement of 2- methylglyceric acid and its corresponding oligoesters under dry conditions. Atmos. Chem. Phys. 11, 6411–6424.
Zhang, Y., Chen, D., Ding, X., Li, J., Zhang, T., Wang, J., Cheng, Q., Jiang, H., Song, W., Ou, Y., Ye, P., Zhang, G., Wang, X., 2019. Impact of anthropogenic emissions on biogenic secondary organic aerosol: observation in the Pearl River Delta, South China. Atmos. Chem. Phys. 19, 14403–14415.
T. Liu et al.