characteristics of recent federal small business contracting
TRANSCRIPT

Characteristics of Recent Federal
Small Business Contracting
by
by Eagle Eye Publishers, Inc. Fairfax, Virginia
for
under contract number SBAHQ-09-M-0271
Release Date: May 2012
This report was developed under a contract with the Small Business Administration, Office of Advocacy, and contains information and analysis that was reviewed by officials of the Office of Advocacy. However, the final conclusions of the report do not necessarily reflect the views of the Office of Advocacy.

Characteristics of Recent Federal Small Business Contracting ii
Table of Contents
Introduction ..................................................................................................................................1
Summary of Key Findings ...........................................................................................................2
Chapter 1: Procurement Trends Associated With Agencies That Achieve Their Negotiated Small Business Goals ................................................................................................3
Overview ................................................................................................................................. 3 Analytical Strategy .................................................................................................................. 3
Research Methodology ........................................................................................................... 3
Results and Analysis ............................................................................................................... 4
Conclusion .............................................................................................................................. 9
Chapter 2: Small Business Utilization in Contracts Issued under the American Recovery and Reinvestment Act (ARRA) .................................................................................10
Overview ............................................................................................................................... 10
Analytical Strategy ................................................................................................................ 10
Research Methodology ......................................................................................................... 10
Results and Analysis ............................................................................................................. 11
Chapter 3: Comparisons of How Agencies Achieve Success in Small Business Procurement ...............................................................................................................................20
Overview ............................................................................................................................... 20
Analytical Strategy ................................................................................................................ 20
Research Methodology ......................................................................................................... 20
Results and Analysis ............................................................................................................. 21
Conclusion ............................................................................................................................ 28
Appendix A: Data Sources and Methodology ...........................................................................29
Data Sources for the Analysis ............................................................................................... 29
Methodology for Chapter 1 ................................................................................................... 29
Methodology for Chapter 2 ................................................................................................... 30
Appendix B: Additional Major Cabinet-Level and Independent Agency Small Business Procurement Trends ....................................................................................................32

Characteristics of Recent Federal Small Business Contracting iii
List of Tables
Table 1.1 Agency Small Business Goal Achievements Ranked by Achievement – Goal Difference .................................................................................................................. 5
Table 1.2 Small Business Utilization Intensity .............................................................................. 6 Table 1.3 Small Business Births.................................................................................................... 6 Table 1.4 Small Business Expiration ............................................................................................. 6 Table 1.5 Services Share ............................................................................................................... 7 Table 1.6 Manufacturing Share ...................................................................................................... 7 Table 1.7 Average Contract Size ................................................................................................... 7 Table 1.8 Agency Transactions per Contract ................................................................................ 8 Table 1.9 Fixed Price Contract Share ............................................................................................. 8 Table 1.10 Set-Aside Contract Dollar Share ................................................................................. 8 Table 1.11 Competitive Share ...................................................................................................... 8 Table 2.1 American Recovery and Reinvestment Act (ARRA) Agency Spending
Summary FY09–FY11 YTD ................................................................................... 12 Table 2.2 Top ARRA Industrial Sectors with Small Large Business Breakouts ......................... 13 Table 2.3 Market Composition of ARRA Prime Contracts FY09–FY11 YTD with
Large/Small Breakout ............................................................................................. 14 Table 2.4 Overall Count of ARRA Businesses by Type of Firm ................................................ 14 Table 2.5 ARRA Small Business Utilization Intensity by Agency, FY 2009–FY 2011 ............. 15 Table 2.6 Statutory Goal Compliance by Agency in the ARRA Program FY09–FY11 ............. 17 Table 2.7 Statutory Goal Compliance Mapped to Goal Over- and Under-Achievement ............ 17 Table 2.8 Breakdown of Key ARRA Socioeconomic Procurement Set-Aside Programs
by Agency, FY 2009–FY 2011YTD ....................................................................... 19 Table 3.1 Small Business Utilization Measures .......................................................................... 20 Table 3.2 Analysis of Small Business Procurement Performance by the Department of
Defense–Army ........................................................................................................ 23 Table 3.3 Analysis of Small Business Procurement Performance by the U.S. Agency for
International Development ...................................................................................... 26 Table 3.4 Analysis of Small Business Procurement Performance by the Nuclear
Regulatory Commission .......................................................................................... 27 Table A.1 Small Business Utilization Measures ......................................................................... 30 Table B.1 Small Business Procurement Performance, Department of Defense–Air Force ........ 32 Table B.2 Small Business Procurement Performance, Department of Education ....................... 33 Table B.3 Small Business Procurement Performance, Department of Homeland
Security ................................................................................................................... 34 Table B.4 Small Business Procurement Performance, Department of Commerce ..................... 35 Table B.5 Small Business Procurement Performance, Department of Defense–Other ............... 36 Table B.6 Small Business Procurement Performance, Department of Energy ........................... 37 Table B.7 Small Business Procurement Performance, Department of Interior ........................... 38 Table B.8 Small Business Procurement Performance, Department of Justice ............................ 39 Table B.9 Small Business Procurement Performance, Environmental Protection Agency ........ 40 Table B.10 Small Business Procurement Performance, Department of Health and
Human Services ...................................................................................................... 41

Characteristics of Recent Federal Small Business Contracting iv
Table B.11 Small Business Procurement Performance, Department of Housing and Urban Development ................................................................................................ 42
Table B.12 Small Business Procurement Performance, Department of Labor ........................... 43 Table B.13 Small Business Procurement Performance, Department of Transportation ............. 44 Table B.14 Small Business Procurement Performance, Department of Veterans Affairs .......... 45 Table B.15 Small Business Procurement Performance, Executive Office of the
President .................................................................................................................. 46 Table B.16 Small Business Procurement Performance, General Services Administration ......... 47 Table B.17 Small Business Procurement Performance, National Aeronautics and Space
Administration ........................................................................................................ 48 Table B.18 Small Business Procurement Performance, Department of Defense–Navy ............. 49 Table B.19 Small Business Procurement Performance, Office of Personnel
Management ............................................................................................................ 50 Table B.20 Small Business Procurement Performance, Small Business Administration ........... 51 Table B.21 Small Business Procurement Performance, Securities and Exchange
Commission ............................................................................................................ 52 Table B.22 Small Business Procurement Performance, Smithsonian Institution ........................ 53 Table B.23 Small Business Procurement Performance, Social Security Administration............ 54 Table B.24 Small Business Procurement Performance, State Department ................................. 55 Table B.25 Small Business Procurement Performance, Department of the Treasury ................. 56 Table B.26 Small Business Procurement Performance, U.S. Information Agency .................... 57 Table B.27 Small Business Procurement Performance, Department of Agriculture .................. 58
Characteristics of Recent Federal Small Business Contracting 1
Introduction
Overall, small firms continue to struggle to achieve established agency procurement. Small successes at certain agencies, in certain programs and among individual socioeconomic categories hold the promise of higher small business utilization. However the procurement data describe small business participation rates in the federal marketplace generally lower than expected. The unique series of perspectives created for this study document current trends and shed light on not only why these trends occur but what agency practices tend to improve levels of small business participation in procurement.
The study then turns to evaluate small business utilization following and due to the American Recovery and Reinvestment Act of 2009 (ARRA, the Stimulus, or the Recovery Act). The analysis finds that the Recovery Act has been quite successful as it boosted the small business share of procurement dollars.
The analysis concludes with the publication of a new set of tables containing multi-dimensional views of small business procurement trends within each agency. The tables describe 23 different measures from a dollar, company and contract transaction perspective. They are designed to go beyond the simple analysis of small business goal achievement to expose the underlying trends driving agency small business utilization in procurement. By bringing together operational data across all agencies the goal is to identify high-impact agency small business procurement practices that can be replicated in other organizations. The data for this study come from the FY2009–FY2010 Federal Procurement Data System-Next Generation (FPDS-NG). Chapter 1 uses FY2009 data, and Chapters 2 and 3 use data from FY2009 and FY2010.

Characteristics of Recent Federal Small Business Contracting 2
Summary of Key Findings
Chapter 1, Procurement Trends Associated With Agencies Achieving Their Negotiated Small Business Goals:
• The factors most strongly associated with high levels of small business dollar goal achievement include the utilization rates of new, small businesses; the small firm share of all agency businesses; and the share of Fixed Price contracts.
• Increases in competitively awarded contracts, shares of manufacturing and contract size correlated negatively with agency small business spending.
Chapter 2, Small Business Utilization and the American Recovery and Reinvestment Act (ARRA):
• A total of 28 agencies reported spending $51.7 billion on ARRA contracts from February, 2009 through December, 2010. Of this total, small firms won $13.1 billion, or 25.5 percent of ARRA prime contract dollars.
• Seventy-six percent of all ARRA prime contract recipients were small firms • The Departments of Energy, Health and Human Services and the Army accounted
for $34.7 billion, or 67 percent of all reported ARRA spending. • At seven ARRA procuring agencies more than 80 percent of ARRA prime
contract recipients were small businesses.
Chapter 3, Comparisons of How Agencies Achieve Success in Small Business Procurement:
• The Army grew its small business dollar share of procurement spending from 22.26 to 24.8 percent in the previous year (FY08).
• At 7.61 percent in FY 2009, USAID displayed some of the highest agency procurement shares of Woman-owned Business and Service-Disabled Veteran-Owned Business throughout government.
• Nuclear Regulatory Commission (NRC) spent one-third of its procurement dollars through the 8(a) set-aside program and one-quarter through small business set-asides after factoring in SBA excluded procurement categories.

Characteristics of Recent Federal Small Business Contracting 3
Chapter 1: Procurement Trends Associated With Agencies That Achieve Their Negotiated Small Business Goals
Overview
The purpose of this analysis is to use new and traditional small business utilization measures to flag key federal agency small business buying trends that are associated with agencies achieving superior results from their small business utilization efforts. Understanding which agency acquisition practices are associated with successful small business procurement goal achievement and which are not helps to define the universe of acquisition best practices that can boost small business utilization levels across government.
Analytical Strategy
To perform this analysis we designed 11 prime contract measures and compared the median and average results of these measures between agencies that did and did not achieve their negotiated small business goals. The resulting associations between acquisition practices and actual results paints a clear picture from the ground up of which practices are associated with high rates of small business utilization in procurement.
Research Methodology
Using only data from the FY 2009 Federal Procurement Data System-Next Generation (FPDS-NG) database that has been adjusted for SBA excluded categories, we first measured small business procurement shares for each agency. In a table ranked by the percentage by which each agency’s small business share compared with their negotiated SBA small business goal, we grouped all agencies into two groups. The first, or green group, identified agencies that met and exceeded their negotiated small business goals. The second, or red group, identified those agencies that did not meet their goal. Then we compare these two groups of agencies against one another by measuring and correlating agency statistics for:
1) Overall small business achievement: the small business share of each agency’s federal prime contract dollars.
2) Small business utilization intensity: the number of active, small businesses as a share of the total number of businesses actively contracting with an agency.

Characteristics of Recent Federal Small Business Contracting 4
3) Small business births: the number of new small business as a share of total small businesses.
4) Small business expirations: the number of small businesses that did not return from the prior year as a share of the number of small businesses in the prior year.
5) Services share: the small business share of the services sector. 6) Manufacturing share: the small business share of the manufacturing sector. 7) Average contract size: the median and average contract size at each agency. 8) Transactions per contract: the median and average number of transactions per
contract. 9) Fixed price contracts: the median and average shares of fixed price contracts. 10) Set-aside contracts: the median and average shares of set-aside contracts. 11) Competitively awarded contracts: the median and average shares of
competitively awarded contracts.
Results and Analysis
1. Overall Measure
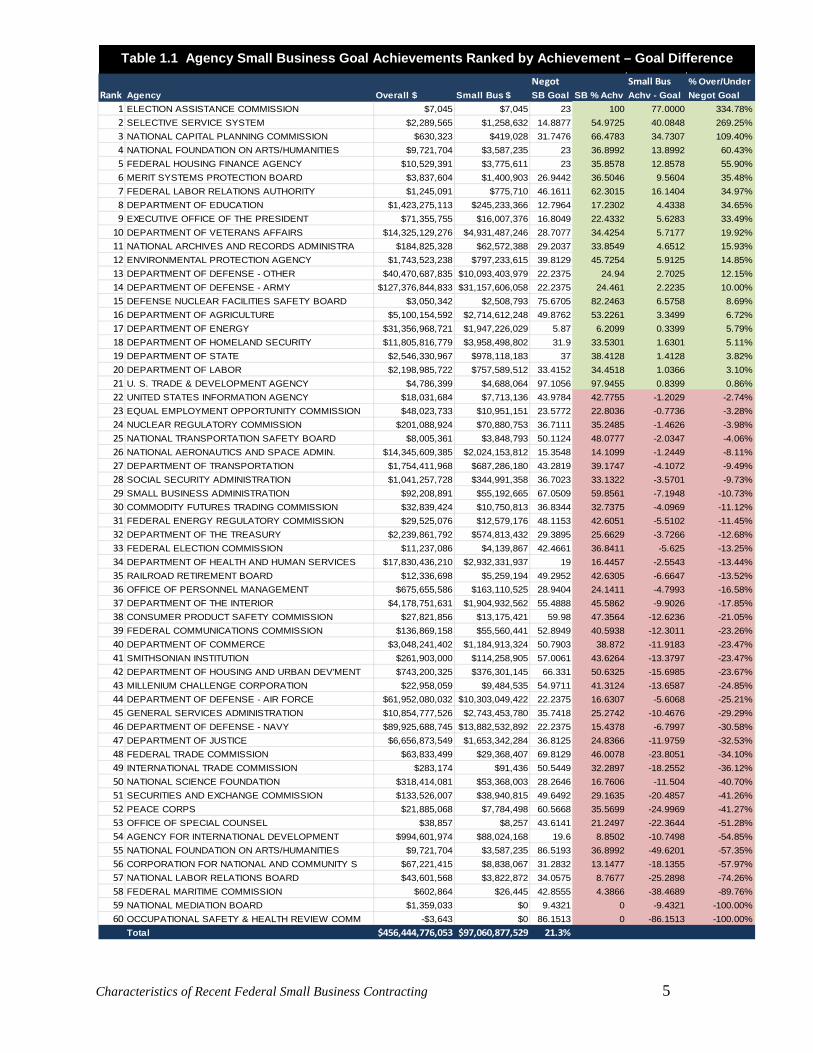
In FY 2009, 21 agencies or bureaus—35 percent of the agencies studied in this report—met or exceeded their negotiated small business procurement goals by an average of 12 percent. High achieving agencies included some of the largest government organizations such as the Army, Department of Defense (DoD)–Other, the Department of Veterans Affairs (DVA) and the Department of Homeland Security (DHS). (Table 1.1 shows the 21 agencies that met the goal in green, the balance in red.)
Thirty-nine agencies, or 65 percent, fell below their negotiated goals by an average of -13.8 percent. These agencies included the Navy, Air Force, the Department of Health and Human Services (HHS) and National Aeronautics and Space Administration (NASA). If all agencies had met their negotiated small business goals in FY 2009 they would have spent $105.1 billion with small businesses, $8.1 billion more than they actually achieved.
Table 1.1 shows, per agency, for FY 2009, the overall procurement dollars, the small business procurement dollars, the negotiated small business goal percentage, and the percentage of achieved small business procurement (i.e., small business procurement dollars/overall procurement dollars). The remaining two columns evaluate the difference between the two percentages (achieved – goal), and their ratio (difference/goal), respectively. All figures are adjusted for the SBA’s excluded procurement categories.
Characteristics of Recent Federal Small Business Contracting 5
Table 1.1 Agency Small Business Goal Achievements Ranked by Achievement – Goal Difference Negot Small Bus % Over/Under
Rank Agency Overall $ Small Bus $ SB Goal SB % Achv Achv - Goal Negot Goal1 ELECTION ASSISTANCE COMMISSION $7,045 $7,045 23 100 77.0000 334.78%2 SELECTIVE SERVICE SYSTEM $2,289,565 $1,258,632 14.8877 54.9725 40.0848 269.25%3 NATIONAL CAPITAL PLANNING COMMISSION $630,323 $419,028 31.7476 66.4783 34.7307 109.40%4 NATIONAL FOUNDATION ON ARTS/HUMANITIES $9,721,704 $3,587,235 23 36.8992 13.8992 60.43%5 FEDERAL HOUSING FINANCE AGENCY $10,529,391 $3,775,611 23 35.8578 12.8578 55.90%6 MERIT SYSTEMS PROTECTION BOARD $3,837,604 $1,400,903 26.9442 36.5046 9.5604 35.48%7 FEDERAL LABOR RELATIONS AUTHORITY $1,245,091 $775,710 46.1611 62.3015 16.1404 34.97%8 DEPARTMENT OF EDUCATION $1,423,275,113 $245,233,366 12.7964 17.2302 4.4338 34.65%9 EXECUTIVE OFFICE OF THE PRESIDENT $71,355,755 $16,007,376 16.8049 22.4332 5.6283 33.49%
10 DEPARTMENT OF VETERANS AFFAIRS $14,325,129,276 $4,931,487,246 28.7077 34.4254 5.7177 19.92%11 NATIONAL ARCHIVES AND RECORDS ADMINISTRA $184,825,328 $62,572,388 29.2037 33.8549 4.6512 15.93%12 ENVIRONMENTAL PROTECTION AGENCY $1,743,523,238 $797,233,615 39.8129 45.7254 5.9125 14.85%13 DEPARTMENT OF DEFENSE - OTHER $40,470,687,835 $10,093,403,979 22.2375 24.94 2.7025 12.15%14 DEPARTMENT OF DEFENSE - ARMY $127,376,844,833 $31,157,606,058 22.2375 24.461 2.2235 10.00%15 DEFENSE NUCLEAR FACILITIES SAFETY BOARD $3,050,342 $2,508,793 75.6705 82.2463 6.5758 8.69%16 DEPARTMENT OF AGRICULTURE $5,100,154,592 $2,714,612,248 49.8762 53.2261 3.3499 6.72%17 DEPARTMENT OF ENERGY $31,356,968,721 $1,947,226,029 5.87 6.2099 0.3399 5.79%18 DEPARTMENT OF HOMELAND SECURITY $11,805,816,779 $3,958,498,802 31.9 33.5301 1.6301 5.11%19 DEPARTMENT OF STATE $2,546,330,967 $978,118,183 37 38.4128 1.4128 3.82%20 DEPARTMENT OF LABOR $2,198,985,722 $757,589,512 33.4152 34.4518 1.0366 3.10%21 U. S. TRADE & DEVELOPMENT AGENCY $4,786,399 $4,688,064 97.1056 97.9455 0.8399 0.86%22 UNITED STATES INFORMATION AGENCY $18,031,684 $7,713,136 43.9784 42.7755 -1.2029 -2.74%23 EQUAL EMPLOYMENT OPPORTUNITY COMMISSION $48,023,733 $10,951,151 23.5772 22.8036 -0.7736 -3.28%24 NUCLEAR REGULATORY COMMISSION $201,088,924 $70,880,753 36.7111 35.2485 -1.4626 -3.98%25 NATIONAL TRANSPORTATION SAFETY BOARD $8,005,361 $3,848,793 50.1124 48.0777 -2.0347 -4.06%26 NATIONAL AERONAUTICS AND SPACE ADMIN. $14,345,609,385 $2,024,153,812 15.3548 14.1099 -1.2449 -8.11%27 DEPARTMENT OF TRANSPORTATION $1,754,411,968 $687,286,180 43.2819 39.1747 -4.1072 -9.49%28 SOCIAL SECURITY ADMINISTRATION $1,041,257,728 $344,991,358 36.7023 33.1322 -3.5701 -9.73%29 SMALL BUSINESS ADMINISTRATION $92,208,891 $55,192,665 67.0509 59.8561 -7.1948 -10.73%30 COMMODITY FUTURES TRADING COMMISSION $32,839,424 $10,750,813 36.8344 32.7375 -4.0969 -11.12%31 FEDERAL ENERGY REGULATORY COMMISSION $29,525,076 $12,579,176 48.1153 42.6051 -5.5102 -11.45%32 DEPARTMENT OF THE TREASURY $2,239,861,792 $574,813,432 29.3895 25.6629 -3.7266 -12.68%33 FEDERAL ELECTION COMMISSION $11,237,086 $4,139,867 42.4661 36.8411 -5.625 -13.25%34 DEPARTMENT OF HEALTH AND HUMAN SERVICES $17,830,436,210 $2,932,331,937 19 16.4457 -2.5543 -13.44%35 RAILROAD RETIREMENT BOARD $12,336,698 $5,259,194 49.2952 42.6305 -6.6647 -13.52%36 OFFICE OF PERSONNEL MANAGEMENT $675,655,586 $163,110,525 28.9404 24.1411 -4.7993 -16.58%37 DEPARTMENT OF THE INTERIOR $4,178,751,631 $1,904,932,562 55.4888 45.5862 -9.9026 -17.85%38 CONSUMER PRODUCT SAFETY COMMISSION $27,821,856 $13,175,421 59.98 47.3564 -12.6236 -21.05%39 FEDERAL COMMUNICATIONS COMMISSION $136,869,158 $55,560,441 52.8949 40.5938 -12.3011 -23.26%40 DEPARTMENT OF COMMERCE $3,048,241,402 $1,184,913,324 50.7903 38.872 -11.9183 -23.47%41 SMITHSONIAN INSTITUTION $261,903,000 $114,258,905 57.0061 43.6264 -13.3797 -23.47%42 DEPARTMENT OF HOUSING AND URBAN DEV'MENT $743,200,325 $376,301,145 66.331 50.6325 -15.6985 -23.67%43 MILLENIUM CHALLENGE CORPORATION $22,958,059 $9,484,535 54.9711 41.3124 -13.6587 -24.85%44 DEPARTMENT OF DEFENSE - AIR FORCE $61,952,080,032 $10,303,049,422 22.2375 16.6307 -5.6068 -25.21%45 GENERAL SERVICES ADMINISTRATION $10,854,777,526 $2,743,453,780 35.7418 25.2742 -10.4676 -29.29%46 DEPARTMENT OF DEFENSE - NAVY $89,925,688,745 $13,882,532,892 22.2375 15.4378 -6.7997 -30.58%47 DEPARTMENT OF JUSTICE $6,656,873,549 $1,653,342,284 36.8125 24.8366 -11.9759 -32.53%48 FEDERAL TRADE COMMISSION $63,833,499 $29,368,407 69.8129 46.0078 -23.8051 -34.10%49 INTERNATIONAL TRADE COMMISSION $283,174 $91,436 50.5449 32.2897 -18.2552 -36.12%50 NATIONAL SCIENCE FOUNDATION $318,414,081 $53,368,003 28.2646 16.7606 -11.504 -40.70%51 SECURITIES AND EXCHANGE COMMISSION $133,526,007 $38,940,815 49.6492 29.1635 -20.4857 -41.26%52 PEACE CORPS $21,885,068 $7,784,498 60.5668 35.5699 -24.9969 -41.27%53 OFFICE OF SPECIAL COUNSEL $38,857 $8,257 43.6141 21.2497 -22.3644 -51.28%54 AGENCY FOR INTERNATIONAL DEVELOPMENT $994,601,974 $88,024,168 19.6 8.8502 -10.7498 -54.85%55 NATIONAL FOUNDATION ON ARTS/HUMANITIES $9,721,704 $3,587,235 86.5193 36.8992 -49.6201 -57.35%56 CORPORATION FOR NATIONAL AND COMMUNITY S $67,221,415 $8,838,067 31.2832 13.1477 -18.1355 -57.97%57 NATIONAL LABOR RELATIONS BOARD $43,601,568 $3,822,872 34.0575 8.7677 -25.2898 -74.26%58 FEDERAL MARITIME COMMISSION $602,864 $26,445 42.8555 4.3866 -38.4689 -89.76%59 NATIONAL MEDIATION BOARD $1,359,033 $0 9.4321 0 -9.4321 -100.00%60 OCCUPATIONAL SAFETY & HEALTH REVIEW COMM -$3,643 $0 86.1513 0 -86.1513 -100.00%
Total $456,444,776,053 $97,060,877,529 21.3%
g y y

Characteristics of Recent Federal Small Business Contracting 6
Agency Median % Average %All Agencies 63.26 60.42Above SB Goal 64.40 66.81Below SB Goal 60.47 56.98
Table 4.2: Small Business Utilization Intensity
Agency Median % Average %All Agencies 13.41 17.65Above SB Goal 15.11 18.96Below SB Goal 13.01 16.94
Table 4.3: Small Business Births
Agency Median % Average %All Agencies 16.40 20.42Above SB Goal 14.55 18.39Below SB Goal 16.67 21.51
Table 4.4: Small Business Expiration
2. Small Business Utilization Intensity
This measure tests whether agencies achieving their small business procurement goals utilize small firms more intensely than underachieving agencies. In other words out of all the companies utilized by an agency in
procurement what share of these companies were small firms? While the results of this calculation may seem obvious in fact high small business dollar shares can result from agencies issuing large contracts to a relatively small number of firms. Small business utilization intensity can also be an indicator of how actively engaged an agency is with the small business community.
Data for FY 2009 confirm agencies that achieved their negotiated small business goals display small business utilization rates nearly 10 percentage point higher than at underachieving agencies. Furthermore, at 66.8 percent, the high achieving agencies’ average small business utilization rate is six percentage points higher than the average for all agencies.
Table 1.2 Small Business Utilization Intensity
3. Small Business Births
The new small business share is one indication of how actively an agency is recruiting small vendors. In FY 2009 a scan of all federal vendors active in the federal sector between FY 2005 through FY 2009 showed that an
average of 17.6 percent of all small businesses were new to the federal marketplace. Among agencies achieving their small business goals the new small business share of all small businesses was 2.0 percentage points higher on average than the share for agencies that did not achieve their small business goals.
Table 1.3 Small Business Births
4. Small Business Expiration
The share of small business expiration is a potential indicator of how unfavorable an agency’s procurement environment is for a small firm. This indicator measures the share of each agency’s FY 2008 small business
population that did not return to the federal marketplace in FY 2009 as indicated by the absence of an active FY 2008 DUNS number in the FY 2009 FPDS-NG database. Agencies meeting their small business procurement goals lost 18.4 percent of their vendors while agencies not meeting their goals lost 21.5 percent.
Table 1.4 Small Business Expiration

Characteristics of Recent Federal Small Business Contracting 7
Agency Median % Average %All Agencies 92.40 86.20Above SB Goal 87.81 84.42Below SB Goal 93.32 87.16
Table 4.5: Services Share
Agency Median % Average %All Agencies 7.60 13.80Above SB Goal 12.19 15.58Below SB Goal 6.68 12.84
Table 4.6: Manufacturing Share
Agency Median $ Average $All Agencies $156,794 $378,836Above SB Goal $141,792 $506,886Below SB Goal $184,491 $309,886
Table 4.7: Average Contract Size
5. Agency Services Share
Services contracts are traditionally a strong market for small federal prime vendors. FY 2009 contract statistics show that over eight out of ten procurement dollars were spent on services. Interestingly, high small business share-achieving agencies actually display a
slightly smaller services share, on average, than underperforming agencies. This indicates agencies can be successful by identifying qualified small manufacturing firms for a range of mid-tier projects.
Table 1.5 Services Share
6. Agency Manufacturing Sector Share
Government manufacturing purchases are dominated by large defense systems and platforms. We normally expect the small business share of manufacturing prime vendors to be low relative to services. An analysis of FY 2009 government
manufacturing spending indeed displays an average of 13.8 percent small business manufacturing share. Because the Army met its small business goals its manufacturing spending is included in the group of high achieving agencies which tends to improve the outlook. The Army is the largest procuring organization measured in this study.
Table 1.6 Manufacturing Share
7. Agency Average Contract Size
In recent years several trends have contributed to contract consolidation and an increase in average contract size. Not surprisingly the 2009 data show that increasing contract size correlates negatively with small business
agency procurement shares. Because the Army met its small business goals for FY 2009 its large contracts skew the average contract size for agencies meeting their small business goals. The median contract size showing high achieving agencies with smaller contracts than low achieving agencies is more reflective of the general trend that fewer small firms win large awards.
Table 1.7 Average Contract Size

Characteristics of Recent Federal Small Business Contracting 8
Agency Median AverageAll Agencies 2.01 2.37Above SB Goal 2.00 2.03Below SB Goal 2.02 2.55
Table 4.8: Agency Transactions per Contract
Agency Median % Average %All Agencies 64.12 64.59Above SB Goal 66.72 66.34Below SB Goal 61.27 63.65
Table 4.9: Fixed Price Share
Agency Median % Average %All Agencies 6.59 8.62Above SB Goal 8.53 10.57Below SB Goal 6.18 7.57
Table 4.10: Set-Aside Share
Agency Median % Average %All Agencies 61.93 59.96Above SB Goal 72.14 65.09Below SB Goal 58.04 57.20
Table 4.11: Competitive Share
8. Transactions Per Contract
Large contracts are usually associated with multiple transactions and this is what drives the negative correlation between transactions per contract and small business procurement share. In FY 2009 agencies that exceeded their small business goal display .52 fewer transactions per
contract than low achieving agencies on average. This could indicate high achieving agencies performed more small tasks or that they were more successful at breaking up large requirements into projects addressable by small firms.
Table 1.8 Agency Transactions per Contract
9. Fixed Price Contract Share
Fixed price contracts minimize risk for government agencies and are a commonly used tool among contract officers working with small firms where it is easier to price discrete quantities of delivered goods and services. In FY 2009 approximately two-thirds of all
procurement spending was on some type of fixed price contract. Data for that year show that agencies exceeding their small business procurement goals used fixed price contracts about 2.7 percentage points more often than low performing agencies on average.
Table 1.9 Fixed Price Contract Share
10. Set-Aside Contract Dollar Share
Small business set-aside provisions are applied to contract solicitations by agencies seeking to restrict contract bidding and award exclusively to a pool of eligible small and/or disadvantaged firms. Set-asides, which can be
mandatory or discretionary, are one of the most direct tools with which agencies can increase the small business procurement share. FY 2009 data show that on average agencies that exceed their small business procurement goals use set-asides 3 percentage points more often than lower achieving agencies on average.
Table 1.10 Set-Aside Contract Dollar Share
11. Competitive Contract Dollar Share
In FY 2009 agencies that met or exceeded their small business procurement goals competed nearly two thirds of their dollar
Table 1.11 Competitive Share

Characteristics of Recent Federal Small Business Contracting 9
awards (65.1 percent) while under-achieving agencies competed 57.2 percent. The competitive categories included all forms of full and open competition including GSA Schedule contracts, a type of competitively awarded contract in which small firms traditionally perform strongly. Overall, however, statistics suggest that small firms perform best utilizing the range of preference and incentive programs devoted to small business.
Conclusion
High-achieving agencies that meet their negotiated small business procurement goals have the following characteristics compared to agencies not meeting their goals:
1) They utilize small businesses more intensely. 2) They attract more new small firms to their agencies. 3) They retain small firm participation longer. High achieving agencies lose
fewer small firms each year in aggregate than low achieving agencies. 4) They may or may not spend more on services and manufacturing than their
under-achieving counterparts. 5) They successfully negotiate contracts with small firms despite conducting
large procurements. 6) They keep the number of task and delivery orders per contract relatively low. 7) They conduct more fixed price contracts. 8) They utilize the socioeconomic set-aside programs more intensively. 9) They award more dollars utilizing full and open competitions.
Overall, high-achieving agencies appear to be more effective in their outreach to the small business community and in managing their existing small business relationships. Their effectiveness cuts across market segments, meaning that the types of goods and services procured do not pre-determine successful small business utilization. Large contracts also do not preclude effective small business outreach. However this means that successful agencies must manage smaller contracts effectively by breaking tasks up into manageable parts and by issuing more competitive, fixed price awards appropriately sized for small firms. High-achieving agencies also utilize small business set-aside programs more intensively then low-achieving agencies.
In sum, FY 2009 statistics suggest that agencies with a multi-faceted, well-organized approach to small business relations can achieve a high degree of small business participation in procurement even while facing market and spending trends that skew spending toward large firms.

Characteristics of Recent Federal Small Business Contracting 10
Chapter 2: Small Business Utilization in Contracts Issued under the American Recovery and Reinvestment Act (ARRA)
Overview
The purpose of this analysis is to describe patterns of small business utilization on contracts issued as part of the American Recovery and Reinvestment Act (ARRA). ARRA was the federal government’s attempt to stimulate economic activity during America’s most serious economic slowdown since the Great Depression. ARRA called for spending $870 billion in tax and hiring incentives, loan guarantees, grants and prime contracts over the FY 2009 - FY 2011 period. Many incentives were directed particularly to small firms. This analysis looks at the small business utilization resulting from the approximately $51.7 billion in ARRA procurement spending in an effort to compare ARRA contracting with ongoing small business procurement goals and programs.
Analytical Strategy
To conduct this analysis, Eagle Eye identified 19 small business procurement measures that describe a broad range of federal agency spending patterns under ARRA. Among these measures are the standard measures of agency small business statutory goal achievement as well as numerous market and award-oriented measures that place small business accomplishments in the context of broader agency spending practices.
Research Methodology
Using only ARRA data from the FY2009 - FY2011 FPDS-NG database that has been adjusted for SBA excluded categories, we compared agencies against one another by measuring and correlating agency procurement statistics for:
Market and Agency Summary
• ARRA spending down by major NAICS Industrial Sectors • ARRA spending down by specific 6-digit NAICS markets • Overall ARRA program small business utilization by agency small business goal • ARRA contract characteristics

Characteristics of Recent Federal Small Business Contracting 11
Other SBA Statutory Goal Achievements
• Small and Disadvantaged Business (SDB) Awards • Historically Underutilized Business Zones (HUBZone) Business Awards • Women Owned Business (WOB) Awards • Service Disabled Veteran Owned Small Business (SDVOSB) Awards
Set-Aside Programs
• 8(a) Set-Aside • Total Small Business Set-Aside • Partial Small Business Set-Aside • HUB Zone Set-Aside • Service-Disabled Veteran-Owned Business Set-Aside • Small Purchase Awards ($3,000 - $100,000)
Other Contract Practices
• GSA Schedule • New Definitive Contracts • Indefinite Delivery, Indefinite Quantity (IDIQs) • Consolidated Contracts With Multiple Product Service Codes • Small Business Utilization Intensity
Results and Analysis
1. Agency Overview
Between February, 2009 and December 2010 federal agencies spent approximately $51.7 billion on ARRA prime awards through 102,454 unique prime contract vehicles. These contracts have been moderately favorable to small firms compared to agency contracting overall. Since the first reported ARRA contract awards in February 2009 through the most recent in December 2010, small firms won $13.1 billion, or 25.5 percent of the $51.7 billion dollars awarded by the 28 participating agencies. In FY 2009, the first, partial fiscal year of the ARRA program, ARRA contract spending amounted to $19.3 billion or 1.4 percent of reported FY 2009 agency contract spending. These figures take into account the SBA excluded spending categories.

Characteristics of Recent Federal Small Business Contracting 12
Thirteen agencies exceeded their small business procurement goals by an average of 21.5 percent while fifteen agencies fell below their goals. At 25.5 percent the ARRA small business share over two years is 4.2 percentage points higher than the 21.3 percent overall small business procurement share achieved by agencies in FY 2009 (including FY 2009 ARRA dollars).
If agencies had awarded ARRA contracts for exactly the amount called for in their negotiated small business procurement goals they would have issued $10.6 billion in ARRA contracts. This means that small firms gained an extra $2.6 billion toward agency small business procurement goals as a result of ARRA prime contracts. A look at the higher achieving agencies tells why: the three largest spending ARRA spending agencies, Department of Energy (DOE), Health and Human Services (HHS) and Army, all significantly exceeded their negotiated small business goals with their ARRA awards. In fact all major, participating branches of DoD exceeded their small business goals issuing ARRA contracts. Although the Department of Education exceeded its goal by the highest percentage difference DOE, HHS and the military services made the biggest dollar impact.
2. Market Overview
Table 2.2 shows that between FY 2009 and FY 2011 YTD, agencies participating in the ARRA program concentrated 87 percent of their ARRA prime contract spending in just four industrial
ARRA ARRA Negot ARRA ARRA ARRARank Agency Overall $ Small Bus $ SB Goal SB % Achv Achv - Goal % of SB Goal
1 DEPARTMENT OF EDUCATION $15,327,411 $10,779,610 12.7964 70.329 57.5326 449.6%2 DEPARTMENT OF DEFENSE - AIR FORCE $962,811,425 $693,592,007 22.2375 72.0382 49.8007 223.9%3 DEPARTMENT OF DEFENSE - ARMY $6,089,749,607 $3,179,969,062 22.2375 52.2184 29.9809 134.8%4 DEPARTMENT OF LABOR $166,672,858 $109,733,842 33.4152 65.8379 32.4227 97.0%5 DEPARTMENT OF DEFENSE - NAVY $986,943,144 $421,418,429 22.2375 42.6994 20.4619 92.0%6 DEPARTMENT OF ENERGY $15,186,919,310 $1,707,765,791 5.87 11.245 5.375 91.6%7 DEPARTMENT OF DEFENSE - OTHER $8,723,924 $3,114,037 22.2375 35.6954 13.4579 60.5%8 ENVIRONMENTAL PROTECTION AGENCY $328,514,398 $191,954,784 39.8129 58.4312 18.6183 46.8%9 SMITHSONIAN INSTITUTION $18,241,870 $14,556,288 57.0061 79.796 22.7899 40.0%
10 DEPARTMENT OF AGRICULTURE $974,380,414 $636,294,727 49.8762 65.3025 15.4263 30.9%11 DEPARTMENT OF STATE $1,123,379,841 $483,946,159 37 43.0795 6.0795 16.4%12 DEPARTMENT OF HEALTH AND HUMAN SERVICES $13,506,917,818 $2,863,300,431 19 21.1988 2.1988 11.6%13 SMALL BUSINESS ADMINISTRATION $22,963,645 $16,646,219 67.0509 72.4894 5.4385 8.1%14 DEPARTMENT OF VETERANS AFFAIRS $3,951,954,155 $1,087,234,011 28.7077 27.5113 -1.1964 -4.2%15 DEPARTMENT OF TRANSPORTATION $248,409,857 $95,085,528 43.2819 38.2777 -5.0042 -11.6%16 DEPARTMENT OF THE INTERIOR $1,353,343,454 $610,921,840 55.4888 45.1417 -10.3471 -18.6%17 FEDERAL COMMUNICATIONS COMMISSION $69,122,784 $28,501,748 52.8949 41.2335 -11.6614 -22.0%18 NATIONAL AERONAUTICS AND SPACE ADMIN. $952,329,753 $101,340,942 15.3548 10.6414 -4.7134 -30.7%19 DEPARTMENT OF HOUSING AND URBAN DEV'MENT $12,337,941 $5,510,792 66.331 44.6654 -21.6656 -32.7%20 DEPARTMENT OF JUSTICE $17,988,240 $3,835,838 36.8125 21.3241 -15.4884 -42.1%21 DEPARTMENT OF COMMERCE $427,855,675 $104,700,932 50.7903 24.4711 -26.3192 -51.8%22 DEPARTMENT OF HOMELAND SECURITY $238,605,366 $35,630,833 31.9 14.933 -16.967 -53.2%23 GENERAL SERVICES ADMINISTRATION $4,692,529,199 $769,668,819 35.7418 16.402 -19.3398 -54.1%24 AGENCY FOR INTERNATIONAL DEVELOPMENT $176,100,367 $13,505,397 19.6 7.6691 -11.9309 -60.9%25 SOCIAL SECURITY ADMINISTRATION $22,284,170 $2,683,859 36.7023 12.0438 -24.6585 -67.2%26 DEPARTMENT OF THE TREASURY $68,293,579 $1,346,655 29.3895 1.9719 -27.4176 -93.3%27 NATIONAL SCIENCE FOUNDATION $35,638,944 $658,856 28.2646 1.8487 -26.4159 -93.5%28 CORP FOR NATIONAL AND COMMUNITY SERVICE $13,866,330 $144,916 31.2832 1.0451 -30.2381 -96.7%
Total $51,672,205,479 $13,193,842,352 25.53
Table 5.1: ARRA Agency Spending Summary FY09-FY11 YTD
Table 2.1 American Recovery and Reinvestment Act (ARRA) Agency Spending Summary FY09–FY11 YTD

Characteristics of Recent Federal Small Business Contracting 13
sectors: Construction; Professional, Scientific and Technical Services; Administrative Support, Waste Management and Remediation; and Manufacturing. For small firms over 80 percent of all ARRA spending went to infrastructure projects and services. The top two sectors, Construction and Professional Services, accounted for 53 percent of ARRA spending overall and 71 percent of small vendor ARRA contract revenue. Manufacturing represented only 11.7 percent of overall ARRA contract spending and just 9 percent of small business revenue.
Table 2.3 provides a further breakout of ARRA spending into the top 25 six-digit NAICS categories, confirms that 25 out of over 800 active ARRA NAICS markets accounted for 82 percent of all ARRA spending. A quick glance down the NAICS code column confirms the predominance of NAICS Groups 23 (Construction), 54 (Professional Services) and 56 (Administrative Support). Small firms tend to be under-represented in Group 54 ARRA spending, which encompasses an array of high-technology research and professional services. The average size of the 102,454 ARRA contracts is $504,345 over the nearly two-year ARRA payout period. Agencies issued a total of 513,500 transactions against these contracts generating an average number of transactions per contract factor of 5 and an average transaction value of $100,627, well within small business performance capabilities.
NAICS Sector Small Business Large Bus / Other Total FY09-FY00 YTDConstruction $6,148,218,878 $7,352,360,846 $13,500,579,725Professional, Scientific, and Technical Services $3,017,295,726 $10,314,815,413 $13,332,111,138Administrative Support; Waste Management and Remediation Services $1,662,336,656 $9,850,159,275 $11,512,495,932Manufacturing $1,161,022,144 $4,763,791,583 $5,924,813,727Wholesale Trade $147,146,062 $2,557,585,360 $2,704,731,422#N/A $199,316,808 $1,556,358,760 $1,755,675,568Finance and Insurance $94,746,965 $831,423,760 $926,170,726Information $204,590,773 $261,893,738 $466,484,511Retail Trade $137,981,929 $224,187,589 $362,169,518Agriculture, Forestry, Fishing, and Hunting $143,227,322 $23,926,698 $167,154,020Grand Total $12,915,883,264 $37,736,503,024 $50,652,386,287
NAICS Sector Small Business Large Bus / Other Total FY09-FY00 YTDConstruction 47.60% 19.48% 26.65%Professional, Scientific, and Technical Services 23.36% 27.33% 26.32%Administrative Support; Waste Management and Remediation Services 12.87% 26.10% 22.73%Manufacturing 8.99% 12.62% 11.70%Wholesale Trade 1.14% 6.78% 5.34%#N/A 1.54% 4.12% 3.47%Finance and Insurance 0.73% 2.20% 1.83%Information 1.58% 0.69% 0.92%Retail Trade 1.07% 0.59% 0.72%Agriculture, Forestry, Fishing, and Hunting 1.11% 0.06% 0.33%Grand Total 100.00% 100.00% 100.00%
Table 5.2: Top 10 ARRA Industrial Sectors with Small and Large Business BreakoutsTable 2.2 Top ARRA Industrial Sectors with Small Large Business Breakouts

Characteristics of Recent Federal Small Business Contracting 14
Rank NAICS NAICS Description Large/Other $ Large/Oth % Small Bus $ Small Bus % Grand Total Overall %
1 236220Commercial and Institutional Building Construction $4,547,698,023 62.7% $2,701,088,876 37.3% $7,248,786,899 14.0%
2 561210 Facilities Support Services $5,369,121,420 94.9% $286,995,352 5.1% $5,656,116,771 10.9%3 562910 Remediation Services $2,877,318,634 76.3% $891,324,509 23.7% $3,768,643,143 7.3%
4 541710Research and Development in the Physical, Engineering, and Life Sciences $2,598,911,361 96.9% $84,288,518 3.1% $2,683,199,879 5.2%
5 237990
Construction $1,368,195,643 52.5% $1,235,873,549 47.5% $2,604,069,192 5.0%
6 424210Drugs and Druggists' Sundries Merchant Wholesalers $2,450,869,495 100.0% $388,160 0.0% $2,451,257,656 4.7%
7 325412 Pharmaceutical Preparation Manufacturing $2,106,853,813 99.8% $3,306,725 0.2% $2,110,160,537 4.1%8 <blank> $1,556,358,760 88.6% $199,316,808 11.4% $1,755,675,568 3.4%
9 541611Administrative Management and General Management Consulting Services $1,147,839,973 73.4% $415,592,887 26.6% $1,563,432,860 3.0%
10 541990All Other Professional, Scientific, and Technical Services $1,296,662,204 91.9% $113,920,116 8.1% $1,410,582,320 2.7%
11 237310 Highway, Street, and Bridge Construction $652,636,905 50.1% $651,230,856 49.9% $1,303,867,761 2.5%12 541711
Biotechnology $972,613,791 86.9% $146,156,510 13.1% $1,118,770,301 2.2%
13 541712
Research and Development in the Physical, Engineering, and Life Sciences (Except Biotechnology) $930,439,396 88.2% $124,680,925 11.8% $1,055,120,321 2.0%
14 562211 Hazardous Waste Treatment and Disposal $865,259,613 87.2% $127,422,921 12.8% $992,682,535 1.9%15 541512 Computer Systems Design Services $671,098,060 75.8% $214,197,713 24.2% $885,295,774 1.7%16 541330 Engineering Services $585,786,983 67.1% $287,436,525 32.9% $873,223,509 1.7%
17 325414Biological Product (except Diagnostic) Manufacturing $811,107,494 96.9% $25,951,668 3.1% $837,059,161 1.6%
18 541519 Other Computer Related Services $186,058,521 22.7% $632,390,398 77.3% $818,448,919 1.6%
19 524114Direct Health and Medical Insurance Carriers $736,994,546 100.0% -$9,795 0.0% $736,984,751 1.4%
20 236210 Industrial Building Construction $264,565,875 54.1% $224,093,287 45.9% $488,659,162 0.9%21 541310 Architectural Services $363,452,412 75.3% $119,314,055 24.7% $482,766,467 0.9%22 336111 Automobile Manufacturing $435,694,035 96.2% $17,291,145 3.8% $452,985,180 0.9%23 541511 Custom Computer Programming Services $198,242,178 50.0% $198,284,859 50.0% $396,527,036 0.8%
24 541690Other Scientific and Technical Consulting Services $266,315,107 77.6% $76,756,228 22.4% $343,071,335 0.7%
25 238220Plumbing, Heating, and Air-Conditioning Contractors $65,264,592 19.5% $269,811,161 80.5% $335,075,753 0.6%All Other $5,153,014,155 55.4% $4,146,738,397 44.6% $9,299,752,552 18.0%Total $38,478,372,989 74.5% $13,193,842,353 25.5% $51,672,215,342 100.0%
Table 5.3: Market Composition of ARRA Prime Contracts FY09 - FY11 YTD With Large/Small Breakout
Total Small WOB SDB 8a HUBZone SDVOSBCount 26,378 20,023 4,179 2,220 1,906 1,434 1,366Share 100.0% 75.9% 15.8% 8.4% 7.2% 5.4% 5.2%
Table 5.4: Overall Count of ARRA Businesses By Type of Firm
3. Company Overview
Since the start of the ARRA program in FY 2009 the 28 active agencies in the ARRA program have issued prime contracts to a total of 26,378 companies. As summarized in Table 2.4, over three-quarters of these firms are small businesses; together they won 25 percent of all ARRA contract dollars. Summing the number of unique companies from agency to agency yields a different company total, 31,246. This indicates that 4,868 companies, including 2,853 small businesses, performed ARRA work for multiple agencies.
Table 2.3 Market Composition of ARRA Prime Contracts FY09–FY11 YTD with Large/Small Breakout
Table 2.4 Overall Count of ARRA Businesses by Type of Firm

Characteristics of Recent Federal Small Business Contracting 15
Agency Total Comps SB SB % SDB SDB % WOB WOB % HUB HUB % SDVOSB SDVOSB % 8a 8a %USDA 1,856 1,646 88.69 210 11.31 298 16.06 401 21.61 77 4.15 192 10.34DOL 287 239 83.28 26 9.06 109 37.98 14 4.88 8 2.79 24 8.36AF 391 324 82.86 199 50.90 70 17.90 109 27.88 29 7.42 176 45.01FCC 61 50 81.97 4 6.56 13 21.31 5 8.20 6 9.84 4 6.56DOI 2,061 1,687 81.85 213 10.33 304 14.75 199 9.66 96 4.66 194 9.41ARMY 2,568 2,065 80.41 526 20.48 394 15.34 383 14.91 153 5.96 471 18.34GSA 3,022 2,430 80.41 328 10.85 594 19.66 192 6.35 172 5.69 236 7.81DVA 7,470 5,725 76.64 242 3.24 907 12.14 145 1.94 783 10.48 168 2.25DOC 181 129 71.27 23 12.71 23 12.71 6 3.31 3 1.66 19 10.50HHS 9,319 6,300 67.60 599 6.43 1522 16.33 158 1.70 220 2.36 513 5.50DOE 1,656 1,100 66.43 215 12.98 222 13.41 49 2.96 56 3.38 193 11.65NAVY 182 118 64.84 66 36.26 33 18.13 44 24.18 4 2.20 59 32.42SMITH 11 7 63.64 4 36.36 1 9.09 3 27.27 0 0.00 4 36.36NASA 179 113 63.13 21 11.73 21 11.73 6 3.35 5 2.79 19 10.61SBA 45 28 62.22 18 40.00 6 13.33 4 8.89 2 4.44 16 35.56EPA 63 39 61.90 13 20.63 7 11.11 2 3.17 12 19.05 8 12.70DHS 44 27 61.36 8 18.18 4 9.09 2 4.55 1 2.27 8 18.18CNCS 7 4 57.14 2 28.57 1 14.29 0 0.00 0 0.00 1 14.29DOJ 36 20 55.56 7 19.44 3 8.33 1 2.78 0 0.00 7 19.44DOT 81 44 54.32 15 18.52 7 8.64 13 16.05 3 3.70 13 16.05DED 21 11 52.38 2 9.52 2 9.52 2 9.52 1 4.76 2 9.52NSF 8 4 50.00 3 37.50 2 25.00 0 0.00 1 12.50 2 25.00STATE 1,590 735 46.23 142 8.93 254 15.97 43 2.70 63 3.96 127 7.99TREAS 13 5 38.46 1 7.69 2 15.38 1 7.69 2 15.38 1 7.69HUD 21 8 38.10 6 28.57 3 14.29 1 4.76 0 0.00 6 28.57DOD-OTHER 8 3 37.50 1 12.50 1 12.50 0 0.00 0 0.00 1 12.50SSA 16 4 25.00 0 0.00 0 0.00 0 0.00 0 0.00 0 0.00USAID 49 11 22.45 3 6.12 8 16.33 1 2.04 1 2.04 3 6.12
Table 5.5: ARRA Small Business Utilization Intensity By Agency FY 2009 - FY 2011
Table 2.5 breaks the ARRA program expenditure down by agency, and detailed company counts and shares by socioeconomic category. The table is ranked by the small business share, or the number of small ARRA vendors as a share of an agency’s total ARRA vendors. The most intensive user of small ARRA vendors is the Department of Agriculture. Nearly 90 percent of the department’s vendors were small firms. They are followed by the Department of Labor (83.3 percent) and the Air Force (82.9 percent).
The Department of Health and Human Services, the Department of Veterans Affairs and the General Services Administration are the heaviest users of small ARRA vendors in terms of the total number of companies. Despite this fact, neither the General Services Administration nor the Department of Veterans Affairs met their dollar goals for small business procurement. Five of the top 10 heaviest agency users of small ARRA firms met or exceeded their small business goals meaning that some agencies use small firms intensively for projects with small dollar values.
Table 2.5 ARRA Small Business Utilization Intensity by Agency, FY 2009–FY 2011

Characteristics of Recent Federal Small Business Contracting 16
4. Other Statutory Goal Category Characteristics of ARRA Spending
In terms of statutory goal compliance the ARRA program has been a complete success. Not only has the overall government small business procurement goal of 23 percent been exceeded by two percentage points but the other four statutory goals have been exceeded as well. This is documented in Table 2.7, below, where success is represented in green and underachievement in red.
While agency performance on individual goals was spotty several large agencies exceeded SBA statutory goals by substantial amounts or missed by a small percentage. Five agencies met all statutory goals in their ARRA procurement programs. These include: Army; State Department; Department of Agriculture; Air Force; and the Federal Communication Commission. Seven agencies did not meet any statutory goals through ARRA procurement. These agencies included: Department of Energy; General Services Administration; Department of Homeland Security; Treasury; National Science Foundation; Social Security Administration; and Department of Defense–Other.
Only eight out of the 28 active ARRA awarding agencies met their service disabled veteran owned small business goals, while 18 met the small disadvantaged business goal, 13 met the HUBZone goal, and 13 met their women-owned business goal. The combined overage of the eight successful agencies in the service disabled veteran category was enough to bring total ARRA service disabled veteran spending over the overall 3 percent threshold.

Characteristics of Recent Federal Small Business Contracting 17
Agency Overall $ SDB $ SDVOSB $ HUBZone $ WOB $DOE $15,186,919,310 $566,783,561 $305,783,152 $162,519,095 $225,625,267HHS $13,506,917,818 $1,376,890,233 $180,900,705 $205,959,891 $839,734,224DOD-ARMY $6,089,749,607 $1,408,614,205 $204,674,708 $1,170,466,267 $656,309,225GSA $4,692,529,199 $176,200,341 $45,648,659 $79,379,635 $189,133,137DVA $3,951,954,155 $96,349,640 $875,659,471 $84,504,645 $49,840,763DOI $1,353,343,454 $216,334,229 $27,732,290 $164,456,615 $105,288,087STATE $1,123,379,841 $140,137,583 $38,028,123 $68,499,445 $123,812,570DOD-NAVY $986,943,144 $187,525,582 $4,061,447 $149,264,258 $172,204,996USDA $974,380,414 $199,117,469 $39,735,895 $238,541,435 $130,272,016DOD-AF $962,811,425 $520,917,840 $43,372,343 $249,507,363 $118,403,988NASA $952,329,753 $59,810,699 $1,352,122 $4,286,269 $8,336,198DOC $427,855,675 $30,575,818 $1,970,470 $6,699,217 $11,194,041EPA $328,514,398 $74,591,986 $58,100,532 $13,252,665 $10,877,399DOT $248,409,857 $21,302,206 $1,193,562 $50,510,053 $10,303,410DHS $238,605,366 $8,850,855 $1,239,741 $7,118,640 $7,693,838USAID $176,100,367 $1,141,638 $3,659 $227,900 $11,846,475DOL $166,672,858 $38,020,488 $4,847,123 $26,390,237 $13,893,670FCA $69,122,784 $4,692,696 $9,748,446 $7,610,531 $6,312,151TREAS $68,293,579 $349,053 $985,580 $349,053 $12,022NSF $35,638,944 $640,100 $18,756 $0 $16,332SBA $22,963,645 $13,617,927 $124,741 $1,547,360 $7,317,809SSA $22,284,170 $0 $0 $0 $0SMITH $18,241,870 $9,696,036 $0 $5,440,608 $1,946,176DOJ $17,988,240 $3,350,983 $0 $77,938 $139,548DED $15,327,411 $402,033 $600,000 $626,227 $746,198CNCS $13,866,330 $967,965 $0 $0 $7,700HUD $12,337,941 $3,719,773 $0 $187,443 $1,791,702DOD-OTHER $8,723,924 $226,537 $0 $0 $226,537Grand Total $51,672,205,479 $5,160,827,476 $1,845,781,525 $2,697,422,790 $2,703,285,479
Agency Sum of Overall $ SDB % SDVOSB % HUBZone % WOB %DOE $15,186,919,310 3.7% 2.0% 1.1% 1.5%HHS $13,506,917,818 10.2% 1.3% 1.5% 6.2%DOD-ARMY $6,089,749,607 23.1% 3.4% 19.2% 10.8%GSA $4,692,529,199 3.8% 1.0% 1.7% 4.0%DVA $3,951,954,155 2.4% 22.2% 2.1% 1.3%DOI $1,353,343,454 16.0% 2.0% 12.2% 7.8%STATE $1,123,379,841 12.5% 3.4% 6.1% 11.0%DOD-NAVY $986,943,144 19.0% 0.4% 15.1% 17.4%USDA $974,380,414 20.4% 4.1% 24.5% 13.4%DOD-AF $962,811,425 54.1% 4.5% 25.9% 12.3%NASA $952,329,753 6.3% 0.1% 0.5% 0.9%DOC $427,855,675 7.1% 0.5% 1.6% 2.6%EPA $328,514,398 22.7% 17.7% 4.0% 3.3%DOT $248,409,857 8.6% 0.5% 20.3% 4.1%DHS $238,605,366 3.7% 0.5% 3.0% 3.2%USAID $176,100,367 0.6% 0.0% 0.1% 6.7%DOL $166,672,858 22.8% 2.9% 15.8% 8.3%FCC $69,122,784 6.8% 14.1% 11.0% 9.1%TREAS $68,293,579 0.5% 1.4% 0.5% 0.0%NSF $35,638,944 1.8% 0.1% 0.0% 0.0%SBA $22,963,645 59.3% 0.5% 6.7% 31.9%SSA $22,284,170 0.0% 0.0% 0.0% 0.0%SMITH $18,241,870 53.2% 0.0% 29.8% 10.7%DOJ $17,988,240 18.6% 0.0% 0.4% 0.8%DED $15,327,411 2.6% 3.9% 4.1% 4.9%CNCS $13,866,330 7.0% 0.0% 0.0% 0.1%HUD $12,337,941 30.1% 0.0% 1.5% 14.5%DOD-OTHER $8,723,924 2.6% 0.0% 0.0% 2.6%Grand Total $51,672,205,479 10.0% 3.6% 5.2% 5.2%
SDB Goal = 5% SDVOSB Goal = 3% HUBZone Goal = 3% WOB Goal = 5%
Table 5.6: Statutory Goal Compliance by Agency in the ARRA Program FY09 - FY11
Table 5.7: Statutory Goal Compliance Mapped To Goal Over- and Under Achievement
Table 2.6 Statutory Goal Compliance by Agency in the ARRA Program FY09–FY11
Table 2.7 Statutory Goal Compliance Mapped to Goal Over- and Under-Achievement

Characteristics of Recent Federal Small Business Contracting 18
5. Agency Utilization of Set-Aside Contracts For ARRA Procurements
An analysis of the major small business contract set-aside programs used in ARRA awards reveals that just over 15 percent of all ARRA prime contract dollars were awarded under set-aside conditions. In other words, less than one out of every seven ARRA dollars was set-aside for a small business. These could be set asides for small businesses, minority-owned firms, HUBZone firms, service-disabled veterans, or reserved for small businesses on the basis of the small (under $100,000) size of the contract.
The five largest users of ARRA set-asides include: Army; Health and Human Services; Department of Energy; Department of Veteran Affairs; and Air Force. Together these five agencies accounted for 78 percent of all ARRA set-aside spending since February 2009.
Seven of the 10 largest users of set-aside contracts, and nine of the top 12, met or exceeded their negotiated small business goals issuing contracts as part of the ARRA program. These agencies, or bureaus, are highlighted in green in Table 2.5. They include: Army; Health and Human Services; Department of Energy; Air Force; Department of Agriculture; Navy; and State. The Environmental Protection Agency and the Department of Labor round out the top 12.
As detailed in Table 2.8, the most popular ARRA set-aside program in terms of total dollars awarded is the 8(a) program, including 8(a) competed and 8(a) sole source awards. 8(a) set-asides are followed in popularity by small business set-asides, service-disabled veteran-owned small business and then by HUBZone.
Agencies appear to develop proclivities for certain types of set-asides. For example, the Army accounts for 34.5 percent of all ARRA 8(a) set-asides, 30 percent of all ARRA small business set-asides and 55 percent of ARRA HUBZone set-asides. At 31.8 percent the Army accounted for nearly one-third of all ARRA set-aside spending, nearly double the next nearest agency, HHS. In terms of its own agency spending, over 40 percent of Army’s ARRA dollar awards were made under set-aside terms. The Department of Energy, which accounted for 29.3 percent of all ARRA spending awarded 50.6 percent of all awards Reserved for Small Business under the Simplified Acquisition Threshold (between $3,000 and $100,000).
Set-asides appear to be associated with high levels of small business utilization in the ARRA program. At around 15 percent of total ARRA dollars they are not the determining factor but obviously an indicator of active agency engagement with small business.

Characteristics of Recent Federal Small Business Contracting 19
6. Conclusion
Relative to the federal government’s overall small business utilization ARRA procurement spending successfully utilized small firms both in terms of numbers of companies and in terms of dollars spent. The most significant small business accomplishments resulting from ARRA procurement include:
• Between February, 2009 and December, 2010 small firms won $13.1 billion, or 25.5 percent of the $51.7 billion dollars awarded by the 28 participating agencies.
• Nearly one-half of all ARRA procurement spending occurred in the Construction sector, a labor-intensive market segment heavily represented by small firms.
• 76 percent of all companies issued contracts as part of the ARRA were small businesses.
• At seven agencies, over four out of five ARRA vendors were small firms. • In terms of statutory SBA procurement goal compliance the ARRA program has
been a complete success. The government exceeded the combined small business procurement goal of 23 percent as well as the four statutory socioeconomic goals (SDB, SDVOSB, WOB, HUBZone).
• Over 15 percent of all ARRA prime contract dollars were awarded under set-aside terms.
Sum of Agcy Set-Aside %Agency 8A RSB VSA HUBZONE SB SDVOSB Set-Aside $ of Agcy $ NONE/OTH TotalARMY $1,030.68 $0.00 $0.00 $476.10 $864.59 $101.56 2,472.93 40.61% $3,616.82 $6,089.75HHS $597.59 $0.23 $0.00 $63.95 $560.96 $85.68 1,308.40 9.69% $12,198.52 $13,506.92DOE $247.55 $14.72 $0.00 $4.06 $607 $0 873.26 5.75% $14,314 $15,186.92DVA $1.48 $0.33 $34.66 $0.00 $25.41 $798.56 860.44 21.77% $3,091.51 $3,951.95AF $438.23 $0.00 $0.00 $67.49 $48.30 $10.56 564.58 58.64% $398.24 $962.81USDA $132.22 $0.04 $0.00 $97.12 $147.99 $11.83 389.20 39.94% $585.18 $974.38NAVY $154.30 $0.00 $0.00 $35.55 $104.84 $1.47 296.16 30.01% $690.78 $986.94DOI $127.32 $1.18 $0.00 $57.18 $69.54 $12.94 268.16 19.81% $1,085.18 $1,353.34STATE $82.26 $0.68 $0.00 $13.69 $59.45 $2.63 158.70 14.13% $964.68 $1,123.38GSA $46.07 $0.00 $0.00 $0.74 $109.21 $2.11 158.13 3.37% $4,534.40 $4,692.53EPA $10.67 $0.00 $0.00 $13.13 $67.34 $28.22 119.37 36.34% $209.15 $328.51DOL $33.47 $0.00 $0.00 $21.27 $49.02 $0.00 103.76 62.25% $62.91 $166.67NASA $18.95 $0.00 $0.00 $0.00 $51.80 $0.00 70.75 7.43% $881.58 $952.33DOC $12.65 $0.01 $0.00 $0.00 $29.36 $0.00 42.02 9.82% $385.83 $427.86DOT $21.10 $0.00 $0.00 $14.58 $0.05 $1.06 36.79 14.81% $211.62 $248.41DHS $10.14 $0.00 $0.00 $0.10 $12.59 $0.00 22.83 9.57% $215.77 $238.61FCC $0.00 $11.74 $0.00 $0.00 $2.03 $0.00 13.76 19.91% $55.36 $69.12SMITH $8.96 $0.00 $0.00 $0.00 $0.00 $0.00 8.96 49.14% $9.28 $18.24SBA $7.79 $0.00 $0.00 $0.00 $0.01 $0.00 7.80 33.98% $15.16 $22.96HUD $2.03 $0.19 $0.00 $0.00 $0.00 $0.00 2.22 17.96% $10.12 $12.34DOJ $1.56 $0.00 $0.00 $0.00 $0.23 $0.00 1.79 9.96% $16.20 $17.99NSF $0.62 $0.00 $0.00 $0.00 $0.00 $0.02 0.64 1.80% $35.00 $35.64TREAS $0.00 $0.00 $0.00 $0.35 $0.00 $0.13 0.48 0.70% $67.81 $68.29DOD-OTH $0.23 $0.00 $0.00 $0.00 $0.00 $0.00 0.23 2.60% $8.50 $8.72DED $0.00 $0.00 $0.00 $0.00 $0.01 $0.00 0.01 0.04% $15.32 $15.33USAID $0.00 $0.00 $0.00 $0.00 $0.00 $0.00 0.00 0.00% $176.10 $176.10SSA $0.00 $0.00 $0.00 $0.00 $0.00 $0.00 0.00 0.00% $22.28 $22.28CNCS $0.00 $0.00 $0.00 $0.00 $0.00 $0.00 0.00 0.00% $13.87 $13.87Grand Total $2,985.88 $29.11 $34.66 $865.33 $2,809.26 $1,057.13 $7,781.37 15.06% $43,890.84 $51,672.21
Set-Aside Types ($millions)Table 5.8: Breakdown of Key ARRA Socioeconomic Procurement Set-Aside Programs By Agency, FY 2009 - FY 2011 YTD
Table 2.8 Breakdown of Key ARRA Socioeconomic Procurement Set-Aside Programs by Agency, FY 2009–FY 2011YTD

Characteristics of Recent Federal Small Business Contracting 20
Chapter 3: Comparisons of How Agencies Achieve Success in Small Business Procurement
Overview
The purpose of this analysis is to visualize key agency small business procurement practices that identify causes of and potential solutions to small business procurement challenges across government.
Analytical Strategy
Develop a multi-dimensional dollar, company and transaction summary that explains current agency small business procurement measures in the context of both recent, internal agency trends and government-wide trends in order to quickly assess potential solutions to the ongoing challenges of small business utilization in procurement.
Research Methodology
Using only data from the FY 2009-2010 FPDS-NG database that have been adjusted for SBA excluded categories, we measure small business utilization in five broad areas: socioeconomic; company; set-aside programs; contract vehicles; and industry. Within each broad category, the analysis enumerates specific small business performance measures that document successes and flag areas of concern for remedial action by agency small business officials. The 23 measures developed for this analysis are shown in table 3.1.
Statutory Goal Categories Company Measures Contract Vehicles Set-Aside Programs Top 5 Agency NAICSAll Small Businesses New Small Bus GSA Schedule All Set-Asides NAICS 1
Small Disadvantaged Expired Small Bus IDIQs 8(a) NAICS 2
Woman-Owned GSA STARS HUBZone NAICS 3
HUBZone GSA VETS Small Business NAICS 4
Service-Disabled Small Disadv Bus NAICS 5
Service-Disabled
$3K-$100K Purch
Table 3.1 Small Business Utilization Measures

Characteristics of Recent Federal Small Business Contracting 21
Results and Analysis
The three representative agency tables that follow assess agency small business achievements in the context of current and prior-year agency and government-wide small business practices. The percentages in each table reveal the extent to which available procurement practices and tools help each agency utilize small vendors to meet their organization’s missions. The dollar, company and transaction percentages are designed to portray not only what trends are occurring but why they occur.
Offering this kind of information available in real time reports or dashboards makes it possible for small business offices to calibrate procurement practices as the fiscal year progresses in order to leverage maximum impact from remaining, available budget and staff resources. The availability of similar information simultaneously across all agencies promotes dialogue about the meaning of the data and encourages inter-agency collaboration as each organization works to maximize small business utilization.
Three representative agencies are highlighted in this chapter. Twenty-seven additional, cabinet level and independent agencies appear in Appendix B. The three highlighted agencies represent one large, medium and small government agency. They include the Army, the U.S. Agency for International Development, and the Nuclear Regulatory Commission. Their tables are each accompanied by a short interpretation of observed agency small business procurement trends.
1. Analysis of Small Business Procurement Performance at a Large Federal Agency: Department of Defense–Army
In FY 2010 year-to-date the Army met four out of five small business statutory goals (Table 3.2). Despite growing its women-owned business procurement share .47 percentage points Army still missed the 5 percent women-owned business statutory goal by .51 percentage points. Army grew its small business dollar share in every statutory goal category, including a .75 percentage point increase in women-owned business, yet fell short of its 5 percent goal. The Army is experiencing success with its small business outreach as indicated by its 150 percent increase in the dollar share of all Army small businesses that are new to the federal marketplace. The Army’s small business share of all Army vendors dropped slightly year-over-year but grew in the other four major statutory goal categories. This suggests potential contract consolidation and larger awards to some majority-owned small firms. The large reduction in the lost small business category is potentially an encouraging trend as it indicates more small business incumbents were retained from FY 2009-2010 than were retained from FY 2008-2009. Despite falling in several set-aside categories overall set-asides dollar share grew from FY 2009-2010, primarily driven by growth in small business set-asides. Shares of small business contract transactions grew slightly in all but the small disadvantaged business category suggesting Army may be having modest success in diversifying sources on large requirements.

Characteristics of Recent Federal Small Business Contracting 22
Army’s small business share of GSA Schedule contracts declined slightly despite a small rise in small business dollar share, indicating relatively fewer but larger GSA Schedule awards to small firms. Set-aside and GSA Schedule dollars, along with STARS and VETS contracts are below government-wide averages, flagging these as potential strategies for growing small business shares in the coming year. Four out of the Army’s five major NAICS categories showed growth in small business utilization in FY 2009-2010 although two out of the five were below the corresponding government-wide shares. Outreach to an experienced network of small firms in these markets could raise small firm utilization.

Characteristics of Recent Federal Small Business Contracting 23
Small Business Goal: 22.2375%
. . . And identified as: FY 2009 FY 2010 YTD FY 2009 FY 2010 YTD FY 2009 FY 2010 YTD FY 2009 FY 2010 YTD FY 2009 FY 2010 YTD FY 2009 FY 2010 YTDSocioeconomicAll Small Businesses 21.28% 22.79% 22.26% 24.80% 81.62% 81.02% 79.36% 78.44% 50.04% 51.70% 62.16% 63.36%Small Disadv Businesses 6.84% 6.75% 8.08% 8.17% 5.47% 5.31% 9.18% 9.40% 7.86% 7.74% 10.13% 9.85%Woman-Owned Businesses 3.99% 4.48% 3.67% 4.42% 15.73% 16.06% 14.87% 15.63% 11.09% 11.48% 14.68% 14.78%HUBZone Businesses 2.75% 2.75% 3.26% 4.63% 3.12% 3.20% 4.68% 4.85% 3.36% 3.34% 5.00% 5.01%Svc Disabled Businesses 3.99% 4.48% 3.67% 4.42% 15.73% 16.06% 14.87% 15.63% 11.09% 11.48% 14.68% 14.78%CompanyNew SBs 9.71% 9.99% 5.17% 13.09% 24.47% 22.21% 15.31% 14.09% 7.09% 5.44% 2.95% 3.43%Lost SBs * 54.67% 30.44% 22.42% 2.30% 37.68% 3.28% 0.98% 0.46% 18.68% 7.89% 1.86% 0.37%Set-Aside ProgramsAll Set-Asides 10.34% 12.11% 12.16% 15.03% 39.40% 40.46% 47.26% 47.80% 13.52% 16.34% 16.52% 18.88%8(a) 7.97% 9.37% 7.03% 7.11% 6.71% 6.41% 9.45% 9.36% 5.32% 9.27% 7.20% 11.12%HUBZone 4.85% 6.26% 3.03% 2.69% 4.42% 4.08% 4.96% 4.44% 2.31% 6.18% 3.23% 6.81%Small Business 9.48% 12.14% 8.38% 9.33% 34.92% 37.37% 43.42% 42.86% 10.64% 16.95% 13.33% 18.41%SDB 4.23% 5.58% 0.00% 1.54% 3.53% 3.00% 0.00% 3.07% 1.97% 5.70% 0.00% 6.01%SDVOSB 4.87% 6.60% 2.51% 2.01% 5.23% 4.87% 5.28% 4.68% 2.52% 6.52% 2.99% 6.50%$3K - $100K 4.28% 5.60% 2.20% 1.53% 7.47% 3.98% 3.81% 3.07% 2.43% 5.81% 2.58% 6.01%Contract VehiclesGSA Schedule 1.31% 1.57% 0.63% 0.76% 3.42% 3.74% 5.44% 6.06% 4.26% 4.45% 5.41% 5.38%IDIQs 12.72% 13.33% 14.45% 15.55% 18.72% 19.70% 21.32% 22.56% 27.99% 29.05% 42.16% 43.46%GSA STARS 0.11% 0.16% 0.02% 0.01% 0.10% 0.10% 0.08% 0.08% 0.07% 0.08% 0.02% 0.02%GSA VETS 0.04% 0.06% 0.01% 0.01% 0.02% 0.02% 0.01% 0.01% 0.01% 0.01% 0.00% 0.00%Top 5 NAICS FY09-FY10541330--Engineering Services 15.77% 17.80% 14.48% 16.85% 54.39% 52.91% 56.83% 54.39% 33.33% 33.37% 29.75% 31.15%236220--Commercial and Institutional Building Construction 35.67% 41.24% 33.06% 45.25% 63.06% 62.39% 83.08% 84.50% 77.41% 75.06% 65.91% 66.23%336992--Military Armored Vehicle, Tank, and Tank Component Manufacturing 2.58% 3.97% 1.79% 3.39% 73.08% 65.22% 70.31% 73.15% 53.11% 37.73% 32.27% 28.46%237990--Other Heavy and Civil Engineering Construction 32.16% 32.44% 47.96% 35.73% 62.75% 57.89% 80.79% 79.93% 74.84% 76.81% 77.83% 80.78%336411--Aircraft Manufacturing 2.58% 2.96% 5.36% 5.92% 51.61% 54.55% 38.57% 42.59% 46.73% 43.73% 31.00% 25.86%Notes: Green/Red streetlights indicate whether agency did or did not meet SBA statutory dollar goal. A yellow background indicates conditions deteriorated year-over-year. A red box indicates lower shares than the corresponding, overall federal share.
Table 6.1: DEPARTMENT OF DEFENSE - ARMY
Shares of Spending In . . . Shares of Companies In . . . Shares of Contract Transactions In . . .. . . Overall Federal Government . . . This Agency . . . Overall Federal Government . . . This Agency . . . Overall Federal Government . . . This Agency
Table 3.2 Analysis of Small Business Procurement Performance by the Department of Defense–Army

Characteristics of Recent Federal Small Business Contracting 24
2. Analysis of Small Business Procurement Performance at a Medium Federal Agency: U.S. Agency for International Development (USAID)
In FY 2010 USAID exceeded three out of five statutory goal measures, failing in overall small business and HUBZone dollar achievement (Table 3.3). Shares of agency expenditures devoted to small business, small disadvantaged business, and HUBZones fell, leading to a 9 percentage point underage in small business goal achievement. USAID continues to rely heavily on large vendors to fulfill its domestic and overseas missions. Small business utilization and transaction shares in statutory goal categories fell in all but small business, indicating relatively smaller awards to relatively fewer small firms. This portends continued under-achievement in statutory categories unless USAID can leverage and accelerate its strong growth in new firm spending and utilization. USAID’s small business dollar share fell in four out of seven set-aside categories and remained below the government-wide set-aside ratio. Every set-aside category’s small business dollar, company and transaction share was below the government-wide share. These are potential areas for increased staffing, more training or for more research into source selection.
USAID’s small business share of GSA Schedule spending declined year-over-year after exceeding government-wide shares in FY 2009 making this an under-utilized tool for small business goal achievement as well. The small vendor share grew in four out of five of the top agency NAICS market categories, particularly in NAICS 541690, Other Scientific and Technical Consulting Services. Four out of the five top NAICS categories are below the corresponding government-wide small business share. This indicates more outreach to an experienced network of small firms in these markets could raise small firm utilization in USAID’s core markets.
3. Analysis of Small Business Procurement Performance at a Small Federal Agency: Nuclear Regulatory Commission (NRC)
In FY 2010 NRC grew its small business dollar share in four out of five statutory goal categories, falling less than 2 percentage points in overall small business achievement (Table 3.4). Given NRC’s growth in dollar shares of small disadvantaged business, women-owned business, HUBZone and service-disabled veteran-owned small business, and given the overall growth of small business utilization from 55 percent to 60 percent, there appears to have been a downward trend in the amount of dollars awarded to majority-owned small vendors. NRC also funds other Department of Energy contracts with large firms which may also factor into the year-over-year decline in small business dollar and transaction share. The four-fold increase in the dollar share of NRC’s new small businesses combined with the slight increase in new small business utilization indicates that NRC is experiencing success with its small business outreach efforts and issuing relatively larger contracts to some of these new, small firms. Individual dollar categories of set-aside contracts tied to socioeconomic goals grew in dollar, company and transaction share despite a slight drop in the share of all set-aside spending. This is likely the result of a drop in an uncharted set-aside category. NRC’s small business dollar share of GSA Schedule contracts is five times greater than the overall government share, making these

Characteristics of Recent Federal Small Business Contracting 25
contracts an important vehicle for NRC small business goal achievement. Yet this share fell by .89 percent year-over-year. Small business participation in GSA Schedules grew while transaction share dropped, indicating fewer larger schedule awards to small firms. Three of NRC’s five largest NAICS categories showed declines in small business dollar, company and transaction shares indicating relatively heavier reliance on small firms in its larger markets. One of NRC’s top five NAICS categories, 562211 (Hazardous Waste Treatment and Disposal) showed no small business participation over the last two years.

Characteristics of Recent Federal Small Business Contracting 26
Small Business Goal: 19.6000%
. . . And identified as: FY 2009 FY 2010 YTD FY 2009 FY 2010 YTD FY 2009 FY 2010 YTD FY 2009 FY 2010 YTD FY 2009 FY 2010 YTD FY 2009 FY 2010 YTDSocioeconomicAll Small Businesses 21.28% 22.79% 16.02% 10.55% 81.62% 81.02% 41.88% 52.25% 50.04% 51.70% 32.55% 39.64%Small Disadv Businesses 6.84% 6.75% 10.42% 6.56% 5.47% 5.31% 11.88% 11.35% 7.86% 7.74% 13.02% 9.42%Woman-Owned Businesses 3.99% 4.48% 7.05% 7.61% 15.73% 16.06% 18.75% 17.56% 11.09% 11.48% 14.32% 12.58%HUBZone Businesses 2.75% 2.75% 3.19% 0.29% 3.12% 3.20% 3.75% 1.28% 3.36% 3.34% 6.25% 1.40%Svc Disabled Businesses 3.99% 4.48% 7.05% 7.61% 15.73% 16.06% 18.75% 17.56% 11.09% 11.48% 14.32% 12.58%CompanyNew SBs 9.71% 9.99% 0.00% 10.19% 24.47% 22.21% 0.00% 16.39% 7.09% 5.44% 0.00% 10.12%Lost SBs * 54.67% 30.44% 16.70% 0.03% 37.68% 3.28% 2.99% 1.64% 18.68% 7.89% 3.20% 0.61%Set-Aside ProgramsAll Set-Asides 10.34% 12.11% 0.52% 2.83% 39.40% 40.46% 7.50% 8.57% 13.52% 16.34% 5.21% 4.92%8(a) 7.97% 9.37% 1.69% 1.51% 6.71% 6.41% 8.13% 5.78% 5.32% 9.27% 7.55% 2.49%HUBZone 4.85% 6.26% 1.42% 0.31% 4.42% 4.08% 5.63% 1.93% 2.31% 6.18% 5.73% 0.61%Small Business 9.48% 12.14% 1.68% 1.90% 34.92% 37.37% 10.63% 6.64% 10.64% 16.95% 8.85% 3.34%SDB 4.23% 5.58% 0.00% 0.31% 3.53% 3.00% 0.00% 1.93% 1.97% 5.70% 0.00% 0.61%SDVOSB 4.87% 6.60% 1.42% 0.36% 5.23% 4.87% 6.25% 2.36% 2.52% 6.52% 5.99% 0.73%$3K - $100K 4.28% 5.60% 1.42% 0.32% 7.47% 3.98% 5.63% 2.14% 2.43% 5.81% 5.73% 0.79%Contract VehiclesGSA Schedule 1.31% 1.57% 3.86% 0.99% 3.42% 3.74% 3.75% 4.93% 4.26% 4.45% 3.65% 2.31%IDIQs 12.72% 13.33% 5.20% 5.12% 18.72% 19.70% 13.13% 11.56% 27.99% 29.05% 10.68% 7.66%GSA STARS 0.11% 0.16% 0.00% 0.00% 0.10% 0.10% 0.63% 0.00% 0.07% 0.08% 0.26% 0.00%GSA VETS 0.04% 0.06% 0.00% 0.00% 0.02% 0.02% 0.00% 0.00% 0.01% 0.01% 0.00% 0.00%Top 5 NAICS FY09-FY10541611--Administrative Management and General Management Consulting Services 27.82% 26.47% 38.86% 5.70% 57.02% 55.66% 31.58% 56.67% 40.58% 41.03% 34.00% 40.72%541990--All Other Professional, Scientific, and Technical Services 8.17% 10.29% 1.79% 4.97% 50.00% 53.02% 31.25% 38.81% 51.40% 53.72% 22.22% 24.32%541690--Other Scientific and Technical Consulting Services 0.00% 24.98% 0.00% 12.44% 0.00% 55.42% 0.00% 50.00% 0.00% 54.70% 0.00% 55.56%541511--Custom Computer Programming Services 38.41% 36.65% 16.87% 39.21% 54.85% 58.13% 66.67% 40.00% 58.69% 57.11% 66.67% 33.33%541618--Other Management Consulting Services 29.87% 27.37% 10.95% 11.45% 57.62% 59.46% 25.00% 22.73% 50.90% 51.17% 27.27% 25.00%
Table 6.2: U.S. AGENCY FOR INTERNATIONAL DEVELOPMENT
Notes: Green/Red streetlights indicate whether agency did or did not meet SBA statutory dollar goal. A yellow background indicates conditions deteriorated year-over-year. A red box indicates lower shares than the corresponding, overall federal share.
Shares of Spending In . . . Shares of Companies In . . . Shares of Contract Transactions In . . .. . . Overall Federal Government . . . This Agency . . . Overall Federal Government . . . This Agency . . . Overall Federal Government . . . This Agency
Table 3.3 Analysis of Small Business Procurement Performance by the U.S. Agency for International Development

Characteristics of Recent Federal Small Business Contracting 27
Small Business Goal: 36.7111%
. . . And identified as: FY 2009 FY 2010 YTD FY 2009 FY 2010 YTD FY 2009 FY 2010 YTD FY 2009 FY 2010 YTD FY 2009 FY 2010 YTD FY 2009 FY 2010 YTDSocioeconomicSmall Businesses 21.28% 22.79% 30.55% 28.12% 81.62% 81.02% 56.44% 59.75% 50.04% 51.70% 47.41% 46.71%Small Disadv Businesses 6.84% 6.75% 13.37% 12.04% 5.47% 5.31% 14.69% 13.70% 7.86% 7.74% 16.02% 16.02%Woman-Owned Businesses 3.99% 4.48% 4.90% 5.79% 15.73% 16.06% 10.56% 13.42% 11.09% 11.48% 8.09% 9.67%HUBZone Businesses 2.75% 2.75% 3.60% 3.71% 3.12% 3.20% 2.31% 2.68% 3.36% 3.34% 4.58% 4.41%Svc Disabled Businesses 3.99% 4.48% 4.90% 5.79% 15.73% 16.06% 10.56% 13.42% 11.09% 11.48% 8.09% 9.67%CompanyNew SBs 9.71% 9.99% 8.11% 36.11% 24.47% 22.21% 8.48% 9.22% 7.09% 5.44% 4.61% 5.59%Lost SBs * 54.67% 30.44% 0.08% 0.02% 37.68% 3.28% 1.17% 0.24% 18.68% 7.89% 0.54% 0.33%Set-Aside ProgramsAll Set-Asides 10.34% 12.11% 14.53% 14.17% 39.40% 40.46% 17.66% 18.50% 13.52% 16.34% 14.80% 17.04%8(a) 7.97% 9.37% 33.32% 33.84% 6.71% 6.41% 9.90% 12.99% 5.32% 9.27% 11.14% 14.89%HUBZone 4.85% 6.26% 22.44% 23.81% 4.42% 4.08% 0.83% 4.24% 2.31% 6.18% 0.81% 3.66%Small Business 9.48% 12.14% 25.27% 26.82% 34.92% 37.37% 6.44% 11.72% 10.64% 16.95% 3.81% 7.88%SDB 4.23% 5.58% 0.00% 23.50% 3.53% 3.00% 0.00% 3.95% 1.97% 5.70% 0.00% 3.39%SDVOSB 4.87% 6.60% 22.92% 23.67% 5.23% 4.87% 2.15% 5.23% 2.52% 6.52% 1.48% 3.90%$3K - $100K 4.28% 5.60% 22.77% 23.53% 7.47% 3.98% 2.64% 4.24% 2.43% 5.81% 1.63% 3.66%Contract VehiclesGSA Schedule 1.31% 1.57% 7.90% 7.01% 3.42% 3.74% 16.50% 17.09% 4.26% 4.45% 12.05% 10.45%IDIQs 12.72% 13.33% 16.25% 15.72% 18.72% 19.70% 28.38% 28.39% 27.99% 29.05% 29.15% 27.37%GSA STARS 0.11% 0.16% 0.20% 0.47% 0.10% 0.10% 0.17% 0.28% 0.07% 0.08% 0.20% 0.43%GSA VETS 0.04% 0.06% 0.00% 0.00% 0.02% 0.02% 0.00% 0.00% 0.01% 0.01% 0.00% 0.00%Top 5 NAICS FY09-FY10541512--Computer Systems Design Services 23.22% 25.18% 10.44% 8.12% 56.03% 51.28% 77.78% 73.68% 49.07% 48.88% 66.67% 59.62%541519--Other Computer Related Services 47.03% 53.58% 66.18% 51.63% 61.83% 60.96% 75.00% 67.31% 58.57% 61.39% 64.11% 55.56%443120--Computer and Software Stores 31.74% 31.27% 13.60% 28.25% 66.67% 68.60% 64.52% 60.00% 33.06% 32.14% 18.18% 47.25%562211--Hazardous Waste Treatment and Disposal 3.84% 9.87% 0.00% 0.00% 63.46% 57.14% 0.00% 0.00% 66.70% 60.98% 0.00% 0.00%541990--All Other Professional, Scientific, and Technical Services 8.17% 10.29% 22.50% 14.52% 50.00% 53.02% 26.19% 46.43% 51.40% 53.72% 35.06% 32.00%Notes: Green/Red streetlights indicate whether agency did or did not meet SBA statutory dollar goal. A yellow background indicates conditions deteriorated year-over-year. A red box indicates lower shares than the corresponding, overall federal share.
Table 6.3: NUCLEAR REGULATORY COMMISSION
Shares of Spending In . . . Shares of Companies In . . . Shares of Contract Transactions In . . .. . . Overall Federal Government . . . This Agency . . . Overall Federal Government . . . This Agency . . . Overall Federal Government . . . This Agency
Table 3.4 Analysis of Small Business Procurement Performance by the Nuclear Regulatory Commission
Characteristics of Recent Federal Small Business Contracting 28
Conclusion
As the Army, USAID and NRC data demonstrate, each agency takes a unique path toward small business utilization, demonstrating different strengths and weaknesses. As small business officials meet to compare experiences they may want to consider questions like:
• What is driving the Army’s surge in spending with small firms as well as the increase in small firm utilization and contract transaction shares—all in the face of a relative decline in the year-over-year shares of new small business utilization?
• What are the causes of USAID’s and NRC’s recent drop in small business dollar share and how do they compare? Can the Army’s success in this category inform practices at USAID and NRC?
• Why is NRC’s share of dollars spent through socioeconomic set-aside programs so much higher than other agencies? Is it a question of traditional high usage of set-asides, recent staff training?
• What can Army learn from NRC’s success in attracting WOB vendors? • Given that NRC’s utilization of new, small businesses increased less than a
percentage point from FY 2009 to FY 2010, what is driving NRC’s four-fold increase in new small business spending?
• Why is USAID’s small business share of GSA Schedule contracts seven times higher than the Army’s? Is this helping or hindering small business goal achievement for USAID?
Comparing sets of standard, multi-dimensional procurement measures across agencies takes the analysis of small business utilization beyond simple goal assessment to actually uncovering reasons for over- and under-achievement. As reasons for differing levels of performance become clear agencies can take appropriate measures to address needed change in a timely manner as the year progresses and in the context of each agency’s available resources.

Characteristics of Recent Federal Small Business Contracting 29
Appendix A: Data Sources and Methodology
Data Sources for the Analysis
1. Federal Procurement Data System - Next Generation (FPDS-NG).
FPDS-NG is the federal government’s central repository for reports of agency prime contract actions. According to Federal Acquisition Regulations Part 4.601, contract actions are "any oral or written action that results in the purchase, rent, or lease of supplies or equipment, services, or construction using appropriated dollars over the micro-purchase threshold, or modifications to these actions regardless of dollar value. Contract action does not include grants, cooperative agreements, other transactions, real property leases, requisitions from Federal stock, training authorizations, or other non-FAR based transactions." All contract actions used in these reports were downloaded from the FPDS-NG web site at https://fpdsng.com/fpdsng_cms/index.php/archives.
To render the data in this study consistent with the way the U.S. Small Business Administration (SBA) analyzes its small business procurement goal achievements Eagle Eye applied the SBA’s Exclusions process to all spending data. The SBA’s Exclusion’s process excludes certain categories of spending from the overall universe of spending data against which small business procurement achievements are measured.
For further consistency with the SBA’s annual Goaling Report, Eagle Eye aggregated all agency spending by the funding agencies that pay for contracts, not the awarding agencies that administer them.1
Methodology for Chapter 1
To prepare the contracts data for analysis Eagle Eye created and calculated 10 measures of small business performance from the FPDS-NG FY 2009 data. These consist of the following:
1) Small business utilization intensity: the number of active, small businesses as a share of the total number of businesses actively contracting with an agency.
2) Small business births: the number of new small business as a share of total small businesses.
1 The excluded spend categories are listed at https://www.acquisition.gov/faqs_whataboutfpds.asp#q11 along with a discussion about usage of funding and awarding agencies in SBA goaling measures.

Characteristics of Recent Federal Small Business Contracting 30
3) Small business deaths: the number of small businesses that did not return from the prior year as a share of the number of small businesses in the prior year.
4) Agency small business market trends: the small business share of the services sector.
5) Agency small business market trends: the small business share of the manufacturing sector.
6) Contract size: the median and average contract size at each agency. 7) Transactions per contract: the median and average number of transactions per
contract. 8) Fixed price contracts: the median and average shares of fixed price contracts. 9) Set-aside contracts: the median and average shares of set-aside contracts. 10) Competitively awarded contracts: the median and average shares of
competitively awarded contracts.
Each of these measures was calculated for agencies overall and separately for over- and under-achieving agencies.
Methodology for Chapter 2
To perform this analysis of the American Recovery and Reinvestment Act data Eagle Eye extracted and analyzed all contract transaction records reported in the FPDS-NG database covering the entire period February 2009 through December 2010. Eagle Eye extracted all contract transaction records exhibiting an ARRA flag = True, and organized the analysis by agency, NAICS sector and individual NAICS market and company. We merged ARRA agency data with each agency’s SBA negotiated goal to identify ARRA spending by organizations that did and did not achieve overall small business goals through the ARRA program. All dollars are adjusted for SBA excluded categories.
Methodology for Chapter 3
For all cabinet level and major independent agencies Eagle Eye selected 23 key measures of small business procurement performance, listed here (also given in table 3.1):
Statutory Goal Categories Company Measures Contract Vehicles Set-Aside Programs Top 5 Agency NAICSAll Small Businesses New Small Bus GSA Schedule All Set-Asides NAICS 1
Small Disadvantaged Expired Small Bus IDIQs 8(a) NAICS 2
Woman-Owned GSA STARS HUBZone NAICS 3
HUBZone GSA VETS Small Business NAICS 4
Service-Disabled Small Disadv Bus NAICS 5
Service-Disabled
$3K-$100K Purch
Table A.1 Small Business Utilization Measures

Characteristics of Recent Federal Small Business Contracting 31
For every identified small business metric Eagle Eye extracted the necessary transactions from the FPDS-NG database to create static, government-wide and individual agency calculations for small business dollar, company and transaction shares from 2009 to FY 2010 year-to-date. Each agency table was conditionally formatted in Excel to graphically depict downward year-over-year trends in yellow shaded boxes in combination with red cell outlines depicting amounts that differed from corresponding overall government small business shares. Statutory goal formulas were merged into data cells for the Army, USAID and NRC Excel worksheets to create green and red streetlight icons depicting procurement goal achievement (Tables 3.2, 3.3 and 3.4). The other 27 agency tables in Appendix B only include the formulas depicting small business goal achievement.

Characteristics of Recent Federal Small Business Contracting 32
Appendix B: Additional Major Cabinet-Level and Independent Agency Small Business Procurement Trends
Small Business Goal: 22.2375%
FY 2009 FY 2010 YTD FY 2009 FY 2010 YTD FY 2009 FY 2010 YTD FY 2009 FY 2010 YTD FY 2009 FY 2010 YTD FY 2009 FY 2010 YTDSocioeconomicAll Small Businesses 21.28% 22.79% 18.33% 17.79% 81.62% 81.02% 77.34% 77.07% 50.04% 51.70% 56.37% 55.95%Small Disadv Businesses 6.84% 6.75% 6.92% 5.84% 5.47% 5.31% 10.76% 11.15% 7.86% 7.74% 14.62% 14.20%Woman-Owned Businesses 3.99% 4.48% 3.53% 3.93% 15.73% 16.06% 15.49% 15.80% 11.09% 11.48% 12.52% 12.33%HUBZone Businesses 2.75% 2.75% 2.43% 2.28% 3.12% 3.20% 5.27% 5.56% 3.36% 3.34% 5.32% 5.42%Svc Disabled Businesses 3.99% 4.48% 3.53% 3.93% 15.73% 16.06% 15.49% 15.80% 11.09% 11.48% 12.52% 12.33%CompanyNew SBs 9.71% 9.99% 3.05% 5.19% 24.47% 22.21% 14.92% 13.72% 7.09% 5.44% 3.70% 4.23%Lost SBs * 54.67% 30.44% 59.22% 4.00% 37.68% 3.28% 0.85% 0.48% 18.68% 7.89% 4.36% 0.69%Set-Aside ProgramsAll Set-Asides 10.34% 12.11% 11.68% 11.48% 39.40% 40.46% 49.23% 50.20% 13.52% 16.34% 26.43% 27.73%8(a) 7.97% 9.37% 6.23% 5.19% 6.71% 6.41% 11.09% 11.06% 5.32% 9.27% 12.62% 12.04%HUBZone 4.85% 6.26% 2.11% 1.80% 4.42% 4.08% 5.59% 5.17% 2.31% 6.18% 4.25% 4.30%Small Business 9.48% 12.14% 7.79% 7.90% 34.92% 37.37% 44.68% 44.41% 10.64% 16.95% 18.91% 20.16%SDB 4.23% 5.58% 0.00% 1.27% 3.53% 3.00% 0.00% 3.62% 1.97% 5.70% 0.00% 3.20%SDVOSB 4.87% 6.60% 1.88% 1.65% 5.23% 4.87% 6.06% 5.43% 2.52% 6.52% 4.04% 3.94%$3K - $100K 4.28% 5.60% 1.59% 1.27% 7.47% 3.98% 4.30% 3.62% 2.43% 5.81% 3.38% 3.20%Contract VehiclesGSA Schedule 1.31% 1.57% 1.13% 1.16% 3.42% 3.74% 7.26% 7.63% 4.26% 4.45% 4.56% 4.62%IDIQs 12.72% 13.33% 11.51% 11.13% 18.72% 19.70% 22.05% 22.94% 27.99% 29.05% 34.53% 34.63%GSA STARS 0.11% 0.16% 0.04% 0.00% 0.10% 0.10% 0.12% 0.11% 0.07% 0.08% 0.06% 0.05%GSA VETS 0.04% 0.06% 0.04% 0.07% 0.02% 0.02% 0.03% 0.05% 0.01% 0.01% 0.02% 0.03%Top 5 NAICS FY09-FY10336411--Aircraft Manufacturing 2.58% 2.96% 1.83% 2.03% 51.61% 54.55% 54.74% 53.79% 46.73% 43.73% 16.10% 14.30%541330--Engineering Services 15.77% 17.80% 7.32% 7.01% 54.39% 52.91% 47.52% 47.79% 33.33% 33.37% 24.08% 25.61%541710--Research and Development in the Physical, Engineering, and Life Sciences 11.38% 8.13% 19.72% 16.20% 48.94% 43.75% 63.87% 59.31% 33.23% 31.11% 40.21% 38.83%336413--Other Aircraft Parts and Auxiliary Equipment Manufacturing 23.28% 19.48% 16.86% 19.02% 51.35% 56.52% 70.75% 67.66% 40.84% 37.67% 44.98% 43.55%336414--Guided Missile and Space Vehicle Manufacturing 0.02% 0.08% 0.03% 0.03% 40.00% 54.55% 7.41% 12.90% 1.19% 2.09% 0.43% 1.02%Notes: Green/Red streetlights indicate whether agency did or did not meet SBA negotiated SB dollar goal. A yellow background indicates conditions deteriorated year-over-year. A red box indicates lower shares than the corresponding, overall federal share.
Table 6.4: DEPARTMENT OF DEFENSE - AIR FORCE
. . . Overall Federal Government . . . This Agency . . . Overall Federal Government . . . This AgencySmall Business Shares of Spending In . . . Small Business Shares of Companies In . . . Small Business Shares of Contract Transactions In . . .
. . . Overall Federal Government . . . This Agency
Table B.1 Small Business Procurement Performance, Department of Defense–Air Force

Characteristics of Recent Federal Small Business Contracting 33
Small Business Goal: 12.7964%
FY 2009 FY 2010 YTD FY 2009 FY 2010 YTD FY 2009 FY 2010 YTD FY 2009 FY 2010 YTD FY 2009 FY 2010 YTD FY 2009 FY 2010 YTDSocioeconomicAll Small Businesses 21.28% 22.79% 16.80% 18.01% 81.62% 81.02% 51.49% 54.81% 50.04% 51.70% 41.63% 47.34%Small Disadv Businesses 6.84% 6.75% 3.07% 4.78% 5.47% 5.31% 7.34% 8.50% 7.86% 7.74% 8.20% 11.03%Woman-Owned Businesses 3.99% 4.48% 5.47% 6.80% 15.73% 16.06% 16.70% 18.76% 11.09% 11.48% 15.75% 17.34%HUBZone Businesses 2.75% 2.75% 1.02% 0.96% 3.12% 3.20% 1.60% 1.66% 3.36% 3.34% 1.40% 2.08%Svc Disabled Businesses 3.99% 4.48% 5.47% 6.80% 15.73% 16.06% 16.70% 18.76% 11.09% 11.48% 15.75% 17.34%CompanyNew SBs 9.71% 9.99% 5.96% 6.08% 24.47% 22.21% 22.93% 17.71% 7.09% 5.44% 11.62% 8.75%Lost SBs * 54.67% 30.44% 0.53% 0.01% 37.68% 3.28% 3.10% 2.19% 18.68% 7.89% 1.63% 1.65%Set-Aside ProgramsAll Set-Asides 10.34% 12.11% 4.44% 5.08% 39.40% 40.46% 9.47% 13.12% 13.52% 16.34% 7.22% 10.97%8(a) 7.97% 9.37% 35.52% 31.38% 6.71% 6.41% 12.87% 13.68% 5.32% 9.27% 13.49% 15.08%HUBZone 4.85% 6.26% 34.05% 29.42% 4.42% 4.08% 9.36% 9.24% 2.31% 6.18% 10.20% 9.26%Small Business 9.48% 12.14% 36.47% 31.60% 34.92% 37.37% 13.30% 16.82% 10.64% 16.95% 13.41% 14.01%SDB 4.23% 5.58% 0.00% 29.11% 3.53% 3.00% 0.00% 9.15% 1.97% 5.70% 0.00% 9.18%SDVOSB 4.87% 6.60% 33.87% 29.11% 5.23% 4.87% 9.36% 9.24% 2.52% 6.52% 10.20% 9.21%$3K - $100K 4.28% 5.60% 33.89% 29.11% 7.47% 3.98% 10.32% 9.43% 2.43% 5.81% 10.73% 9.26%Contract VehiclesGSA Schedule 1.31% 1.57% 7.00% 7.27% 3.42% 3.74% 8.51% 10.54% 4.26% 4.45% 7.78% 10.25%IDIQs 12.72% 13.33% 12.09% 13.26% 18.72% 19.70% 15.96% 19.41% 27.99% 29.05% 19.91% 24.29%GSA STARS 0.11% 0.16% 0.09% 0.02% 0.10% 0.10% 0.11% 0.09% 0.07% 0.08% 0.11% 0.14%GSA VETS 0.04% 0.06% 0.00% 0.00% 0.02% 0.02% 0.00% 0.00% 0.01% 0.01% 0.00% 0.00%Top 5 NAICS FY09-FY10523999--Miscellaneous Financial Investment Activities 11.46% 26.28% 13.88% 16.57% 48.15% 40.74% 23.08% 21.43% 17.83% 15.62% 25.43% 22.17%423430--Computer and Computer Peripheral Equipment and Software Merchant Wholesalers 34.05% 42.70% 0.05% 2.41% 66.18% 60.13% 47.06% 62.50% 53.57% 56.99% 35.14% 45.45%611710--Educational Support Services 23.96% 27.62% 3.50% 12.05% 49.66% 49.32% 44.32% 47.21% 62.74% 68.48% 32.70% 33.57%541720--Research and Development in the Social Sciences and Humanities 7.84% 11.67% 8.97% 7.37% 51.26% 53.15% 50.00% 29.41% 49.18% 47.05% 24.00% 19.44%522390--Other Activities Related to Credit Intermediation 9.72% 2.74% 0.00% 0.00% 37.50% 36.36% 0.00% 0.00% 34.69% 26.56% 0.00% 0.00%Notes: Green/Red streetlights indicate whether agency did or did not meet SBA negotiated SB dollar goal. A yellow background indicates conditions deteriorated year-over-year. A red box indicates lower shares than the corresponding, overall federal share.
Table 6.5: DEPARTMENT OF EDUCATION
Small Business Shares of Spending In . . . Small Business Shares of Companies In . . . Small Business Shares of Contract Transactions In . . .. . . Overall Federal Government . . . This Agency . . . Overall Federal Government . . . This Agency . . . Overall Federal Government . . . This Agency
Table B.2 Small Business Procurement Performance, Department of Education

Characteristics of Recent Federal Small Business Contracting 34
Small Business Goal: 31.9000%
FY 2009 FY 2010 YTD FY 2009 FY 2010 YTD FY 2009 FY 2010 YTD FY 2009 FY 2010 YTD FY 2009 FY 2010 YTD FY 2009 FY 2010 YTDSocioeconomicAll Small Businesses 21.28% 22.79% 34.16% 32.66% 81.62% 81.02% 65.59% 75.62% 50.04% 51.70% 45.23% 57.44%Small Disadv Businesses 6.84% 6.75% 16.87% 12.32% 5.47% 5.31% 11.06% 7.79% 7.86% 7.74% 11.06% 11.11%Woman-Owned Businesses 3.99% 4.48% 12.07% 9.34% 15.73% 16.06% 14.72% 14.48% 11.09% 11.48% 11.53% 12.67%HUBZone Businesses 2.75% 2.75% 2.95% 4.06% 3.12% 3.20% 3.91% 3.64% 3.36% 3.34% 4.93% 5.13%Svc Disabled Businesses 3.99% 4.48% 12.07% 9.34% 15.73% 16.06% 14.72% 14.48% 11.09% 11.48% 11.53% 12.67%CompanyNew SBs 9.71% 9.99% 4.60% 7.12% 24.47% 22.21% 12.06% 17.02% 7.09% 5.44% 6.23% 8.66%Lost SBs * 54.67% 30.44% 5.95% 0.37% 37.68% 3.28% 1.03% 0.66% 18.68% 7.89% 3.99% 1.12%Set-Aside ProgramsAll Set-Asides 10.34% 12.11% 7.54% 17.14% 39.40% 40.46% 22.09% 26.63% 13.52% 16.34% 12.89% 20.68%8(a) 7.97% 9.37% 8.05% 10.72% 6.71% 6.41% 6.39% 7.30% 5.32% 9.27% 5.79% 6.53%HUBZone 4.85% 6.26% 3.23% 7.06% 4.42% 4.08% 2.44% 4.00% 2.31% 6.18% 1.87% 3.50%Small Business 9.48% 12.14% 5.58% 14.73% 34.92% 37.37% 15.31% 23.82% 10.64% 16.95% 8.19% 17.67%SDB 4.23% 5.58% 0.00% 5.60% 3.53% 3.00% 0.00% 3.13% 1.97% 5.70% 0.00% 2.63%SDVOSB 4.87% 6.60% 3.40% 6.96% 5.23% 4.87% 2.73% 4.18% 2.52% 6.52% 1.86% 3.36%$3K - $100K 4.28% 5.60% 3.30% 5.67% 7.47% 3.98% 5.05% 3.59% 2.43% 5.81% 3.12% 2.75%Contract VehiclesGSA Schedule 1.31% 1.57% 1.70% 2.77% 3.42% 3.74% 6.94% 8.40% 4.26% 4.45% 2.74% 5.26%IDIQs 12.72% 13.33% 20.01% 23.07% 18.72% 19.70% 25.87% 22.12% 27.99% 29.05% 24.92% 28.17%GSA STARS 0.11% 0.16% 0.11% 0.15% 0.10% 0.10% 0.21% 0.11% 0.07% 0.08% 0.10% 0.05%GSA VETS 0.04% 0.06% 0.27% 0.04% 0.02% 0.02% 0.04% 0.01% 0.01% 0.01% 0.01% 0.00%Top 5 NAICS FY09-FY10541611--Administrative Management and General Management Consulting Services 27.82% 26.47% 32.41% 32.43% 57.02% 55.66% 43.88% 56.43% 40.58% 41.03% 35.85% 34.79%561612--Security Guards and Patrol Services 31.91% 33.96% 11.00% 26.38% 65.88% 63.04% 67.86% 59.62% 40.70% 40.97% 29.07% 37.83%ripken&R08 47.03% 53.58% 83.27% 79.52% 61.83% 60.96% 63.86% 73.38% 58.57% 61.39% 64.81% 83.91%541330--Engineering Services 15.77% 17.80% 28.57% 14.95% 54.39% 52.91% 38.03% 44.30% 33.33% 33.37% 30.45% 26.09%541513--Computer Facilities Management Services 34.75% 31.55% 10.91% 5.09% 62.84% 65.58% 41.18% 67.27% 58.18% 54.98% 33.33% 19.06%Notes: Green/Red streetlights indicate whether agency did or did not meet SBA negotiated SB dollar goal. A yellow background indicates conditions deteriorated year-over-year. A red box indicates lower shares than the corresponding, overall federal share.
Table 6.6: DEPARTMENT OF HOMELAND SECURITY
Small Business Shares of Spending In . . . Small Business Shares of Companies In . . . Small Business Shares of Contract Transactions In . . .. . . Overall Federal Government . . . This Agency . . . Overall Federal Government . . . This Agency . . . Overall Federal Government . . . This Agency
Table B.3 Small Business Procurement Performance, Department of Homeland Security

Characteristics of Recent Federal Small Business Contracting 35
Small Business Goal: 50.7903%
FY 2009 FY 2010 YTD FY 2009 FY 2010 YTD FY 2009 FY 2010 YTD FY 2009 FY 2010 YTD FY 2009 FY 2010 YTD FY 2009 FY 2010 YTDSocioeconomicAll Small Businesses 21.28% 22.79% 31.05% 34.58% 81.62% 81.02% 64.23% 73.65% 50.04% 51.70% 60.56% 61.53%Small Disadv Businesses 6.84% 6.75% 11.72% 12.52% 5.47% 5.31% 12.50% 7.27% 7.86% 7.74% 24.06% 15.35%Woman-Owned Businesses 3.99% 4.48% 4.45% 9.00% 15.73% 16.06% 12.87% 13.65% 11.09% 11.48% 20.11% 14.06%HUBZone Businesses 2.75% 2.75% 0.90% 1.30% 3.12% 3.20% 2.10% 1.54% 3.36% 3.34% 2.93% 2.63%Svc Disabled Businesses 3.99% 4.48% 4.45% 9.00% 15.73% 16.06% 12.87% 13.65% 11.09% 11.48% 20.11% 14.06%CompanyNew SBs 9.71% 9.99% 10.43% 8.98% 24.47% 22.21% 11.56% 16.40% 7.09% 5.44% 8.10% 8.73%Lost SBs * 54.67% 30.44% 0.04% 0.10% 37.68% 3.28% 0.58% 0.57% 18.68% 7.89% 0.40% 0.34%Set-Aside ProgramsAll Set-Asides 10.34% 12.11% 13.48% 17.10% 39.40% 40.46% 16.46% 31.48% 13.52% 16.34% 20.65% 24.64%8(a) 7.97% 9.37% 25.89% 7.45% 6.71% 6.41% 6.68% 6.95% 5.32% 9.27% 15.50% 9.68%HUBZone 4.85% 6.26% 21.47% 1.60% 4.42% 4.08% 1.86% 3.17% 2.31% 6.18% 1.62% 2.83%Small Business 9.48% 12.14% 30.27% 11.90% 34.92% 37.37% 9.41% 28.94% 10.64% 16.95% 6.04% 19.38%SDB 4.23% 5.58% 0.00% 1.52% 3.53% 3.00% 0.00% 3.09% 1.97% 5.70% 0.00% 2.77%SDVOSB 4.87% 6.60% 21.47% 2.04% 5.23% 4.87% 1.98% 3.39% 2.52% 6.52% 1.68% 3.08%$3K - $100K 4.28% 5.60% 21.73% 1.72% 7.47% 3.98% 6.06% 5.01% 2.43% 5.81% 3.89% 3.51%Contract VehiclesGSA Schedule 1.31% 1.57% 3.83% 4.93% 3.42% 3.74% 10.89% 8.14% 4.26% 4.45% 7.90% 9.19%IDIQs 12.72% 13.33% 16.98% 21.32% 18.72% 19.70% 24.88% 16.84% 27.99% 29.05% 31.00% 27.97%GSA STARS 0.11% 0.16% 1.12% 0.76% 0.10% 0.10% 1.36% 0.35% 0.07% 0.08% 1.44% 0.59%GSA VETS 0.04% 0.06% 0.00% 0.30% 0.02% 0.02% 0.00% 0.02% 0.01% 0.01% 0.00% 0.08%Top 5 NAICS FY09-FY10541512--Computer Systems Design Services 23.22% 25.18% 3.87% 6.49% 56.03% 51.28% 53.33% 78.31% 49.07% 48.88% 47.06% 68.08%541519--Other Computer Related Services 47.03% 53.58% 83.63% 66.47% 61.83% 60.96% 67.19% 76.90% 58.57% 61.39% 68.46% 58.82%541810--Advertising Agencies 17.81% 9.86% 0.00% 0.28% 53.97% 54.55% 0.00% 25.00% 23.53% 31.16% 0.00% 3.39%236220--Commercial and Institutional Building Construction 35.67% 41.24% 82.15% 27.47% 63.06% 62.39% 93.75% 89.61% 77.41% 75.06% 66.07% 88.70%541511--Custom Computer Programming Services 38.41% 36.65% 91.90% 54.92% 54.85% 58.13% 89.19% 77.40% 58.69% 57.11% 93.22% 63.48%Notes: Green/Red streetlights indicate whether agency did or did not meet SBA negotiated SB dollar goal. A yellow background indicates conditions deteriorated year-over-year. A red box indicates lower shares than the corresponding, overall federal share.
Table 6.7: DEPARTMENT OF COMMERCE
Small Business Shares of Spending In . . . Small Business Shares of Companies In . . . Small Business Shares of Contract Transactions In . . .. . . Overall Federal Government . . . This Agency . . . Overall Federal Government . . . This Agency . . . Overall Federal Government . . . This Agency
Table B.4 Small Business Procurement Performance, Department of Commerce

Characteristics of Recent Federal Small Business Contracting 36
Small Business Goal: 22.2375%
FY 2009 FY 2010 YTD FY 2009 FY 2010 YTD FY 2009 FY 2010 YTD FY 2009 FY 2010 YTD FY 2009 FY 2010 YTD FY 2009 FY 2010 YTDSocioeconomicAll Small Businesses 21.28% 22.79% 24.22% 25.92% 81.62% 81.02% 77.38% 77.62% 50.04% 51.70% 40.30% 38.17%Small Disadv Businesses 6.84% 6.75% 4.62% 4.55% 5.47% 5.31% 7.78% 8.21% 7.86% 7.74% 3.07% 3.11%Woman-Owned Businesses 3.99% 4.48% 3.66% 3.78% 15.73% 16.06% 14.99% 15.82% 11.09% 11.48% 8.46% 8.50%HUBZone Businesses 2.75% 2.75% 3.18% 1.73% 3.12% 3.20% 4.03% 4.03% 3.36% 3.34% 2.03% 1.59%Svc Disabled Businesses 3.99% 4.48% 3.66% 3.78% 15.73% 16.06% 14.99% 15.82% 11.09% 11.48% 8.46% 8.50%CompanyNew SBs 9.71% 9.99% 7.90% 6.86% 24.47% 22.21% 10.00% 9.41% 7.09% 5.44% 2.39% 3.23%Lost SBs * 54.67% 30.44% 6.14% 2.90% 37.68% 3.28% 1.04% 0.50% 18.68% 7.89% 1.11% 0.58%Set-Aside ProgramsAll Set-Asides 10.34% 12.11% 11.02% 12.43% 39.40% 40.46% 41.38% 44.26% 13.52% 16.34% 11.01% 12.19%8(a) 7.97% 9.37% 4.31% 3.93% 6.71% 6.41% 9.21% 7.67% 5.32% 9.27% 2.92% 2.56%HUBZone 4.85% 6.26% 2.25% 2.12% 4.42% 4.08% 6.09% 4.33% 2.31% 6.18% 2.12% 1.76%Small Business 9.48% 12.14% 10.52% 11.87% 34.92% 37.37% 40.94% 42.29% 10.64% 16.95% 11.94% 12.58%SDB 4.23% 5.58% 0.00% 1.95% 3.53% 3.00% 0.00% 3.45% 1.97% 5.70% 0.00% 1.63%SDVOSB 4.87% 6.60% 2.56% 2.31% 5.23% 4.87% 6.45% 4.59% 2.52% 6.52% 2.17% 1.79%$3K - $100K 4.28% 5.60% 2.16% 1.95% 7.47% 3.98% 5.54% 3.45% 2.43% 5.81% 2.04% 1.63%Contract VehiclesGSA Schedule 1.31% 1.57% 1.16% 1.18% 3.42% 3.74% 5.89% 5.98% 4.26% 4.45% 0.84% 0.73%IDIQs 12.72% 13.33% 16.12% 16.76% 18.72% 19.70% 28.38% 28.48% 27.99% 29.05% 15.52% 14.63%GSA STARS 0.11% 0.16% 0.13% 0.18% 0.10% 0.10% 0.31% 0.36% 0.07% 0.08% 0.05% 0.05%GSA VETS 0.04% 0.06% 0.07% 0.05% 0.02% 0.02% 0.03% 0.04% 0.01% 0.01% 0.00% 0.01%Top 5 NAICS FY09-FY10324110--Petroleum Refineries 16.60% 12.66% 17.20% 12.57% 64.86% 55.88% 29.73% 31.25% 59.54% 69.94% 30.10% 32.54%541712--Research and Development in the Physical, Engineering, and Life Sciences (Except Biotechnology) 31.49% 28.79% 14.35% 14.07% 52.43% 48.15% 71.79% 68.04% 61.94% 59.45% 46.67% 39.40%424210--Drugs and Druggists' Sundries Merchant Wholesalers 0.66% 0.90% 1.29% 1.16% 51.72% 54.29% 65.05% 75.36% 3.01% 3.86% 2.74% 2.53%541710--Research and Development in the Physical, Engineering, and Life Sciences 11.38% 8.13% 3.96% 3.89% 48.94% 43.75% 55.22% 47.88% 33.23% 31.11% 11.40% 9.19%336413--Other Aircraft Parts and Auxiliary Equipment Manufacturing 23.28% 19.48% 34.80% 38.99% 51.35% 56.52% 79.67% 81.10% 40.84% 37.67% 40.12% 34.33%Notes: Green/Red streetlights indicate whether agency did or did not meet SBA negotiated SB dollar goal. A yellow background indicates conditions deteriorated year-over-year. A red box indicates lower shares than the corresponding, overall federal share.
Table 6.8: DEPARTMENT OF DEFENSE - OTHER
Small Business Shares of Spending In . . . Small Business Shares of Companies In . . . Small Business Shares of Contract Transactions In . . .. . . Overall Federal Government . . . This Agency . . . Overall Federal Government . . . This Agency . . . Overall Federal Government . . . This Agency
Table B.5 Small Business Procurement Performance, Department of Defense–Other

Characteristics of Recent Federal Small Business Contracting 37
Small Business Goal: 5.8700%
FY 2009 FY 2010 YTD FY 2009 FY 2010 YTD FY 2009 FY 2010 YTD FY 2009 FY 2010 YTD FY 2009 FY 2010 YTD FY 2009 FY 2010 YTDSocioeconomicAll Small Businesses 21.28% 22.79% 2.49% 9.15% 81.62% 81.02% 61.77% 68.90% 50.04% 51.70% 49.21% 55.15%Small Disadv Businesses 6.84% 6.75% 0.80% 3.36% 5.47% 5.31% 9.39% 12.16% 7.86% 7.74% 12.71% 16.88%Woman-Owned Businesses 3.99% 4.48% 0.34% 1.44% 15.73% 16.06% 10.83% 13.81% 11.09% 11.48% 12.74% 14.19%HUBZone Businesses 2.75% 2.75% 0.09% 0.85% 3.12% 3.20% 2.32% 3.51% 3.36% 3.34% 2.75% 3.69%Svc Disabled Businesses 3.99% 4.48% 0.34% 1.44% 15.73% 16.06% 10.83% 13.81% 11.09% 11.48% 12.74% 14.19%CompanyNew SBs 9.71% 9.99% 2.24% 12.74% 24.47% 22.21% 7.16% 11.90% 7.09% 5.44% 4.38% 6.27%Lost SBs * 54.67% 30.44% -0.30% 0.10% 37.68% 3.28% 0.54% 0.82% 18.68% 7.89% 0.22% 0.50%Set-Aside ProgramsAll Set-Asides 10.34% 12.11% 0.54% 4.64% 39.40% 40.46% 24.20% 27.91% 13.52% 16.34% 21.04% 23.53%8(a) 7.97% 9.37% 43.15% 33.88% 6.71% 6.41% 19.67% 14.70% 5.32% 9.27% 24.96% 17.43%HUBZone 4.85% 6.26% 42.80% 32.13% 4.42% 4.08% 14.48% 7.79% 2.31% 6.18% 17.72% 8.04%Small Business 9.48% 12.14% 42.99% 34.78% 34.92% 37.37% 31.16% 26.41% 10.64% 16.95% 30.43% 20.96%SDB 4.23% 5.58% 0.00% 32.09% 3.53% 3.00% 0.00% 7.35% 1.97% 5.70% 0.00% 7.79%SDVOSB 4.87% 6.60% 42.80% 32.11% 5.23% 4.87% 14.70% 7.84% 2.52% 6.52% 17.90% 8.00%$3K - $100K 4.28% 5.60% 42.80% 32.20% 7.47% 3.98% 16.24% 7.84% 2.43% 5.81% 18.43% 7.98%Contract VehiclesGSA Schedule 1.31% 1.57% 0.06% 0.49% 3.42% 3.74% 7.96% 7.71% 4.26% 4.45% 4.41% 4.54%IDIQs 12.72% 13.33% 0.64% 4.77% 18.72% 19.70% 17.90% 18.82% 27.99% 29.05% 19.31% 27.05%GSA STARS 0.11% 0.16% 0.00% 0.01% 0.10% 0.10% 0.00% 0.12% 0.07% 0.08% 0.00% 0.06%GSA VETS 0.04% 0.06% 0.00% 0.02% 0.02% 0.02% 0.00% 0.04% 0.01% 0.01% 0.00% 0.04%Top 5 NAICS FY09-FY10561210--Facilities Support Services 16.10% 16.27% 9.37% 2.84% 60.84% 58.74% 57.14% 58.18% 61.76% 60.35% 39.66% 32.67%541710--Research and Development in the Physical, Engineering, and Life Sciences 11.38% 8.13% 0.00% 0.03% 48.94% 43.75% 0.00% 31.03% 33.23% 31.11% 0.00% 2.17%562910--Remediation Services 29.73% 46.43% 1.39% 27.62% 57.83% 60.76% 41.67% 67.35% 65.06% 67.38% 8.33% 48.18%541990--All Other Professional, Scientific, and Technical Services 8.17% 10.29% 0.42% 0.35% 50.00% 53.02% 63.64% 52.38% 51.40% 53.72% 52.94% 26.09%562211--Hazardous Waste Treatment and Disposal 3.84% 9.87% 2.57% 14.89% 63.46% 57.14% 25.00% 30.77% 66.70% 60.98% 10.53% 15.69%Notes: Green/Red streetlights indicate whether agency did or did not meet SBA negotiated SB dollar goal. A yellow background indicates conditions deteriorated year-over-year. A red box indicates lower shares than the corresponding, overall federal share.
Table 6.9: DEPARTMENT OF ENERGY
Small Business Shares of Spending In . . . Small Business Shares of Companies In . . . Small Business Shares of Contract Transactions In . . .. . . Overall Federal Government . . . This Agency . . . Overall Federal Government . . . This Agency . . . Overall Federal Government . . . This Agency
Table B.6 Small Business Procurement Performance, Department of Energy

Characteristics of Recent Federal Small Business Contracting 38
Small Business Goal: 55.4888%
FY 2009 FY 2010 YTD FY 2009 FY 2010 YTD FY 2009 FY 2010 YTD FY 2009 FY 2010 YTD FY 2009 FY 2010 YTD FY 2009 FY 2010 YTDSocioeconomicAll Small Businesses 21.28% 22.79% 53.90% 48.13% 81.62% 81.02% 67.15% 78.54% 50.04% 51.70% 58.47% 62.82%Small Disadv Businesses 6.84% 6.75% 27.45% 17.55% 5.47% 5.31% 12.56% 5.73% 7.86% 7.74% 15.05% 9.25%Woman-Owned Businesses 3.99% 4.48% 7.88% 12.95% 15.73% 16.06% 15.14% 14.88% 11.09% 11.48% 14.15% 13.23%HUBZone Businesses 2.75% 2.75% 8.37% 11.16% 3.12% 3.20% 5.56% 4.25% 3.36% 3.34% 4.97% 4.90%Svc Disabled Businesses 3.99% 4.48% 7.88% 12.95% 15.73% 16.06% 15.14% 14.88% 11.09% 11.48% 14.15% 13.23%CompanyNew SBs 9.71% 9.99% 4.04% 21.85% 24.47% 22.21% 12.83% 23.81% 7.09% 5.44% 8.06% 13.99%Lost SBs * 54.67% 30.44% 0.83% 0.16% 37.68% 3.28% 1.68% 0.58% 18.68% 7.89% 1.86% 0.42%Set-Aside ProgramsAll Set-Asides 10.34% 12.11% 24.85% 26.45% 39.40% 40.46% 25.76% 36.27% 13.52% 16.34% 21.51% 25.96%8(a) 7.97% 9.37% 35.51% 13.85% 6.71% 6.41% 16.59% 6.59% 5.32% 9.27% 15.38% 7.55%HUBZone 4.85% 6.26% 20.43% 5.96% 4.42% 4.08% 11.27% 3.85% 2.31% 6.18% 8.16% 3.01%Small Business 9.48% 12.14% 24.30% 12.20% 34.92% 37.37% 25.44% 32.65% 10.64% 16.95% 18.90% 20.52%SDB 4.23% 5.58% 0.00% 2.20% 3.53% 3.00% 0.00% 2.95% 1.97% 5.70% 0.00% 2.27%SDVOSB 4.87% 6.60% 19.08% 2.80% 5.23% 4.87% 10.87% 3.64% 2.52% 6.52% 8.05% 2.72%$3K - $100K 4.28% 5.60% 18.89% 2.23% 7.47% 3.98% 12.88% 4.06% 2.43% 5.81% 8.96% 2.71%Contract VehiclesGSA Schedule 1.31% 1.57% 9.22% 3.70% 3.42% 3.74% 7.57% 5.17% 4.26% 4.45% 6.09% 5.43%IDIQs 12.72% 13.33% 29.42% 18.18% 18.72% 19.70% 23.51% 15.31% 27.99% 29.05% 27.06% 23.40%GSA STARS 0.11% 0.16% 2.41% 0.38% 0.10% 0.10% 0.48% 0.09% 0.07% 0.08% 1.12% 0.14%GSA VETS 0.04% 0.06% 0.00% 0.00% 0.02% 0.02% 0.00% 0.00% 0.01% 0.01% 0.00% 0.00%Top 5 NAICS FY09-FY10237990--Other Heavy and Civil Engineering Construction 32.16% 32.44% 72.33% 37.72% 62.75% 57.89% 80.00% 87.61% 74.84% 76.81% 65.85% 83.33%236220--Commercial and Institutional Building Construction 35.67% 41.24% 46.56% 51.62% 63.06% 62.39% 70.83% 85.42% 77.41% 75.06% 72.09% 78.82%
-- 0.00% 6.11% 0.00% 0.00% 0.00% 59.09% 0.00% 0.00% 0.00% 52.49% 0.00% 0.00%541519--Other Computer Related Services 47.03% 53.58% 49.56% 45.27% 61.83% 60.96% 60.00% 71.75% 58.57% 61.39% 55.50% 59.92%541330--Engineering Services 15.77% 17.80% -2.11% 17.18% 54.39% 52.91% 25.00% 57.89% 33.33% 33.37% 28.57% 33.24%Notes: Green/Red streetlights indicate whether agency did or did not meet SBA negotiated SB dollar goal. A yellow background indicates conditions deteriorated year-over-year. A red box indicates lower shares than the corresponding, overall federal share.
Table 6.10: DEPARTMENT OF THE INTERIOR
Small Business Shares of Spending In . . . Small Business Shares of Companies In . . . Small Business Shares of Contract Transactions In . . .. . . Overall Federal Government . . . This Agency . . . Overall Federal Government . . . This Agency . . . Overall Federal Government . . . This Agency
Table B.7 Small Business Procurement Performance, Department of Interior

Characteristics of Recent Federal Small Business Contracting 39
Small Business Goal: 36.8125%
FY 2009 FY 2010 YTD FY 2009 FY 2010 YTD FY 2009 FY 2010 YTD FY 2009 FY 2010 YTD FY 2009 FY 2010 YTD FY 2009 FY 2010 YTDSocioeconomicAll Small Businesses 21.28% 22.79% 12.44% 30.11% 81.62% 81.02% 61.04% 69.38% 50.04% 51.70% 32.21% 49.29%Small Disadv Businesses 6.84% 6.75% 4.93% 7.64% 5.47% 5.31% 11.24% 4.61% 7.86% 7.74% 4.71% 4.40%Woman-Owned Businesses 3.99% 4.48% 3.15% 7.77% 15.73% 16.06% 16.60% 12.68% 11.09% 11.48% 9.85% 9.93%HUBZone Businesses 2.75% 2.75% 0.49% 0.72% 3.12% 3.20% 3.21% 1.64% 3.36% 3.34% 1.93% 0.86%Svc Disabled Businesses 3.99% 4.48% 3.15% 7.77% 15.73% 16.06% 16.60% 12.68% 11.09% 11.48% 9.85% 9.93%CompanyNew SBs 9.71% 9.99% 1.97% 10.03% 24.47% 22.21% 9.43% 20.73% 7.09% 5.44% 5.24% 11.86%Lost SBs * 54.67% 30.44% 0.04% 0.49% 37.68% 3.28% 1.75% 0.91% 18.68% 7.89% 4.24% 0.54%Set-Aside ProgramsAll Set-Asides 10.34% 12.11% 3.87% 10.03% 39.40% 40.46% 17.54% 26.08% 13.52% 16.34% 6.61% 18.18%8(a) 7.97% 9.37% 13.26% 12.27% 6.71% 6.41% 11.51% 5.79% 5.32% 9.27% 12.80% 12.34%HUBZone 4.85% 6.26% 10.37% 8.71% 4.42% 4.08% 7.10% 3.92% 2.31% 6.18% 11.08% 11.29%Small Business 9.48% 12.14% 11.35% 14.90% 34.92% 37.37% 19.14% 26.96% 10.64% 16.95% 15.72% 27.86%SDB 4.23% 5.58% 0.00% 8.67% 3.53% 3.00% 0.00% 3.84% 1.97% 5.70% 0.00% 11.26%SDVOSB 4.87% 6.60% 10.36% 8.75% 5.23% 4.87% 7.50% 4.14% 2.52% 6.52% 11.19% 11.57%$3K - $100K 4.28% 5.60% 10.36% 8.71% 7.47% 3.98% 7.76% 4.26% 2.43% 5.81% 11.24% 11.40%Contract VehiclesGSA Schedule 1.31% 1.57% 1.82% 5.13% 3.42% 3.74% 7.90% 7.12% 4.26% 4.45% 2.12% 2.84%IDIQs 12.72% 13.33% 10.12% 18.83% 18.72% 19.70% 32.66% 23.47% 27.99% 29.05% 20.27% 27.03%GSA STARS 0.11% 0.16% 0.26% 0.64% 0.10% 0.10% 1.47% 0.28% 0.07% 0.08% 0.43% 0.13%GSA VETS 0.04% 0.06% 0.00% 0.03% 0.02% 0.02% 0.00% 0.01% 0.01% 0.01% 0.00% 0.00%Top 5 NAICS FY09-FY10541519--Other Computer Related Services 47.03% 53.58% 89.12% 42.94% 61.83% 60.96% 63.89% 65.60% 58.57% 61.39% 57.14% 50.23%541512--Computer Systems Design Services 23.22% 25.18% 38.83% 19.28% 56.03% 51.28% 62.50% 59.38% 49.07% 48.88% 80.43% 54.34%541199--All Other Legal Services 18.26% 36.08% 35.34% 42.92% 61.25% 62.50% 42.86% 65.38% 49.78% 44.05% 68.25% 40.84%561210--Facilities Support Services 16.10% 16.27% 22.28% 4.15% 60.84% 58.74% 50.00% 55.00% 61.76% 60.35% 26.67% 62.50%236220--Commercial and Institutional Building Construction 35.67% 41.24% 86.22% 14.72% 63.06% 62.39% 85.37% 78.40% 77.41% 75.06% 84.07% 79.65%Notes: Green/Red streetlights indicate whether agency did or did not meet SBA negotiated SB dollar goal. A yellow background indicates conditions deteriorated year-over-year. A red box indicates lower shares than the corresponding, overall federal share.
Table 6.11: DEPARTMENT OF JUSTICE
Small Business Shares of Spending In . . . Small Business Shares of Companies In . . . Small Business Shares of Contract Transactions In . . .. . . Overall Federal Government . . . This Agency . . . Overall Federal Government . . . This Agency . . . Overall Federal Government . . . This Agency
Table B.8 Small Business Procurement Performance, Department of Justice

Characteristics of Recent Federal Small Business Contracting 40
Small Business Goal: 39.8129%
FY 2009 FY 2010 YTD FY 2009 FY 2010 YTD FY 2009 FY 2010 YTD FY 2009 FY 2010 YTD FY 2009 FY 2010 YTD FY 2009 FY 2010 YTDSocioeconomicAll Small Businesses 21.28% 22.79% 52.63% 44.40% 81.62% 81.02% 60.39% 67.09% 50.04% 51.70% 47.52% 49.05%Small Disadv Businesses 6.84% 6.75% 8.73% 10.80% 5.47% 5.31% 4.66% 7.42% 7.86% 7.74% 4.48% 9.64%Woman-Owned Businesses 3.99% 4.48% 4.28% 5.55% 15.73% 16.06% 13.75% 15.24% 11.09% 11.48% 10.59% 9.96%HUBZone Businesses 2.75% 2.75% 0.62% 0.82% 3.12% 3.20% 1.25% 2.09% 3.36% 3.34% 1.21% 1.96%Svc Disabled Businesses 3.99% 4.48% 4.28% 5.55% 15.73% 16.06% 13.75% 15.24% 11.09% 11.48% 10.59% 9.96%CompanyNew SBs 9.71% 9.99% 3.89% 7.19% 24.47% 22.21% 24.91% 22.83% 7.09% 5.44% 18.27% 10.65%Lost SBs * 54.67% 30.44% 2.91% 0.05% 37.68% 3.28% 2.49% 0.79% 18.68% 7.89% 3.17% 0.36%Set-Aside ProgramsAll Set-Asides 10.34% 12.11% 38.55% 29.54% 39.40% 40.46% 9.74% 15.56% 13.52% 16.34% 6.45% 14.54%8(a) 7.97% 9.37% 13.90% 10.03% 6.71% 6.41% 1.36% 7.32% 5.32% 9.27% 1.00% 6.73%HUBZone 4.85% 6.26% 12.67% 3.46% 4.42% 4.08% 0.50% 4.12% 2.31% 6.18% 0.40% 3.07%Small Business 9.48% 12.14% 45.63% 24.44% 34.92% 37.37% 3.55% 13.50% 10.64% 16.95% 3.00% 12.32%SDB 4.23% 5.58% 0.00% 3.36% 3.53% 3.00% 0.00% 3.94% 1.97% 5.70% 0.00% 2.91%SDVOSB 4.87% 6.60% 14.80% 5.01% 5.23% 4.87% 0.54% 4.83% 2.52% 6.52% 0.42% 3.66%$3K - $100K 4.28% 5.60% 12.97% 3.43% 7.47% 3.98% 5.91% 5.23% 2.43% 5.81% 3.06% 3.27%Contract VehiclesGSA Schedule 1.31% 1.57% 3.98% 2.88% 3.42% 3.74% 7.99% 8.37% 4.26% 4.45% 6.66% 4.42%IDIQs 12.72% 13.33% 41.79% 32.47% 18.72% 19.70% 13.86% 16.30% 27.99% 29.05% 13.96% 25.90%GSA STARS 0.11% 0.16% 1.33% 0.91% 0.10% 0.10% 0.14% 0.48% 0.07% 0.08% 0.39% 0.46%GSA VETS 0.04% 0.06% 0.00% 0.67% 0.02% 0.02% 0.00% 0.03% 0.01% 0.01% 0.00% 0.07%Top 5 NAICS FY09-FY10562910--Remediation Services 29.73% 46.43% 70.65% 59.78% 57.83% 60.76% 63.64% 62.11% 65.06% 67.38% 69.40% 65.02%541620--Environmental Consulting Services 39.29% 37.59% 12.24% 22.47% 53.98% 60.00% 63.93% 78.03% 46.95% 51.31% 48.03% 41.94%541512--Computer Systems Design Services 23.22% 25.18% 27.82% 12.10% 56.03% 51.28% 66.67% 66.67% 49.07% 48.88% 55.56% 34.13% Management and General Management Consulting 27.82% 26.47% 65.34% 28.60% 57.02% 55.66% 62.71% 61.82% 40.58% 41.03% 44.44% 42.36%
541519--Other Computer Related Services 47.03% 53.58% 57.97% 40.16% 61.83% 60.96% 69.70% 69.70% 58.57% 61.39% 62.06% 54.63%Notes: Green/Red streetlights indicate whether agency did or did not meet SBA negotiated SB dollar goal. A yellow background indicates conditions deteriorated year-over-year. A red box indicates lower shares than the corresponding, overall federal share.
Table 6.12: ENVIRONMENTAL PROTECTION AGENCY
Small Business Shares of Spending In . . . Small Business Shares of Companies In . . . Small Business Shares of Contract Transactions In . . .. . . Overall Federal Government . . . This Agency . . . Overall Federal Government . . . This Agency . . . Overall Federal Government . . . This Agency
Table B.9 Small Business Procurement Performance, Environmental Protection Agency

Characteristics of Recent Federal Small Business Contracting 41
Small Business Goal: 19.0000%
FY 2009 FY 2010 YTD FY 2009 FY 2010 YTD FY 2009 FY 2010 YTD FY 2009 FY 2010 YTD FY 2009 FY 2010 YTD FY 2009 FY 2010 YTDSocioeconomicAll Small Businesses 21.28% 22.79% 25.47% 20.54% 81.62% 81.02% 62.70% 67.78% 50.04% 51.70% 43.71% 46.08%Small Disadv Businesses 6.84% 6.75% 7.55% 9.12% 5.47% 5.31% 7.74% 6.39% 7.86% 7.74% 7.40% 9.99%Woman-Owned Businesses 3.99% 4.48% 7.82% 6.35% 15.73% 16.06% 15.17% 16.51% 11.09% 11.48% 11.43% 12.67%HUBZone Businesses 2.75% 2.75% 0.99% 1.34% 3.12% 3.20% 2.01% 1.69% 3.36% 3.34% 2.20% 2.26%Svc Disabled Businesses 3.99% 4.48% 7.82% 6.35% 15.73% 16.06% 15.17% 16.51% 11.09% 11.48% 11.43% 12.67%CompanyNew SBs 9.71% 9.99% 3.11% 9.80% 24.47% 22.21% 14.87% 17.74% 7.09% 5.44% 9.91% 9.68%Lost SBs * 54.67% 30.44% 3.52% 0.64% 37.68% 3.28% 1.24% 1.03% 18.68% 7.89% 1.78% 0.63%Set-Aside ProgramsAll Set-Asides 10.34% 12.11% 6.45% 8.73% 39.40% 40.46% 11.45% 18.02% 13.52% 16.34% 5.99% 10.93%8(a) 7.97% 9.37% 7.68% 6.65% 6.71% 6.41% 7.29% 7.57% 5.32% 9.27% 4.12% 7.78%HUBZone 4.85% 6.26% 5.63% 3.04% 4.42% 4.08% 4.83% 4.57% 2.31% 6.18% 2.50% 4.51%Small Business 9.48% 12.14% 9.10% 6.89% 34.92% 37.37% 10.94% 17.53% 10.64% 16.95% 5.25% 11.08%SDB 4.23% 5.58% 0.00% 2.74% 3.53% 3.00% 0.00% 4.22% 1.97% 5.70% 0.00% 4.31%SDVOSB 4.87% 6.60% 5.68% 3.08% 5.23% 4.87% 4.65% 4.69% 2.52% 6.52% 2.29% 4.53%$3K - $100K 4.28% 5.60% 5.43% 2.74% 7.47% 3.98% 5.70% 4.74% 2.43% 5.81% 2.56% 4.43%Contract VehiclesGSA Schedule 1.31% 1.57% 5.72% 3.56% 3.42% 3.74% 7.11% 8.58% 4.26% 4.45% 4.57% 5.88%IDIQs 12.72% 13.33% 10.96% 12.52% 18.72% 19.70% 20.63% 20.92% 27.99% 29.05% 21.90% 25.49%GSA STARS 0.11% 0.16% 0.35% 0.31% 0.10% 0.10% 0.33% 0.27% 0.07% 0.08% 0.16% 0.15%GSA VETS 0.04% 0.06% 0.02% 0.04% 0.02% 0.02% 0.03% 0.03% 0.01% 0.01% 0.01% 0.01%Top 5 NAICS FY09-FY10325412--Pharmaceutical Preparation Manufacturing 0.63% 1.27% 0.08% 0.76% 47.37% 50.00% 18.18% 28.57% 10.98% 13.27% 39.24% 17.78%541611--Administrative Management and General Management Consulting Services 27.82% 26.47% 20.89% 27.26% 57.02% 55.66% 62.09% 60.71% 40.58% 41.03% 30.80% 58.08%325414--Biological Product (except Diagnostic) Manufacturing 4.17% 4.16% -0.07% 3.40% 55.88% 63.64% 45.45% 54.35% 34.35% 33.84% 57.14% 40.14%325411--Medicinal and Botanical Manufacturing 1.22% 6.79% 0.00% 5.44% 50.00% 42.11% 0.00% 27.27% 11.41% 7.07% 0.00% 18.92%541512--Computer Systems Design Services 23.22% 25.18% 42.11% 26.51% 56.03% 51.28% 63.16% 63.81% 49.07% 48.88% 41.81% 45.46%
Table 6.13: DEPARTMENT OF HEALTH AND HUMAN SERVICES
Small Business Shares of Spending In . . . Small Business Shares of Companies In . . . Small Business Shares of Contract Transactions In . . .. . . This Agency
Notes: Green/Red streetlights indicate whether agency did or did not meet SBA negotiated SB dollar goal. A yellow background indicates conditions deteriorated year-over-year. A red box indicates lower shares than the corresponding, overall federal share.
. . . Overall Federal Government . . . This Agency . . . Overall Federal Government . . . This Agency . . . Overall Federal Government
Table B.10 Small Business Procurement Performance, Department of Health and Human Services

Characteristics of Recent Federal Small Business Contracting 42
Small Business Goal: 66.3310%
FY 2009 FY 2010 YTD FY 2009 FY 2010 YTD FY 2009 FY 2010 YTD FY 2009 FY 2010 YTD FY 2009 FY 2010 YTD FY 2009 FY 2010 YTDSocioeconomicAll Small Businesses 21.28% 22.79% 49.59% 40.36% 81.62% 81.02% 58.43% 70.35% 50.04% 51.70% 45.38% 69.85%Small Disadv Businesses 6.84% 6.75% 44.81% 21.70% 5.47% 5.31% 22.89% 22.91% 7.86% 7.74% 19.79% 28.40%Woman-Owned Businesses 3.99% 4.48% 64.91% 31.11% 15.73% 16.06% 15.06% 18.59% 11.09% 11.48% 16.36% 22.47%HUBZone Businesses 2.75% 2.75% 2.13% 1.55% 3.12% 3.20% 7.23% 3.82% 3.36% 3.34% 6.86% 8.06%Svc Disabled Businesses 3.99% 4.48% 64.91% 31.11% 15.73% 16.06% 15.06% 18.59% 11.09% 11.48% 16.36% 22.47%CompanyNew SBs 9.71% 9.99% 0.14% 33.17% 24.47% 22.21% 4.12% 14.29% 7.09% 5.44% 2.33% 9.18%Lost SBs * 54.67% 30.44% 0.21% 0.04% 37.68% 3.28% 3.09% 0.43% 18.68% 7.89% 2.91% 0.34%Set-Aside ProgramsAll Set-Asides 10.34% 12.11% 11.88% 13.45% 39.40% 40.46% 25.90% 39.80% 13.52% 16.34% 15.04% 44.19%8(a) 7.97% 9.37% 7.65% 9.78% 6.71% 6.41% 18.07% 27.44% 5.32% 9.27% 11.35% 31.80%HUBZone 4.85% 6.26% -0.71% 1.41% 4.42% 4.08% 3.61% 12.56% 2.31% 6.18% 1.85% 10.57%Small Business 9.48% 12.14% 2.76% 5.54% 34.92% 37.37% 12.05% 34.07% 10.64% 16.95% 6.07% 28.16%SDB 4.23% 5.58% 0.00% 1.12% 3.53% 3.00% 0.00% 12.26% 1.97% 5.70% 0.00% 9.23%SDVOSB 4.87% 6.60% -0.70% 1.18% 5.23% 4.87% 4.22% 12.76% 2.52% 6.52% 2.11% 9.50%$3K - $100K 4.28% 5.60% -0.72% 1.13% 7.47% 3.98% 3.01% 14.67% 2.43% 5.81% 1.58% 10.29%Contract VehiclesGSA Schedule 1.31% 1.57% 3.10% 9.69% 3.42% 3.74% 7.83% 5.93% 4.26% 4.45% 6.86% 4.39%IDIQs 12.72% 13.33% 29.11% 18.76% 18.72% 19.70% 28.92% 19.10% 27.99% 29.05% 27.44% 30.43%GSA STARS 0.11% 0.16% 6.99% 1.43% 0.10% 0.10% 3.61% 1.11% 0.07% 0.08% 4.22% 0.99%GSA VETS 0.04% 0.06% 0.00% 0.00% 0.02% 0.02% 0.00% 0.00% 0.01% 0.01% 0.00% 0.00%Top 5 NAICS FY09-FY10
-- 0.00% 42.42% 0.00% 41.39% 0.00% 63.64% 0.00% 50.00% 0.00% 80.79% 0.00% 37.50%541519--Other Computer Related Services 47.03% 53.58% 98.10% 11.86% 61.83% 60.96% 70.00% 77.78% 58.57% 61.39% 18.18% 53.77%531110--Lessors of Residential Buildings and Dwellings 64.36% 40.58% 0.00% 29.63% 57.58% 58.82% 0.00% 83.33% 68.61% 65.92% 0.00% 74.07%541511--Custom Computer Programming Services 38.41% 36.65% 100.00% 36.30% 54.85% 58.13% 100.00% 88.00% 58.69% 57.11% 100.00% 82.14%
-- 0.00% 35.93% 0.00% 23.27% 0.00% 61.54% 0.00% 33.33% 0.00% 76.05% 0.00% 24.00%
Table 6.14: DEPARTMENT OF HOUSING AND URBAN DEVELOPMENT
Small Business Shares of Spending In . . . Small Business Shares of Companies In . . . Small Business Shares of Contract Transactions In . . .. . . This Agency
Notes: Green/Red streetlights indicate whether agency did or did not meet SBA negotiated SB dollar goal. A yellow background indicates conditions deteriorated year-over-year. A red box indicates lower shares than the corresponding, overall federal share.
. . . Overall Federal Government . . . This Agency . . . Overall Federal Government . . . This Agency . . . Overall Federal Government
Table B.11 Small Business Procurement Performance, Department of Housing and Urban Development

Characteristics of Recent Federal Small Business Contracting 43
Small Business Goal: 33.4152%
FY 2009 FY 2010 YTD FY 2009 FY 2010 YTD FY 2009 FY 2010 YTD FY 2009 FY 2010 YTD FY 2009 FY 2010 YTD FY 2009 FY 2010 YTDSocioeconomicAll Small Businesses 21.28% 22.79% 35.89% 33.25% 81.62% 81.02% 60.25% 63.81% 50.04% 51.70% 46.01% 47.46%Small Disadv Businesses 6.84% 6.75% 12.61% 13.39% 5.47% 5.31% 14.05% 13.35% 7.86% 7.74% 14.69% 14.07%Woman-Owned Businesses 3.99% 4.48% 6.97% 7.74% 15.73% 16.06% 17.38% 17.94% 11.09% 11.48% 14.36% 14.46%HUBZone Businesses 2.75% 2.75% 0.85% 2.80% 3.12% 3.20% 3.26% 4.18% 3.36% 3.34% 2.37% 3.17%Svc Disabled Businesses 3.99% 4.48% 6.97% 7.74% 15.73% 16.06% 17.38% 17.94% 11.09% 11.48% 14.36% 14.46%CompanyNew SBs 9.71% 9.99% 14.12% 57.67% 24.47% 22.21% 11.42% 14.46% 7.09% 5.44% 5.47% 14.29%Lost SBs * 54.67% 30.44% 0.01% 0.01% 37.68% 3.28% 0.72% 0.57% 18.68% 7.89% 0.29% 0.28%Set-Aside ProgramsAll Set-Asides 10.34% 12.11% 24.41% 22.69% 39.40% 40.46% 16.65% 23.20% 13.52% 16.34% 12.71% 18.21%8(a) 7.97% 9.37% 8.56% 7.42% 6.71% 6.41% 7.39% 10.82% 5.32% 9.27% 6.09% 8.79%HUBZone 4.85% 6.26% 1.75% 2.63% 4.42% 4.08% 0.80% 5.15% 2.31% 6.18% 0.61% 2.62%Small Business 9.48% 12.14% 18.70% 13.91% 34.92% 37.37% 9.49% 18.09% 10.64% 16.95% 6.81% 11.85%SDB 4.23% 5.58% 0.00% 0.66% 3.53% 3.00% 0.00% 3.61% 1.97% 5.70% 0.00% 1.91%SDVOSB 4.87% 6.60% 2.05% 1.35% 5.23% 4.87% 1.67% 4.48% 2.52% 6.52% 1.15% 2.48%$3K - $100K 4.28% 5.60% 1.70% 0.66% 7.47% 3.98% 1.45% 3.81% 2.43% 5.81% 0.73% 2.00%Contract VehiclesGSA Schedule 1.31% 1.57% 1.19% 1.71% 3.42% 3.74% 12.82% 12.58% 4.26% 4.45% 7.17% 8.57%IDIQs 12.72% 13.33% 11.06% 10.84% 18.72% 19.70% 25.34% 24.43% 27.99% 29.05% 25.29% 23.73%GSA STARS 0.11% 0.16% 0.14% 0.16% 0.10% 0.10% 0.51% 0.41% 0.07% 0.08% 0.19% 0.28%GSA VETS 0.04% 0.06% 0.00% 0.00% 0.02% 0.02% 0.00% 0.00% 0.01% 0.01% 0.00% 0.00%Top 5 NAICS FY09-FY10611519--Other Technical and Trade Schools 23.18% 17.83% 21.83% 15.93% 55.36% 50.00% 40.00% 36.67% 30.18% 31.88% 18.08% 18.12%541611--Administrative Management and General Management Consulting Services 27.82% 26.47% 52.93% 43.32% 57.02% 55.66% 64.63% 59.64% 40.58% 41.03% 52.94% 58.42%541511--Custom Computer Programming Services 38.41% 36.65% 44.42% 50.59% 54.85% 58.13% 74.07% 81.97% 58.69% 57.11% 41.95% 55.49%236220--Commercial and Institutional Building Construction 35.67% 41.24% 100.00% 97.32% 63.06% 62.39% 100.00% 98.25% 77.41% 75.06% 100.00% 95.16%541519--Other Computer Related Services 47.03% 53.58% 88.37% 58.64% 61.83% 60.96% 79.79% 75.22% 58.57% 61.39% 71.27% 64.55%
Table 6.15: DEPARTMENT OF LABOR
Small Business Shares of Spending In . . . Small Business Shares of Companies In . . . Small Business Shares of Contract Transactions In . . .. . . This Agency
Notes: Green/Red streetlights indicate whether agency did or did not meet SBA negotiated SB dollar goal. A yellow background indicates conditions deteriorated year-over-year. A red box indicates lower shares than the corresponding, overall federal share.
. . . Overall Federal Government . . . This Agency . . . Overall Federal Government . . . This Agency . . . Overall Federal Government
Table B.12 Small Business Procurement Performance, Department of Labor

Characteristics of Recent Federal Small Business Contracting 44
Small Business Goal: 43.2819%
FY 2009 FY 2010 YTD FY 2009 FY 2010 YTD FY 2009 FY 2010 YTD FY 2009 FY 2010 YTD FY 2009 FY 2010 YTD FY 2009 FY 2010 YTDSocioeconomicAll Small Businesses 21.28% 22.79% 35.57% 37.73% 81.62% 81.02% 45.54% 59.52% 50.04% 51.70% 25.21% 44.28%Small Disadv Businesses 6.84% 6.75% 12.99% 14.49% 5.47% 5.31% 10.80% 11.30% 7.86% 7.74% 6.85% 12.76%Woman-Owned Businesses 3.99% 4.48% 10.01% 8.88% 15.73% 16.06% 9.86% 12.01% 11.09% 11.48% 3.76% 9.90%HUBZone Businesses 2.75% 2.75% 8.68% 9.27% 3.12% 3.20% 2.35% 4.48% 3.36% 3.34% 0.90% 5.12%Svc Disabled Businesses 3.99% 4.48% 10.01% 8.88% 15.73% 16.06% 9.86% 12.01% 11.09% 11.48% 3.76% 9.90%CompanyNew SBs 9.71% 9.99% 26.70% 15.07% 24.47% 22.21% 9.28% 14.79% 7.09% 5.44% 6.27% 11.77%Lost SBs * 54.67% 30.44% -0.04% 0.52% 37.68% 3.28% 1.55% 0.93% 18.68% 7.89% 2.99% 1.06%Set-Aside ProgramsAll Set-Asides 10.34% 12.11% 13.03% 16.67% 39.40% 40.46% 10.33% 18.32% 13.52% 16.34% 6.55% 13.04%8(a) 7.97% 9.37% 17.87% 13.50% 6.71% 6.41% 14.08% 9.99% 5.32% 9.27% 8.05% 10.21%HUBZone 4.85% 6.26% 6.37% 5.93% 4.42% 4.08% 7.75% 5.43% 2.31% 6.18% 3.01% 4.42%Small Business 9.48% 12.14% 7.85% 6.25% 34.92% 37.37% 11.03% 15.78% 10.64% 16.95% 4.29% 9.13%SDB 4.23% 5.58% 0.00% 3.13% 3.53% 3.00% 0.00% 4.60% 1.97% 5.70% 0.00% 3.78%SDVOSB 4.87% 6.60% 6.37% 3.36% 5.23% 4.87% 7.75% 5.27% 2.52% 6.52% 3.01% 4.19%$3K - $100K 4.28% 5.60% 6.42% 3.24% 7.47% 3.98% 8.45% 4.92% 2.43% 5.81% 3.24% 3.96%Contract VehiclesGSA Schedule 1.31% 1.57% 2.46% 2.88% 3.42% 3.74% 4.46% 7.73% 4.26% 4.45% 2.18% 5.25%IDIQs 12.72% 13.33% 10.24% 14.74% 18.72% 19.70% 21.13% 20.10% 27.99% 29.05% 12.57% 21.21%GSA STARS 0.11% 0.16% 0.09% 0.46% 0.10% 0.10% 0.47% 0.52% 0.07% 0.08% 0.15% 0.45%GSA VETS 0.04% 0.06% 0.00% 0.00% 0.02% 0.02% 0.00% 0.00% 0.01% 0.01% 0.00% 0.00%Top 5 NAICS FY09-FY10237310--Highway, Street, and Bridge Construction 52.03% 52.62% 100.56% 52.40% 59.65% 63.16% 63.16% 60.00% 74.04% 75.74% 67.74% 59.23%483111--Deep Sea Freight Transportation 20.83% 37.38% 76.13% 42.83% 60.00% 47.37% 50.00% 41.38% 21.93% 22.49% 64.29% 49.64%541611--Administrative Management and General Management Consulting Services 27.82% 26.47% 8.34% 41.21% 57.02% 55.66% 42.86% 54.72% 40.58% 41.03% 41.18% 56.54%541330--Engineering Services 15.77% 17.80% -0.97% 12.69% 54.39% 52.91% 31.82% 35.81% 33.33% 33.37% 23.53% 22.35%
-- 0.00% 10.97% 0.00% 0.11% 0.00% 57.50% 0.00% 9.09% 0.00% 63.22% 0.00% 16.22%
Table 6.16: DEPARTMENT OF TRANSPORTATION
Small Business Shares of Spending In . . . Small Business Shares of Companies In . . . Small Business Shares of Contract Transactions In . . .. . . This Agency
Notes: Green/Red streetlights indicate whether agency did or did not meet SBA negotiated SB dollar goal. A yellow background indicates conditions deteriorated year-over-year. A red box indicates lower shares than the corresponding, overall federal share.
. . . Overall Federal Government . . . This Agency . . . Overall Federal Government . . . This Agency . . . Overall Federal Government
Table B.13 Small Business Procurement Performance, Department of Transportation

Characteristics of Recent Federal Small Business Contracting 45
Small Business Goal: 28.7077%
FY 2009 FY 2010 YTD FY 2009 FY 2010 YTD FY 2009 FY 2010 YTD FY 2009 FY 2010 YTD FY 2009 FY 2010 YTD FY 2009 FY 2010 YTDSocioeconomicAll Small Businesses 21.28% 22.79% 41.82% 38.61% 81.62% 81.02% 59.49% 70.97% 50.04% 51.70% 39.84% 46.17%Small Disadv Businesses 6.84% 6.75% 13.15% 6.37% 5.47% 5.31% 8.31% 3.75% 7.86% 7.74% 6.25% 3.83%Woman-Owned Businesses 3.99% 4.48% 4.89% 4.02% 15.73% 16.06% 10.70% 12.20% 11.09% 11.48% 8.80% 6.96%HUBZone Businesses 2.75% 2.75% 2.93% 2.35% 3.12% 3.20% 3.36% 1.95% 3.36% 3.34% 3.84% 1.75%Svc Disabled Businesses 3.99% 4.48% 4.89% 4.02% 15.73% 16.06% 10.70% 12.20% 11.09% 11.48% 8.80% 6.96%CompanyNew SBs 9.71% 9.99% 13.11% 13.58% 24.47% 22.21% 16.06% 22.31% 7.09% 5.44% 11.51% 9.67%Lost SBs * 54.67% 30.44% 0.59% 0.79% 37.68% 3.28% 1.64% 1.31% 18.68% 7.89% 1.51% 0.77%Set-Aside ProgramsAll Set-Asides 10.34% 12.11% 22.92% 21.58% 39.40% 40.46% 20.65% 17.62% 13.52% 16.34% 12.94% 11.88%8(a) 7.97% 9.37% 5.07% 24.13% 6.71% 6.41% 4.69% 4.17% 5.32% 9.27% 2.95% 9.72%HUBZone 4.85% 6.26% 1.94% 23.34% 4.42% 4.08% 2.12% 3.27% 2.31% 6.18% 1.48% 9.36%Small Business 9.48% 12.14% 3.95% 27.01% 34.92% 37.37% 9.73% 12.11% 10.64% 16.95% 5.60% 14.32%SDB 4.23% 5.58% 0.00% 23.28% 3.53% 3.00% 0.00% 3.20% 1.97% 5.70% 0.00% 9.29%SDVOSB 4.87% 6.60% 18.11% 39.58% 5.23% 4.87% 11.19% 10.21% 2.52% 6.52% 7.52% 15.16%$3K - $100K 4.28% 5.60% 1.67% 23.29% 7.47% 3.98% 2.26% 3.32% 2.43% 5.81% 1.53% 9.31%Contract VehiclesGSA Schedule 1.31% 1.57% 4.94% 6.39% 3.42% 3.74% 8.71% 8.20% 4.26% 4.45% 5.95% 9.77%IDIQs 12.72% 13.33% 24.17% 18.29% 18.72% 19.70% 23.35% 20.05% 27.99% 29.05% 19.83% 22.06%GSA STARS 0.11% 0.16% 0.91% 0.15% 0.10% 0.10% 0.35% 0.06% 0.07% 0.08% 0.33% 0.04%GSA VETS 0.04% 0.06% 2.01% 0.73% 0.02% 0.02% 0.40% 0.12% 0.01% 0.01% 0.45% 0.07%Top 5 NAICS FY09-FY10
NAICS1--424210 64.29% 42.21% Drugs and Dru Drugs and Druggists' Sund 0.66% 0.90% 35.46% 0.66% 51.72% 54.29% 63.64% 62.42%
NAICS2--236220 77.44% 77.50% Commercial a Commercial and Institution 35.67% 41.24% 59.53% 72.58% 63.06% 62.39% 88.08% 91.69%
NAICS3--541519 64.98% 58.21% Other Compu Other Computer Related S 47.03% 53.58% 73.03% 74.57% 61.83% 60.96% 61.29% 71.53%
NAICS4--621111 25.72% 28.45% Offices of Phy Offices of Physicians (exce 41.06% 36.38% 15.57% 17.28% 56.76% 56.94% 33.05% 46.61%
NAICS5--339112 47.12% 41.19% Surgical and M Surgical and Medical Instru 43.40% 47.33% 35.26% 45.89% 64.81% 62.26% 52.00% 65.50%
Table 6.17: DEPARTMENT OF VETERANS AFFAIRS
Small Business Shares of Spending In . . . Small Business Shares of Companies In . . . Small Business Shares of Contract Transactions In . . .. . . This Agency
Notes: Green/Red streetlights indicate whether agency did or did not meet SBA negotiated SB dollar goal. A yellow background indicates conditions deteriorated year-over-year. A red box indicates lower shares than the corresponding, overall federal share.
. . . Overall Federal Government . . . This Agency . . . Overall Federal Government . . . This Agency . . . Overall Federal Government
Table B.14 Small Business Procurement Performance, Department of Veterans Affairs
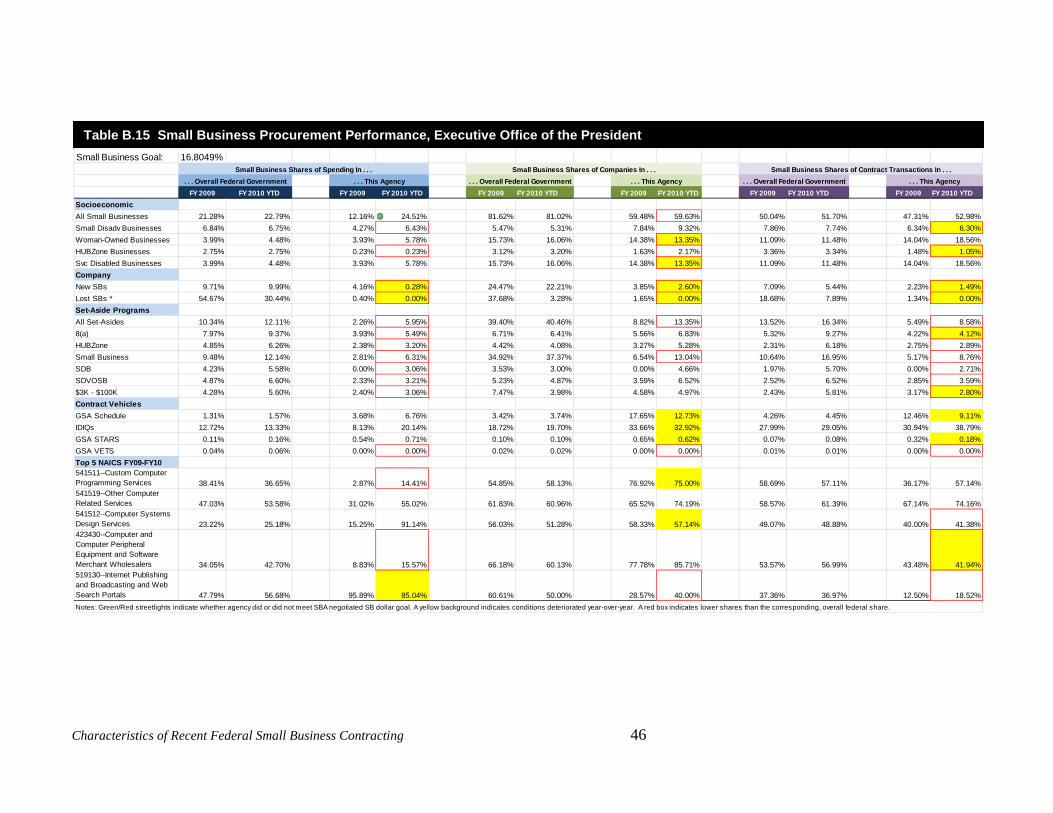
Characteristics of Recent Federal Small Business Contracting 46
Small Business Goal: 16.8049%
FY 2009 FY 2010 YTD FY 2009 FY 2010 YTD FY 2009 FY 2010 YTD FY 2009 FY 2010 YTD FY 2009 FY 2010 YTD FY 2009 FY 2010 YTDSocioeconomicAll Small Businesses 21.28% 22.79% 12.16% 24.51% 81.62% 81.02% 59.48% 59.63% 50.04% 51.70% 47.31% 52.98%Small Disadv Businesses 6.84% 6.75% 4.27% 6.43% 5.47% 5.31% 7.84% 9.32% 7.86% 7.74% 6.34% 6.30%Woman-Owned Businesses 3.99% 4.48% 3.93% 5.78% 15.73% 16.06% 14.38% 13.35% 11.09% 11.48% 14.04% 18.56%HUBZone Businesses 2.75% 2.75% 0.23% 0.23% 3.12% 3.20% 1.63% 2.17% 3.36% 3.34% 1.48% 1.05%Svc Disabled Businesses 3.99% 4.48% 3.93% 5.78% 15.73% 16.06% 14.38% 13.35% 11.09% 11.48% 14.04% 18.56%CompanyNew SBs 9.71% 9.99% 4.16% 0.28% 24.47% 22.21% 3.85% 2.60% 7.09% 5.44% 2.23% 1.49%Lost SBs * 54.67% 30.44% 0.40% 0.00% 37.68% 3.28% 1.65% 0.00% 18.68% 7.89% 1.34% 0.00%Set-Aside ProgramsAll Set-Asides 10.34% 12.11% 2.26% 5.95% 39.40% 40.46% 8.82% 13.35% 13.52% 16.34% 5.49% 8.58%8(a) 7.97% 9.37% 3.93% 5.49% 6.71% 6.41% 5.56% 6.83% 5.32% 9.27% 4.22% 4.12%HUBZone 4.85% 6.26% 2.38% 3.20% 4.42% 4.08% 3.27% 5.28% 2.31% 6.18% 2.75% 2.89%Small Business 9.48% 12.14% 2.81% 6.31% 34.92% 37.37% 6.54% 13.04% 10.64% 16.95% 5.17% 8.76%SDB 4.23% 5.58% 0.00% 3.06% 3.53% 3.00% 0.00% 4.66% 1.97% 5.70% 0.00% 2.71%SDVOSB 4.87% 6.60% 2.33% 3.21% 5.23% 4.87% 3.59% 6.52% 2.52% 6.52% 2.85% 3.59%$3K - $100K 4.28% 5.60% 2.40% 3.06% 7.47% 3.98% 4.58% 4.97% 2.43% 5.81% 3.17% 2.80%Contract VehiclesGSA Schedule 1.31% 1.57% 3.68% 6.76% 3.42% 3.74% 17.65% 12.73% 4.26% 4.45% 12.46% 9.11%IDIQs 12.72% 13.33% 8.13% 20.14% 18.72% 19.70% 33.66% 32.92% 27.99% 29.05% 30.94% 38.79%GSA STARS 0.11% 0.16% 0.54% 0.71% 0.10% 0.10% 0.65% 0.62% 0.07% 0.08% 0.32% 0.18%GSA VETS 0.04% 0.06% 0.00% 0.00% 0.02% 0.02% 0.00% 0.00% 0.01% 0.01% 0.00% 0.00%Top 5 NAICS FY09-FY10541511--Custom Computer Programming Services 38.41% 36.65% 2.87% 14.41% 54.85% 58.13% 76.92% 75.00% 58.69% 57.11% 36.17% 57.14%541519--Other Computer Related Services 47.03% 53.58% 31.02% 55.02% 61.83% 60.96% 65.52% 74.19% 58.57% 61.39% 67.14% 74.16%541512--Computer Systems Design Services 23.22% 25.18% 15.25% 91.14% 56.03% 51.28% 58.33% 57.14% 49.07% 48.88% 40.00% 41.38%423430--Computer and Computer Peripheral Equipment and Software Merchant Wholesalers 34.05% 42.70% 8.83% 15.57% 66.18% 60.13% 77.78% 85.71% 53.57% 56.99% 43.48% 41.94%519130--Internet Publishing and Broadcasting and Web Search Portals 47.79% 56.68% 95.89% 85.04% 60.61% 50.00% 28.57% 40.00% 37.36% 36.97% 12.50% 18.52%Notes: Green/Red streetlights indicate whether agency did or did not meet SBA negotiated SB dollar goal. A yellow background indicates conditions deteriorated year-over-year. A red box indicates lower shares than the corresponding, overall federal share.
Table 6.18: EXECUTIVE OFFICE OF THE PRESIDENT
Small Business Shares of Spending In . . . Small Business Shares of Companies In . . . Small Business Shares of Contract Transactions In . . .. . . Overall Federal Government . . . This Agency . . . Overall Federal Government . . . This Agency . . . Overall Federal Government . . . This Agency
Table B.15 Small Business Procurement Performance, Executive Office of the President

Characteristics of Recent Federal Small Business Contracting 47
Small Business Goal: 35.7418%
FY 2009 FY 2010 YTD FY 2009 FY 2010 YTD FY 2009 FY 2010 YTD FY 2009 FY 2010 YTD FY 2009 FY 2010 YTD FY 2009 FY 2010 YTDSocioeconomicAll Small Businesses 21.28% 22.79% 21.28% 35.09% 81.62% 81.02% 62.69% 72.93% 50.04% 51.70% 43.49% 61.81%Small Disadv Businesses 6.84% 6.75% 20.66% 11.13% 5.47% 5.31% 17.29% 15.39% 7.86% 7.74% 13.55% 11.35%Woman-Owned Businesses 3.99% 4.48% 5.85% 5.24% 15.73% 16.06% 14.68% 16.69% 11.09% 11.48% 10.01% 14.89%HUBZone Businesses 2.75% 2.75% 1.46% 2.69% 3.12% 3.20% 4.85% 5.07% 3.36% 3.34% 3.32% 3.58%Svc Disabled Businesses 3.99% 4.48% 5.85% 5.24% 15.73% 16.06% 14.68% 16.69% 11.09% 11.48% 10.01% 14.89%CompanyNew SBs 9.71% 9.99% 3.15% 10.49% 24.47% 22.21% 8.33% 14.52% 7.09% 5.44% 3.78% 3.58%Lost SBs * 54.67% 30.44% 1.54% 9.37% 37.68% 3.28% 1.19% 0.57% 18.68% 7.89% 0.87% 7.79%Set-Aside ProgramsAll Set-Asides 10.34% 12.11% 3.60% 11.51% 39.40% 40.46% 11.82% 21.16% 13.52% 16.34% 4.52% 10.86%8(a) 7.97% 9.37% 5.80% 20.84% 6.71% 6.41% 10.82% 15.96% 5.32% 9.27% 4.83% 9.85%HUBZone 4.85% 6.26% 2.96% 14.22% 4.42% 4.08% 3.48% 7.04% 2.31% 6.18% 1.61% 5.44%Small Business 9.48% 12.14% 3.28% 18.14% 34.92% 37.37% 6.59% 16.61% 10.64% 16.95% 2.50% 10.76%SDB 4.23% 5.58% 0.00% 14.00% 3.53% 3.00% 0.00% 6.48% 1.97% 5.70% 0.00% 5.19%SDVOSB 4.87% 6.60% 3.31% 14.27% 5.23% 4.87% 4.10% 7.03% 2.52% 6.52% 1.80% 5.38%$3K - $100K 4.28% 5.60% 2.96% 14.03% 7.47% 3.98% 3.73% 6.90% 2.43% 5.81% 1.67% 5.26%Contract VehiclesGSA Schedule 1.31% 1.57% 3.70% 2.48% 3.42% 3.74% 10.20% 12.88% 4.26% 4.45% 5.15% 8.36%IDIQs 12.72% 13.33% 15.25% 24.97% 18.72% 19.70% 36.44% 38.52% 27.99% 29.05% 32.85% 50.81%GSA STARS 0.11% 0.16% 9.83% 1.10% 0.10% 0.10% 0.75% 0.29% 0.07% 0.08% 0.95% 0.14%GSA VETS 0.04% 0.06% 0.06% 0.03% 0.02% 0.02% 0.37% 0.05% 0.01% 0.01% 0.32% 0.01%Top 5 NAICS FY09-FY10
NAICS1--236220 87.50% 68.56% Commercial a Commercial and Institution 35.67% 41.24% 8.65% 19.45% 63.06% 62.39% 78.79% 79.40%
NAICS2-- 0.00% 99.81% 0.00% Light Truck and Utility Veh 0.00% 15.54% 0.00% 99.61% 0.00% 64.29% 0.00% 87.50%
NAICS3--541512 78.13% 57.55% Computer Sy Computer Systems Design 23.22% 25.18% 64.88% 15.97% 56.03% 51.28% 71.43% 66.67%
NAICS4--517110 14.29% 34.24% Wired Teleco Wired Telecommunications 26.77% 40.52% 0.27% 98.88% 55.17% 50.45% 28.57% 32.26%
NAICS5--541611 45.45% 61.66% Administrative Administrative Managemen 27.82% 26.47% 33.11% 38.93% 57.02% 55.66% 42.11% 65.19%Notes: Green/Red streetlights indicate whether agency did or did not meet SBA negotiated SB dollar goal. A yellow background indicates conditions deteriorated year-over-year. A red box indicates lower shares than the corresponding, overall federal share.
Table 6.19: GENERAL SERVICES ADMINISTRATION
Small Business Shares of Spending In . . . Small Business Shares of Companies In . . . Small Business Shares of Contract Transactions In . . .. . . Overall Federal Government . . . This Agency . . . Overall Federal Government . . . This Agency . . . Overall Federal Government . . . This Agency
Table B.16 Small Business Procurement Performance, General Services Administration

Characteristics of Recent Federal Small Business Contracting 48
Small Business Goal: 15.3548%
FY 2009 FY 2010 YTD FY 2009 FY 2010 YTD FY 2009 FY 2010 YTD FY 2009 FY 2010 YTD FY 2009 FY 2010 YTD FY 2009 FY 2010 YTDSocioeconomicAll Small Businesses 21.28% 22.79% 14.41% 32.57% 81.62% 81.02% 70.73% 68.87% 50.04% 51.70% 52.16% 24.52%Small Disadv Businesses 6.84% 6.75% 6.29% 3.65% 5.47% 5.31% 6.42% 5.66% 7.86% 7.74% 12.52% 1.44%Woman-Owned Businesses 3.99% 4.48% 2.80% 3.74% 15.73% 16.06% 12.70% 13.21% 11.09% 11.48% 10.86% 3.61%HUBZone Businesses 2.75% 2.75% 1.11% 10.30% 3.12% 3.20% 2.24% 3.77% 3.36% 3.34% 3.24% 0.96%Svc Disabled Businesses 3.99% 4.48% 2.80% 3.74% 15.73% 16.06% 12.70% 13.21% 11.09% 11.48% 10.86% 3.61%CompanyNew SBs 9.71% 9.99% 10.95% 1.08% 24.47% 22.21% 14.19% 5.48% 7.09% 5.44% 6.49% 3.92%Lost SBs * 54.67% 30.44% 0.31% 0.00% 37.68% 3.28% 0.31% 0.00% 18.68% 7.89% 0.22% 0.00%Set-Aside ProgramsAll Set-Asides 10.34% 12.11% 12.15% 2.62% 39.40% 40.46% 30.07% 16.04% 13.52% 16.34% 31.74% 5.77%8(a) 7.97% 9.37% 13.64% 30.50% 6.71% 6.41% 7.42% 2.83% 5.32% 9.27% 14.14% 0.72%HUBZone 4.85% 6.26% 10.45% 30.34% 4.42% 4.08% 4.44% 0.94% 2.31% 6.18% 6.91% 0.24%Small Business 9.48% 12.14% 18.25% 32.77% 34.92% 37.37% 30.40% 15.09% 10.64% 16.95% 28.09% 5.29%SDB 4.23% 5.58% 10.10% 0.00% 3.53% 3.00% 4.11% 0.00% 1.97% 5.70% 5.90% 0.00%SDVOSB 4.87% 6.60% 10.23% 30.34% 5.23% 4.87% 4.37% 0.94% 2.52% 6.52% 6.15% 0.24%$3K - $100K 4.28% 5.60% 10.11% 30.38% 7.47% 3.98% 4.31% 1.89% 2.43% 5.81% 5.95% 0.48%Contract VehiclesGSA Schedule 1.31% 1.57% 0.30% 16.22% 3.42% 3.74% 5.91% 33.96% 4.26% 4.45% 2.47% 11.54%IDIQs 12.72% 13.33% 4.53% 28.62% 18.72% 19.70% 15.32% 48.11% 27.99% 29.05% 24.94% 16.59%GSA STARS 0.11% 0.16% 0.02% 0.00% 0.10% 0.10% 0.07% 0.00% 0.07% 0.08% 0.06% 0.00%GSA VETS 0.04% 0.06% 0.00% 0.00% 0.02% 0.02% 0.00% 0.00% 0.01% 0.01% 0.00% 0.00%Top 5 NAICS FY09-FY10541710--Research and Development in the Physical, Engineering, and Life Sciences 11.38% 8.13% 31.13% 7.08% 48.94% 43.75% 51.02% 40.96% 33.23% 31.11% 22.80% 31.80%541330--Engineering Services 15.77% 17.80% 25.00% 15.33% 54.39% 52.91% 49.44% 60.53% 33.33% 33.37% 51.72% 44.80%336414--Guided Missile and Space Vehicle Manufacturing 0.02% 0.08% 0.00% 0.65% 40.00% 54.55% 33.33% 33.33% 1.19% 2.09% 33.33% 7.43%541712--Research and Development in the Physical, Engineering, and Life Sciences (Except Biotechnology) 31.49% 28.79% 83.68% 36.91% 52.43% 48.15% 92.12% 83.05% 61.94% 59.45% 92.55% 81.18%
336415--Guided Missile and Space Vehicle Propulsion Unit and Propulsion Unit Parts Manufacturing 0.67% 0.63% 0.00% 0.50% 38.46% 46.15% 0.00% 22.22% 33.79% 23.82% 0.00% 3.88%
Table 6.20: NATIONAL AERONAUTICS AND SPACE ADMINISTRATION
Small Business Shares of Spending In . . . Small Business Shares of Companies In . . . Small Business Shares of Contract Transactions In . . .. . . This Agency
Notes: Green/Red streetlights indicate whether agency did or did not meet SBA negotiated SB dollar goal. A yellow background indicates conditions deteriorated year-over-year. A red box indicates lower shares than the corresponding, overall federal share.
. . . Overall Federal Government . . . This Agency . . . Overall Federal Government . . . This Agency . . . Overall Federal Government
Table B.17 Small Business Procurement Performance, National Aeronautics and Space Administration

Characteristics of Recent Federal Small Business Contracting 49
Small Business Goal: 22.2375%
FY 2009 FY 2010 YTD FY 2009 FY 2010 YTD FY 2009 FY 2010 YTD FY 2009 FY 2010 YTD FY 2009 FY 2010 YTD FY 2009 FY 2010 YTDSocioeconomicAll Small Businesses 21.28% 22.79% 15.66% 17.86% 81.62% 81.02% 79.12% 78.74% 50.04% 51.70% 48.10% 50.02%Small Disadv Businesses 6.84% 6.75% 4.70% 5.21% 5.47% 5.31% 8.01% 7.79% 7.86% 7.74% 7.59% 7.32%Woman-Owned Businesses 3.99% 4.48% 3.01% 3.35% 15.73% 16.06% 14.38% 14.73% 11.09% 11.48% 10.72% 11.07%HUBZone Businesses 2.75% 2.75% 2.02% 1.68% 3.12% 3.20% 3.56% 3.61% 3.36% 3.34% 3.11% 3.10%Svc Disabled Businesses 3.99% 4.48% 3.01% 3.35% 15.73% 16.06% 14.38% 14.73% 11.09% 11.48% 10.72% 11.07%CompanyNew SBs 9.71% 9.99% 3.64% 10.56% 24.47% 22.21% 12.19% 12.44% 7.09% 5.44% 2.55% 3.34%Lost SBs * 54.67% 30.44% 19.51% 2.80% 37.68% 3.28% 0.98% 0.52% 18.68% 7.89% 2.01% 0.44%Set-Aside ProgramsAll Set-Asides 10.34% 12.11% 7.46% 8.42% 39.40% 40.46% 36.85% 37.19% 13.52% 16.34% 13.08% 13.87%8(a) 7.97% 9.37% 4.67% 4.51% 6.71% 6.41% 8.54% 8.11% 5.32% 9.27% 6.82% 11.09%HUBZone 4.85% 6.26% 2.07% 1.60% 4.42% 4.08% 4.87% 4.14% 2.31% 6.18% 3.30% 7.54%Small Business 9.48% 12.14% 5.25% 5.81% 34.92% 37.37% 35.70% 35.28% 10.64% 16.95% 11.85% 16.86%SDB 4.23% 5.58% 0.00% 1.28% 3.53% 3.00% 0.00% 3.52% 1.97% 5.70% 0.00% 7.30%SDVOSB 4.87% 6.60% 1.80% 1.62% 5.23% 4.87% 4.93% 4.19% 2.52% 6.52% 3.23% 7.54%$3K - $100K 4.28% 5.60% 1.58% 1.28% 7.47% 3.98% 4.31% 3.53% 2.43% 5.81% 3.04% 7.30%Contract VehiclesGSA Schedule 1.31% 1.57% 0.58% 0.75% 3.42% 3.74% 6.44% 6.77% 4.26% 4.45% 3.81% 4.25%IDIQs 12.72% 13.33% 9.83% 10.85% 18.72% 19.70% 22.01% 23.30% 27.99% 29.05% 28.11% 30.07%GSA STARS 0.11% 0.16% 0.03% 0.03% 0.10% 0.10% 0.07% 0.08% 0.07% 0.08% 0.02% 0.02%GSA VETS 0.04% 0.06% 0.00% 0.00% 0.02% 0.02% 0.00% 0.00% 0.01% 0.01% 0.00% 0.00%Top 5 NAICS FY09-FY10541330--Engineering Services 15.77% 17.80% 17.28% 19.84% 54.39% 52.91% 65.37% 68.96% 33.33% 33.37% 32.69% 32.23%336411--Aircraft Manufacturing 2.58% 11.73% 0.30% 9.70% 51.61% 67.57% 49.66% 71.36% 46.73% 51.69% 15.40% 45.03%336611--Ship Building and Repairing 8.04% 2.96% 6.22% 0.28% 61.54% 54.55% 71.89% 42.73% 50.40% 43.73% 42.81% 11.93%236220--Commercial and Institutional Building Construction 35.67% 41.24% 26.87% 33.97% 63.06% 62.39% 81.71% 82.19% 77.41% 75.06% 75.82% 75.61%334511--Search, Detection, Navigation, Guidance, Aeronautical, and Nautical System and Instrument Manufacturing 3.33% 8.13% 3.64% 9.98% 58.02% 43.75% 56.05% 63.32% 32.36% 31.11% 30.74% 26.13%
Table 6.21: DEPARTMENT OF DEFENSE - NAVY
Small Business Shares of Spending In . . . Small Business Shares of Companies In . . . Small Business Shares of Contract Transactions In . . .. . . This Agency
Notes: Green/Red streetlights indicate whether agency did or did not meet SBA negotiated SB dollar goal. A yellow background indicates conditions deteriorated year-over-year. A red box indicates lower shares than the corresponding, overall federal share.
. . . Overall Federal Government . . . This Agency . . . Overall Federal Government . . . This Agency . . . Overall Federal Government
Table B.18 Small Business Procurement Performance, Department of Defense–Navy

Characteristics of Recent Federal Small Business Contracting 50
Small Business Goal: 28.9404%
FY 2009 FY 2010 YTD FY 2009 FY 2010 YTD FY 2009 FY 2010 YTD FY 2009 FY 2010 YTD FY 2009 FY 2010 YTD FY 2009 FY 2010 YTDSocioeconomicAll Small Businesses 21.28% 22.79% 11.88% 23.13% 81.62% 81.02% 59.35% 23.13% 50.04% 51.70% 49.30% 23.13%Small Disadv Businesses 6.84% 6.75% 2.79% 23.13% 5.47% 5.31% 12.22% 23.13% 7.86% 7.74% 10.14% 23.13%Woman-Owned Businesses 3.99% 4.48% 4.56% 23.13% 15.73% 16.06% 12.81% 23.13% 11.09% 11.48% 9.58% 23.13%HUBZone Businesses 2.75% 2.75% 1.31% 23.13% 3.12% 3.20% 4.57% 23.13% 3.36% 3.34% 6.22% 23.13%Svc Disabled Businesses 3.99% 4.48% 4.56% 23.13% 15.73% 16.06% 12.81% 23.13% 11.09% 11.48% 9.58% 23.13%CompanyNew SBs 9.71% 9.99% 0.67% 23.13% 24.47% 22.21% 2.48% 23.13% 7.09% 5.44% 2.13% 23.13%Lost SBs * 54.67% 30.44% 155.46% 23.13% 37.68% 3.28% 1.74% 23.13% 18.68% 7.89% 2.55% 23.13%Set-Aside ProgramsAll Set-Asides 10.34% 12.11% 5.43% 23.13% 39.40% 40.46% 22.97% 23.13% 13.52% 16.34% 21.33% 23.13%8(a) 7.97% 9.37% 2.98% 23.13% 6.71% 6.41% 14.87% 23.13% 5.32% 9.27% 12.17% 23.13%HUBZone 4.85% 6.26% 2.05% 23.13% 4.42% 4.08% 8.98% 23.13% 2.31% 6.18% 7.34% 23.13%Small Business 9.48% 12.14% 5.85% 23.13% 34.92% 37.37% 23.71% 23.13% 10.64% 16.95% 21.89% 23.13%SDB 4.23% 5.58% 0.00% 23.13% 3.53% 3.00% 0.00% 23.13% 1.97% 5.70% 0.00% 23.13%SDVOSB 4.87% 6.60% 1.97% 23.13% 5.23% 4.87% 9.43% 23.13% 2.52% 6.52% 7.48% 23.13%$3K - $100K 4.28% 5.60% 1.85% 23.13% 7.47% 3.98% 8.69% 23.13% 2.43% 5.81% 6.92% 23.13%Contract VehiclesGSA Schedule 1.31% 1.57% 1.42% 23.13% 3.42% 3.74% 15.46% 23.13% 4.26% 4.45% 11.54% 23.13%IDIQs 12.72% 13.33% 5.96% 23.13% 18.72% 19.70% 35.35% 23.13% 27.99% 29.05% 33.15% 23.13%GSA STARS 0.11% 0.16% 0.00% 23.13% 0.10% 0.10% 0.00% 23.13% 0.07% 0.08% 0.00% 23.13%GSA VETS 0.04% 0.06% 0.00% 23.13% 0.02% 0.02% 0.00% 23.13% 0.01% 0.01% 0.00% 23.13%Top 5 NAICS FY09-FY10611430--Professional and Management Development Training 30.78% 28.31% 8.31% 14.31% 59.17% 58.89% 50.00% 89.79% 40.26% 52.53% 55.56% 36.93%541519--Other Computer Related Services 47.03% 53.58% 37.08% 19.83% 61.83% 60.96% 60.98% 58.33% 58.57% 61.39% 71.01% 52.45%541611--Administrative Management and General Management Consulting Services 27.82% 26.47% 107.30% 5.88% 57.02% 55.66% 60.00% 40.00% 40.58% 41.03% 54.55% 29.17%541511--Custom Computer Programming Services 38.41% 36.65% 24.22% 100.12% 54.85% 58.13% 63.16% 85.71% 58.69% 57.11% 66.67% 95.35%443120--Computer and Software Stores 31.74% 31.27% 19.52% 47.41% 66.67% 68.60% 63.89% 58.06% 33.06% 32.14% 66.67% 43.75%Notes: Green/Red streetlights indicate whether agency did or did not meet SBA negotiated SB dollar goal. A yellow background indicates conditions deteriorated year-over-year. A red box indicates lower shares than the corresponding, overall federal share.
Table 6.22: OFFICE OF PERSONNEL MANAGEMENT
Small Business Shares of Spending In . . . Small Business Shares of Companies In . . . Small Business Shares of Contract Transactions In . . .. . . Overall Federal Government . . . This Agency . . . Overall Federal Government . . . This Agency . . . Overall Federal Government . . . This Agency
Table B.19 Small Business Procurement Performance, Office of Personnel Management

Characteristics of Recent Federal Small Business Contracting 51
Small Business Goal: 67.0509%
FY 2009 FY 2010 YTD FY 2009 FY 2010 YTD FY 2009 FY 2010 YTD FY 2009 FY 2010 YTD FY 2009 FY 2010 YTD FY 2009 FY 2010 YTDSocioeconomicAll Small Businesses 21.28% 22.79% 84.50% 63.31% 81.62% 81.02% 54.05% 69.25% 50.04% 51.70% 9.86% 63.16%Small Disadv Businesses 6.84% 6.75% 28.80% 41.97% 5.47% 5.31% 10.81% 22.70% 7.86% 7.74% 1.88% 31.45%Woman-Owned Businesses 3.99% 4.48% 25.55% 20.30% 15.73% 16.06% 2.70% 17.82% 11.09% 11.48% 0.47% 14.47%HUBZone Businesses 2.75% 2.75% 10.39% 3.56% 3.12% 3.20% 2.70% 4.60% 3.36% 3.34% 0.47% 3.82%Svc Disabled Businesses 3.99% 4.48% 25.55% 20.30% 15.73% 16.06% 2.70% 17.82% 11.09% 11.48% 0.47% 14.47%CompanyNew SBs 9.71% 9.99% 2.22% 13.46% 24.47% 22.21% 10.00% 20.33% 7.09% 5.44% 9.52% 30.83%Lost SBs * 54.67% 30.44% 16.44% 0.01% 37.68% 3.28% 5.00% 0.41% 18.68% 7.89% 9.52% 0.21%Set-Aside ProgramsAll Set-Asides 10.34% 12.11% 12.85% 25.58% 39.40% 40.46% 5.41% 18.68% 13.52% 16.34% 0.94% 19.34%8(a) 7.97% 9.37% 2.46% 26.48% 6.71% 6.41% 2.70% 14.08% 5.32% 9.27% 0.47% 16.71%HUBZone 4.85% 6.26% 10.39% 4.09% 4.42% 4.08% 2.70% 2.59% 2.31% 6.18% 0.47% 2.37%Small Business 9.48% 12.14% 0.00% 5.24% 34.92% 37.37% 0.00% 7.18% 10.64% 16.95% 0.00% 6.05%SDB 4.23% 5.58% 0.00% 3.56% 3.53% 3.00% 0.00% 2.30% 1.97% 5.70% 0.00% 2.24%SDVOSB 4.87% 6.60% 0.00% 3.60% 5.23% 4.87% 0.00% 2.59% 2.52% 6.52% 0.00% 2.37%$3K - $100K 4.28% 5.60% 0.00% 3.96% 7.47% 3.98% 0.00% 3.16% 2.43% 5.81% 0.00% 2.89%Contract VehiclesGSA Schedule 1.31% 1.57% 0.00% 10.64% 3.42% 3.74% 2.70% 14.37% 4.26% 4.45% 0.47% 11.97%IDIQs 12.72% 13.33% 47.39% 30.46% 18.72% 19.70% 13.51% 24.43% 27.99% 29.05% 2.35% 33.55%GSA STARS 0.11% 0.16% 0.00% 0.43% 0.10% 0.10% 0.00% 0.29% 0.07% 0.08% 0.00% 0.26%GSA VETS 0.04% 0.06% 0.00% 0.00% 0.02% 0.02% 0.00% 0.00% 0.01% 0.01% 0.00% 0.00%Top 5 NAICS FY09-FY10541611--Administrative Management and General Management Consulting Services 27.82% 26.47% 5.41% 26.81% 57.02% 55.66% 50.00% 57.89% 40.58% 41.03% 33.33% 66.67%541519--Other Computer Related Services 47.03% 53.58% 0.00% 94.37% 61.83% 60.96% 0.00% 76.92% 58.57% 61.39% 0.00% 80.49%
-- 0.00% 31.55% 0.00% 99.32% 0.00% 65.58% 0.00% 75.00% 0.00% 54.98% 0.00% 81.82%541512--Computer Systems Design Services 23.22% 25.18% 100.00% 99.42% 56.03% 51.28% 100.00% 80.00% 49.07% 48.88% 100.00% 88.24%561450--Credit Bureaus 8.33% -1.68% 0.00% 0.00% 66.67% 50.00% 0.00% 0.00% 8.99% 9.02% 0.00% 0.00%
Table 6.23: SMALL BUSINESS ADMINISTRATION
Small Business Shares of Spending In . . . Small Business Shares of Companies In . . . Small Business Shares of Contract Transactions In . . .. . . This Agency
Notes: Green/Red streetlights indicate whether agency did or did not meet SBA negotiated SB dollar goal. A yellow background indicates conditions deteriorated year-over-year. A red box indicates lower shares than the corresponding, overall federal share.
. . . Overall Federal Government . . . This Agency . . . Overall Federal Government . . . This Agency . . . Overall Federal Government
Table B.20 Small Business Procurement Performance, Small Business Administration

Characteristics of Recent Federal Small Business Contracting 52
Small Business Goal: 49.6492%
FY 2009 FY 2010 YTD FY 2009 FY 2010 YTD FY 2009 FY 2010 YTD FY 2009 FY 2010 YTD FY 2009 FY 2010 YTD FY 2009 FY 2010 YTDSocioeconomicAll Small Businesses 21.28% 22.79% 21.14% 33.49% 81.62% 81.02% 49.65% 48.74% 50.04% 51.70% 36.51% 41.78%Small Disadv Businesses 6.84% 6.75% 5.29% 9.42% 5.47% 5.31% 8.39% 8.59% 7.86% 7.74% 7.36% 10.84%Woman-Owned Businesses 3.99% 4.48% 7.08% 13.08% 15.73% 16.06% 12.59% 10.86% 11.09% 11.48% 9.81% 9.83%HUBZone Businesses 2.75% 2.75% 0.01% 0.18% 3.12% 3.20% 1.40% 1.52% 3.36% 3.34% 1.09% 0.73%Svc Disabled Businesses 3.99% 4.48% 7.08% 13.08% 15.73% 16.06% 12.59% 10.86% 11.09% 11.48% 9.81% 9.83%CompanyNew SBs 9.71% 9.99% 16.81% 5.72% 24.47% 22.21% 15.49% 13.99% 7.09% 5.44% 10.45% 9.45%Lost SBs * 54.67% 30.44% 0.00% 0.09% 37.68% 3.28% 0.00% 0.52% 18.68% 7.89% 0.00% 0.22%Set-Aside ProgramsAll Set-Asides 10.34% 12.11% 2.70% 8.45% 39.40% 40.46% 6.29% 10.35% 13.52% 16.34% 3.54% 8.36%8(a) 7.97% 9.37% 2.71% 10.49% 6.71% 6.41% 4.90% 9.60% 5.32% 9.27% 3.00% 11.75%HUBZone 4.85% 6.26% 0.30% 3.43% 4.42% 4.08% 1.40% 6.06% 2.31% 6.18% 1.09% 6.80%Small Business 9.48% 12.14% 0.55% 3.86% 34.92% 37.37% 3.50% 11.11% 10.64% 16.95% 2.45% 9.37%SDB 4.23% 5.58% 0.00% 3.38% 3.53% 3.00% 0.00% 5.81% 1.97% 5.70% 0.00% 6.70%SDVOSB 4.87% 6.60% 0.30% 4.18% 5.23% 4.87% 1.40% 6.82% 2.52% 6.52% 1.09% 7.25%$3K - $100K 4.28% 5.60% 0.32% 3.38% 7.47% 3.98% 2.10% 5.81% 2.43% 5.81% 1.36% 6.70%Contract VehiclesGSA Schedule 1.31% 1.57% 9.51% 8.83% 3.42% 3.74% 15.38% 15.66% 4.26% 4.45% 15.53% 14.78%IDIQs 12.72% 13.33% 12.01% 27.83% 18.72% 19.70% 21.68% 23.48% 27.99% 29.05% 21.80% 27.64%GSA STARS 0.11% 0.16% 0.00% 0.50% 0.10% 0.10% 0.00% 0.76% 0.07% 0.08% 0.00% 0.28%GSA VETS 0.04% 0.06% 0.00% 0.00% 0.02% 0.02% 0.00% 0.00% 0.01% 0.01% 0.00% 0.00%Top 5 NAICS FY09-FY10541512--Computer Systems Design Services 23.22% 25.18% 1.23% 6.78% 56.03% 51.28% 12.50% 50.00% 49.07% 48.88% 19.35% 26.83%541519--Other Computer Related Services 47.03% 53.58% 46.76% 50.20% 61.83% 60.96% 50.00% 63.04% 58.57% 61.39% 60.00% 61.07%541611--Administrative Management and General Management Consulting Services 27.82% 26.47% 0.00% 89.38% 57.02% 55.66% 0.00% 51.72% 40.58% 41.03% 0.00% 70.24%541511--Custom Computer Programming Services 38.41% 36.65% 46.97% 96.78% 54.85% 58.13% 76.92% 88.89% 58.69% 57.11% 48.98% 92.31%443120--Computer and Software Stores 31.74% 31.27% 14.44% 31.67% 66.67% 68.60% 63.64% 47.37% 33.06% 32.14% 44.44% 51.85%Notes: Green/Red streetlights indicate whether agency did or did not meet SBA negotiated SB dollar goal. A yellow background indicates conditions deteriorated year-over-year. A red box indicates lower shares than the corresponding, overall federal share.
Table 6.24: SECURITIES AND EXCHANGE COMMISSION
Small Business Shares of Spending In . . . Small Business Shares of Companies In . . . Small Business Shares of Contract Transactions In . . .. . . Overall Federal Government . . . This Agency . . . Overall Federal Government . . . This Agency . . . Overall Federal Government . . . This Agency
Table B.21 Small Business Procurement Performance, Securities and Exchange Commission

Characteristics of Recent Federal Small Business Contracting 53
Small Business Goal: 57.0061%
FY 2009 FY 2010 YTD FY 2009 FY 2010 YTD FY 2009 FY 2010 YTD FY 2009 FY 2010 YTD FY 2009 FY 2010 YTD FY 2009 FY 2010 YTDSocioeconomicAll Small Businesses 21.28% 22.79% 55.26% 33.55% 81.62% 81.02% 59.11% 62.17% 50.04% 51.70% 66.14% 60.81%Small Disadv Businesses 6.84% 6.75% 27.55% 12.19% 5.47% 5.31% 14.29% 4.85% 7.86% 7.74% 35.92% 16.45%Woman-Owned Businesses 3.99% 4.48% 14.54% 7.25% 15.73% 16.06% 14.29% 18.69% 11.09% 11.48% 19.94% 16.84%HUBZone Businesses 2.75% 2.75% 7.82% 5.91% 3.12% 3.20% 2.96% 1.68% 3.36% 3.34% 12.18% 4.23%Svc Disabled Businesses 3.99% 4.48% 14.54% 7.25% 15.73% 16.06% 14.29% 18.69% 11.09% 11.48% 19.94% 16.84%CompanyNew SBs 9.71% 9.99% 1.84% 6.45% 24.47% 22.21% 10.00% 25.39% 7.09% 5.44% 2.87% 13.47%Lost SBs * 54.67% 30.44% 0.51% 0.82% 37.68% 3.28% 0.83% 1.56% 18.68% 7.89% 0.96% 1.02%Set-Aside ProgramsAll Set-Asides 10.34% 12.11% 16.05% 14.70% 39.40% 40.46% 11.33% 6.53% 13.52% 16.34% 14.08% 12.30%8(a) 7.97% 9.37% 13.20% 6.87% 6.71% 6.41% 8.37% 3.00% 5.32% 9.27% 8.86% 9.04%HUBZone 4.85% 6.26% 2.96% 1.94% 4.42% 4.08% 2.46% 1.68% 2.31% 6.18% 2.06% 1.47%Small Business 9.48% 12.14% 7.45% 11.48% 34.92% 37.37% 7.88% 6.70% 10.64% 16.95% 9.02% 5.78%SDB 4.23% 5.58% 0.00% 1.94% 3.53% 3.00% 0.00% 1.68% 1.97% 5.70% 0.00% 1.47%SDVOSB 4.87% 6.60% 2.96% 2.02% 5.23% 4.87% 2.46% 1.94% 2.52% 6.52% 2.06% 1.59%$3K - $100K 4.28% 5.60% 4.28% 2.08% 7.47% 3.98% 2.96% 1.85% 2.43% 5.81% 2.37% 1.71%Contract VehiclesGSA Schedule 1.31% 1.57% 0.14% 1.39% 3.42% 3.74% 0.99% 3.35% 4.26% 4.45% 0.47% 1.94%IDIQs 12.72% 13.33% 23.92% 18.92% 18.72% 19.70% 26.11% 9.17% 27.99% 29.05% 43.35% 21.19%GSA STARS 0.11% 0.16% 0.00% 0.00% 0.10% 0.10% 0.00% 0.00% 0.07% 0.08% 0.00% 0.00%GSA VETS 0.04% 0.06% 0.00% 0.00% 0.02% 0.02% 0.00% 0.00% 0.01% 0.01% 0.00% 0.00%Top 5 NAICS FY09-FY10236220--Commercial and Institutional Building Construction 35.67% 41.24% 78.48% 33.28% 63.06% 62.39% 82.86% 69.57% 77.41% 75.06% 91.05% 89.10%541310--Architectural Services 26.95% 26.49% 6.26% 9.07% 47.47% 51.11% 31.58% 38.10% 53.77% 48.15% 15.58% 26.32%
541330--Engineering Services 15.77% 17.80% 0.00% 4.57% 54.39% 52.91% 0.00% 54.55% 33.33% 33.37% 0.00% 21.05%541511--Custom Computer Programming Services 38.41% 36.65% 53.19% 46.90% 54.85% 58.13% 75.00% 63.16% 58.69% 57.11% 57.14% 49.25%541512--Computer Systems Design Services 23.22% 25.18% 100.00% 91.85% 56.03% 51.28% 100.00% 75.00% 49.07% 48.88% 100.00% 76.92%Notes: Green/Red streetlights indicate whether agency did or did not meet SBA negotiated SB dollar goal. A yellow background indicates conditions deteriorated year-over-year. A red box indicates lower shares than the corresponding, overall federal share.
Table 6.25: SMITHSONIAN INSTITUTION
Small Business Shares of Spending In . . . Small Business Shares of Companies In . . . Small Business Shares of Contract Transactions In . . .. . . Overall Federal Government . . . This Agency . . . Overall Federal Government . . . This Agency . . . Overall Federal Government . . . This Agency
Table B.22 Small Business Procurement Performance, Smithsonian Institution

Characteristics of Recent Federal Small Business Contracting 54
Small Business Goal: 36.7023%
FY 2009 FY 2010 YTD FY 2009 FY 2010 YTD FY 2009 FY 2010 YTD FY 2009 FY 2010 YTD FY 2009 FY 2010 YTD FY 2009 FY 2010 YTDSocioeconomicAll Small Businesses 21.28% 22.79% 15.46% 40.90% 81.62% 81.02% 55.89% 76.29% 50.04% 51.70% 57.73% 56.73%Small Disadv Businesses 6.84% 6.75% 5.36% 19.04% 5.47% 5.31% 8.37% 8.23% 7.86% 7.74% 12.54% 9.67%Woman-Owned Businesses 3.99% 4.48% 3.27% 5.51% 15.73% 16.06% 12.17% 16.39% 11.09% 11.48% 11.86% 12.08%HUBZone Businesses 2.75% 2.75% 1.08% 2.22% 3.12% 3.20% 3.80% 3.07% 3.36% 3.34% 6.53% 2.09%Svc Disabled Businesses 3.99% 4.48% 3.27% 5.51% 15.73% 16.06% 12.17% 16.39% 11.09% 11.48% 11.86% 12.08%CompanyNew SBs 9.71% 9.99% 7.71% 7.79% 24.47% 22.21% 13.61% 15.41% 7.09% 5.44% 10.12% 9.44%Lost SBs * 54.67% 30.44% 0.02% 0.13% 37.68% 3.28% 1.36% 0.34% 18.68% 7.89% 0.60% 0.18%Set-Aside ProgramsAll Set-Asides 10.34% 12.11% 6.72% 21.92% 39.40% 40.46% 13.31% 35.79% 13.52% 16.34% 17.87% 28.91%8(a) 7.97% 9.37% 6.62% 12.64% 6.71% 6.41% 8.37% 11.23% 5.32% 9.27% 13.06% 11.98%HUBZone 4.85% 6.26% 0.27% 5.29% 4.42% 4.08% 3.42% 8.03% 2.31% 6.18% 2.41% 7.57%Small Business 9.48% 12.14% 0.65% 11.70% 34.92% 37.37% 11.03% 36.90% 10.64% 16.95% 8.76% 29.91%SDB 4.23% 5.58% 0.00% 3.83% 3.53% 3.00% 0.00% 7.05% 1.97% 5.70% 0.00% 7.07%SDVOSB 4.87% 6.60% 0.27% 7.48% 5.23% 4.87% 4.18% 7.58% 2.52% 6.52% 3.09% 7.67%$3K - $100K 4.28% 5.60% 0.27% 3.95% 7.47% 3.98% 3.42% 7.12% 2.43% 5.81% 2.41% 7.11%Contract VehiclesGSA Schedule 1.31% 1.57% 2.93% 3.55% 3.42% 3.74% 7.22% 14.44% 4.26% 4.45% 5.33% 8.79%IDIQs 12.72% 13.33% 8.62% 34.68% 18.72% 19.70% 32.70% 53.36% 27.99% 29.05% 30.76% 45.27%GSA STARS 0.11% 0.16% 0.00% 0.43% 0.10% 0.10% 0.00% 0.07% 0.07% 0.08% 0.00% 0.18%GSA VETS 0.04% 0.06% 0.00% 0.00% 0.02% 0.02% 0.00% 0.00% 0.01% 0.01% 0.00% 0.00%Top 5 NAICS FY09-FY10541519--Other Computer Related Services 47.03% 53.58% 44.56% 70.66% 61.83% 60.96% 64.29% 70.27% 58.57% 61.39% 33.33% 68.12%443120--Computer and Software Stores 31.74% 31.27% -0.71% 22.21% 66.67% 68.60% 33.33% 54.76% 33.06% 32.14% 15.79% 42.54%334111--Electronic Computer Manufacturing 28.75% 30.33% 0.00% 5.73% 63.95% 64.94% 12.50% 52.17% 36.76% 37.62% 7.14% 18.61%511210--Software Publishers 35.94% 34.73% 10.00% 62.34% 53.49% 55.08% 33.33% 60.00% 46.63% 47.46% 40.00% 56.19%423430--Computer and Computer Peripheral Equipment and Software Merchant Wholesalers 34.05% 42.70% 0.19% 18.97% 66.18% 60.13% 50.00% 64.71% 53.57% 56.99% 8.33% 24.24%Notes: Green/Red streetlights indicate whether agency did or did not meet SBA negotiated SB dollar goal. A yellow background indicates conditions deteriorated year-over-year. A red box indicates lower shares than the corresponding, overall federal share.
Table 6.26: SOCIAL SECURITY ADMINISTRATION
Small Business Shares of Spending In . . . Small Business Shares of Companies In . . . Small Business Shares of Contract Transactions In . . .. . . Overall Federal Government . . . This Agency . . . Overall Federal Government . . . This Agency . . . Overall Federal Government . . . This Agency
Table B.23 Small Business Procurement Performance, Social Security Administration

Characteristics of Recent Federal Small Business Contracting 55
Small Business Goal: 37.0000%
FY 2009 FY 2010 YTD FY 2009 FY 2010 YTD FY 2009 FY 2010 YTD FY 2009 FY 2010 YTD FY 2009 FY 2010 YTD FY 2009 FY 2010 YTDSocioeconomicAll Small Businesses 21.28% 22.79% 21.16% 40.88% 81.62% 81.02% 43.19% 57.23% 50.04% 51.70% 34.53% 44.48%Small Disadv Businesses 6.84% 6.75% 5.34% 17.25% 5.47% 5.31% 4.29% 6.35% 7.86% 7.74% 4.15% 10.83%Woman-Owned Businesses 3.99% 4.48% 13.32% 7.93% 15.73% 16.06% 23.18% 19.64% 11.09% 11.48% 19.93% 13.84%HUBZone Businesses 2.75% 2.75% 1.53% 4.60% 3.12% 3.20% 1.68% 1.95% 3.36% 3.34% 1.43% 2.47%Svc Disabled Businesses 3.99% 4.48% 13.32% 7.93% 15.73% 16.06% 23.18% 19.64% 11.09% 11.48% 19.93% 13.84%CompanyNew SBs 9.71% 9.99% 9.01% 8.16% 24.47% 22.21% 18.56% 11.46% 7.09% 5.44% 20.22% 6.37%Lost SBs * 54.67% 30.44% 0.50% 1.35% 37.68% 3.28% 2.88% 1.19% 18.68% 7.89% 2.83% 0.94%Set-Aside ProgramsAll Set-Asides 10.34% 12.11% 6.27% 17.88% 39.40% 40.46% 17.28% 19.36% 13.52% 16.34% 10.79% 12.27%8(a) 7.97% 9.37% 7.01% 13.99% 6.71% 6.41% 1.86% 8.55% 5.32% 9.27% 1.09% 10.16%HUBZone 4.85% 6.26% 6.85% 5.63% 4.42% 4.08% 1.62% 6.02% 2.31% 6.18% 1.07% 6.18%Small Business 9.48% 12.14% 12.02% 11.35% 34.92% 37.37% 17.96% 21.51% 10.64% 16.95% 11.38% 12.65%SDB 4.23% 5.58% 0.00% 4.54% 3.53% 3.00% 0.00% 5.77% 1.97% 5.70% 0.00% 5.78%SDVOSB 4.87% 6.60% 6.54% 5.03% 5.23% 4.87% 1.43% 6.20% 2.52% 6.52% 0.92% 6.33%$3K - $100K 4.28% 5.60% 6.54% 4.57% 7.47% 3.98% 1.43% 6.07% 2.43% 5.81% 0.92% 5.85%Contract VehiclesGSA Schedule 1.31% 1.57% 3.03% 3.11% 3.42% 3.74% 8.39% 11.01% 4.26% 4.45% 4.46% 6.64%IDIQs 12.72% 13.33% 19.23% 31.39% 18.72% 19.70% 36.23% 34.80% 27.99% 29.05% 29.72% 32.51%GSA STARS 0.11% 0.16% 0.08% 0.40% 0.10% 0.10% 0.12% 0.20% 0.07% 0.08% 0.04% 0.28%GSA VETS 0.04% 0.06% 0.00% 0.00% 0.02% 0.02% 0.00% 0.00% 0.01% 0.01% 0.00% 0.00%Top 5 NAICS FY09-FY10541519--Other Computer Related Services 47.03% 53.58% 88.61% 73.16% 61.83% 60.96% 71.43% 70.29% 58.57% 61.39% 62.04% 60.84%541611--Administrative Management and General Management Consulting Services 27.82% 26.47% 31.61% 23.13% 57.02% 55.66% 52.38% 52.59% 40.58% 41.03% 29.90% 21.04%336411--Aircraft Manufacturing 2.58% 2.96% 0.00% 19.95% 51.61% 54.55% 0.00% 40.00% 46.73% 43.73% 0.00% 14.29%511210--Software Publishers 35.94% 34.73% 50.47% 5.20% 53.49% 55.08% 12.50% 42.86% 46.63% 47.46% 20.00% 35.71%561210--Facilities Support Services 16.10% 65.24% 5.83% 61.55% 60.84% 68.29% 60.00% 42.86% 61.76% 79.86% 57.14% 45.83%
Table 6.27: STATE DEPARTMENT
Small Business Shares of Spending In . . . Small Business Shares of Companies In . . . Small Business Shares of Contract Transactions In . . .. . . This Agency
Notes: Green/Red streetlights indicate whether agency did or did not meet SBA negotiated SB dollar goal. A yellow background indicates conditions deteriorated year-over-year. A red box indicates lower shares than the corresponding, overall federal share.
. . . Overall Federal Government . . . This Agency . . . Overall Federal Government . . . This Agency . . . Overall Federal Government
Table B.24 Small Business Procurement Performance, State Department

Characteristics of Recent Federal Small Business Contracting 56
Small Business Goal: 29.3895%
FY 2009 FY 2010 YTD FY 2009 FY 2010 YTD FY 2009 FY 2010 YTD FY 2009 FY 2010 YTD FY 2009 FY 2010 YTD FY 2009 FY 2010 YTDSocioeconomicAll Small Businesses 21.28% 22.79% 29.59% 32.81% 81.62% 81.02% 73.30% 74.13% 50.04% 51.70% 51.05% 52.83%Small Disadv Businesses 6.84% 6.75% 10.27% 10.36% 5.47% 5.31% 8.18% 8.29% 7.86% 7.74% 5.64% 6.75%Woman-Owned Businesses 3.99% 4.48% 9.33% 9.50% 15.73% 16.06% 16.34% 17.58% 11.09% 11.48% 14.40% 15.17%HUBZone Businesses 2.75% 2.75% 1.96% 2.36% 3.12% 3.20% 2.47% 2.24% 3.36% 3.34% 2.16% 2.00%Svc Disabled Businesses 3.99% 4.48% 9.33% 9.50% 15.73% 16.06% 16.34% 17.58% 11.09% 11.48% 14.40% 15.17%CompanyNew SBs 9.71% 9.99% 6.43% 13.03% 24.47% 22.21% 12.96% 14.02% 7.09% 5.44% 7.02% 7.95%Lost SBs * 54.67% 30.44% 0.18% 4.93% 37.68% 3.28% 0.88% 0.51% 18.68% 7.89% 1.46% 1.50%Set-Aside ProgramsAll Set-Asides 10.34% 12.11% 7.24% 12.38% 39.40% 40.46% 10.89% 13.27% 13.52% 16.34% 5.18% 7.81%8(a) 7.97% 9.37% 8.30% 19.23% 6.71% 6.41% 6.25% 8.98% 5.32% 9.27% 3.62% 10.97%HUBZone 4.85% 6.26% 3.67% 12.98% 4.42% 4.08% 2.79% 4.24% 2.31% 6.18% 1.39% 7.17%Small Business 9.48% 12.14% 3.85% 15.49% 34.92% 37.37% 5.47% 10.32% 10.64% 16.95% 2.40% 9.87%SDB 4.23% 5.58% 0.00% 12.27% 3.53% 3.00% 0.00% 3.93% 1.97% 5.70% 0.00% 7.03%SDVOSB 4.87% 6.60% 3.29% 13.76% 5.23% 4.87% 3.54% 4.88% 2.52% 6.52% 1.75% 7.58%$3K - $100K 4.28% 5.60% 3.05% 12.29% 7.47% 3.98% 4.11% 4.83% 2.43% 5.81% 1.77% 7.36%Contract VehiclesGSA Schedule 1.31% 1.57% 11.04% 11.81% 3.42% 3.74% 11.46% 11.64% 4.26% 4.45% 10.12% 9.70%IDIQs 12.72% 13.33% 20.10% 22.75% 18.72% 19.70% 20.82% 20.92% 27.99% 29.05% 21.06% 19.91%GSA STARS 0.11% 0.16% 2.19% 2.10% 0.10% 0.10% 0.48% 0.40% 0.07% 0.08% 0.40% 0.48%GSA VETS 0.04% 0.06% 0.00% 0.00% 0.02% 0.02% 0.00% 0.00% 0.01% 0.01% 0.00% 0.00%Top 5 NAICS FY09-FY10541512--Computer Systems Design Services 23.22% 25.18% 12.25% 10.42% 56.03% 51.28% 57.58% 45.90% 49.07% 48.88% 26.77% 18.52%541519--Other Computer Related Services 47.03% 53.58% 50.38% 51.62% 61.83% 60.96% 74.30% 73.85% 58.57% 61.39% 47.33% 50.43%541611--Administrative Management and General Management Consulting Services 27.82% 26.47% 18.92% 29.78% 57.02% 55.66% 66.13% 66.43% 40.58% 41.03% 53.38% 49.70%443120--Computer and Software Stores 31.74% 31.27% 54.08% 71.16% 66.67% 68.60% 64.84% 66.29% 33.06% 32.14% 61.34% 65.89%541511--Custom Computer Programming Services 38.41% 36.65% 54.25% 62.69% 54.85% 58.13% 79.45% 78.57% 58.69% 57.11% 70.65% 71.43%
Table 6.28: DEPARTMENT OF THE TREASURY
Small Business Shares of Spending In . . . Small Business Shares of Companies In . . . Small Business Shares of Contract Transactions In . . .. . . This Agency
Notes: Green/Red streetlights indicate whether agency did or did not meet SBA negotiated SB dollar goal. A yellow background indicates conditions deteriorated year-over-year. A red box indicates lower shares than the corresponding, overall federal share.
. . . Overall Federal Government . . . This Agency . . . Overall Federal Government . . . This Agency . . . Overall Federal Government
Table B.25 Small Business Procurement Performance, Department of the Treasury

Characteristics of Recent Federal Small Business Contracting 57
Small Business Goal: 43.9784%
FY 2009 FY 2010 YTD FY 2009 FY 2010 YTD FY 2009 FY 2010 YTD FY 2009 FY 2010 YTD FY 2009 FY 2010 YTD FY 2009 FY 2010 YTDSocioeconomicAll Small Businesses 21.28% 22.79% 82.90% 41.60% 81.62% 81.02% 74.55% 64.05% 50.04% 51.70% 74.39% 66.13%Small Disadv Businesses 6.84% 6.75% 55.89% 1.37% 5.47% 5.31% 0.91% 1.65% 7.86% 7.74% 2.46% 0.80%Woman-Owned Businesses 3.99% 4.48% 8.78% 11.35% 15.73% 16.06% 28.18% 21.90% 11.09% 11.48% 25.96% 20.85%HUBZone Businesses 2.75% 2.75% 0.00% 0.00% 3.12% 3.20% 0.00% 0.21% 3.36% 3.34% 0.00% 0.08%Svc Disabled Businesses 3.99% 4.48% 8.78% 11.35% 15.73% 16.06% 28.18% 21.90% 11.09% 11.48% 25.96% 20.85%CompanyNew SBs 9.71% 9.99% 24.18% 30.89% 24.47% 22.21% 76.83% 35.16% 7.09% 5.44% 59.91% 28.99%Lost SBs * 54.67% 30.44% 0.00% 3.44% 37.68% 3.28% 0.00% 2.90% 18.68% 7.89% 0.00% 2.29%Set-Aside ProgramsAll Set-Asides 10.34% 12.11% 0.00% 1.50% 39.40% 40.46% 0.91% 3.51% 13.52% 16.34% 3.16% 2.08%8(a) 7.97% 9.37% 0.12% 2.76% 6.71% 6.41% 1.82% 1.86% 5.32% 9.27% 1.05% 1.28%HUBZone 4.85% 6.26% 0.12% 2.37% 4.42% 4.08% 1.82% 1.65% 2.31% 6.18% 1.05% 1.04%Small Business 9.48% 12.14% 0.12% 3.49% 34.92% 37.37% 2.73% 4.96% 10.64% 16.95% 4.21% 2.88%SDB 4.23% 5.58% 0.00% 2.37% 3.53% 3.00% 0.00% 1.65% 1.97% 5.70% 0.00% 1.04%SDVOSB 4.87% 6.60% 0.12% 2.37% 5.23% 4.87% 1.82% 1.65% 2.52% 6.52% 1.05% 1.04%$3K - $100K 4.28% 5.60% 0.12% 2.37% 7.47% 3.98% 1.82% 1.65% 2.43% 5.81% 1.05% 1.04%Contract VehiclesGSA Schedule 1.31% 1.57% 0.12% 3.42% 3.42% 3.74% 1.82% 2.89% 4.26% 4.45% 1.05% 1.28%IDIQs 12.72% 13.33% 65.42% 20.87% 18.72% 19.70% 40.91% 41.12% 27.99% 29.05% 36.14% 42.25%GSA STARS 0.11% 0.16% 0.00% 0.00% 0.10% 0.10% 0.00% 0.00% 0.07% 0.08% 0.00% 0.00%GSA VETS 0.04% 0.06% 0.00% 0.00% 0.02% 0.02% 0.00% 0.00% 0.01% 0.01% 0.00% 0.00%Top 5 NAICS FY09-FY10517410--Satellite Telecommunications 35.76% 32.21% 100.00% 2.32% 62.50% 59.70% 100.00% 40.00% 40.69% 39.45% 100.00% 37.50%515120--Television Broadcasting 59.21% 78.12% 76.75% 89.28% 44.74% 53.13% 80.00% 78.69% 56.93% 53.62% 76.47% 83.48%561499--All Other Business Support Services 7.83% 13.50% 85.42% 95.86% 51.33% 51.75% 86.67% 88.10% 58.64% 34.65% 87.88% 92.24%711510--Independent Artists, Writers, and Performers 77.58% 15.30% 77.04% 5.65% 67.69% 62.86% 76.92% 21.43% 87.27% 48.51% 69.23% 25.00%334220--Radio and Television Broadcasting and Wireless Communications Equipment Manufacturing 17.04% 84.96% 100.00% 82.96% 61.32% 75.41% 100.00% 72.86% 46.27% 87.14% 100.00% 78.79%Notes: Green/Red streetlights indicate whether agency did or did not meet SBA negotiated SB dollar goal. A yellow background indicates conditions deteriorated year-over-year. A red box indicates lower shares than the corresponding, overall federal share.
Table 6.29: U.S. INFORMATION AGENCY
Small Business Shares of Spending In . . . Small Business Shares of Companies In . . . Small Business Shares of Contract Transactions In . . .. . . Overall Federal Government . . . This Agency . . . Overall Federal Government . . . This Agency . . . Overall Federal Government . . . This Agency
Table B.26 Small Business Procurement Performance, U.S. Information Agency

Characteristics of Recent Federal Small Business Contracting 58
Small Business Goal: 49.8762%
FY 2009 FY 2010 YTD FY 2009 FY 2010 YTD FY 2009 FY 2010 YTD FY 2009 FY 2010 YTD FY 2009 FY 2010 YTD FY 2009 FY 2010 YTDSocioeconomicAll Small Businesses 21.28% 22.79% 45.46% 54.67% 81.62% 81.02% 76.16% 83.43% 50.04% 51.70% 64.92% 75.60%Small Disadv Businesses 6.84% 6.75% 6.23% 11.55% 5.47% 5.31% 8.79% 5.95% 7.86% 7.74% 11.72% 10.09%Woman-Owned Businesses 3.99% 4.48% 4.30% 7.94% 15.73% 16.06% 14.23% 14.87% 11.09% 11.48% 14.03% 14.16%HUBZone Businesses 2.75% 2.75% 5.37% 9.85% 3.12% 3.20% 4.95% 6.74% 3.36% 3.34% 5.10% 8.93%Svc Disabled Businesses 3.99% 4.48% 4.30% 7.94% 15.73% 16.06% 14.23% 14.87% 11.09% 11.48% 14.03% 14.16%CompanyNew SBs 9.71% 9.99% 11.40% 9.46% 24.47% 22.21% 17.76% 22.63% 7.09% 5.44% 11.29% 12.97%Lost SBs * 54.67% 30.44% 3.67% 3.47% 37.68% 3.28% 0.67% 0.54% 18.68% 7.89% 1.18% 0.45%Set-Aside ProgramsAll Set-Asides 10.34% 12.11% 10.88% 24.90% 39.40% 40.46% 21.75% 38.74% 13.52% 16.34% 16.30% 33.15%8(a) 7.97% 9.37% 2.64% 8.31% 6.71% 6.41% 5.41% 4.96% 5.32% 9.27% 4.90% 6.73%HUBZone 4.85% 6.26% 0.96% 4.56% 4.42% 4.08% 1.76% 4.06% 2.31% 6.18% 0.99% 4.09%Small Business 9.48% 12.14% 7.25% 14.39% 34.92% 37.37% 13.91% 32.63% 10.64% 16.95% 8.08% 24.67%SDB 4.23% 5.58% 0.00% 1.14% 3.53% 3.00% 0.00% 1.38% 1.97% 5.70% 0.00% 1.37%SDVOSB 4.87% 6.60% 0.39% 2.14% 5.23% 4.87% 1.33% 2.40% 2.52% 6.52% 1.00% 2.26%$3K - $100K 4.28% 5.60% 0.26% 1.16% 7.47% 3.98% 2.71% 2.15% 2.43% 5.81% 1.12% 1.74%Contract VehiclesGSA Schedule 1.31% 1.57% 1.76% 3.69% 3.42% 3.74% 7.90% 4.35% 4.26% 4.45% 6.57% 4.54%IDIQs 12.72% 13.33% 11.29% 15.71% 18.72% 19.70% 23.27% 18.89% 27.99% 29.05% 30.01% 27.68%GSA STARS 0.11% 0.16% 0.89% 0.86% 0.10% 0.10% 0.54% 0.16% 0.07% 0.08% 1.51% 0.44%GSA VETS 0.04% 0.06% 0.16% 0.06% 0.02% 0.02% 0.08% 0.03% 0.01% 0.01% 0.06% 0.02%Top 5 NAICS FY09-FY10311611--Animal (except Poultry) Slaughtering 28.84% 33.72% 54.56% 62.15% 62.50% 60.00% 62.07% 65.85% 51.95% 52.73% 60.61% 65.15%311421--Fruit and Vegetable Canning 40.66% 56.42% 40.89% 49.40% 57.14% 71.43% 76.47% 76.27% 69.39% 67.77% 62.35% 63.10%311615--Poultry Processing 6.39% 2.60% 6.32% 2.51% 66.67% 80.00% 36.00% 24.32% 25.17% 15.84% 20.00% 10.63%311513--Cheese Manufacturing 22.69% 31.42% 23.38% 31.28% 50.00% 50.00% 41.67% 40.00% 41.41% 46.58% 40.79% 39.30%424510--Grain and Field Bean Merchant Wholesalers 4.43% 6.48% 100.00% 12.53% 72.73% 90.91% 100.00% 76.47% 32.41% 52.86% 100.00% 61.90%
Table 6.30: U.S. DEPARTMENT OF AGRICULTURE
Small Business Shares of Spending In . . . Small Business Shares of Companies In . . . Small Business Shares of Contract Transactions In . . .. . . This Agency
Notes: Green/Red streetlights indicate whether agency did or did not meet SBA negotiated SB dollar goal. A yellow background indicates conditions deteriorated year-over-year. A red box indicates lower shares than the corresponding, overall federal share.
. . . Overall Federal Government . . . This Agency . . . Overall Federal Government . . . This Agency . . . Overall Federal Government
Table B.27 Small Business Procurement Performance, Department of Agriculture